

Supplemental Digital Content is available in the text.
Keywords: blood pressure, calcium, endothelial cells, hypertension, phenylephrine
Abstract
Endothelial cells line all blood vessels and are critical regulators of vascular tone. In hypertension, disruption of endothelial function alters the release of endothelial-derived vasoactive factors and results in increased vascular tone. Although the release of endothelial-derived vasodilators occurs in a Ca2+-dependent manner, little is known on how Ca2+ signaling is altered in hypertension. A key element to endothelial control of vascular tone is Ca2+ signals at specialized regions (myoendothelial projections) that connect endothelial cells and smooth muscle cells. This work describes disruption in the operation of this key Ca2+ signaling pathway in hypertension. We show that vascular reactivity to phenylephrine is increased in hypertensive (spontaneously hypertensive rat) when compared with normotensive (Wistar Kyoto) rats. Basal endothelial Ca2+ activity limits vascular contraction, but that Ca2+-dependent control is impaired in hypertension. When changes in endothelial Ca2+ levels are buffered, vascular contraction to phenylephrine increased, resulting in similar responses in normotension and hypertension. Local endothelial IP3(inositol trisphosphate)-mediated Ca2+ signals are smaller in amplitude, shorter in duration, occur less frequently, and arise from fewer sites in hypertension. Spatial control of endothelial Ca2+ signaling is also disrupted in hypertension: local Ca2+ signals occur further from myoendothelial projections in hypertension. The results demonstrate that the organization of local Ca2+ signaling circuits occurring at myoendothelial projections is disrupted in hypertension, giving rise to increased contractile responses.
Hypertension is a chronic condition that contributes to the development of numerous cardiovascular diseases, including heart failure, vascular dementia, and stroke. As raised blood pressure levels lead to 7.6 million premature deaths each year (≈13.5% of the global total),1 hypertension contributes to worldwide morbidity and mortality more than any other risk factor. Although increased blood pressure levels are positively and continuously related to increasing cardiovascular risk, the precise mechanisms that lead from hypertension to ill health are poorly understood. One reason for this poor understanding is that the pathophysiology of hypertension is complex, with contributions from the sympathetic nervous system, the renin-angiotensin-aldosterone system, and the immune system each implicated in its cause.2–5 Notwithstanding, the adverse effects of hypertension are mediated by changes in the structure and function of the artery wall.6–8 Functional changes, in the form of altered vascular reactivity, occur at the earliest stages of hypertension and contribute to the development and reinforcement of the condition. However, the precise mechanisms contributing to altered vascular reactivity are not well understood.
In healthy blood vessels, the endothelial cell lining of blood vessels (the endothelium) controls vascular reactivity (and hence blood pressure) by releasing paracrine signaling molecules, such as nitric oxide (NO) and prostacyclin. The activation of endothelial potassium channels may also initiate a hyperpolarization of the plasma membrane that spreads to neighboring smooth muscle cells.9 These endothelial signaling pathways normally act to attenuate vascular contraction or promote vasodilation or both,10–15 but their action is diminished in several cardiovascular pathophysiologies. The reduced modulatory influence—termed endothelial dysfunction—is, at least in part, responsible for dysfunctional vascular responses (increased contractile and decreased dilator responses), which accompany and aggravate chronic elevations in blood pressure.16,17
The production of endothelial-derived vasoactive factors and activation of endothelial potassium channels require elevations in intracellular Ca2+ levels. Disruption of endothelial Ca2+ signaling may thus lead to dysfunctional vascular responses. However, little is known on the regulation of endothelial Ca2+ signaling in hypertension. In cell culture models, agonist-evoked endothelial Ca2+ responses throughout the cells may increase,16 decrease,18,19 or be unaltered9,17 in hypertension. Muscarinic receptor–mediated, global Ca2+ signals are similar in native endothelial cells of hypertensive and normotensive mice.20 However, local signals arising from TRPV4 (transient receptor potential vanilloid 4)-mediated Ca2+ influx are reduced.20 This latter observation demonstrates that disruption of local Ca2+ signaling circuits, rather than global increases in Ca2+, may contribute to endothelial dysfunction in hypertension.20
Endothelial IP3(inositol trisphosphate) receptors play an essential role in regulating blood pressure.21,22 Indeed, most physiological endothelial cell stimuli exert their effects by triggering the production of IP3. Once produced, IP3 binds to IP3Rs (IP3 receptors) to cause the release of Ca2+ from intracellular stores. Localized IP3-mediated Ca2+ activity occurs spontaneously in unstimulated endothelium23 and is amplified by extracellular agonists to limit basal and activated smooth muscle tone.24 Of particular significance in endothelial control of vascular tone are Ca2+ signals that occur preferentially at sites where endothelial cells protrude through the internal elastic lamina (IEL) and contact smooth muscle cells (myoendothelial projections, MEPs).23 MEPs are packed with Ca2+-activated effector proteins, including eNOS (endothelial NO synthase)18 and the small and intermediate conductance Ca2+-sensitive potassium channels,19 creating pivotal microdomains that are critical to the regulation of vascular function. Yet, it is unknown if local IP3-mediated Ca2+ signaling at MEPs is altered in hypertension.
Here, we investigated whether disruption of local, IP3-mediated, endothelial Ca2+ signaling is responsible for the hypercontractile smooth muscle cell responses that occur in hypertension. A novel technique was used to simultaneously assess the vascular contractile state and endothelial Ca2+ levels in intact small mesenteric arteries. We show that basal IP3-mediated endothelial Ca2+ signaling opposes vascular tone in arteries from normotensive (Wistar Kyoto; WKY) and hypertensive rats (spontaneously hypertensive rat; SHR). However, the extent to which endothelial Ca2+ signaling limits vascular tone is significantly reduced in hypertension. We also found that the occurrence and amplitude of local IP3-mediated Ca2+ signaling events are reduced in hypertension. Significantly, the distance between local Ca2+ signals and MEPs is increased. Together, these results suggest disruption of local IP3-mediated Ca2+ signaling at MEPs explains the impaired endothelial control of vascular tone and the increased contractile state of vascular smooth muscle in hypertension.
Materials and Methods
The data that support the findings of this study are available from the corresponding authors on reasonable request.
Animal Model of Hypertension
All animal care and experimental procedures were conducted in accordance with relevant guidelines and regulations with the approval of the University of Strathclyde Local Ethical Review Panel, under UK Home Office regulations (Animals [Scientific Procedures] Act 1986, United Kingdom). Eight- to 10-week-old male SHR (n=16) and WKY (n=16) rats purchased from Envigo (United Kingdom) were housed in pairs (with a reversed 12-hour light/dark cycle) and allowed ad libitum access to standard rat chow and water. The animals were housed 3 per cage, and the cage type was North Kent Plastic model RC2F with nesting material Sizzle Nest. A 12:12 light/dark cycle was used with a temperature range of 19 to 23°C (set point 21°C) and humidity levels between 45% and 65%. Animals had free access to freshwater and SDS diet RM1 (rodent maintenance). The enrichment in the cages was aspen wood chew sticks and hanging huts. Male rats are a widely-used experimental model of hypertension with a wealth of background information to aid interpretation of results. All animals were acclimatized for a 1-week period. After the acclimatization period, blood pressure readings were taken twice a week over a 3-week period by tail-cuff plethysmography. Mean blood pressure in normotensive (WKY) rats was 122±3 mm Hg, whereas that in hypertensive rats (SHR) was 173±6 mm Hg. All rats were euthanized by cervical dislocation at 10 to 12 weeks of age (250–350 g). Controls and experimental treatments were performed in the same tissue, so blinding and randomization were not used.
En Face Artery Preparation
Immediately following euthanasia, the mesenteric bed was removed and placed in physiological saline solution composed (in mM) of 145 NaCl, 4.7 KCl, 2.0 (3-[N-morpholino]propanesulfonic acid (MOPS)), 1.2 NaH2PO4, 5.0 glucose, 2.0 pyruvate, 0.02 EDTA, 1.17 MgCl2, 2.0 CaCl2, adjusted to pH 7.4 with NaOH. Second- or third-order mesenteric arteries (<250 μm outer diameter) were then cleaned of connective tissue and fat, removed from the mesenteric bed, cut open using microscissors and pinned endothelial side up either (1) on the Sylgard-coated base of a custom microscope chamber designed for use on an upright microscope or (2) on a Sylgard block that was subsequently inverted and placed in a custom chamber designed for use on an inverted microscope.25–27 Endothelial cells, which lie parallel to the longitudinal axis of the artery, were loaded with the fluorescent Ca2+ indicator, Cal-520/AM (5 µmol/L with 0.04% Pluronic F127 and 0.26% dimethyl sulfoxide [DMSO] in physiological saline solution [PSS]) at 37°C for 30 minutes. After incubation, preparations were gently washed in PSS and mounted on a microscope for imaging. Smooth muscle cells, which lie underneath and perpendicular to endothelial cells, were not significantly loaded with Cal-520/AM, as indicated by an absence of fluorescence signal arising from the staining of cells lying perpendicular to the longitudinal axis of the artery.
Assessment of Vascular Reactivity
Intact arteries, pinned on a Sylgard base of a custom chamber, were gently stretched to ≈1.5× resting width to prevent intimal folding. Pinning was restricted to the outermost corners. When applied to mesenteric arteries, this level of stretch results is equivalent to that induced by a transmural pressure of 80 mm Hg.28,29 The central region of the artery was not pinned to allow contraction to occur freely. An upright fluorescence microscope (FN-1; Nikon, Tokyo, Japan) was used to image the endothelium. Cal-520/AM was excited with 488-nm light using a wide-field epifluorescence light-emitting diode (LED) illumination system (pE-4000; CoolLED, Andover, United Kingdom), and fluorescence emission was imaged at 10 Hz using a ×16 objective lens (0.8 numerical aperture [NA]; Nikon, Tokyo, Japan) and a large-format (1024×1024·13 µm pixels) back-illuminated electron-multiplying charge-coupled device camera (iXon 888; Andor, Belfast, United Kingdom). The resulting large field-of-view (832×832 µm) was sufficient to view the edges of arteries of up to ≈250 µm passive diameter. To measure contraction, equivalent diameter was calculated from the opened artery by edge detection using a custom algorithm written in Python (Figure S1 in the online-only Data Supplement). First, 16-bit images were enhanced by custom-written preprocessing macros using the ImageJ-based open-source image processing package, FIJI.30 The preprocessing steps were as follows: (1) image stacks were temporally smoothed (to reduce noise) using a 10-frame (1 s) running average; (2) images were then spatially smoothed (also to reduce noise) by convolving images with a gaussian filter of 10-pixel SD; (3) image stacks were then converted to 8-bit using a linear contrast enhancement that scaled all values between the stack minima and maxima to the range 0 to 255.
Intensity profiles (used to determine the artery edge) were measured along a scan line perpendicular to the longitudinal axis of the artery by a custom Python analysis script using the profile-line function of the scikit-image processing library.31 These intensity profiles plot signal intensity as a function of position along the scanline. The edges of an artery with fluorescently labeled endothelia are readily identified by rapid changes in the intensity function from background to endothelial fluorescence levels and vice versa (Movie S1 and Figure S1). To determine the position of the artery edges, the derivative of smoothed (251-point, fifth-order Savitzky-Golay filter) intensity profiles was obtained. The artery edges correspond to extrema in the first derivative, which was identified using a zero-crossing detector.25 From the artery edge positions, we calculated the width of the en face artery preparation and transformed this width (equal to the unfolded circumference of the intact artery) to the equivalent diameter of the intact artery.
To validate the experimental procedure for measurement of artery contraction, synthetic image data was generated using a logistic function to describe the width of an en face preparation (Figure S1A through S1C). The algorithm generated faithful traces (Figure 1A through 1C).
Figure 1.
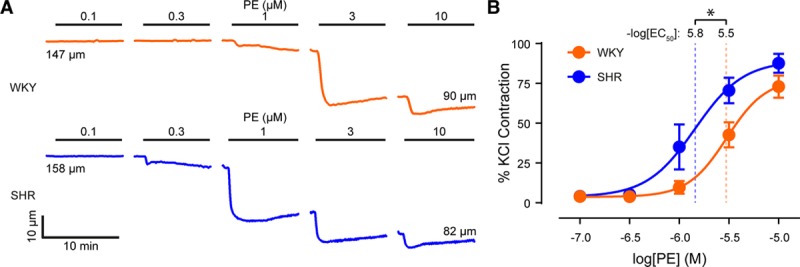
Contractions to phenylephrine (PE) are enhanced in hypertension. A, Representative diameter traces showing the effects of cumulatively applied phenylephrine (0.1 µmol/L–10 µmol/L) on small mesenteric arteries from normotensive (Wistar Kyoto [WKY], top) and hypertensive (spontaneously hypertensive rat [SHR], bottom) animals. B, Concentration-response curves for the contractile effect of phenylephrine on small mesenteric arteries. Contraction is expressed as a percentage of the maximum contraction induced by a depolarizing solution containing 70 mmol/L KCl, which did not differ between strains (Figure S3). Data are shown as mean values±SEM (n=5 for each). *Significance (P<0.05) using extra sum-of-squares F test. EC50 indicates half-maximal effective concentration
Simultaneous Assessment of Endothelial Ca2+ and Arterial Tone
When stimulated by phenylephrine (1 µmol/L), en face arteries contracted and reached steady-state within a few minutes (Figure S2B and S2C, Movie S1). Vasoconstriction was always followed by a small increase in the fluorescence intensity obtained from a small region of interest (ROI) placed over the central portion of the artery. The subsequent addition of acetylcholine (1 µmol/L) evoked relaxations back to resting levels (Figure 2C, also Movie S2). Vasodilator responses were always preceded by an increase in fluorescence intensity (Figure S2C, Movie S2). However, because of movement, it was not possible to extract reliable, time-dependent Ca2+ traces from these data. Instead, we assessed the effects of pharmacological agents on resting Ca2+ levels (in the absence of any contractile agent) or on acetylcholine-evoked increases in endothelial Ca2+ levels which were measured before the onset of any mechanical response (Figure S2C). In some experiments to prevent Ca2+ changes, the endothelium was loaded with the Ca2+ chelator 1,2-Bis(2-aminophenoxy)ethane-N,N,N′,N′-tetraacetic acid tetrakis(acetoxymethyl ester) (BAPTA-AM) (30 μM; 0.04% Pluronic F127 and 0.26% DMSO in PSS) for 30 minutes at 37°C.
Figure 2.
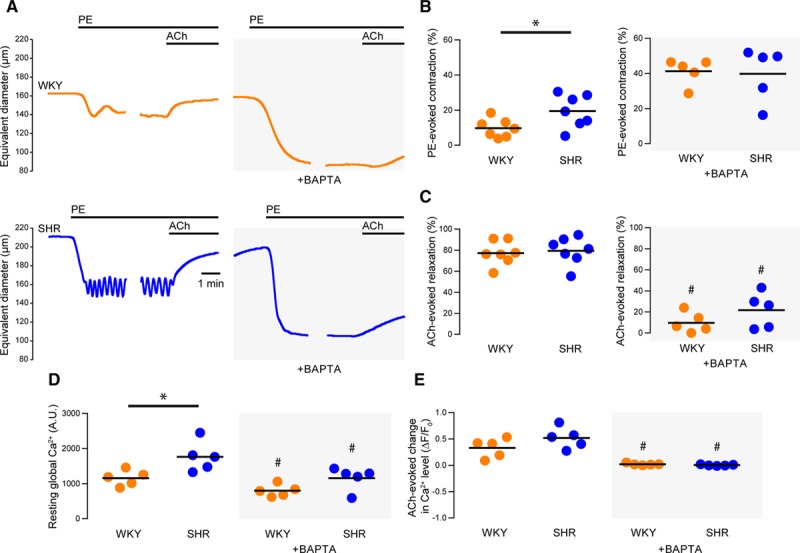
Endothelial Ca2+ activity is reduced by BAPTA-AM. A, Representative artery diameter traces from normotensive (Wistar Kyoto [WKY], top) and hypertensive (spontaneously hypertensive rat [SHR], bottom) animals before (left) and after (right) buffering of endothelial Ca2+ using 1,2-Bis(2-aminophenoxy)ethane-N,N,N′,N′-tetraacetic acid tetrakis acetoxymethyl ester. Phenylephrine (PE) and acetylcholine (ACh) were each used at a concentration of 1 µmol/L. B and C) Summary data showing PE-induced contraction (B) and ACh-induced dilation (C) before (left) and after (right) buffering of intracellular Ca2+ with BAPTA. D, Summary data illustrating the effects of BAPTA on resting endothelial Ca2+ levels in the absence and presence of BAPTA. E, Summary data illustrating the effects of BAPTA on ACh-evoked increases (ΔF/F0) in endothelial Ca2+ levels. ACh-evoked changes in Ca2+ levels were assessed before the onset of relaxation. WKY is denoted by orange data points and SHR by blue data points. *P<0.05 for WKY vs SHR, unpaired t test with Welch correction. #P<0.05 vs corresponding control, paired t test. A.U. indicates arbitrary units.
High-Resolution Imaging of Endothelial Ca2+ Signaling
Basal endothelial Ca2+ activity was imaged at high temporal (20 Hz) and spatial (130 nm projected pixel size at focal plane) resolution using an inverted fluorescence microscope (TE2000U; Nikon, Tokyo, Japan) equipped with a ×100 objective (1.3 NA; Nikon, Tokyo, Japan) and a large-format (1024×1024·13 µm pixels) electron-multiplying charge-coupled device camera (iXon 888; Andor, Belfast, United Kingdom). Cal-520/AM was excited with 488-nm wide-field epifluorescence illumination provided by a monochromator (Photon Technology International/Horiba UK, Ltd, Stanmore, United Kingdom). The resulting image field (≈133 µm×133 µm) enabled visualization of connected networks of ≈50 whole or partial endothelial cells. Ca2+ activity was recorded for periods of 60 s and spontaneous (local) Ca2+ activity, which was clearly visible in raw recordings, was analyzed as described below.
In some experiments, we assessed global endothelial Ca2+ responses to photolysis of caged IP3.32,33 In these experiments, the endothelium was dual-loaded with Cal-520/AM (5 μM) and a membrane-permeant caged IP3, caged IP3 4,5-dimethoxy-2-nitrobenzyl (10 μM), 0.02% Pluronic F-127, and 0.35% DMSO in PSS for 30 minutes at 37°C. Endothelial Ca2+ imaging was then imaged at 10 Hz, using an inverted fluorescence microscope (TE300; Nikon, Tokyo, Japan) equipped with a ×40 objective (1.3 NA; Nikon, Tokyo, Japan) and a large-format (1024×1024 13-μm pixels) electron-multiplying charge-coupled device camera (iXon 888; Andor, Belfast, United Kingdom) with a 325-nm projected pixel size at focal plane. Cal-520/AM was excited with 488-nm illumination (PE-300Ultra, CoolLED, Andover, United Kingdom), and the electron-multiplying charge-coupled device FOV was restricted to the central 512×512 pixels, resulting in a field-of-view of ≈166×166 μm (>50 cells visualized). Photolysis of caged IP3 was achieved using a xenon flashlamp (Rapp Optoelectronic, Hamburg, Germany) attached directly to the epi-illuminator of a TE300 microscope.34,35 The photolysis spot size diameter was ≈70 μm. Identical UV flashes in the absence of caged IP3 evoked no detectable Ca2+ response.
Automated Analysis of Local Endothelial Ca2+ Signaling
Local endothelial Ca2+ signaling was analyzed using a custom Python-based analysis suite for batch processing large numbers of datasets. The procedure for analyzing local Ca2+ signals consisted of 4 parts: (1) preprocessing of raw Ca2+ imaging data; (2) identification of sites of Ca2+ activity; (3) extraction of Ca2+ signals from active sites; (4) analysis of Ca2+ event parameters. To do this, we used algorithms that we have previously used to assess local endothelial Ca2+ signals.25,26,36,37 The first37 was specifically designed for the detection of local Ca2+ events in charge-coupled device (CCD) imaging data, whereas the second26 was designed to extract and analyze Ca2+ signals from a large number of ROIs. We combined these 2 algorithms to automatically generate traces of local Ca2+ signaling events from imaging data and, from these traces, extract temporal and spatial metrics of each Ca2+ event. Each step is described below.
Image Preprocessing
Ca2+ imaging recordings were preprocessed as previously described.25 In brief, to facilitate algorithmic detection of Ca2+ events, we first created image stacks representing fractional fluorescence changes (ΔF) by dividing each frame by the mean of all frames and subtracting a value of 1 from every pixel; the resultant stack was further processed by applying a gaussian blur (2-pixel radius). Finally, ΔF image stacks were converted to binary form by applying a threshold (mean pixel intensity within the stack plus 3× the SD of pixel intensity within the stack). The preprocessing resulted in a binary ΔF image stack where a pixel value of 1 (or 0) indicated the presence (or absence) of a Ca2+ event above threshold. All image preprocessing was performed using batch processing macros in FIJI.
Identification of Ca2+ Event Initiation Sites
Ca2+ events were identified from binary image stacks using code obtained from the detect puffs plug-in of FLIKA. This algorithm and its use for local Ca2+ event detection have been described extensively (eg,38,39). The algorithm calculates the 3-dimensional coordinates (x,y,t) of each unique Ca2+ event indicated in the binary ΔF stack and is optimized for detecting fast Ca2+ events (ie, Ca2+ puffs). Using the coordinates generated, the algorithm maps each Ca2+ event in the original data and extracts principal measurements in space (event location) and time (amplitude, rise time, fall time, full duration at half maximum [FDHM]). We optimized the FLIKA algorithm to permit detection of Ca2+ waves and identification of wave initiation sites and incorporated the software into our own batch processing code. In brief, FLIKA algorithms were used to generate coordinates that bounded each detected Ca2+ event and to generate multiple ΔF image stacks that each contained a single Ca2+ event. A spatial image indicating the initiation site of each Ca2+ event was then generated by taking a projection (SD of intensity) of each ΔF image stack of 10 frames (0.5 s) around the start of the corresponding event. The coordinates of the initiation site were calculated by fitting 2-dimensional elliptical gaussian function to this image. We repeated this process, creating a spatial image of each Ca2+ event in its entirety which allowed us to calculate the total area (spatial spread) of each event. The spatial spread of each event was determined by calculating the elliptical area under a fitted 2-dimensional gaussian. We used the initiation site coordinates, generated by the FLIKA algorithm, to generate ROIs (15-pixel diameter) for subsequent extraction of temporal Ca2+ signals from original image stacks.
Analysis of Ca2+ Event Parameters
Temporal Ca2+ signals were extracted from the raw fluorescence intensity (F) image stacks, using 15-pixel (≈2 µm) diameter circular ROIs positioned at the initiation site of each Ca2+ event as described above. The signals were processed using a modification of our previously published algorithm for the batch processing of 2-dimensional Ca2+ data.36 Multiple events may arise from the same site, so we considered ROIs that were separated by a distance <15 pixels (≈2 µm) to arise from a single site and the ROI corresponding to the first detected Ca2+ event was used. Fluorescence intensity traces were smoothed using an 11-point (0.55 s), third-order polynomial Savitzky-Golay filter, corrected for baseline drift using asymmetrical least squares fitting40 and differentiated by convolution with the first derivative of gaussian kernel. Fluorescence intensity (F) traces were then expressed as fractional changes from baseline (F/F0) by dividing values in the fluorescence intensity trace by the average value of a 100-frame (5 s) baseline-period (F0). The baseline period was automatically determined for each trace as the portion of signal exhibiting the lowest SD. This was achieved by applying, in turn, a rolling SD (100-frame) and a rolling summation (100-frame) to each trace. The minimum of the rolling summation corresponds to the center of the quietest portion of the F/F0 trace. Peaks in each F/F0 trace were identified using a zero-crossing detector on the corresponding derivative and a threshold of 10× the SD of baseline noise was used to distinguish Ca2+ events from noise. Event parameters (amplitude, FDHM, 10%–90% rise time, and 90%–10% fall time) were then extracted by fitting each detected Ca2+ event with a gaussian function.
Comparison of Methods for Identifying Ca2+ Event Initiation Sites
Some studies question the application of automated analyses to endothelial Ca2+ signaling in intact arteries.41 Criticism of automated analysis is valid when applied to recordings with a poor signal-to-noise ratio or those that exhibit tissue movement, as each condition can introduce severe artifacts. Indeed, it is partly for this reason that we did not attempt to extract local endothelial Ca2+ signals from the dynamic imaging experiments where we assessed smooth muscle cell contraction. However, with suitable imaging data (ie, high signal-to-noise ratio, lack of focus drift, stage drift, or tissue movement), automated analysis is objective, removes operator bias, and permits a quantity of data to be processed that would be unmanageable by manual methods, such that statistical confidence is increased.
To validate the present approach, we directly compared results obtained using the algorithm with those obtained through manual identification of Ca2+ event initiation sites by an experienced operator (in a small subset of the data). Event initiation sites were identified by visual identification of ΔF image stacks. When an event was detected, a subcellular ROI was placed at the point of origin unless the event originated out with the field-of-view. Binary images were then generated in which each event initiation site was indicated by a white circle, and the results from each method (manual and automated) were compared. We found that the identification of Ca2+ event initiation sites was comparable, whether performed by manual or automated methods (Figure S2). However, the manual approach is practical with only very small (and perhaps unrepresentative) data sets and not with the large image areas and long recording times used in the present study.
Assessment of Ca2+ Event Initiation Site and Myoendothelial Gap Junction Location
To assess coupling between Ca2+ events and MEPs, we imaged the underlying IEL at each site from which Ca2+ imaging data was recorded. The IEL was visualized using 390 nm light, and single images were generated by averaging 100-frame recordings obtained at 10 Hz. To highlight the position of IEL holes, we smoothed and inverted IEL images so that IEL holes were instead shown as bright regions on a dark background. IEL hole images were subjected to spatial filtering (2.5-pixel gaussian kernel) and intensity thresholding. Binary Ca2+ event initiation site images were created by flood filling the initiation site ROIs. IEL hole content and IEL hole/Ca2+ event initiation site localization was then determined using custom-written Python code. IEL holes were identified by 4-point connectivity using the measure.label function of the scikit-image processing library.31 The centroid-centroid distance between every Ca2+ event and every IEL holes was measured, and the closest IEL hole to each Ca2+ event initiation site determined.
To determine whether the extent of colocalization between Ca2+ event initiation sites and IEL holes was greater than would be expected if initiation sites and IEL holes were randomly positioned with respect to each other, we used a permutation analysis.42 First, existing Ca2+ event initiation site data were used to simulate a random distribution of initiation sites. Initiation sites within the field-of-view were randomized and the location of IEL holes left unchanged. Colocalization between the randomized Ca2+ event initiation sites and the unchanged IEL holes was then calculated as described above. For each dataset, this process was repeated 1000×, and a distribution of the minimum (random) initiation site to IEL hole separation calculated. To determine what fraction of Ca2+ event initiation sites colocalized with IEL holes, we used the randomized data to set a threshold (fifth percentile) distance for each dataset. Ca2+ events were considered as being localized to an IEL hole if the corresponding separation was less than this threshold.
Data Presentation and Statistical Analysis
For studies of basal Ca2+ activity, data were collected from at least 3 different fields of endothelial cells from 3 different arteries per rat. In experiments examining vascular reactivity or Ca2+ responses to acetylcholine, ionomycin, or photolysis of caged IP3, data were collected from a single artery segment per rat. Except for probability distributions, the n number represents the unit of analysis (ie, number of experimental animals). To create probability distributions, data were pooled from all experimental animals within each treatment group. In general, summary data is presented graphically as individual data points (mean of means within each experimental unit) with the grand mean indicated. Non-Gaussian data (identified using the D’Agostino-Pearson omnibus test) were log-normal. Log-normal data were transformed (log10) and mean values for each experimental unit were calculated on the logarithmic scale and then back-transformed to their original scale for presentation. Graphically, summarized log-normal data are presented as back-transformed means of individual data points with the grand mean indicated, whereas in the text as back-transformed grand means with 95% CIs. Summary data were compared using 2-tailed ttests with Welch correction for unequal variance, paired t tests, or repeated-measures ANOVA with Sidak multiple comparisons test, as appropriate. Probability distributions were compared using the Kolmogorov-Smirnov test. Concentration-response data was modeled using a 4-parameter dose-response with the minima of the curves constrained to zero. Calculated curve-fit parameters (half-maximal effective concentration; EC50) are presented with 95% CIs and were compared statistically using the extra sum-of-square F test. As this was an exploratory study, an a priori power analysis was not conducted. All statistical analysis was performed using GraphPad Prism Version 6 (GraphPad Software, La Jolla, CA). A P value of <0.05 was considered statistically significant.
Results
Phenylephrine-Induced Contraction Is Enhanced in Hypertension
Contraction in small mesenteric arteries was investigated in en face arteries (Figure S1 and S2 and Movie S1, 156±7 µm passive diameter for SHR, 163±8 µm passive diameter for WKY, n=5 for each group). A depolarizing KCl (70 mmol/L) bath solution induced rapid contractions that plateaued within 1 minute (Figure S3A). The magnitude of contraction induced by KCl did not differ between strains (Figure S3B; 38±3 % of initial diameter for SHR, 45±3 % of maximum for WKY; n=4), though the maximal rate of contraction was higher in arteries from normotensive rats (Figure S3B; 2.2±0.1 % s-1 for SHR, 3.6±0.2 % s-1 for WKY; n=4). On restoration of normal KCl (4.7 mmol/L), arteries relaxed back to resting levels. Neither the magnitude nor the rate, of this relaxation, was different among strains (Figure S3C; 86±3 % relaxation for SHR, 73±12 % relaxation for WKY; rate of 0.5±0.1 %·s-1 for SHR, 0.7±0.1·% s-1 for WKY; n=4).
In the next series of experiments, vasoconstriction was induced using the selective α1-adrenergic receptor agonist, phenylephrine (Figure 1). Phenylephrine produced concentration-dependent contractions (Figure 1A). The phenylephrine concentration-response relationship in SHR (EC50=1.4 μM; 95% CI, 0.8–2.5 μM; n=5) was shifted to the left when compared with that in WKY (EC50=3.0 μM; 95% CI, 2.9–3.2 μM; n=5). The contractile response to phenylephrine was significantly enhanced by a further increase in circumferential stretch of ≈10% in both WKY and SHR (Figure S4). At this increased level of stretch, arteries from SHR (EC50=0.9 μM; 95% CI, 0.7–2.2 μM; n=5) remained significantly more sensitive to phenylephrine than those from WKY (EC50=2.0 μM; 95% CI, 1.9–2.1 μM; n=5). These data demonstrate that alpha-adrenergic receptor–mediated vasoconstriction is enhanced in hypertension.
Endothelial, Ca2+-Dependent Negative Feedback Is Impaired in Hypertension
We have previously shown that the sensitivity of small mesenteric arteries to phenylephrine is enhanced after removal of the endothelium or blockade of endothelial IP3-mediated Ca2+ signaling.43 To determine if endothelial Ca2+-dependent modulation of vasoconstrictor responses is disrupted in hypertension, we simultaneously measured vascular reactivity and endothelial Ca2+ levels before and after buffering endothelial Ca2+ using the chelator, BATPA-AM (Figure 2 and Figure S2). As with the cumulative concentration-response relationships, contractions to a submaximal concentration of phenylephrine (1 µmol/L) were greater in en face arteries from hypertensive animals than in those from normotensive controls (Figure 2A and 2B; 9±2 % of initial diameter for SHR, 19±4 % of initial diameter for WKY; n=7 in each group). Acetylcholine (1 µmol/L) induced robust vasodilations of the preconstricted arteries. The dilations were similar in each experimental group (Figure 2A and 2C, 79±4 % for SHR, 77±4 % for WKY; n=7 in each group). Higher concentrations of acetylcholine (10 µmol/L) also evoked vasodilation of contracted arteries but did not evoke contraction of quiescent arteries (Figure S5), suggesting that acetylcholine does not cause the release of endothelium-dependent contractile factors in this model.
Buffering endothelial Ca2+ with BAPTA significantly potentiated contractile responses to phenylephrine in WKY (≈4-fold) and SHR (≈3-fold), such that contractions in each strain were similar after BAPTA treatment (Figure 2B; 40±7 % of initial diameter for SHR, 41±3 % of initial diameter for WKY; n=5 in each group). The potentiation, rather than attenuation, of phenylephrine-induced contraction demonstrates that smooth muscle cells were not significantly loaded with BAPTA. In contrast to its effect on contraction, BAPTA attenuated vasodilator responses to acetylcholine (Figure 2C; 22±7 % for SHR, 10±4 % for WKY; n=5 in each group). These data indicate that endothelial Ca2+-dependent processes limit contraction to a greater extent in normotensive (WKY) controls than in hypertensive (SHR) animals.
Because endothelial Ca2+-dependent processes normally limit contraction by activating vasodilator pathways, we expected endothelial Ca2+ levels to be higher in WKY than SHR endothelium. However, resting endothelial Ca2+ levels were significantly higher in SHR than WKY endothelium (Figure 2D; 1765±193 arbitrary fluorescence unit for SHR, 1159±100 AFU for WKY; n=5 in each group). BAPTA significantly reduced resting endothelial Ca2+ levels in WKY and SHR animals (Figure 2D; 1154±146 AFU for SHR, 795±77 AFU for WKY; n=5 in each group). Acetylcholine-evoked increases in endothelial Ca2+ levels (measured before the onset of relaxation) of phenylephrine-constricted vessels were similar in SHR and WKY (Figure 2E, 0.52±0.09 ΔF/F0 for SHR, 0.33±0.08 ΔF/F0 for WKY; n=5 in each group) and were prevented by BAPTA (Figure 2E; −0.01±0.01 ΔF/F0 for SHR, 0.01±0.01 ΔF/F0 for WKY; n=5 in each group).
Taken together, the results thus far suggest that (1) Ca2+ activity in the endothelium inhibits vascular smooth muscle cell contraction; (2) the endothelial Ca2+-dependent inhibition of vascular tone is significantly reduced in hypertension; and (3) the reduced ability of the endothelium to oppose contraction in hypertension is not explained by global endothelial Ca2+ levels.
Local Endothelial Ca2+ Signaling Is Impaired in Hypertension
Under basal conditions, endothelial cells exhibit spontaneous, subcellular (local) Ca2+ signals.23,44 These local signals modulate vasodilator pathways but may be missed by global analyses.45 We hypothesized that hypercontractile vessel responses in hypertension arise from impaired local basal endothelial Ca2+ activity. To test this hypothesis, we examined basal endothelial Ca2+ dynamics at high temporal (20 Hz) and spatial (×100 magnification, NA-1.3; 130 nm projected pixel size; ≈133 µm × 133 µm field-of-view; Figure 3) resolution. Ca2+ event initiation sites were identified automatically using algorithms obtained from a well-established tool (FLIKA) for automated analysis of localized events in Ca2+ imaging data,37 which was incorporated into our own Ca2+ signal analysis software suite.25 This analysis provided reliable quantification of local Ca2+ signals and outperformed manual visual inspection of the data (Figure S6).
Figure 3.
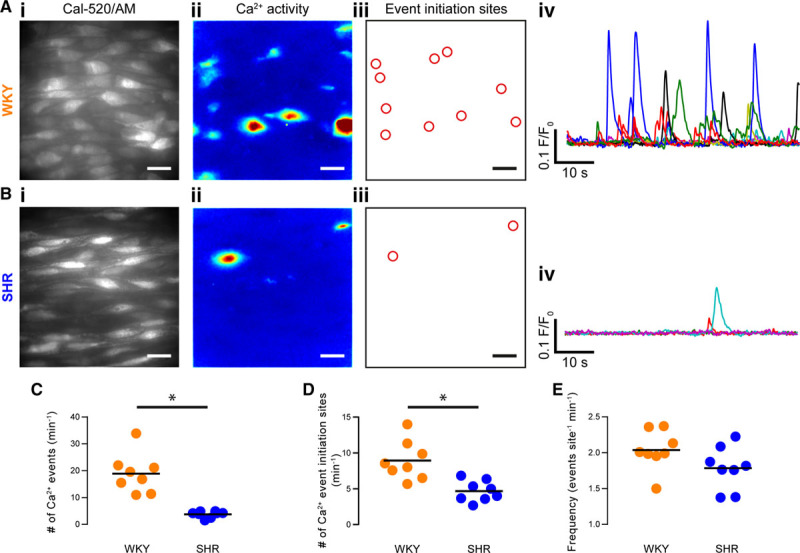
Spontaneous, local endothelial Ca2+ signaling is impaired in hypertension. A and B, Endothelial cells in intact arteries from normotensive rats (Wistar Kyoto [WKY], A) and spontaneously hypertensive rats (SHR; B) exhibit local subcellular Ca2+ signals under basal conditions (ie, in the absence of either mechanical or pharmacological stimulation). Scale bars=20 µm. i, High-resolution and wide field-of-view (×100 objective, NA=1.3, ≈13.3 × ≈13.3 µm field, ≈50 whole or partial cells) gray-scale images (left) of the endothelium of intact arteries (≈50 cells) loaded with the Ca2+ indicator, Cal-520-AM; (ii) composite images showing the SD of intensity from 1-min recordings of Ca2+ activity of the corresponding field of endothelium shown in i; (iii) automatically generated regions of interest placed at the center of Ca2+ event initiation sites, from the same data illustrated in i and ii; and (iv) baseline-corrected Ca2+ signals (F/F0) extracted from the ROIs shown in iii. C through E, Summary data showing: (C) the number of event initiation sites; (D) the total number of Ca2+ events; and (E) the average event frequency at each active event initiation site. WKY is denoted by orange data points and SHR by blue data points. Each data point illustrates the mean value obtained from at least 3 separate fields of endothelial cells from a single animal, the black line indicates the mean of means (n=8 animals for both WKY and SHR). *P<0.05, unpaired t test with Welch correction.
WKY and SHR endothelial cells exhibited substantial local Ca2+ activity under basal conditions (Figure 3A and Movies S2 and S3). These local signals arise from IP3R-mediated release of Ca2+ from the internal store (they persist in Ca2+-free extracellular bathing solution and are blocked by 2-Aminoethoxydiphenyl borate and cyclopiazonic acid).46 There were significantly fewer basal Ca2+ events in SHR than in WKY endothelia (Figure 3A through 3C; 3.8±0.4 events/field for SHR, 18.9±2.5 events/field for WKY; n=8 in each group). There was also a significantly lower number of sites giving rise to spontaneous Ca2+ activity in hypertension compared to normotensive controls (Figure 3D; 4.7±0.5 sites/field for SHR, 8.9±1.0 sites/field for WKY; n=8 in each group; P<0.05; unpaired t test with Welch correction). However, within active initiation sites, the average event firing rate (frequency) was similar in each experimental group (Figure 3E; 1.8±0.1 events/site for SHR, 2.0±0.1 events/site for WKY; n=8 in each group; P=0.1; unpaired t test with Welch correction). These results suggest that, in hypertension, although endothelial cells remain able to encode information within the frequency of Ca2+ signals, the collective activity across the endothelial network is impaired.
Because vascular reactivity to phenylephrine is increased after buffering endothelial Ca2+ (Figure 2), we hypothesized that the increased contractile responses to phenylephrine at higher circumferential stretch (Figure S4) might arise from impaired basal endothelial Ca2+ signaling. We assessed basal Ca2+ activity before and after a ≈10% increase in circumferential stretch. In support of our hypothesis, stretch reduced Ca2+ activity in the endothelium of both WKY and SHR (Figure S7).
Many cells encode information in the amplitude, duration (FDHM), rise time, fall time, and spread of a Ca2+ transient to target particular Ca2+-dependent effectors.47 To determine if these signaling metrics are altered in hypertension, we plotted frequency distributions of each parameter by pooling data from all experiments (Figure 4). Temporal features were extracted from a Gaussian-modified exponential function that was fit to each Ca2+ event (Figure 4A). The spread of Ca2+ from each initiation site during each event was obtained by fitting a 2-dimensional gaussian function to z-projections of the Ca2+ signal (SD of pixel intensity; Figure 4C). The distributions of each parameter (amplitude, FDHM, rise time, fall time, and spatial spread) were log-normal in WKY and SHR, suggesting multiplicative (rather than additive) variability in the response. Such distributions are consistent with an amplification process in which released Ca2+ recruits additional channels.48,49
Figure 4.
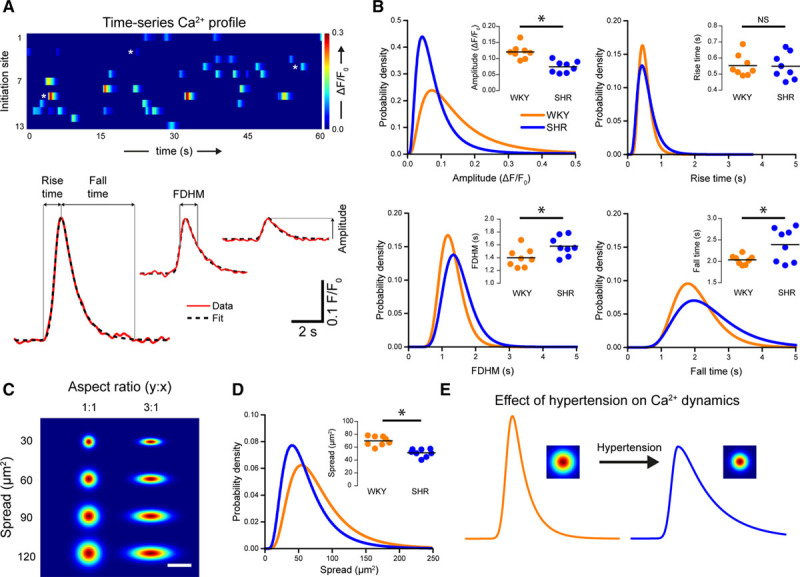
Ca2+ signaling dynamics are altered in hypertension. A, Basal Ca2+ signals from a Wistar Kyoto (WKY) control displayed as parallel heat maps (top) and Ca2+ transients (bottom; red line) shown with exponentially modified gaussian fits. The Ca2+ event traces are indicated by heat map by white stars. The model was used to extract the indicated temporal parameters. B, Probability distributions and summary data (insets) of amplitude, full duration at half maximum (FDHM), rise time, and fall time for WKY (orange) and spontaneously hypertensive rat (SHR; blue) animals. Distributions are log-normal curves fitted to pooled data (N=753 events from 8 animals for WKY; N=314 events from 8 animals for SHR). Because of the log-normal distribution, a logarithmic transform was applied to raw data. Summary data show geometric means (calculated by back transforming the mean of log-transformed data). *Significance (P<0.05) using unpaired t tests with Welch correction on the log-transformed data. C, Example plots of 2-dimensional gaussians demonstrating the function used to calculate spatial spread. Functions increase in area down the vertical, and the 2 columns illustrate the effect of alterations in aspect ratio. Spread was determined by calculating the elliptical area covered by the 2-dimensional function. Scale bar=20 µm. D, Probability distribution and summary data (inset) showing the effect of hypertension on the spread of Ca2+ events from their point of origin. Summary data show geometric means of data obtained from individual animals. *Significance (P<0.05) using unpaired t test with Welch correction on the log-transformed data (n=8). E, Illustration of the effect of hypertension on basal endothelial Ca2+ signals. In hypertension, Ca2+ signals are smaller in amplitude and spread but persist for longer due to an increase in the time taken for the Ca2+ level to return to baseline. NS indicates nonsignificant.
The distributions of Ca2+ event amplitudes (Figure 4B, top left), FDHM (Figure 4B, bottom left), fall times (Figure 4B, bottom right) and spatial spreads (Figure 4D) differed significantly in WKY and SHR rats (P<0.05, 2-sample Kolgorov-Smirnov tests). No difference was detected in the distributions of event rise times (Figure 4B, top right; P=0.47; 2-sample Kolmogorov-Smirnov test). An analysis of means (Figure 4B and 4D, insets) revealed that the amplitude and spatial spread of Ca2+ signals were significantly lower in SHR (0.07 ΔF/F0, 95% CI, 0.06–0.09 ΔF/F0 for amplitude; 50.9 s, 95% CI, 45.8–56.5 s for spread), compared with WKY (0.12 ΔF/F0, 95% CI, 0.10–0.14 ΔF/F0 for amplitude; 69.7 s, 95% CI, 63.5–76.2 s for spread). In contrast, the FDHM and fall time were both significantly higher in SHR (1.57 s, 95% CI, 1.45–1.70 s for FDHM; 2.4 s, 95% CI, 2.1–2.7 s for fall time), compared with WKY (1.39 s, 95% CI, 1.28–1.52 s for FDHM; 2.0 s, 95% CI, 1.9–2.1 s for fall time) animals. No difference in the mean rise time was detected between groups (0.54 s, 95% CI, 0.48–0.61 s for SHR; 0.55 s, 95% CI, 0.50–0.61 s for WKY; n=8).
Collectively, these data demonstrate that basal subcellular Ca2+ signals occur less often and are smaller in amplitude and spatial spread, but last longer in hypertension than in normotensive controls (Figure 4E). To investigate if the decrease in basal Ca2+ activity observed in hypertension arose from alterations in Ca2+ store content, we examined Ca2+ responses induced by the ionophore, ionomycin in a Ca2+ free physiological saline solution. Total store content (assessed by the area-under-the-curve of ionomycin-evoked global Ca2+ signals) was similar in WKY and SHR (Figure S8A, n=6 in each group). We next investigated if there were any difference in the ability of IP3 to evoke Ca2+ release. To do this, we bypassed phospholipase C-dependent IP3 production by photolyzing a caged photolabile version of the inositide. In the absence of external Ca2+, there were no significant differences in the amplitude of IP3-mediated endothelial Ca2+ responses of WKY and SHR (Figure S8B, n=8 in each group), suggesting that the ability of IP3 to evoke a Ca2+ response is unaltered in hypertension. To assess if Ca2+ removal mechanisms were altered in hypertension, we calculated the maximum rate of Ca2+ removal after photolysis of caged IP3. The maximum rate of decline of the caged IP3-evoked Ca2+ response was similar in WKY and SHR (Figure S8C, n=8 in each group).
Collectively, these data demonstrate that basal subcellular Ca2+ signals occur less often, are smaller in amplitude and spatial spread, but last longer in hypertension than in normotensive controls (Figure 4I). The cause of dysfunctional spontaneous Ca2+ activity is not resolved but is unlikely to be because of alterations in-store content, the ability of IP3 to evoke Ca2+ release, or Ca2+ removal via either sarco/endoplasmic reticulum Ca2+-ATPase, plasma membrane Ca2+ pump, or Na+-Ca2+ exchanger.
IEL Hole Distribution Is Altered in Hypertension
Endothelial cells are separated from smooth muscle cells by the IEL. Gaps in the elastic lamina (IEL holes) provide sites that permit signaling to occur between endothelial cells and smooth muscle cells. Signals may spread directly between the two cell types, or IEL holes may provide routes for the diffusion of vasoactive factors.18,19,50 IEL holes may be identified by a lack of signal when the IEL is visualized using elastin autofluorescence19 or with the aid of fluorescence indicators.51 To investigate the possibility of alterations in the extent of endothelial-smooth muscle cell coupling via the IEL in hypertensive animals, we visualized the autofluorescence emission of the IEL upon excitation with near-UV (390 nm) light (Figure 5A).
Figure 5.
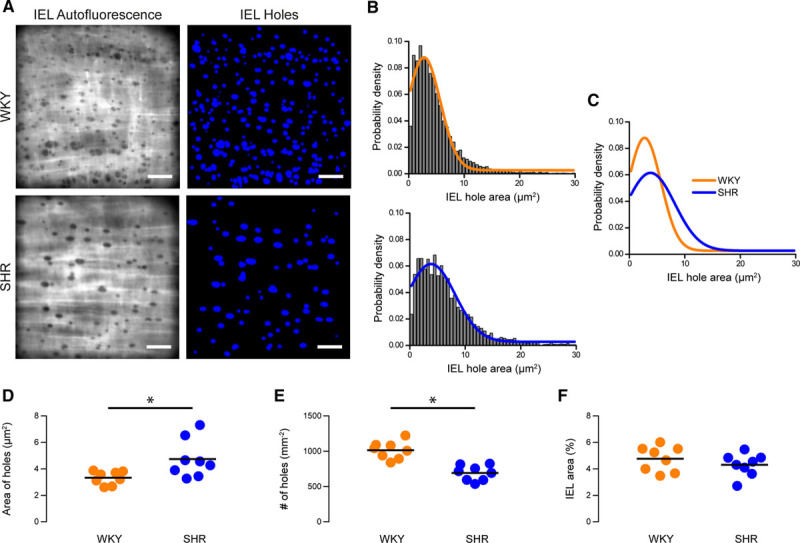
Structural internal elastic lamina (IEL) alterations in hypertension. A, Representative images of IEL holes in mesenteric arteries from Wistar Kyoto (WKY) control (top row) and hypertensive (bottom row) animals. Left, Raw elastin autofluorescence images. These images were processed and inverted to highlight IEL holes (right). Scale bars=20 µm. B and C, Probability density distributions of IEL hole size in mesenteric arteries from WKY (B, top; orange) and spontaneously hypertensive rat (SHR; C, top; blue) animals showing the effect of hypertension on the spread of Ca2+ events from their point of origin (C). Distributions are log-normal curves fitted to pooled data (N=8320 IEL holes from 8 animals for WKY; N=4368 holes from 8 animals for SHR). D–F, Summary data showing the effect of hypertension on IEL hole area (D), IEL hole density (E), and the area of IEL occupied by holes (F). In D, geometric means (calculated by back transforming the mean of log-transformed data) of data from individual animals is shown. In G and H, means of untransformed data are shown. *Significance (P<0.05) using unpaired t tests with Welch correction on log-transformed (D) or untransformed (E and F) data.
There was an increase in the proportion of larger IEL holes in hypertension when compared with WKY controls (Figure 5B through 5C; P<0.05, 2-sample Kolmogorov-Smirnov tests). Mean IEL hole area was also greater in hypertensive SHR than normotensive WKY controls (Figure 5D; 4.6 µm2, 95% CI, 3.6–5.8 µm2 for SHR; 3.3 µm2, 95% CI, 2.9–3.8 µm2 for WKY; n=8). However, although total IEL hole area was higher, the density of IEL holes was lower in SHR compared with WKY (Figure 5E; 691±38 holes/mm2 for SHR, 1015±45 holes/mm2 for WKY; n=8 in each group). Thus, IEL holes are fewer in number but larger in size in hypertensive animals. No difference was detected in the mean percentage area of IEL occupied by holes in each group (Figure 5F; 4.3±0.3 for SHR, 4.8±0.3 for WKY; n=8 in each group). Previous studies on chemically fixed large (carotid) arteries have also suggested that the number of holes in the internal elastic lamina was altered in hypertension; the area occupied by fenestrations was reduced in carotid arteries.52,53 These results raise the possibility that endothelial-smooth muscle cell coupling may be compromised in hypertension.
Endothelial Ca2+ Events Are Decoupled From MEPs in Hypertension
To explore the possibility of decreased signaling at MEPs in hypertension, we investigated the colocalization of Ca2+ signals with holes in the IEL. In previous studies, investigators have inferred colocalization of Ca2+ events and IEL holes by eye.41,54 Other studies have used a more quantitative approach by using a distance threshold (eg, 5 µm) to indicate colocalization.20,55,56 In line with these observations, in the present study, Ca2+ events did appear to occur in the vicinity of IEL holes (Figure 6A and 6B). To examine Ca2+ event-IEL hole coupling, we compared the extent of overlap between Ca2+ signal initiation sites and IEL holes with that expected from a completely random distribution.57 For both WKY and SHR, the distributions of the distance between each Ca2+ event and corresponding nearest IEL hole in the randomized data were significantly different from the measured data (Figures 6C and 6D; 2-sample Kolmogorov-Smirnov tests). An analysis of means confirmed that Ca2+ events occurred nearer to IEL holes than would be expected if the Ca2+ events initiated randomly throughout the cytoplasm for both WKY (2.7 µm, 95% CI, 2.2–3.2 µm for observed; 5.0 µm2, 95% CI, 4.6–5.5 µm for random; n=8) rats and SHR (3.5 µm, 95% CI, 2.8–4.4 µm for observed; 5.8 µm, 95% CI, 5.4–6.3 µm for random; n=8; Figure 6E). This result suggests that local Ca2+ signaling events predominate near IEL holes.
Figure 6.
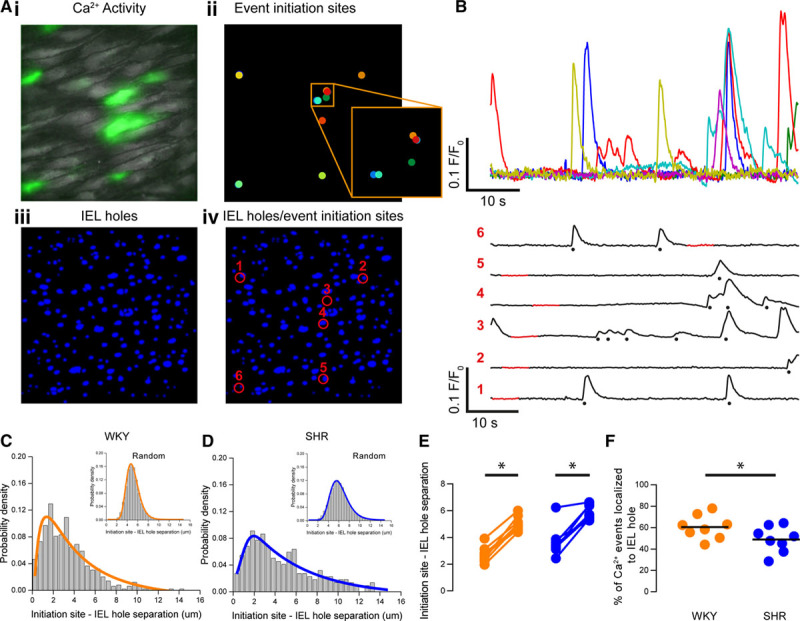
Decoupling of Ca2+ events from myoendothelial junctions in hypertension. A, Composite image showing endothelial Ca2+ activity in green (i), Ca2+ event initiation sites (ii), internal elastic lamina (IEL) holes (iii), and an overlay of Ca2+ event initiation sites and IEL holes (iv). B and C, Ca2+ signals extracted from the sites shown in Aiv. In C, the Ca2+ signals have been spread out for clarity. The red portion of the signal demarcates the automatically determined baseline region, and detected events are indicated by stars. D and E, Probability density distributions illustrating the log-normal distribution of the measured separation between Ca2+ event initiation sites and IEL holes for Wistar Kyoto (WKY; D) and spontaneously hypertensive rat (SHR; E). Distributions arising from randomly permuted data are also shown (insets). F, Paired summary data showing that the mean centroid-centroid distance between Ca2+ event initiation sites and the nearest IEL observed was significantly lower than expected than a randomized distribution Ca2+ event initiation sites in both SHR and WKY endothelium (paired data points). G, Summary data showing a reduction in the percentage of Ca2+ events localized to IEL holes in hypertension. *Significance (P<0.05) using paired t tests on log-transformed data (F) or unpaired t test with Welch correction (G).
The extent to which a local Ca2+ event is coupled to an IEL hole influences how likely it is to regulate smooth muscle contraction. We hypothesized that coupling of local Ca2+ signals to IEL holes would be disrupted in hypertension. To test this hypothesis, we determined the fifth percentile of initiation site-IEL hole separation for each random dataset and considered a Ca2+ event to be coupled to an IEL hole if it occurred within this distance. The percentage of Ca2+ events localized to IEL holes was significantly lower in hypertensive (SHR, 49±4 %) when compared with normotensive (WKY, 61±4 %) animals (Figure 6F; n=8 for each group). This data suggests that hypertension is associated with reduced coupling of local Ca2+ signals to smooth muscle cells via the MEP.
Discussion
Intracellular Ca2+ signaling is central to endothelial control of cardiovascular activity. Endothelial Ca2+ signals control the synthesis and release of macromolecules involved in angiogenesis,58,59 inflammatory responses,60,61 and the regulation of vascular smooth muscle contraction (reviewed62). In the endothelium, sites that make contact with smooth muscle cells (MEPs), have emerged as crucial Ca2+ signaling microdomains that are pivotal in the regulation of vascular function. These sites are enriched with Ca2+-dependent effector proteins that modulate the contractile state of smooth muscle.18,19,50 Our results demonstrate that basal, local IP3-mediated endothelial Ca2+ signals occur less frequently and are lower in amplitude in hypertension when compared with normotensive controls. These local Ca2+ signals occur predominantly at contact sites with smooth muscle cells (MEPs) but are decoupled from MEPs in hypertension. The deficiencies in IP3-mediated Ca2+ signaling reduce the ability of the endothelium to oppose vascular tone and can be mimicked in normotension via selective buffering of endothelial Ca2+. These results demonstrate that changes in local, IP3-mediated, Ca2+ signaling at MEPs contribute to the impaired endothelial control of vascular tone and the increased contractile state of smooth muscle in hypertension.
Various proposals exist to explain the impaired endothelial-dependent control of blood vessel tone in hypertension. The proposals include alterations in connexons and NADPH oxidase expression and altered Ca2+-activated K+ channel activity.63–68 The changes decrease endothelium-dependent hyperpolarization and NO production,63–67,69 each of which are Ca2+-dependent processes. However, surprisingly little is known about endothelial Ca2+ signaling in hypertension, and the few existing reports are contradictory. For example, impaired responses to bradykinin and endothelin-1 have been observed in cultured aortic endothelial cells derived from hypertensive rats.9,17 In contrast, the endothelial Ca2+ response to muscarinic receptor activation is increased in native aortic endothelial cells from hypertensive rats (SHR),16 or unaltered in native murine mesenteric artery endothelial cells (angiotensin II–induced hypertension).20
A possible explanation for the discrepancies may lie in the subtlety of various Ca2+ signaling modalities. In unstimulated endothelial cells in situ23 and in vivo,51 local IP3-mediated Ca2+ events occur at MEPs where they exert a persistent anticontractile influence by activating Ca2+-sensitive potassium channels and eNOS.23,24,63,70 These local events are termed Ca2+ pulsars and are reportedly distinct from the elementary Ca2+ blips and puffs that give rise to Ca2+ waves in Xenopus oocytes.65,66 Another local Ca2+ signaling modality occurs via Ca2+ influx through transient receptor potential channels (eg, TRPV456 or TRPA171,72 sparklets). Like pulsars, transient receptor potential channel-mediated influx events also couple to MEPs where they activate Ca2+ activated potassium channels and NO synthesis directly20,56,73 or indirectly via Ca2+-induced Ca2+ release from the endoplasmic reticulum.28,43,74 As transient receptor potential channel-mediated sparklets occur very infrequently under basal conditions,20,56 they do not seem to contribute to the innate ability of the endothelium to oppose vasoconstriction. Instead, a reduction in localized TRPV4-mediated Ca2+ influx events underlies a loss of muscarinic receptor–mediated vasodilation in a murine model of angiotensin II–induced hypertension.20 This observation demonstrates that local Ca2+ signaling pathways contribute to vascular dysfunction in hypertension. However, despite evidence pointing to a critical role in controlling vascular tone, local IP3-mediated Ca2+ signaling in hypertension has not been previously investigated.
Consistent with our previous results in another strain of rat,46 mesenteric endothelial cells exhibit spontaneous IP3-mediated Ca2+ release events in both WKY and SHR. The events had continuous distributions of amplitude, duration, and spread and ranged from highly localized release events to larger, but still subcellular, Ca2+ waves. The continuum of release events presumably arises from variations in the recruitment of neighboring IP3Rs. The results suggest that IP3-mediated Ca2+ signaling in rat endothelium is an analog process (see also Burdyga et al75), unlike the digital process (recruitment of additional sites, increase in frequency) described for Ca2+ pulsars in murine mesenteric arteries. However, despite differences in the kinetic profiles of Ca2+ events in murine and rat endothelium, both signaling modalities predominantly originate at or near MEPs so are well placed to contribute to the regulation of vascular tone by endothelium-derived hyperpolarization and NO production.
Basal IP3-mediated endothelial Ca2+ signals occurred less frequently, were smaller in amplitude and more spatially confined, but lasted longer (ie, had a slower rate of decline) in hypertension. Local Ca2+ signals were also positioned further from IEL holes in SHR than in WKY controls, suggesting that the normal coupling of local Ca2+ signals and MEPs is disrupted in hypertension. These alterations may decrease the occurrence of endothelium-dependent hyperpolarization and NO production at the MEPs and, as a result, increase vascular reactivity to contractile agents.63–67,69 In support of this conclusion, selectively buffering endothelial Ca2+ signals using the chelator, BAPTA, increased contractions to phenylephrine and abolished the difference in sensitivity of arteries from normotensive and hypertensive animals to the contractile activator.
Our observations of an impaired inhibitory role of the endothelium in hypertension are in line with several previous reports.76–81 Reduced endothelium-dependent vasodilation or increased endothelium-dependent contraction are reported frequently in hypertension. For example, in precontracted aorta, acetylcholine-evoked endothelium-dependent dilation may be blunted in hypertensive rats (SHR) when compared with normotensive (WKY) controls.82–85 In quiescent aorta50,51 and mesenteric arteries86,87 (ie, in the absence of any contractile agent) of SHR, but not WKY, high concentrations (>1 µmol/L) of acetylcholine may evoke cyclooxygenase-sensitive, endothelium-dependent contractions84,85 that are enhanced after inhibition of NO synthesis.85,88 These observations are interpreted together to suggest that impaired endothelial control of smooth muscle cell function in hypertension arises from an imbalance in the complex interplay of endothelium-derived relaxing and contracting factors.89 Notwithstanding, reduced dilation is not universally observed in hypertension.76,90,91 Neither are endothelium-dependent contractions to acetylcholine.92,93 In the present study, although contractile responses of mesenteric arteries were augmented, vasodilation was unaltered in hypertension, and we did not observe acetylcholine-induced contraction in either WKY or SHR (Figure S5). Thus, alterations in agonist-evoked relaxation or the release of endothelium-dependent contractile factors is unlikely to explain the hypercontractility observed in the present study. Differences in the precise manifestation of endothelial dysfunction and the extent of impaired vascular reactivity likely arises from the degree of hypertension and the age of animals under study.76,78,92,94–96
As the ability of the endothelium to oppose constriction is dependent on the nature of the vasoconstrictor stimulus,79,97 it may be that the endothelial IP3-mediated inhibitory pathway described here for adrenoceptor-mediated contractions may also modulate pressure-induced constriction. Endothelial Ca2+ activity is suppressed at high intraluminal pressure and inversely correlates with the development of myogenic tone.54 Thus, although our experiments did not address mechanisms of pressure-induced constriction, the enhanced myogenic tone observed in the SHR98 would be anticipated from the impaired endothelial Ca2+ activity observed in SHR. Indeed, contractile responses to phenylephrine and basal Ca2+ activity were negatively correlated with the level of stretch applied to arteries. In addition, although not universally observed,99 adrenoceptor agonists may activate endothelial cells directly100–103 or indirectly54,70,104–108 to amplify basal MEP-associated endothelial Ca2+ activity and further limit vasoconstriction. In the present study, it was not possible to reliably assess whether or not adrenoceptor activation increased endothelial cell Ca2+ levels because of the smooth muscle contraction evoked by the adrenoceptor agonist.
The question arises as to why basal Ca2+ signaling is impaired and uncoupled from MEPs in hypertension. Though the spatiotemporal impairment (decreased frequency, reduced amplitude and spatial spread, slower rate of decline) is consistent with a reduction in the ability of SERCA to sequester Ca2+ into the endoplasmic reticulum,67,68 we did not find evidence of altered Ca2+ removal following Ca2+ release evoked by photolysis of caged IP3. In addition, the present results show the endoplasmic reticulum content was unchanged in hypertension. Rather than decreased Ca2+ uptake, impaired basal endothelial Ca2+ signaling may be due to reduced basal production of IP3 in the endothelium of hypertensive rats.
Uncoupling of IP3-mediated Ca2+ events from MEPs may be the result of a reduction in the expression of tethering proteins, as has been shown for the PKC (protein kinase C)-anchoring protein, A-Kinase Anchoring Protein 150, which couples TRPV4 Ca2+ influx channels to MEPs.20 However, the decrease in targeting of local Ca2+ signals to MEPs may also arise from the arterial remodeling that accompanies hypertension.109–113 In support of this scenario, we observed fewer IEL holes in hypertension, which likely corresponds to a lower number of MEPs and a decreased probability of an interaction between Ca2+ signals and MEPs. This proposal, if correct, would suggest that the change in Ca2+ signaling events that initiate at MEPs is a consequence rather than a cause of hypertension.
In conclusion, we show that basal IP3-mediated Ca2+ signaling is disrupted in the endothelium of arteries from hypertensive rats (SHR). In hypertension, local endothelial Ca2+ signals occur less often, are reduced in amplitude and spread, and are uncoupled from myoendothelial gap junctions. These basal endothelial Ca2+ signals limit vascular contraction, but this control is compromised in hypertension. These results support the view that local Ca2+ signals are important for endothelial-dependent modulation of smooth muscle contractile function and suggest that impaired local IP3-mediated Ca2+ signals in endothelial cells have widespread global consequences on vascular smooth muscle function in hypertension.
Perspective
Projections between endothelial and smooth muscle cells (MEPs) contain several Ca2+-dependent effector proteins and act as a functional hub where endothelial signaling pathways merge to promote relaxation of smooth muscle cells. In hypertension, there is impaired Ca2+-dependent, endothelial control of vascular tone resulting in increased contraction. We demonstrate two changes in IP3-mediated Ca2+ signals at MEPs that explain the impaired endothelial control of vascular smooth muscle contraction. First, there is a reduced liberation of Ca2+ from active Ca2+ release sites, which are positioned near MEPs. Second, there is decoupling of (an increased distance between) active Ca2+ release sites and MEPs. Together, these alterations to myoendothelial Ca2+ signaling dynamics decrease endothelial control of vascular smooth muscle contraction and explain the increased smooth muscle cell contractility that is characteristic of hypertension.
Sources of Funding
This work was funded by the Wellcome Trust (202924/Z/16/Z; 204682/Z/16/Z) and the British Heart Foundation (PG/16/54/32230; PG16/82/32439), whose support is gratefully acknowledged. We thank Margaret MacDonald for her excellent technical support
Disclosures
None.
Supplementary Material
Footnotes
The online-only Data Supplement is available with this article at https://www.ahajournals.org/doi/suppl/10.1161/HYPERTENSIONAHA.119.13791.
Novelty and Significance
What Is New?
Local endothelial Ca2+ activity at junctions between endothelial and smooth muscle cells is dysregulated in hypertension.
Basal endothelial Ca2+ signals are less frequent and smaller in amplitude in hypertensive animals than in normotensive controls.
The spatial organization of subcellular endothelial Ca2+ signals is disrupted in hypertension.
Impaired basal endothelial Ca2+ signaling underlies the increased sensitivity to contractile agents observed in the spontaneously hypertensive rat.
What Is Relevant?
Hypertension is associated with impaired endothelial function leading to increased vasoconstriction, but the mechanisms involved are unclear.
The decrease in endothelial function that begins in hypertension, and progresses the disease, may lead to additional cardiovascular complications such as atherosclerosis.
Junctions between endothelial and smooth muscle cells are critical to the control of vascular contractility. Our results provide a new mechanistic target for endothelial dysfunction in hypertension by demonstrating that local IP3(inositol trisphosphate)-evoked Ca2+ signals are disrupted at the junction between the endothelium and smooth muscle in hypertension.
Summary
Local endothelial Ca2+ signals at junctions between endothelial and smooth muscle cells normally limit contraction but this Ca2+ signaling circuit is disrupted in hypertension resulting in increased vascular reactivity.
References
- 1.Lawes CM, Vander Hoorn S, Rodgers A International Society of Hypertension. Global burden of blood-pressure-related disease, 2001. Lancet. 2008;371:1513–1518. doi: 10.1016/S0140-6736(08)60655-8. doi: 10.1016/S0140-6736(08)60655-8. [DOI] [PubMed] [Google Scholar]
- 2.Harris DM, Cohn HI, Pesant S, Eckhart AD. GPCR signalling in hypertension: role of GRKs. Clin Sci (Lond) 2008;115:79–89. doi: 10.1042/CS20070442. doi: 10.1042/CS20070442. [DOI] [PubMed] [Google Scholar]
- 3.Touyz RM. Molecular and cellular mechanisms in vascular injury in hypertension: role of angiotensin II. Curr Opin Nephrol Hypertens. 2005;14:125–131. doi: 10.1097/00041552-200503000-00007. [DOI] [PubMed] [Google Scholar]
- 4.Coffman TM. Under pressure: the search for the essential mechanisms of hypertension. Nat Med. 2011;17:1402–1409. doi: 10.1038/nm.2541. doi: 10.1038/nm.2541. [DOI] [PubMed] [Google Scholar]
- 5.Touyz RM. New insights into mechanisms of hypertension. Curr Opin Nephrol Hypertens. 2012;21:119–121. doi: 10.1097/MNH.0b013e328350a50f. doi: 10.1097/MNH.0b013e328350a50f. [DOI] [PubMed] [Google Scholar]
- 6.Thom S. Arterial structural modifications in hypertension. Effects of treatment. Eur Heart J. 1997;18(suppl E):E2–E4. doi: 10.1016/s0195-668x(97)90001-4. doi: 10.1016/s0195-668x(97)90001-4. [DOI] [PubMed] [Google Scholar]
- 7.Heagerty AM, Heerkens EH, Izzard AS. Small artery structure and function in hypertension. J Cell Mol Med. 2010;14:1037–1043. doi: 10.1111/j.1582-4934.2010.01080.x. doi: 10.1111/j.1582-4934.2010.01080.x. [DOI] [PMC free article] [PubMed] [Google Scholar]
- 8.Mulvany MJ. Small artery remodeling in hypertension. Curr Hypertens Rep. 2002;4:49–55. doi: 10.1007/s11906-002-0053-y. [DOI] [PubMed] [Google Scholar]
- 9.Wang R, Sauvé R, de Champlain J. Altered calcium homeostasis in tail artery endothelial cells from spontaneously hypertensive rats. Am J Hypertens. 1995;8(10)(pt 1):1023–1030. doi: 10.1016/0895-7061(95)00228-6. doi: 10.1016/0895-7061(95)00228-6. [DOI] [PubMed] [Google Scholar]
- 10.Faraci FM, Orgren K, Heistad DD. Impaired relaxation of the carotid artery during activation of ATP-sensitive potassium channels in atherosclerotic monkeys. Stroke. 1994;25:178–182. doi: 10.1161/01.str.25.1.178. doi: 10.1161/01.str.25.1.178. [DOI] [PubMed] [Google Scholar]
- 11.Ohashi M, Faraci F, Heistad D. Peroxynitrite hyperpolarizes smooth muscle and relaxes internal carotid artery in rabbit via ATP-sensitive K+ channels. Am J Physiol Heart Circ Physiol. 2005;289:H2244–H2250. doi: 10.1152/ajpheart.00254.2005. doi: 10.1152/ajpheart.00254.2005. [DOI] [PubMed] [Google Scholar]
- 12.Plane F, Wiley KE, Jeremy JY, Cohen RA, Garland CJ. Evidence that different mechanisms underlie smooth muscle relaxation to nitric oxide and nitric oxide donors in the rabbit isolated carotid artery. Br J Pharmacol. 1998;123:1351–1358. doi: 10.1038/sj.bjp.0701746. doi: 10.1038/sj.bjp.0701746. [DOI] [PMC free article] [PubMed] [Google Scholar]
- 13.Chataigneau T, Félétou M, Thollon C, Villeneuve N, Vilaine JP, Duhault J, Vanhoutte PM. Cannabinoid CB1 receptor and endothelium-dependent hyperpolarization in guinea-pig carotid, rat mesenteric and porcine coronary arteries. Br J Pharmacol. 1998;123:968–974. doi: 10.1038/sj.bjp.0701690. doi: 10.1038/sj.bjp.0701690. [DOI] [PMC free article] [PubMed] [Google Scholar]
- 14.Chataigneau T, Félétou M, Duhault J, Vanhoutte PM. Epoxyeicosatrienoic acids, potassium channel blockers and endothelium-dependent hyperpolarization in the guinea-pig carotid artery. Br J Pharmacol. 1998;123:574–580. doi: 10.1038/sj.bjp.0701629. doi: 10.1038/sj.bjp.0701629. [DOI] [PMC free article] [PubMed] [Google Scholar]
- 15.Lamping KG, Faraci FM. Role of sex differences and effects of endothelial NO synthase deficiency in responses of carotid arteries to serotonin. Arterioscler Thromb Vasc Biol. 2001;21:523–528. doi: 10.1161/01.atv.21.4.523. [DOI] [PubMed] [Google Scholar]
- 16.Tang EH, Leung FP, Huang Y, Feletou M, So KF, Man RY, Vanhoutte PM. Calcium and reactive oxygen species increase in endothelial cells in response to releasers of endothelium-derived contracting factor. Br J Pharmacol. 2007;151:15–23. doi: 10.1038/sj.bjp.0707190. doi: 10.1038/sj.bjp.0707190. [DOI] [PMC free article] [PubMed] [Google Scholar]
- 17.Wang R, Sauvé R, de Champlain J. Abnormal regulation of cytosolic free calcium in vascular endothelial cells from spontaneously hypertensive rats. J Hypertens. 1995;13:993–1001. [PubMed] [Google Scholar]
- 18.Straub AC, Lohman AW, Billaud M, Johnstone SR, Dwyer ST, Lee MY, Bortz PS, Best AK, Columbus L, Gaston B, Isakson BE. Endothelial cell expression of haemoglobin α regulates nitric oxide signalling. Nature. 2012;491:473–477. doi: 10.1038/nature11626. doi: 10.1038/nature11626. [DOI] [PMC free article] [PubMed] [Google Scholar]
- 19.Sandow SL, Neylon CB, Chen MX, Garland CJ. Spatial separation of endothelial small- and intermediate-conductance calcium-activated potassium channels (K(Ca)) and connexins: possible relationship to vasodilator function? J Anat. 2006;209:689–698. doi: 10.1111/j.1469-7580.2006.00647.x. doi: 10.1111/j.1469-7580.2006.00647.x. [DOI] [PMC free article] [PubMed] [Google Scholar]
- 20.Sonkusare SK, Dalsgaard T, Bonev AD, Hill-Eubanks DC, Kotlikoff MI, Scott JD, Santana LF, Nelson MT. AKAP150-dependent cooperative TRPV4 channel gating is central to endothelium-dependent vasodilation and is disrupted in hypertension. Sci Signal. 2014;7:ra66. doi: 10.1126/scisignal.2005052. doi: 10.1126/scisignal.2005052. [DOI] [PMC free article] [PubMed] [Google Scholar]
- 21.Yuan Q, Yang J, Santulli G, Reiken SR, Wronska A, Kim MM, Osborne BW, Lacampagne A, Yin Y, Marks AR. Maintenance of normal blood pressure is dependent on IP3R1-mediated regulation of eNOS. Proc Natl Acad Sci USA. 2016;113:8532–8537. doi: 10.1073/pnas.1608859113. doi: 10.1073/pnas.1608859113. [DOI] [PMC free article] [PubMed] [Google Scholar]
- 22.Lin Q, Zhao L, Jing R, Trexler C, Wang H, Li Y, Tang H, Huang F, Zhang F, Fang X, Liu J, Jia N, Chen J, Ouyang K. Inositol 1,4,5-trisphosphate receptors in endothelial cells play an essential role in vasodilation and blood pressure regulation. J Am Heart Assoc. 2019;8:e011704. doi: 10.1161/JAHA.118.011704. doi: 10.1161/JAHA.118.011704. [DOI] [PMC free article] [PubMed] [Google Scholar]
- 23.Ledoux J, Taylor MS, Bonev AD, Hannah RM, Solodushko V, Shui B, Tallini Y, Kotlikoff MI, Nelson MT. Functional architecture of inositol 1,4,5-trisphosphate signaling in restricted spaces of myoendothelial projections. Proc Natl Acad Sci USA. 2008;105:9627–9632. doi: 10.1073/pnas.0801963105. doi: 10.1073/pnas.0801963105. [DOI] [PMC free article] [PubMed] [Google Scholar]
- 24.Taylor MS, Francis M. Decoding dynamic Ca(2+) signaling in the vascular endothelium. Front Physiol. 2014;5:447. doi: 10.3389/fphys.2014.00447. doi: 10.3389/fphys.2014.00447. [DOI] [PMC free article] [PubMed] [Google Scholar]
- 25.Wilson C, Lee MD, McCarron JG. Acetylcholine released by endothelial cells facilitates flow-mediated dilatation. J Physiol. 2016;594:7267–7307. doi: 10.1113/JP272927. doi: 10.1113/JP272927. [DOI] [PMC free article] [PubMed] [Google Scholar]
- 26.Wilson C, Saunter CD, Girkin JM, McCarron JG. Clusters of specialized detector cells provide sensitive and high fidelity receptor signaling in the intact endothelium. FASEB J. 2016;30:2000–2013. doi: 10.1096/fj.201500090. doi: 10.1096/fj.201500090. [DOI] [PMC free article] [PubMed] [Google Scholar]
- 27.Wilson C, Saunter CD, Girkin JM, McCarron JG. Advancing age decreases pressure-sensitive modulation of calcium signaling in the endothelium of intact and pressurized arteries. J Vasc Res. 2016;53:358–369. doi: 10.1159/000454811. doi: 10.1159/000454811. [DOI] [PMC free article] [PubMed] [Google Scholar]
- 28.Qian X, Francis M, Solodushko V, Earley S, Taylor MS. Recruitment of dynamic endothelial Ca2+ signals by the TRPA1 channel activator AITC in rat cerebral arteries. Microcirculation. 2013;20:138–148. doi: 10.1111/micc.12004. doi: 10.1111/micc.12004. [DOI] [PMC free article] [PubMed] [Google Scholar]
- 29.Thiel MA, Bock AH, Bühler FR, Lüscher TF. Intraluminal pressure modulates vascular contractility of perfused mesenteric resistance arteries. Altered response in hypertension. Am J Hypertens. 1992;5:542–547. doi: 10.1093/ajh/5.8.542. doi: 10.1093/ajh/5.8.542. [DOI] [PubMed] [Google Scholar]
- 30.Schindelin J, Arganda-Carreras I, Frise E, et al. Fiji: an open-source platform for biological-image analysis. Nat Methods. 2012;9:676–682. doi: 10.1038/nmeth.2019. doi: 10.1038/nmeth.2019. [DOI] [PMC free article] [PubMed] [Google Scholar]
- 31.van der Walt S, Schönberger JL, Nunez-Iglesias J, Boulogne F, Warner JD, Yager N, Gouillart E, Yu T scikit-image contributors. scikit-image: image processing in Python. PeerJ. 2014;2:e453. doi: 10.7717/peerj.453. doi: 10.7717/peerj.453. [DOI] [PMC free article] [PubMed] [Google Scholar]
- 32.McCarron JG, Chalmers S, MacMillan D, Olson ML. Agonist-evoked Ca(2+) wave progression requires Ca(2+) and IP(3). J Cell Physiol. 2010;224:334–344. doi: 10.1002/jcp.22103. doi: 10.1002/jcp.22103. [DOI] [PMC free article] [PubMed] [Google Scholar]
- 33.MacMillan D, McCarron JG. Regulation by FK506 and rapamycin of Ca2+ release from the sarcoplasmic reticulum in vascular smooth muscle: the role of FK506 binding proteins and mTOR. Br J Pharmacol. 2009;158:1112–1120. doi: 10.1111/j.1476-5381.2009.00369.x. doi: 10.1111/j.1476-5381.2009.00369.x. [DOI] [PMC free article] [PubMed] [Google Scholar]
- 34.Bradley KN, Currie S, MacMillan D, Muir TC, McCarron JG. Cyclic ADP-ribose increases Ca2+ removal in smooth muscle. J Cell Sci. 2003;116(pt 21):4291–4306. doi: 10.1242/jcs.00713. doi: 10.1242/jcs.00713. [DOI] [PubMed] [Google Scholar]
- 35.Olson ML, Chalmers S, McCarron JG. Mitochondrial organization and Ca2+ uptake. Biochem Soc Trans. 2012;40:158–167. doi: 10.1042/BST20110705. doi: 10.1042/BST20110705. [DOI] [PubMed] [Google Scholar]
- 36.Wilson C, Saunter CD, Girkin JM, McCarron JG. Pressure-dependent regulation of Ca2+ signalling in the vascular endothelium. J Physiol. 2015;593:5231–5253. doi: 10.1113/JP271157. doi: 10.1113/JP271157. [DOI] [PMC free article] [PubMed] [Google Scholar]
- 37.Ellefsen KL, Settle B, Parker I, Smith IF. An algorithm for automated detection, localization and measurement of local calcium signals from camera-based imaging. Cell Calcium. 2014;56:147–156. doi: 10.1016/j.ceca.2014.06.003. doi: 10.1016/j.ceca.2014.06.003. [DOI] [PMC free article] [PubMed] [Google Scholar]
- 38.Lock JT, Smith IF, Parker I. Comparison of Ca2+ puffs evoked by extracellular agonists and photoreleased IP3. Cell Calcium. 2017;63:43–47. doi: 10.1016/j.ceca.2016.11.006. doi: 10.1016/j.ceca.2016.11.006. [DOI] [PMC free article] [PubMed] [Google Scholar]
- 39.Ellefsen KL, Parker I. Dynamic Ca2+ imaging with a simplified lattice light-sheet microscope: a sideways view of subcellular Ca2+ puffs. Cell Calcium. 2018;71:34–44. doi: 10.1016/j.ceca.2017.11.005. doi: 10.1016/j.ceca.2017.11.005. [DOI] [PMC free article] [PubMed] [Google Scholar]
- 40.Eilers PHC, Boelens HFM. Baseline correction with asymmetric least squares smoothing. Leiden University Medical Centre Report. 2005 [Google Scholar]
- 41.Garland CJ, Bagher P, Powell C, Ye X, Lemmey HAL, Borysova L, Dora KA. Voltage-dependent ca(2+) entry into smooth muscle during contraction promotes endothelium-mediated feedback vasodilation in arterioles. Sci Signal. 2017;10:eaal3806. doi: 10.1126/scisignal.aal3806. [DOI] [PubMed] [Google Scholar]
- 42.French JB, Jones SA, Deng H, Pedley AM, Kim D, Chan CY, Hu H, Pugh RJ, Zhao H, Zhang Y, Huang TJ, Fang Y, Zhuang X, Benkovic SJ. Spatial colocalization and functional link of purinosomes with mitochondria. Science. 2016;351:733–737. doi: 10.1126/science.aac6054. doi: 10.1126/science.aac6054. [DOI] [PMC free article] [PubMed] [Google Scholar]
- 43.Heathcote HR, Lee MD, Zhang X, Saunter CD, Wilson C, McCarron JG. Endothelial TRPV4 channels modulate vascular tone by Ca2+ -induced Ca2+ release at inositol 1,4,5-trisphosphate receptors. Br J Pharmacol. 2019;176:3297–3317. doi: 10.1111/bph.14762. doi: 10.1111/bph.14762. [DOI] [PMC free article] [PubMed] [Google Scholar]
- 44.Francis M, Waldrup JR, Qian X, Solodushko V, Meriwether J, Taylor MS. Functional tuning of intrinsic endothelial Ca2+ dynamics in swine coronary arteries. Circ Res. 2016;118:1078–1090. doi: 10.1161/CIRCRESAHA.115.308141. doi: 10.1161/CIRCRESAHA.115.308141. [DOI] [PMC free article] [PubMed] [Google Scholar]
- 45.Dora KA, Garland CJ. Linking hyperpolarization to endothelial cell calcium events in arterioles. Microcirculation. 2013;20:248–256. doi: 10.1111/micc.12041. doi: 10.1111/micc.12041. [DOI] [PubMed] [Google Scholar]
- 46.Wilson C, Lee MD, Heathcote HR, Zhang X, Buckley C, Girkin JM, Saunter CD, McCarron JG. Mitochondrial ATP production provides long-range control of endothelial inositol trisphosphate-evoked calcium signaling. J Biol Chem. 2019;294:737–758. doi: 10.1074/jbc.RA118.005913. doi: 10.1074/jbc.RA118.005913. [DOI] [PMC free article] [PubMed] [Google Scholar]
- 47.McCarron JG, Chalmers S, Bradley KN, MacMillan D, Muir TC. Ca2+ microdomains in smooth muscle. Cell Calcium. 2006;40:461–493. doi: 10.1016/j.ceca.2006.08.010. doi: 10.1016/j.ceca.2006.08.010. [DOI] [PubMed] [Google Scholar]
- 48.Parker I, Yao Y. Regenerative release of calcium from functionally discrete subcellular stores by inositol trisphosphate. Proc Biol Sci. 1991;246:269–274. doi: 10.1098/rspb.1991.0154. doi: 10.1098/rspb.1991.0154. [DOI] [PubMed] [Google Scholar]
- 49.Olson ML, Chalmers S, McCarron JG. Mitochondrial Ca2+ uptake increases Ca2+ release from inositol 1,4,5-trisphosphate receptor clusters in smooth muscle cells. J Biol Chem. 2010;285:2040–2050. doi: 10.1074/jbc.M109.027094. doi: 10.1074/jbc.M109.027094. [DOI] [PMC free article] [PubMed] [Google Scholar]
- 50.Tran CH, Taylor MS, Plane F, Nagaraja S, Tsoukias NM, Solodushko V, Vigmond EJ, Furstenhaupt T, Brigdan M, Welsh DG. Endothelial Ca2+ wavelets and the induction of myoendothelial feedback. Am J Physiol Cell Physiol. 2012;302:C1226–C1242. doi: 10.1152/ajpcell.00418.2011. doi: 10.1152/ajpcell.00418.2011. [DOI] [PMC free article] [PubMed] [Google Scholar]
- 51.Boerman EM, Everhart JE, Segal SS. Advanced age decreases local calcium signaling in endothelium of mouse mesenteric arteries in vivo. Am J Physiol Heart Circ Physiol. 2016;310:H1091–H1096. doi: 10.1152/ajpheart.00038.2016. doi: 10.1152/ajpheart.00038.2016. [DOI] [PMC free article] [PubMed] [Google Scholar]
- 52.Cohuet G, Challande P, Osborne-Pellegrin M, Arribas SM, Dominiczak A, Louis H, Laurent S, Lacolley P. Mechanical strength of the isolated carotid artery in SHR. Hypertension. 2001;38:1167–1171. doi: 10.1161/hy1101.095995. doi: 10.1161/hy1101.095995. [DOI] [PubMed] [Google Scholar]
- 53.Boumaza S, Arribas SM, Osborne-Pellegrin M, McGrath JC, Laurent S, Lacolley P, Challande P. Fenestrations of the carotid internal elastic lamina and structural adaptation in stroke-prone spontaneously hypertensive rats. Hypertension. 2001;37:1101–1107. doi: 10.1161/01.hyp.37.4.1101. doi: 10.1161/01.hyp.37.4.1101. [DOI] [PubMed] [Google Scholar]
- 54.Bagher P, Beleznai T, Kansui Y, Mitchell R, Garland CJ, Dora KA. Low intravascular pressure activates endothelial cell TRPV4 channels, local Ca2+ events, and IKCa channels, reducing arteriolar tone. Proc Natl Acad Sci USA. 2012;109:18174–18179. doi: 10.1073/pnas.1211946109. doi: 10.1073/pnas.1211946109. [DOI] [PMC free article] [PubMed] [Google Scholar]
- 55.Hong K, Cope EL, DeLalio LJ, Marziano C, Isakson BE, Sonkusare SK. TRPV4 (Transient Receptor Potential Vanilloid 4) channel-dependent negative feedback mechanism regulates gq protein-coupled receptor-induced vasoconstriction. Arterioscler Thromb Vasc Biol. 2018;38:542–554. doi: 10.1161/ATVBAHA.117.310038. doi: 10.1161/ATVBAHA.117.310038. [DOI] [PMC free article] [PubMed] [Google Scholar]
- 56.Sonkusare SK, Bonev AD, Ledoux J, Liedtke W, Kotlikoff MI, Heppner TJ, Hill-Eubanks DC, Nelson MT. Elementary Ca2+ signals through endothelial TRPV4 channels regulate vascular function. Science. 2012;336:597–601. doi: 10.1126/science.1216283. doi: 10.1126/science.1216283. [DOI] [PMC free article] [PubMed] [Google Scholar]
- 57.Wilson CL, MD, Heathcote H, Gikin JM, Saunter CD, McCarron JG. Long-range control of endothelial ip3-evoked calcium signaling by mitochondrial atp production. Journal of Biological Chemistry. 2019;294:737–758. doi: 10.1074/jbc.RA118.005913. doi: 10.1074/jbc.RA118.005913. [DOI] [PMC free article] [PubMed] [Google Scholar]
- 58.Improta-Brears T, Whorton AR, Codazzi F, York JD, Meyer T, McDonnell DP. Estrogen-induced activation of mitogen-activated protein kinase requires mobilization of intracellular calcium. Proc Natl Acad Sci USA. 1999;96:4686–4691. doi: 10.1073/pnas.96.8.4686. doi: 10.1073/pnas.96.8.4686. [DOI] [PMC free article] [PubMed] [Google Scholar]
- 59.Fleming I, Busse R. Tyrosine phosphorylation and bradykinin-induced signaling in endothelial cells. Am J Cardiol. 1997;80:102A–109A. doi: 10.1016/s0002-9149(97)00464-5. doi: 10.1016/s0002-9149(97)00464-5. [DOI] [PubMed] [Google Scholar]
- 60.Etienne-Manneville S, Manneville JB, Adamson P, Wilbourn B, Greenwood J, Couraud PO. ICAM-1-coupled cytoskeletal rearrangements and transendothelial lymphocyte migration involve intracellular calcium signaling in brain endothelial cell lines. J Immunol. 2000;165:3375–3383. doi: 10.4049/jimmunol.165.6.3375. doi: 10.4049/jimmunol.165.6.3375. [DOI] [PubMed] [Google Scholar]
- 61.Cook-Mills JM, Johnson JD, Deem TL, Ochi A, Wang L, Zheng Y. Calcium mobilization and Rac1 activation are required for VCAM-1 (vascular cell adhesion molecule-1) stimulation of NADPH oxidase activity. Biochem J. 2004;378(pt 2):539–547. doi: 10.1042/BJ20030794. doi: 10.1042/BJ20030794. [DOI] [PMC free article] [PubMed] [Google Scholar]
- 62.Feletou M. The Endothelium: Part 1: Multiple Functions of the Endothelial Cells-Focus on Endothelium-Derived Vasoactive Mediators. San Rafael, CA: Morgan & Claypool Life Sciences; 2011. [PubMed] [Google Scholar]
- 63.Ellis A, Goto K, Chaston DJ, Brackenbury TD, Meaney KR, Falck JR, Wojcikiewicz RJ, Hill CE. Enalapril treatment alters the contribution of epoxyeicosatrienoic acids but not gap junctions to endothelium-derived hyperpolarizing factor activity in mesenteric arteries of spontaneously hypertensive rats. J Pharmacol Exp Ther. 2009;330:413–422. doi: 10.1124/jpet.109.152116. doi: 10.1124/jpet.109.152116. [DOI] [PMC free article] [PubMed] [Google Scholar]
- 64.Dal-Ros S, Bronner C, Schott C, Kane MO, Chataigneau M, Schini-Kerth VB, Chataigneau T. Angiotensin II-induced hypertension is associated with a selective inhibition of endothelium-derived hyperpolarizing factor-mediated responses in the rat mesenteric artery. J Pharmacol Exp Ther. 2009;328:478–486. doi: 10.1124/jpet.108.145326. doi: 10.1124/jpet.108.145326. [DOI] [PubMed] [Google Scholar]
- 65.Grgic I, Kaistha BP, Hoyer J, Köhler R. Endothelial Ca+-activated K+ channels in normal and impaired EDHF-dilator responses–relevance to cardiovascular pathologies and drug discovery. Br J Pharmacol. 2009;157:509–526. doi: 10.1111/j.1476-5381.2009.00132.x. doi: 10.1111/j.1476-5381.2009.00132.x. [DOI] [PMC free article] [PubMed] [Google Scholar]
- 66.Toque HA, Nunes KP, Rojas M, Bhatta A, Yao L, Xu Z, Romero MJ, Webb RC, Caldwell RB, Caldwell RW. Arginase 1 mediates increased blood pressure and contributes to vascular endothelial dysfunction in deoxycorticosterone acetate-salt hypertension. Front Immunol. 2013;4:219. doi: 10.3389/fimmu.2013.00219. doi: 10.3389/fimmu.2013.00219. [DOI] [PMC free article] [PubMed] [Google Scholar]
- 67.Hilgers RH, Webb RC. Reduced expression of SKCa and IKCa channel proteins in rat small mesenteric arteries during angiotensin II-induced hypertension. Am J Physiol Heart Circ Physiol. 2007;292:H2275–H2284. doi: 10.1152/ajpheart.00949.2006. doi: 10.1152/ajpheart.00949.2006. [DOI] [PubMed] [Google Scholar]
- 68.Drummond GR, Sobey CG. Endothelial NADPH oxidases: which NOX to target in vascular disease? Trends Endocrinol Metab. 2014;25:452–463. doi: 10.1016/j.tem.2014.06.012. doi: 10.1016/j.tem.2014.06.012. [DOI] [PubMed] [Google Scholar]
- 69.Seki T, Goto K, Kiyohara K, Kansui Y, Murakami N, Haga Y, Ohtsubo T, Matsumura K, Kitazono T. Downregulation of endothelial transient receptor potential vanilloid type 4 channel and small-conductance of Ca2+-activated K+ channels underpins impaired endothelium-dependent hyperpolarization in hypertension. Hypertension. 2017;69:143–153. doi: 10.1161/HYPERTENSIONAHA.116.07110. doi: 10.1161/HYPERTENSIONAHA.116.07110. [DOI] [PubMed] [Google Scholar]
- 70.Nausch LW, Bonev AD, Heppner TJ, Tallini Y, Kotlikoff MI, Nelson MT. Sympathetic nerve stimulation induces local endothelial Ca2+ signals to oppose vasoconstriction of mouse mesenteric arteries. Am J Physiol Heart Circ Physiol. 2012;302:H594–H602. doi: 10.1152/ajpheart.00773.2011. doi: 10.1152/ajpheart.00773.2011. [DOI] [PMC free article] [PubMed] [Google Scholar]
- 71.Sullivan MN, Gonzales AL, Pires PW, Bruhl A, Leo MD, Li W, Oulidi A, Boop FA, Feng Y, Jaggar JH, Welsh DG, Earley S. Localized TRPA1 channel Ca2+ signals stimulated by reactive oxygen species promote cerebral artery dilation. Sci Signal. 2015;8:ra2. doi: 10.1126/scisignal.2005659. doi: 10.1126/scisignal.2005659. [DOI] [PMC free article] [PubMed] [Google Scholar]
- 72.Pires PW, Earley S. Neuroprotective effects of trpa1 channels in the cerebral endothelium following ischemic stroke. Elife. 2018;7:e35316. doi: 10.7554/eLife.35316. [DOI] [PMC free article] [PubMed] [Google Scholar]
- 73.Marziano C, Hong K, Cope EL, Kotlikoff MI, Isakson BE, Sonkusare SK. Nitric oxide-dependent feedback loop regulates transient receptor potential vanilloid 4 (trpv4) channel cooperativity and endothelial function in small pulmonary arteries. J Am Heart Assoc. 2017;6:e007157. doi: 10.1161/JAHA.117.007157. [DOI] [PMC free article] [PubMed] [Google Scholar]
- 74.Collier DM, Villalba N, Sackheim A, Bonev AD, Miller ZD, Moore JS, Shui B, Lee JC, Lee FK, Reining S, Kotlikoff MI, Nelson MT, Freeman K. Extracellular histones induce calcium signals in the endothelium of resistance-sized mesenteric arteries and cause loss of endothelium-dependent dilation. Am J Physiol Heart Circ Physiol. 2019;316:H1309–H1322. doi: 10.1152/ajpheart.00655.2018. doi: 10.1152/ajpheart.00655.2018. [DOI] [PMC free article] [PubMed] [Google Scholar]
- 75.Burdyga T, Shmygol A, Eisner DA, Wray S. A new technique for simultaneous and in situ measurements of Ca2+ signals in arteriolar smooth muscle and endothelial cells. Cell Calcium. 2003;34:27–33. doi: 10.1016/s0143-4160(03)00019-8. [DOI] [PubMed] [Google Scholar]
- 76.Dohi Y, Thiel MA, Bühler FR, Lüscher TF. Activation of endothelial L-arginine pathway in resistance arteries. effect of age and hypertension. Hypertension. 1990;16:170–179. doi: 10.1161/01.hyp.16.2.170. doi: 10.1161/01.hyp.16.2.170. [DOI] [PubMed] [Google Scholar]
- 77.Miyagawa K, Ohashi M, Yamashita S, Kojima M, Sato K, Ueda R, Dohi Y. Increased oxidative stress impairs endothelial modulation of contractions in arteries from spontaneously hypertensive rats. J Hypertens. 2007;25:415–421. doi: 10.1097/HJH.0b013e3280115b96. doi: 10.1097/HJH.0b013e3280115b96. [DOI] [PubMed] [Google Scholar]
- 78.Ibarra M, López-Guerrero JJ, Mejía-Zepeda R, Villalobos-Molina R. Endothelium-dependent inhibition of the contractile response is decreased in aorta from aged and spontaneously hypertensive rats. Arch Med Res. 2006;37:334–341. doi: 10.1016/j.arcmed.2005.06.015. doi: 10.1016/j.arcmed.2005.06.015. [DOI] [PubMed] [Google Scholar]
- 79.Dohi Y, Kojima M, Sato K. Endothelial modulation of contractile responses in arteries from hypertensive rats. Hypertension. 1996;28:732–737. doi: 10.1161/01.hyp.28.5.732. doi: 10.1161/01.hyp.28.5.732. [DOI] [PubMed] [Google Scholar]
- 80.Jin X, Satoh-Otonashi Y, Zamami Y, Hobara N, Koyama T, Sun P, Li S, Kitamura Y, Kawasaki H. Age-related disappearance of the inhibitory effect of vascular endothelium on agonist-induced vasoconstriction in rat mesenteric vascular beds. J Pharmacol Sci. 2009;111:372–380. doi: 10.1254/jphs.09183fp. [DOI] [PubMed] [Google Scholar]
- 81.Lang MG, Noll G, Lüscher TF. Effect of aging and hypertension on contractility of resistance arteries: modulation by endothelial factors. Am J Physiol. 1995;269(3)(pt 2):H837–H844. doi: 10.1152/ajpheart.1995.269.3.H837. doi: 10.1152/ajpheart.1995.269.3.H837. [DOI] [PubMed] [Google Scholar]
- 82.Konishi M, Su C. Role of endothelium in dilator responses of spontaneously hypertensive rat arteries. Hypertension. 1983;5:881–886. doi: 10.1161/01.hyp.5.6.881. doi: 10.1161/01.hyp.5.6.881. [DOI] [PubMed] [Google Scholar]
- 83.Winquist RJ, Bunting PB, Baskin EP, Wallace AA. Decreased endothelium-dependent relaxation in New Zealand genetic hypertensive rats. J Hypertens. 1984;2:541–545. doi: 10.1097/00004872-198410000-00015. doi: 10.1097/00004872-198410000-00015. [DOI] [PubMed] [Google Scholar]
- 84.Lüscher TF, Vanhoutte PM. Endothelium-dependent contractions to acetylcholine in the aorta of the spontaneously hypertensive rat. Hypertension. 1986;8:344–348. doi: 10.1161/01.hyp.8.4.344. doi: 10.1161/01.hyp.8.4.344. [DOI] [PubMed] [Google Scholar]
- 85.Yang D, Gluais P, Zhang JN, Vanhoutte PM, Félétou M. Endothelium-dependent contractions to acetylcholine, ATP and the calcium ionophore A 23187 in aortas from spontaneously hypertensive and normotensive rats. Fundam Clin Pharmacol. 2004;18:321–326. doi: 10.1111/j.1472-8206.2004.00247.x. doi: 10.1111/j.1472-8206.2004.00247.x. [DOI] [PubMed] [Google Scholar]
- 86.Lüscher TF, Aarhus LL, Vanhoutte PM. Indomethacin improves the impaired endothelium-dependent relaxations in small mesenteric arteries of the spontaneously hypertensive rat. Am J Hypertens. 1990;3:55–58. doi: 10.1093/ajh/3.1.55. doi: 10.1093/ajh/3.1.55. [DOI] [PubMed] [Google Scholar]
- 87.Takase H, Dohi Y, Kojima M, Sato K. Changes in the endothelial cyclooxygenase pathway in resistance arteries of spontaneously hypertensive rats. J Cardiovasc Pharmacol. 1994;23:326–330. [PubMed] [Google Scholar]
- 88.Auch-Schwelk W, Katusić ZS, Vanhoutte PM. Nitric oxide inactivates endothelium-derived contracting factor in the rat aorta. Hypertension. 1992;19:442–445. doi: 10.1161/01.hyp.19.5.442. doi: 10.1161/01.hyp.19.5.442. [DOI] [PubMed] [Google Scholar]
- 89.Vanhoutte PM, Boulanger CM. Endothelium-dependent responses in hypertension. Hypertens Res. 1995;18:87–98. doi: 10.1291/hypres.18.87. [DOI] [PubMed] [Google Scholar]
- 90.Fu-Xiang D, Jameson M, Skopec J, Diederich A, Diederich D. Endothelial dysfunction of resistance arteries of spontaneously hypertensive rats. J Cardiovasc Pharmacol. 1992;20(suppl 12):S190–S192. doi: 10.1097/00005344-199204002-00053. doi: 10.1097/00005344-199204002-00053. [DOI] [PubMed] [Google Scholar]
- 91.Chang HR, Lee RP, Wu CY, Chen HI. Nitric oxide in mesenteric vascular reactivity: a comparison between rats with normotension and hypertension. Clin Exp Pharmacol Physiol. 2002;29:275–280. doi: 10.1046/j.1440-1681.2002.03643.x. doi: 10.1046/j.1440-1681.2002.03643.x. [DOI] [PubMed] [Google Scholar]
- 92.Félétou M, Verbeuren TJ, Vanhoutte PM. Endothelium-dependent contractions in SHR: a tale of prostanoid TP and IP receptors. Br J Pharmacol. 2009;156:563–574. doi: 10.1111/j.1476-5381.2008.00060.x. doi: 10.1111/j.1476-5381.2008.00060.x. [DOI] [PMC free article] [PubMed] [Google Scholar]
- 93.Li J, Bukoski RD. Endothelium-dependent relaxation of hypertensive resistance arteries is not impaired under all conditions. Circ Res. 1993;72:290–296. doi: 10.1161/01.res.72.2.290. doi: 10.1161/01.res.72.2.290. [DOI] [PubMed] [Google Scholar]
- 94.Fujii K, Ohmori S, Tominaga M, Abe I, Takata Y, Ohya Y, Kobayashi K, Fujishima M. Age-related changes in endothelium-dependent hyperpolarization in the rat mesenteric artery. Am J Physiol. 1993;265(2)(pt 2):H509–H516. doi: 10.1152/ajpheart.1993.265.2.H509. doi: 10.1152/ajpheart.1993.265.2.H509. [DOI] [PubMed] [Google Scholar]
- 95.Watt PA, Thurston H. Endothelium-dependent relaxation in resistance vessels from the spontaneously hypertensive rats. J Hypertens. 1989;7:661–666. doi: 10.1097/00004872-198908000-00010. doi: 10.1097/00004872-198908000-00010. [DOI] [PubMed] [Google Scholar]
- 96.Wirth KJ, Linz W, Wiemer G, Schölkens BA. Differences in acetylcholine- and bradykinin-induced vasorelaxation of the mesenteric vascular bed in spontaneously hypertensive rats of different ages. Naunyn Schmiedebergs Arch Pharmacol. 1996;354:38–43. doi: 10.1007/BF00168704. doi: 10.1007/bf00168704. [DOI] [PubMed] [Google Scholar]
- 97.Wei R, Lunn SE, Tam R, Gust SL, Classen B, Kerr PM, Plane F. Vasoconstrictor stimulus determines the functional contribution of myoendothelial feedback to mesenteric arterial tone. J Physiol. 2018;596:1181–1197. doi: 10.1113/JP274797. doi: 10.1113/JP274797. [DOI] [PMC free article] [PubMed] [Google Scholar]
- 98.Izzard AS, Bund SJ, Heagerty AM. Myogenic tone in mesenteric arteries from spontaneously hypertensive rats. Am J Physiol. 1996;270(1)(pt 2):H1–H6. doi: 10.1152/ajpheart.1996.270.1.H1. doi: 10.1152/ajpheart.1996.270.1.H1. [DOI] [PubMed] [Google Scholar]
- 99.Rahman A, Hughes A, Matchkov V, Nilsson H, Aalkjaer C. Antiphase oscillations of endothelium and smooth muscle [Ca2+]i in vasomotion of rat mesenteric small arteries. Cell Calcium. 2007;42:536–547. doi: 10.1016/j.ceca.2007.01.007. doi: 10.1016/j.ceca.2007.01.007. [DOI] [PubMed] [Google Scholar]
- 100.Stephenson JA, Summers RJ. Autoradiographic analysis of receptors on vascular endothelium. Eur J Pharmacol. 1987;134:35–43. doi: 10.1016/0014-2999(87)90128-2. doi: 10.1016/0014-2999(87)90128-2. [DOI] [PubMed] [Google Scholar]
- 101.Daly CJ, Ross RA, Whyte J, Henstridge CM, Irving AJ, McGrath JC. Fluorescent ligand binding reveals heterogeneous distribution of adrenoceptors and ‘cannabinoid-like’ receptors in small arteries. Br J Pharmacol. 2010;159:787–796. doi: 10.1111/j.1476-5381.2009.00608.x. doi: 10.1111/j.1476-5381.2009.00608.x. [DOI] [PMC free article] [PubMed] [Google Scholar]
- 102.Shafaroudi MM, McBride M, Deighan C, Wokoma A, Macmillan J, Daly CJ, McGrath JC. Two “knockout” mouse models demonstrate that aortic vasodilatation is mediated via alpha2a-adrenoceptors located on the endothelium. J Pharmacol Exp Ther. 2005;314:804–810. doi: 10.1124/jpet.105.085944. doi: 10.1124/jpet.105.085944. [DOI] [PubMed] [Google Scholar]
- 103.Daly CJ, McGrath JC. Previously unsuspected widespread cellular and tissue distribution of β-adrenoceptors and its relevance to drug action. Trends Pharmacol Sci. 2011;32:219–226. doi: 10.1016/j.tips.2011.02.008. doi: 10.1016/j.tips.2011.02.008. [DOI] [PubMed] [Google Scholar]
- 104.Dora KA, Doyle MP, Duling BR. Elevation of intracellular calcium in smooth muscle causes endothelial cell generation of NO in arterioles. Proc Natl Acad Sci USA. 1997;94:6529–6534. doi: 10.1073/pnas.94.12.6529. doi: 10.1073/pnas.94.12.6529. [DOI] [PMC free article] [PubMed] [Google Scholar]
- 105.Schuster A, Oishi H, Bény JL, Stergiopulos N, Meister JJ. Simultaneous arterial calcium dynamics and diameter measurements: application to myoendothelial communication. Am J Physiol Heart Circ Physiol. 2001;280:H1088–H1096. doi: 10.1152/ajpheart.2001.280.3.H1088. doi: 10.1152/ajpheart.2001.280.3.H1088. [DOI] [PubMed] [Google Scholar]
- 106.Tuttle JL, Falcone JC. Nitric oxide release during alpha1-adrenoceptor-mediated constriction of arterioles. Am J Physiol Heart Circ Physiol. 2001;281:H873–H881. doi: 10.1152/ajpheart.2001.281.2.H873. doi: 10.1152/ajpheart.2001.281.2.H873. [DOI] [PubMed] [Google Scholar]
- 107.Jackson WF, Boerman EM, Lange EJ, Lundback SS, Cohen KD. Smooth muscle alpha1D-adrenoceptors mediate phenylephrine-induced vasoconstriction and increases in endothelial cell Ca2+ in hamster cremaster arterioles. Br J Pharmacol. 2008;155:514–524. doi: 10.1038/bjp.2008.276. doi: 10.1038/bjp.2008.276. [DOI] [PMC free article] [PubMed] [Google Scholar]
- 108.Kansui Y, Garland CJ, Dora KA. Enhanced spontaneous Ca2+ events in endothelial cells reflect signalling through myoendothelial gap junctions in pressurized mesenteric arteries. Cell Calcium. 2008;44:135–146. doi: 10.1016/j.ceca.2007.11.012. doi: 10.1016/j.ceca.2007.11.012. [DOI] [PMC free article] [PubMed] [Google Scholar]
- 109.Schiffrin EL. Reactivity of small blood vessels in hypertension: relation with structural changes. State of the art lecture. Hypertension. 1992;19(2)(suppl):II1–II9. doi: 10.1161/01.hyp.19.2_suppl.ii1-a. doi: 10.1161/01.hyp.19.2_suppl.ii1-a. [DOI] [PubMed] [Google Scholar]
- 110.Heagerty AM, Aalkjaer C, Bund SJ, Korsgaard N, Mulvany MJ. Small artery structure in hypertension. dual processes of remodeling and growth. Hypertension. 1993;21:391–397. doi: 10.1161/01.hyp.21.4.391. doi: 10.1161/01.hyp.21.4.391. [DOI] [PubMed] [Google Scholar]
- 111.Schiffrin EL. Mechanisms of remodelling of small arteries, antihypertensive therapy and the immune system in hypertension. Clin Invest Med. 2015;38:E394–E402. doi: 10.25011/cim.v38i6.26202. [DOI] [PubMed] [Google Scholar]
- 112.Mulvany MJ. Small artery remodelling in hypertension. Basic Clin Pharmacol Toxicol. 2012;110:49–55. doi: 10.1111/j.1742-7843.2011.00758.x. doi: 10.1111/j.1742-7843.2011.00758.x. [DOI] [PubMed] [Google Scholar]
- 113.Mulvany MJ, Halpern W. Contractile properties of small arterial resistance vessels in spontaneously hypertensive and normotensive rats. Circ Res. 1977;41:19–26. doi: 10.1161/01.res.41.1.19. doi: 10.1161/01.res.41.1.19. [DOI] [PubMed] [Google Scholar]