

ABSTRACT
Spinal cord injury (SCI) is a catastrophic disease which has complicated pathogenesis including inflammation, oxidative stress and glial scar formation. Astrocytes are the most abundant cells in central nervous system and fulfill homeostatic functions. Recent studies have described a new reactive phenotype of astrocytes, A1, induced by inflammation, which may have negative effects in SCI. As the Notch signaling pathway has been linked to cell differentiation and inflammation, we aimed to investigate its potential role in the differentiation of astrocytes in SCI. Contusive SCI rat model showed elevated A1 astrocyte numbers at the damage site 28 days after SCI and the expression levels of Notch signaling and its downstream genes were upregulated parallelly. Western blotting, RT-qPCR and immunofluorescence revealed that blocking of Notch pathway using γ-secretase blocker (DAPT) suppressed the differentiation of A1 astrocytes. Flow cytometry, and TUNEL staining indicated that DAPT alleviated neuronal apoptosis and axonal damage caused by A1 astrocytes likely through the Notch-dependent release of pro-inflammatory factors. CO-IP and western blotting revealed an interaction between Notch pathway and signal transducer and activator of transcription 3 (Stat3), which played a vital role in differentiation of A1 astrocytes. We conclude that phenotypic transition of A1 astrocytes and their neurotoxity were controlled by the Notch-Stat3 axis and that Notch pathway in astrocytes may serve as a promising therapeutic target for SCI.
KEYWORDS: Spinal cord injury, A1 astrocytes, Notch signaling, Stat3, DAPT
Introduction
Spinal cord injury (SCI) often leads to permanent functional deficits and catastrophic consequences for patients’ quality of life [1]. The global incidence of SCI is high; for instance, there are an average of 30.0 − 40.0 cases per million in the United States and 23.7 − 60.6 cases per million in China [2,3]. The pathogenesis of SCI can be divided into two phases, primary injury due directly to the precipitating event (e.g. trauma, ischemia) and delayed secondary injury. Unlike primary damage, secondary injury is a gradual process involving a series of pathological events including inflammation [1,4,5], oxidative stress [6,7], and glial scar formation [8], and so is potentially reversible during the post-SCI therapeutic window. Nonetheless, secondary injury is still ubiquitous following SCI as many of the specific molecular mechanisms and potential therapeutic targets remain unclear.
Astrocytes, as the most abundant cells in the CNS, provide trophic support for neurons, promote synapse formation and function, prune synapses through phagocytosis, and fulfill a range of other homeostatic functions including regulation of neuronal metabolite supply, extracellular ion regulation, and transmitter uptake/recycling [9,10]. Under pathological conditions such as injury, infection, and ischemia, astrocytes are transformed to a reactive phenotype accompanied by marked changes in cell morphology and function [11]. While there is still no consensus definition of reactive astrocytes, recent studies have described two distinct reactive phenotypes, A1 induced by neuroinflammation and A2 induced by ischemia [12]. Inflammation-related A1 astrocytes lose normal cellular functions and exert cytotoxic effects on local neurons and oligodendrocytes. In neurodegenerative disorders such as Alzheimer’s disease (AD), Huntington’s disease, Parkinson’s disease, amyotrophic lateral sclerosis, and multiple sclerosis (MS), the appearance of A1 astrocytes is strongly associated with pathogenic progression [12–14]. Similar to neurodegenerative diseases, SCI is accompanied by persistent inflammation, including acute and chronic phases, but the pathogenic functions of A1 astrocytes in SCI are not well defined.
The Notch pathway is an evolutionarily conserved signaling mechanism regulating differentiation, proliferation, and apoptosis [15–17]. Notch signaling involves the binding of membrane Notch receptors to ligands expressed on adjacent cell membranes and subsequent downstream activation of intracellular transcription factors, regulatory molecules, and various other effector molecules [18]. After a ligand binds to the Notch receptor, the notch intracellular domain (NICD) is cleaved by γ-secretase and released into the cytoplasm. Once released from the receptor, NICD enters the nucleus and interacts with the transcription factor RBP-J, which promotes the expression of transcriptional activators and thereby induces the expression of target genes, mainly hairy and enhancer of split (Hes) isoforms 1 and 5 [19–22]. Therefore, γ-secretase is the key enzyme in Notch pathway activation and its specific inhibitor DAPT can block activation of Notch signaling [19,22,23]. Using this strategy, numerous studies have shown that Notch signaling is crucial for neurogenesis, gliogenesis, and neuritogenesis [24–26]. While Notch functions in differentiated glial cells are not fully understood, hypertrophic astrocytes express the Notch ligand Jag-1 in vivo [27]. Furthermore, the Notch pathway regulates the proliferation of reactive astrocytes after brain injury and stroke [28,29]. However, the contributions of Notch signaling to activation of A1 astrocytes after SCI have not been explored.
Signal transducer and activator of transcription 3 (Stat3) is an important transcription factor in reactive astrocytes. Activation of Stat3 via phosphorylation by Janus kinases (JAKs) [30] has been demonstrated in a variety of disease models, including stroke [31], AD [32], and SCI [33,34]. In addition, astrocyte phenotype in AD model mice could be switched from A1 to A2 by Stat3 deletion [14]. Numerous studies have demonstrated a strong association between Notch and Stat3 signaling. Notably, a change in Notch expression can alter Stat3 phosphorylation and activity [28,35,36], suggesting that Notch signaling can alter astrocyte phenotype by affecting Stat3 activity and function.
In this study, we investigated A1 astrocyte transformation and Notch signing in a rat model of SCI and then elucidated the signaling pathways underlying transformation and neurotoxicity in astrocyte and neuronal cultures treated with various conditioned media.
Materials and methods
Reagents and antibodies
The microglial activator lipopolysaccharide (LPS) was purchased from Sigma-Aldrich (St. Louis, MO, USA). The γ-secretase blocker (Notch antagonist) DAPT and JSI-124 (inhibitor of p-Stat3) were from MedChem Express (Monmouth Junction, NJ, USA). Primary antibodies used in this study included rat anti-C3 (Abcam, Cambridge, UK), rabbit anti-GFAP (Abcam), rabbit anti-Hey1 (Abcam), rabbit anti-Hes1 (Abcam), rabbit anti-NICD (Cell Signaling Technology, Danvers, MA, USA), mouse anti-NICD (Santa Cruz; Dallas, Texas, USA), mouse anti-Notch-1 (Abcam), mouse anti-GAPDH (Santa Cruz), mouse anti-STAT3 (Cell Signaling Technology), mouse anti-pSTAT3 (Cell Signaling Technology) and anti-rabbit MAP2 (Cell Signaling Technology). Horseradish peroxidase (HRP)-conjugated goat anti-rabbit IgG (H + L) and HRP-conjugated goat anti-mouse IgG (H + L) for immunoblotting were purchased from Invitrogen (Carlsbad, CA, USA). Alexa Fluor 488 and 594 conjugated to goat anti-mouse IgG (H + L) or goat anti-rabbit IG for immunofluorescence staining were obtained from Jackson ImmunoResearch (West Grove, PA, USA). Cyrm3-conjugated AffiniPure donkey anti-rat IgG (H + L) was also obtained from Jackson ImmunoResearch. Nuclei were counterstained with DAPI dihydrochloride (Thermo Fisher Scientific). ELISA kits for TNF-α and IL-1α were purchased from Abcam (San Francisco, CA, USA) and a C1q ELISA kit from Hycult Biotech (Plymouth Meeting, PA, USA). The DeadEnd™ Fluorometric TUNEL System was purchased from Promega (Madison, WI, USA). ProteinA/G Magnetic Beads for co-immunoprecipitation (co-IP) were obtained from Pierce Biotechnology (Rockford, IL, USA). An Annexin V-FITC Kit for detection of apoptosis was purchased from Biouniquer Technology (China).
Primary astrocyte cultures and treatment
Primary astrocyte cultures were prepared from the brains of 1 − 3-day-old Sprague-Dawley (SD) rats according to an established protocol [37]. Briefly, pups were decapitated following sterilization of the head and neck with 70% ethanol. The whole brain was removed from the cranial cavity, placed on an ice box, and covered with Dulbecco’s modified Eagles medium (DMEM)/F12 (Gibco Laboratory, Grand Island, NY). The meninges were carefully stripped off under a stereomicroscope and the isolated brain tissues were cut into 1 mm3 pieces using sharp blades. Tissue pieces were transferred to 0.25% trypsin-EDTA solution (Thermo Fisher Scientific) and incubated for 10 min under gentle shaking. The trypsinization reaction was stopped by adding DMEM/F12 (Gibco) supplemented with 10% heat-inactivated fetal bovine serum (FBS, Gibco), 1% penicillin and streptomycin solution (Gibco), 2 mM L-glutamine (Gibco), 100 µM non-essential amino acids (Gibco), and 2 mM sodium pyruvate (Gibco) (referred to as DMEM/F12 complete medium). Digested tissues were centrifuged at 300 g for 5 min, the supernatant removed carefully, and the tissue pellet resuspended in DMEM/F12. Tissues were dissociated into a single-cell suspension by repeated passage through a 100-µm nylon mesh. The final single-cell suspension was cultured in T75 flasks to obtain primary mixed glial cell cultures, which were precoated with 1 ml/well poly-L-lysine (Sigma) overnight and washed with PBS three times and dried before use. The cell culture medium was changed 2 days after plating and every 3 days thereafter until astrocytes reached confluence, which usually occurred after 7 − 8 days in vitro (DIV). Confluent cultures were shaken at 180 rpm for 30 min on an orbital shaker to remove microglia. The mixed glial cultures were then treated with 20 ml fresh astrocyte culture medium (20 ml) and shaken again at 240 rpm for 6 h to remove oligodendrocyte precursor cells (OPCs). The remaining astrocytes were then used for further experiments. At this stage, immunostaining revealed that cultures were more than 95% positive for the astrocyte marker glial fibrillary acid protein (GFAP) (Figure S1B). These astrocytes were then treated with microglial conditioned medium (MCM, preparation described below) for 12, 24, and 48 h to produce activated astrocytes. The MCM collected after 24 h was used as astrocyte conditioned medium (ACM). Alternatively, some astrocyte cultures were treated for 24 h with MCM plus DAPT. This medium was also recovered and is referred to as ACM+DAPT. Other astrocyte cultures were treated with MCM plus the JAK/Stat inhibitor JSI-124 (0.2 µM or 0.5 µM). Before experiments, all astrocytes were incubated with serum-free DMEM/F12 for 24 h to mitigate serum effects.
Preparation of primary microglia cultures and MCM
Primary mixed glial cell cultures were prepared as described above, but the flasks were left undisturbed (no shaking) until 14 DIV when microglia reach maturity [38]. Then the flasks were shaken at 200 rpm for 2 h at room temperature to remove the microglial layer, leaving the underlying astrocyte layer exposed. The supernatants (containing mature microglia) were collected and plated in 24-well or 6-well culture plates precoated with poly-L-lysine. The cell culture medium was changed 4 h after plating and every 3 days thereafter. The cultures were maintained at 37°C in a 5% CO2-humidified atmosphere for 2 − 3 days. Cell phenotype was then examined by immunostaining for the microglial/macrophage marker F480 using rat anti-F480 (1:200; Santa Cruz) under a fluorescence microscope (Figure S1A). After primary microglia were firmly attached to the wells, the culture medium was discarded and cells were gently washed with phosphate buffered saline (PBS) to remove residual serum. Microglia were then incubated with serum-free DMEM/F12 for 24 h. Next, the medium was exchanged for serum-free medium containing LPS (1 µg/ml) and cells incubated for another 24 h. The conditioned medium from these LPS-treated (activated) microglia was then collected as the MCM. The collected MCM was filtered using 0.22-µm pore filters to remove impurities and cell debris, and stored at −80°C until use. Under these storage conditions, activity lasted about 2 weeks.
Cell viability assay
The Cell Counting Kit-8 (CCK-8, Dojindo, Kumamoto, Japan) was used to examine the effects of DAPT treatment on astrocyte proliferation and neuronal viability. After1, 2 and 3 days (astrocytes) or 24 h (neurons) incubation with different concentrations of DAPT (0, 5, 10, 20 µM) in DMEM/F12 complete medium, the cells were rinsed three times with 1× PBS to remove residual serum and drugs. Then, CCK-8 solution (10 µL; 1:10 diluted) in serum-free DMEM was added and the cells incubated for 4 h at 37°C under darkness. The optical absorbance at 450 nm was measured using an absorbance microplate reader (ELx800, Bio-Tek, USA) as an estimate of viable cell number. Appropriate concentration of DAPT (10 μM) was used at subsequent experiments (Figure S2A, B).
Primary neuron cultures and treatment
Primary neuronal cultures were prepared from embryonic day (E)16 SD rats as previously described [39] and cultured in Neurobasal medium (Thermo Fisher Scientific) supplemented with 2% (w/v) B-27 (Gibco), 1% L-glutamine (Gibco), 100 IU/ml penicillin, and 100 mg/ml streptomycin. Neurons were examined by immunostaining using rabbit anti-MAP2 (Figure S1C) (1: 200, Cell signaling). Neurons were seeded at 6 × 10⁴/ml in 24-well culture plates precoated with poly-L-lysine for TUNEL staining and Annexin V-FITC/PI double staining or at 2 × 10⁶/ml in 6-well culture plates for western blot assays and RT-qPCR. Half of the culture medium was changed every 3 − 4 days. After 7 days, neurons were incubated with ACM, ACM+DAPT, or control medium with or without 10 µM DAPT as indicated for 24 h.
Flow cytometry (FCM) analysis
After incubation with ACM or ACM+DAPT for 24 h, neuronal apoptosis was estimated using a Annexin V-FITC/PI Kit (Biouniquer Technology, China) according to the manufacturer’s instructions. In brief, the culture medium was removed followed by three washes with 1 × PBS. Neurons were then deplated using 0.25% trypsin to prepare a single-cell suspension. The suspension was rinsed twice with PBS, resuspended in 100 µL Binding buffer at 2 − 5 × 10⁵ cells/ml, and then stained with 10 µL Annexin V-FITC and 5 µL propidium iodide (PI) solution at 37°C under darkness for 10 min. Finally, the suspension was analyzed by flow cytometry (FACSCalibur, BD Biosciences, Franklin Lakes, NJ, USA). Cell status was defined according to staining pattern as follows: live (FITC−PI−), early apoptotic (FITC+PI+), late apoptotic (FITC+PI−low), and necrotic (FITC−PI+).
Immunofluorescence staining
After the indicated treatments, spinal cord tissues, cultured astrocytes, and cultured neurons were fixed with 4% paraformaldehyde for 20 min at 4°C, washed three times with 1 × PBS, permeabilization with 0.3% Triton X-100 for 20 min, and blocked in 10% normal goat serum for 0.5 h. Fixed tissues and cells were then incubated at 4°C overnight with primary antibodies against the following proteins: C3 (1: 50), GFAP (1: 2000), NICD (1: 200), Hes1 (1: 200), Notch-1 (1:200) and MAP2 (1:200). After three washes with 1 × PBS, immunolabeled cells or tissues were incubated with Alexa Flour 488 – and Alexa Flour 594-conjugated goat secondary antibody (Jackson) or Cyrm3-conjugated AffiniPure donkey secondary antibody (Jackson) for 2 h at room temperature under darkness. After washing three times with PBS, nuclei were counterstained with DAPI (Thermo Fisher Scientific) for 20 min. Fluorescent images were obtained using an epifluorescence microscope (AxioVertA1 and ImagerA2) or a confocal fluorescence microscope (LSM510; Carl Zeiss). All spinal cord tissues examined by immunofluorescence staining were obtained on day 3 and day 28 post-SCI (protocol described below). All astrocytes and neurons were stained after treatment for 24 h with the indicated conditioned medium or drugs as described.
In vitro apoptotic assay (TUNEL staining)
After incubation with ACM or ACM+DAPT for 24 h, neurons were subjected to terminal deoxynucleotidyl transferase dUTP nick end labeling (TUNEL) staining according to the manufacturer’s instructions. Briefly, cells were stained with TUNEL reaction mixture (Promega) at 37°C for 30min in the dark and the nuclei were counterstained with DAPI for 5min. The proportion of TUNEL-positive neurons was counted in randomly selected fields of view under a fluorescence microscope (Axio Vert.A1 and Imager A2; Carl Zeiss Microscopy GmbH, Jena, Germany).
Western blot analysis
Total proteins were extracted from astrocytes after 24 or 48 h and from neurons after 24 h of the indicated treatment. The culture medium was discarded and the cells were washed twice with 1 × PBS to remove impurities. The cells were then lysed in RIPA extraction buffer (KeyGen Biotechnology, Shanghai, China) on ice for 1 h at 4°C under gentle shaking. The lysate was centrifuged at 14,000 rpm for 15 min and the supernatant containing soluble proteins collected. Total supernatant protein concentration was quantified using a BCA assay kit (Thermo Scientific, Waltham, MA) according to the manufacturer’s instructions. The samples were diluted 4:5 (v/v) in sodium dodecyl sulfate (SDS) sample buffer and separated at 40 μg per gel lane by 12% SDS−polyacrylamide gel electrophoresis (120 V for 70 min). Separated proteins were transferred to polyvinylidene difluoride (PVDF) membranes (SEQ00010; EMD; Millipore Corp, USA). The membranes were blocked with 5% bovine serum albumin (BSA) followed by incubation overnight at 4°C with primary antibodies against C3 (1:250), Notch-1 (1:1000), NICD (1:1000), Hes1 (1:1000), Hey1 (1:1000), Bax (1:1000), cleaved-caspase 3 (1:1000), Bcl-2 (1:1000), Stat3 (1:1000), p-Stat3 (1:1000) and GAPDH (1:1000, used as the gel loading control). Finally, the membranes were incubated with HRP-conjugated secondary antibody for 2 h at room temperature. Protein bands were visualized using enhanced chemiluminescence reagent (Pierce Biotechnology) and the expression of target proteins semi-quantified using ImageJ (National Institutes of Health, Bethesda, MD, USA). The proteins in spinal cord tissues were determined in the same way using samples obtained 3 and 28 days post-injury.
Co-immunoprecipitation (co-IP)
After 24 h treatment, astrocytes were rinsed once with ice-cold PBS and lysed in 1 ml ice-cold buffer A (20 mM TrisHCl, pH 7.4, 150 mM NaCl, 1% Triton X-100, 0.5% sodium deoxycholate, 12 mM glycerophosphate, 10 mM sodium fluoride, 5 mM EGTA, 2 mM sodium vanadate, 1 mM PMSF, 2 mg/ml aprotinin, and 2 mg/ml leupeptin) for 30 min. Lysates were centrifuged at 14,000 rpm for 15 min and the supernatants collected. The supernatants were then immunoprecipitated with the indicated antibodies overnight at 4°C using protein A/G Magnetic Beads. The beads were rinsed three times with buffer A and the eluent proteins subjected to 12% SDS-PAGE and electrotransferred to nitrocellulose membranes for immunoblotting.
Real-time reverse transcription polymerase chain reaction (RT-qPCR)
Total RNA was extracted from astrocytes after 12, 24, and 48 h of the indicated treatment using Trizol Reagent (Invitrogen) according to the manufacturer’s instructions to study changes in Notch1, Hey1, and Hes1 mRNA expression. Total RNA was also obtained from astrocytes or microglia treated for 24 h to detect mRNA expression levels of inflammatory factors and astrocyte phenotype markers. Total RNA concentrations were measured by a Biometra Optical Thermocycler (Analytik Jena, Goettingen, Germany). RNA (500 ng) was reverse transcribed into cDNA using the High Capacity cDNA Reverse Transcription Kit (Thermo Fisher Scientific) according to the manufacturer’s instruction. The primer sequences used for qPCR amplification were:
| C3: 5ʹ-CCAGCTCCCCATTAGCTCTG-3ʹ (forward) and |
| 5ʹ-GCACTTGCCTCTTTAGGAAGTC-3ʹ (reverse); |
| GAPDH: 5ʹ-TTGTCATGGGAGTGAACGAGA-3ʹ (forward) and |
| 5ʹ-CAGGCAGTTGGTGGTACAGG-3ʹ (reverse); |
| Amigo2: 5ʹ-GTTCGCCACAACAACATCAC-3ʹ (forward) and |
| 5ʹ-GTTTCTGCAAGTGGGAGAGC-3ʹ (reverse) |
| Tm4sf1: 5ʹ-CTGAGGGACAGTACCTTCTGGATTC-3ʹ (forward) and |
| 5ʹ-GGCTAGGCCTCAACACAGTTA-3ʹ (reverse) |
| IL6: 5ʹ-TAGTCCTTCCTACCCCAATTTCC-3ʹ (forward) and |
| 5ʹ-TTGGTCCTTAGCCACTCCTTC-3ʹ (reverse). |
| C1q: 5ʹ-TCTGCACTGTACCCGGCTA-3ʹ (forward) and |
| 5ʹ-CCCTGGTAAATGTGACCCTTTT-3ʹ (reverse). |
| IL1α: 5ʹ-GCACCTTACACCTACCAGAGT-3ʹ (forward) and |
| 5ʹ-AAACTTCTGCCTGACGAGCTT-3ʹ (reverse). |
| TNF-α: 5ʹ-CCCTCACACTCAGATCATCTTCT-3ʹ (forward) and |
| 5ʹ-GCTACGACGTGGGCTACAG-3ʹ (reverse). |
| IL1β: 5ʹ-GCAACTGTTCCTGAACTCAACT-3ʹ (forward) and |
| 5ʹ-ATCTTTTGGGGTCCGTCAACT-3ʹ (reverse). |
| Hey1: 5ʹ-CCACGCTCCGCCACCATGAA-3ʹ (forward) and |
| 5ʹ-CGGCGCTTCTCGATGATGCCT-3ʹ (reverse). |
| Hes1: 5ʹ-AACCAAAGACAGCATCTGAGCAC-3ʹ (forward) and |
| 5ʹ-TGTAGACCATGTAGTTGAGGTCA-3ʹ (reverse). |
| Notch1: 5ʹ-TTATGTAGTTGTTCGTTGGTTA-3ʹ (forward) and |
| 5ʹ-AAAGGGTAGGATGCCTCCGTGT-3ʹ (reverse). |
| MAP2: 5ʹ-TCTGCACACTCACATCCACC-3ʹ (forward) and |
| 5ʹ-CTGAGGTCAGCTCTCCGTTG-3ʹ (reverse). |
| Serping1: 5ʹ-AGAGAGCTTCCCTGAAAGAGATG-3ʹ (forward) and |
| 5ʹ-TGAGGAGGCTGGCAATGCTGA-3ʹ (reverse). |
| Ligp1: 5ʹ-TTGCTGCTGACCTAGTGAAT-3ʹ (forward) and |
| 5ʹ-GTCCCTAGCTAATCTCTGCAAA-3ʹ (reverse). |
| Sphk1: 5ʹ-CCTTCCTCCTTCCCTAGGG-3ʹ (forward) and |
| 5ʹ-TAGAAGGCCTTACATAGGCAGC-3ʹ (reverse). |
| Slc10a6: 5ʹ-GGGTCCTCCTTCTGGTGGT-3ʹ (forward) and |
| 5ʹ-GCCAAGACTGGTGGGTAAAA’ (reverse). |
| LCN2: 5ʹ-CCACCACGGACTACAACCAG-3ʹ (forward) and |
| 5ʹ-AGCTCCTTGGTTCTTCCATACA-3ʹ (reverse). |
| Cxcl10: 5ʹ-TCGTGCTGCTAGTCTGAGT-3ʹ (forward) and |
| 5ʹ-CAACATGCGGACAGGATAGA-3ʹ (reverse). |
Quantitative real-time PCR was performed using SYBR qRCR premix (Takara, Kyoto, Japan) according to the manufacturer’s instructions. Cycling conditions were an initial denaturation at 95°C for 30 s, followed by 40 cycles at 95°C for 5 s, 60°C for 30 s, and 72°C for 10 min. Target gene expression was normalized to GAPDH expression (internal control) using the ∆∆CT method.
ELISA
The concentrations of C1q, TNF-α, and IL-1α were measured in microglia culture media after LPS treatment (1 µg/ml) using ELISA kits according to the manufacturers’ protocols. Briefly, after incubation with LPS for 24 h, the microglia culture medium was collected and centrifuged at 2000g for 10 minutes to remove debris. All materials and prepared reagents were equilibrated to room temperature prior to use. 50 µL of all samples or standard was added to appropriate wells followed by 50 µL of the Antibody Cocktail to each well. The plate was sealed and incubated at room temperature for 1h on a plate shaker at 400 rpm. Then all wells were washed three times with 1× Wash Buffer PT. After that, 100 µl/well of TMB Substrate was added and incubated under darkness for 10 minutes. Finally, STOP Solution was added and absorbance was read at 450 nm wavelengths using a microplate reader (ELx800, Bio-Tek, USA).
Preparation of the contusive SCI rat model
All animal procedures were conducted according to the Guidelines for the Care and Use of Laboratory Animals (National Institutes of Health) and approved by the Animal Care and Use Committee of Nanjing Medical University. 24 adult male rats were divided into 4 groups on average, which were 3, 7, 14 and 28 days after injury. Briefly, 6 weeks old male rats (180 − 220 g) were first deeply anesthetized by intraperitoneal injection of 10% chloral hydrate (3 ml/kg of body weight). The skin and muscles on the back were then incised and separated to expose the vertebral column, followed by excision of the T10 lamina. After the dorsal surface of the cord was fully exposed, a weight-drop impact was performed using a 10-g rod (2.5 mm in diameter; RWD Life Science Corp., C4p01-001, China) dropped from a height of 12.5 mm. After the weight-drop impact, the muscles and the skin were quickly sutured. The bladders of rats were manually and gently voided three times/day to avoid retention of urine until the reflexive control of micturition was restored.
Tissue processing
Rats were sacrificed with a lethal dose of 10% chloral hydrate on day 3, 7, 14 and 28 post-injury. Cardiac perfusion was performed immediately using ice-cold physiological saline followed by ice-cold physiological saline plus paraformaldehyde (4%, w/v). The incision used for SCI was then opened and segments containing the lesion site were extracted. Spinal cord samples were fixed in paraformaldehyde (4%, w/v) at 4°C for 24 h, dehydrated in a sucrose-PBS gradient (20% and 30% w/v), embedded in OCT, and cut into serial longitudinal sections of about 18 µm. All sections were stored at −80°C until processed for immunostaining.
Statistical analysis
Results are expressed as mean ± SEM of at least three independent experiments. Means were compared by one-way ANOVA followed by Bonferroni’s post hoc tests for multiple comparisons (SPSS 20; SPSS, Chicago, IL, USA). A p < 0.05 (two tailed) was regarded as significant for all tests.
Results
Elevated A1 astrocyte numbers at the damage site 28 days after spinal cord injury (SCI)
Many classical complement cascade proteins that are destructive to neurons and oligodendrocytes are highly upregulated in A1 astrocytes. In particular, complement component 3 (C3) overexpression is a characteristic feature of A1 astrocytes [12]. Immunostaining of spinal cord tissue for C3 revealed a significant increase in A1 astrocyte number at the lesion area 28 days post-SCI (but not 3 days post-SCI) compared to normal uninjured spinal cord tissue (Figure 1(a,b). In order to observe the activation of A1 astrocytes after SCI at different time, we compared the results of 7 days and 14 days to 3 days post-SCI, which had no significant changes in C3 expression in lesion area (data was not shown). Western blotting for C3 protein at 3 and 28 days post-SCI confirmed these immunostaining results, with markedly elevated C3 in lysates obtained 28 days (11.35 ± 1.04 fold of the control, p < 0.05) but not 3 days (1.34 ± 0.16 fold of the control) post-SCI compared to uninjured spinal cord tissue (Figure 1(c,d)).
Figure 1.

Increased A1 astrocyte numbers at the lesion site 28 days following experimental spinal cord injury (SCI) in rats. (a) Representative images of rat spinal cord sections immunohistochemically stained for the A1 astrocyte marker complement component 3 (C3, red) and the general reactive astrocyte marker glial fibrillary acid protein (GFAP, green) 3 and 28 days post-SCI. Cell nuclei were counterstained with DAPI (blue). The upper row shows the proximal (P) end of the lesion and the lower row shows the distal (d) uninjured area for each treatment group. C3-positive astrocytes were more numerous in the lesion area on day 28 post-injury (Virtual coil) compared to day 3 (Arrow). Scale bar, 200 µm. (b) Quantification of C3 immunofluorescence intensity. Immunoexpression of C3 was significantly elevated at the lesion site on day 28 post-injury compared to uninjured spinal cord. *p < 0.05. (c) Representative western blots of C3 expression levels at the lesion area on days 3 and 28 post-injury compared to uninjured spinal cord. (d) Semi-quantification of relative C3 protein expression (normalized to GAPDH expression). *p < 0.05.
Activation of Notch signaling in A1 astrocytes at the lesion site following SCI
Binding of Notch ligands to the Notch receptor results in cleavage of the receptor NICD by γ-secretase and ensuing migration of free NICD into the nucleus, where it initiates transcription of downstream genes such as Hes1. Therefore, to determine whether Notch signaling is activated in A1 astrocytes at the lesion area 28 days post-SCI, we examined the protein expression levels of NICD, C3, and Hes1 in spinal cord by immunofluorescence staining. Immunoexpression of NICD was markedly enhanced in A1 astrocytes at the lesion area compared to astrocytes in uninjured areas (Figure 2(a,b)). Further, C3 and Hes1 immunostaining levels were also enhanced at the lesion area compared to the uninjured area and there was a significant increase in the number of Hes1-positive A1 astrocytes as identified by C3 and Hes1 immunoreactivity (Figure 2(c,d)). Collectively, these findings indicate that Notch signaling is specifically activated in A1 astrocytes at the lesion area 28 days post-SCI.
Figure 2.
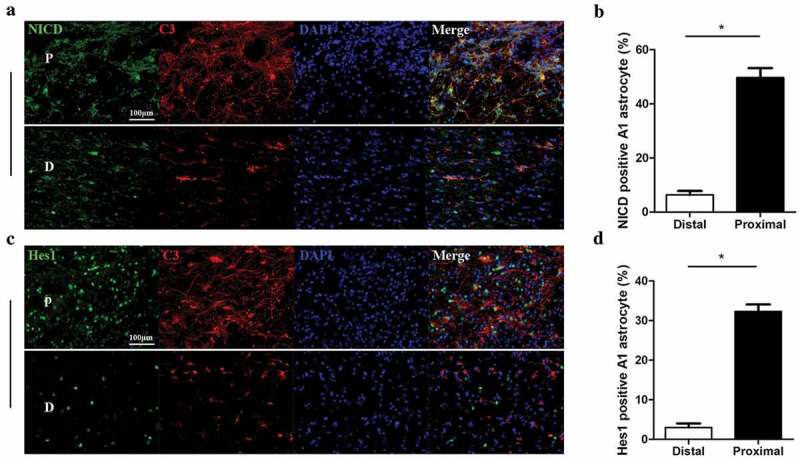
Activation of Notch signaling in A1 astrocytes at the lesion site following SCI. (a, c) Representative images of spinal cord sections immunohistochemically stained for C3 (red), the Notch transcriptional regulator notch intracellular domain (NICD, green), and the NICD target gene Hes1 (green) in A1 astrocytes at the lesion area. Cell nuclei were counterstained with DAPI (blue). P in images represents the proximal lesion area and D the distal and uninjured area. Scale bar, 100 µm. (b) The proportions of NICD-positive A1 astrocytes at the distal and proximal ends of the lesion, *p < 0.05. (d) The proportion of Hes1-positive A1 astrocytes at the distal and proximal ends of the lesion, *p < 0.05.
Activation of Notch signaling in primary astrocytes by microglial conditioned medium (MCM)
Neuroinflammation induces the activation of astrocytes (A1 phenotype), which in turn are neurotoxic to local neurons and oligodendrocytes [12]. The conditioned medium from lipopolysaccharide (LPS)-activated microglia (MCM) or a combination of interleukin 1α (IL-1α), tumor necrosis factor α (TNF-α), and complement component 1q (C1q) can induce A1 astrocyte activation in culture. Therefore, we first treated isolated microglia with LPS (1 µg/ml) in serum-free medium for 24 h and collected the supernatant as MCM (Figure S3A). ELISA revealed significantly elevated C1q, TNF-α, and IL-1α proteins while RT-qPCR demonstrated significantly elevated C1q, TNF-α, IL-1α, and IL-6 mRNA concentrations in the microglia activated with LPS compared to untreated microglia (Figure S3B-I).
To investigate whether Notch signaling in A1 astrocytes is induced by factors released from activated microglia, we examined the expression changes in Notch-related proteins and mRNAs in response to MCM. Indeed, 24 h in MCM enhanced Notch-1 immunofluorescence in (GFAP-positive) A1 astrocytes compared to untreated astrocytes (Figure 3(a)). Treatment with MCM also increased NICD immunofluorescence in the cytoplasm and especially in the nucleus (Figure 3(b)). In addition, the mRNA levels of Notch-related proteins were increased by 12, 24, and 48 h exposure to MCM compared to untreated control astrocytes. Notch-1 mRNA was significantly higher than in untreated astrocyte cultures, especially after 12 h in MCM (3.10 ± 0.21 fold of the control, p < 0.05). This increase was more pronounced when MCM was added with the γ-secretase inhibitor DAPT (10 µM) (3.43 ± 0.18 fold of the control, p < 0.05; Figure 3(c)), which would reduce Notch 1 cleavage. The mRNA levels of Hey1 and Hes1, the main target genes of Notch signaling, were concurrently increased at 12, 24, and 48 h in MCM, reaching a peak at 24 h (Hey1: 2.29 ± 0.11 fold of the control, p < 0.05. Hes1: 9.13 ± 0.21 fold of the control, p < 0.05). Consistent with enhanced Hey1 and Hes1 genes expression after MCM treatment, the mRNA expression levels of these downstream products were suppressed by DAPT (Figure 3(d,e)). In accord with immunofluorescence and RT-qPCR findings, Notch-1, NICD, Hey1, and Hes1 protein levels were elevated in primary astrocytes treated with MCM for 24 or 48 h (peak at 24 h), while addition of DAPT (10 µM) blocked the MCM-evoked increases in NICD, Hey1, and Hes1, but not Notch-1 (Figure 3(f-h)). Collectively, these results strongly suggest that microglial activation and ensuing activation of Notch1 signaling in astrocytes is responsible for the transition to the A1 phenotype at the site of SCI.
Figure 3.

Notch signaling induction and reactive transformation of astrocytes by microglial conditioned medium (MCM) in vitro. (a) Representative images of astrocyte cultures immunostained for GFAP (green) and Notch-1 (red) (with nuclear counterstaining by DAPI, blue) after 24 h in MCM. Notch-1 protein expression in A1 astrocytes was markedly enhanced by MCM treatment compared to untreated astrocytes. Scale bar, 50 µm. (b) Representative images of astrocyte cultures immunostained for GFAP (green) and NICD (red) (with nuclear counterstaining by DAPI, blue) after 24 h in MCM. The expression of NICD was intensely augmented both in the cytoplasm and nucleus (arrows) compared to untreated control cultures. Scale bar, 50 µm. (c-e) RT-qPCR analysis of Notch-1, Hey1, and Hes-1 mRNA expression levels in primary astrocytes treated as indicated. GAPDH was used as the internal control. There were significant increases in Notch-1, Hey1, and Hes-1 mRNA expression after MCM treatment for 12, 24, and 48 h. *p < 0.05. (f) Western blot analysis of Notch-related proteins (Notch-1, NICD, Hey1, and Hes1) after MCM treatment for 24 and 48 h. (g, h) Semi-quantification (normalized to GAPDH) of Notch-related proteins showing that Notch signaling was activated in A1 astrocytes by MCM treatment for 24 and 48 h. In contrast, Notch activation was markedly lower in response to MCM plus the Notch inhibitor DAPT. *p < 0.05.
Transition to the A1 astrocyte phenotype requires Notch signaling
To provide further support for a contribution of Notch signaling to A1 activation, we first measured C3 immunofluorescence changes in astrocytes treated with MCM. Immunoexpression of the A1 marker C3 was significantly elevated by MCM (5.87 ± 0.25 fold of the control, p < 0.05) by not by MCM generated in the presence of DAPT (10 µM) (termed MCM+DAPT) (1.77 ± 0.02 fold of the control) (Figure 4(a,b)). Numerous studies have shown that reactive astrocytes can release neurotoxic pro-inflammatory factors such as TNF-α, IL-1β, and IL-6 [40,41]. Consistent with these studies, astrocytes treated with MCM for 24 h demonstrated significantly elevated TNF-α (76.55 ± 2.08 fold of the control, p < 0.05), IL-1β (123.00 ± 6.77 fold of the control, p < 0.05), and IL-6 (155.80 ± 13.55 fold of the control, p < 0.05) mRNA expression levels compared to untreated astrocytes. Further, these responses were inhibited by DAPT, indicating the Notch signaling is required (Figure 4(c-e)). It has also been suggested that activated astrocytes can switch between A1 and A2 phenotypes [14], so we next measured the expression levels of selected pan-reactive, A1 and A2 marker transcripts by RT-qPCR following 24 h in MCM and MCM+DAPT. Expression levels of the A1 markers Ligp1 (116.24 ± 15.44 versus 49.50 ± 12.35 fold of the control, p < 0.05), Serpring1 (60.59 ± 10.10 versus 47.33 ± 6.30 fold of the control, p < 0.05), C3 (20.00 ± 3.50 versus 5.53 ± 1.05 fold of the control, p < 0.05) and Amigo2 (11.35 ± 3.50 versus 2.33 ± 0.36 fold of the control, p < 0.05) were significantly upregulated in the MCM treatment group but not in the MCM+DAPT group (Figure 4(f)). Alternatively, the A2 markers Sphk1, Slc10a6, S100A10 and Tm4sf1 were moderately upregulated except for Sphk1 by MCM+DAPT, but the increases did not reach significance (Figure 4(g)). Furthermore, the change of pan-reactive transcripts was similar to A1 transcripts (Figure S4). Western blotting confirmed upregulation of the A1 marker C3 in MCM-treated astrocytes but not astrocytes treated with MCM+DAPT (Figure 4(h,i)). These data further demonstrate the strong relationship between Notch signaling and transformation to A1 astrocytes but not A2 astrocytes. These findings also indicate that Notch pathway activation in A1 astrocytes triggers the release of neurotoxic pro-inflammatory factors.
Figure 4.

The Notch signaling inhibitor DAPT blocks MCM-induced activation of A1 astrocytes. (a) Representative images of astrocyte cultures immunostained for GFAP (green) and C3 (red) (with nuclear counterstaining by DAPI, blue) after 24 h in MCM or MCM+DAPT (10 μM). Expression of the A1 marker C3 was significantly enhanced by MCM but not MCM+DAPT. Scale bar, 100 µm. (b) Quantification of C3 fluorescence intensity in each treatment group, *p < 0.05. (c-e) RT-qPCR analysis of TNF-α, IL-1β, and IL-6 mRNA expression in primary astrocytes following the indicated treatment. GAPDH was used as the internal control. Pro-inflammatory mRNAs were significantly upregulated in A1 astrocytes by MCM but not MCM+DAPT (10 μM). *p < 0.05. (f,g) RT-qPCR measurements of A1 and A2 markers in astrocytes treated with MCM with or without DAPT (10 μM) for 24 h compared to untreated controls. DAPT reduced expression of the A1 markers Serping1, Ligp1, C3 and Amigo2. Alternatively, expression of the A2 markers, Slc10a6, Tm4sf1 and S100a10 was increased, but the difference did not reach statistical significance., *p < 0.05. (h) Western blot analysis of C3 protein expression in astrocytes following MCM or MCM+DAPT (10 μM) treatment for 24 h. (i) Semi-quantification (normalized to GAPDH) of C3 expression in astrocytes treated with MCM or MCM+DAPT. *p < 0.05.
Notch-dependent release of neurotoxins by A1 astrocytes
In vivo, A1 astrocytes express many factors potentially destructive to neurons and oligodendrocytes. To examine the detrimental effects of A1 astrocytes on neurons and the role of Notch signaling, we treated cultured primary neurons with A1 astrocyte conditioned medium (ACM) for 24 h. Exposure to ACM significantly increased neuronal apoptosis as measured by AnnexinV-FITC/PI double staining and flow cytometry. This response was markedly attenuated when neurons were incubated with conditioned medium from astrocytes pretreated with DAPT (ACM+DAPT) (31.02 ± 2.89% and 14.01 ± 1.73% of apoptosis ratio in ACM and ACM+DAPT respectively, P < 0.05; Figure 5(a,b)), suggesting that neurotoxicity is mediated by factors (such as TNF-α, IL-1β, and IL-6) released from A1 astrocytes due to activation of Notch1 signaling. This ACM-induced neuronal apoptosis was confirmed by TUNEL staining. Also consistent with flow cytometry, TUNEL staining was reduced when neurons were incubated in ACM+DAPT (27.48 ± 0.91% and 19.15 ± 1.64% of Tunel positive cells in ACM and ACM+DAPT respectively; P < 0.05 Figure 5(c,d)). Western blotting revealed that expression levels of the proapoptotic proteins Bax and cleaved-caspase 3 were significantly elevated in ACM-treated neurons compared to controls, whereas expression of the anti-apoptosis protein Bcl-2 was downregulated. These changes were significantly attenuated when neurons were treated with ACM+DAPT (Figure 5(e,f)). Collectively, these findings suggest that A1 astrocytes induce neuronal apoptosis though Notch1 signaling-dependent release of pro-inflammatory factors (possibly TNF-α, IL-1β, and IL-6).
Figure 5.

Blockade of astrocytic Notch signaling reduces the neurotoxicity of astrocyte conditioned medium (ACM). (a) Annexin V-FITC/PI double staining and flow cytometry was used to detect neuronal apoptosis induced by astrocyte condition medium (ACM) for 24 h and by ACM generated in the presence of the Notch inhibitor DAPT (ACM+DAPT). (b) Quantitative results of flow cytometry that double positive neurons were counted demonstrated that DAPT pretreatment of astrocytes reduced ACM-induced apoptosis of primary neurons, *p < 0.05. (c) TUNEL staining (red) for detection of apoptosis in neurons cultured in ACM or ACM+DAPT for 24 h. Cell nuclei were counterstained with DAPI (blue). Scale bar, 100 µm. (d) Quantitative estimation of the proportion of apoptotic cells in each treatment group. Pretreatment of astrocytes with DAPT for ACM generation substantially reduced ACM-induced neuronal apoptosis. *p < 0.05. (e) Western blot analysis of neuronal apoptosis-related proteins in each treatment group. (f) Semi-quantitative analysis (normalized to GAPDH) showing that the increase in pro-apoptotic proteins Bax and cleaved-caspase 3 following ACM treatment for 24 h was substantially lower in the ACM+DAPT treatment group, whereas expression of the anti-apoptotic Bcl-2 was higher in the ACM+DAPT treatment group. *p < 0.05.
To further investigate the neurotoxicity of A1 astrocytes, we examined changes in neuronal morphology following ACM treatment, including primary axon length, axon branching, and expression of the neuron-specific cytoskeletal protein MAP2 [42]. Bright field and confocal fluorescence microscopy revealed significantly impaired axon extension in the presence of ACM compared to control neurons (0.23 ± 0.04 fold of control, P < 0.05). This effect was substantially reduced in neurons treated with ACM+DAPT (0.50 ± 0.06 normalized axon length of ACM + DAPT versus 0.23 ± 0.04 of ACM, P < 0.05) (Figure 6(a,b)). Moreover, ACM from A1 astrocytes pretreated with DAPT had less impact on axon branching compared to ACM from astrocytes with intact Notch1 signaling (0.60 ± 0.12 normalized axon branches of ACM + DAPT versus 0.22 ± 0.02 of ACM, P < 0.05) (Figure 6(a,c)). Finally, MAP2 protein (0.12 ± 0.03 fold of control, P < 0.05) and mRNA (0.36 ± 0.06 fold of control, P < 0.05) expression levels were reduced substantially by ACM from A1 astrocytes, while ACM+DAPT had markedly less effect as revealed by Western blotting (0.12 ± 0.03 versus 0.35 ± 0.08, P < 0.05, P < 0.05) and RT-qPCR (0.36 ± 0.06 versus 0.60 ± 0.11, P < 0.05, P < 0.05) (Figure 6(d,e)).
Figure 6.

Blockade of astrocytic Notch signaling reduces the damaging effects of ACM on neuronal axons. (a) Top row: Bright-field images of primary neurons before and after treatment with ACM or ACM+DAPT for 24 h. Scale bar, 50 µm; Lower row: Immunofluorescence staining of MAP2 (green) and DAPI counterstaining (blue) in each treatment group. Scale bar, 20 µm. The conditioned medium of A1 astrocytes disrupts axon extension, an effect lost when ACM was generated in the presence of DAPT. (b,c) The effect of ACM and ACM+DAPT on axon length and axon branching in each group, *p < 0.05. (d) Quantification of MAP2 fluorescence intensity from (a). *p < 0.05. (e) RT-qPCR measures of MAP2 mRNA expression in primary neurons treated with ACM or ACM+DAPT. Note the substantial reduction in expression of this neuronal marker by ACM but not ACM+DAPT compared to untreated neuronal cultures. *p < 0.05.
A1 astrocyte activation via the Notch/Stat3 pathway
The Notch pathway interacts with many other signaling pathways, and signal transducer and activator of transcription 3 (Stat3) plays a very important role in induction of the A1 astrocyte phenotype [14]. The upregulated mRNA expression levels of A1 activation markers caused by MCM were inhibited by JSI-124 which was a phosphorylation inhibitor of Stat3 (Figure S5). Accordingly, we examined the expression levels of proteins in the Stat3 pathway that may interact with Notch signaling in C3-positive A1 astrocytes. Treatment of A1 astrocytes with DAPT (10 µM) significantly decreased the phosphorylation of Stat3 (p-Stat3) concomitant with C3 reduction (Figure 7(a,b)). To provide further evidence for an interaction between Notch1 and Stat3, we examined the effects of the phosphorylation inhibitor of Stat3 (JSI-124) at a low (0.2 µM) and high dose (0.5 µM). Consistent with a contribution of Stat3 to A1 phenotype induction, JSI-124 inhibited C3 expression concomitant with reduced phosphorylation of Stat3. Alternatively, NICD expression was dose-dependently enhanced by JSI-124 (Figure 7(c,d)), while total Stat3 protein level was not significantly changed. These results seemed to suggest that reduced p-Stat3 by DAPT treatment is mediated by enhanced NICD activity and that Stat3 and Notch1 pathways are reciprocally regulated. However, given that both NICD and p-Stat3 are localized to the nucleus [43], we next performed co-IP to examine the possibility of direct or indirect protein−protein interactions. Co-IP indicated that NICD interacts with Stat3 in astrocytes treated with MCM, an interaction that was reduced by DAPT (Figure 7(e,f)). Collectively, these findings indicate that activation of A1 astrocytes is initiated by activated Notch signaling, which results in Stat3 interacting with NICD and phosphorylation of Stat3. The enhanced expression of NICD caused by JSI-124 may contribute to an inhibitory effect of JSI-124 on the combination between NICD and Stat3, which increased the number of free NICD. This interaction may regulate the expression of neurotoxic factors and other downstream effectors involved in maintaining the A1 phenotype. Moreover, these findings define the Notch/Stat3 pathway in A1 astrocytes as a potential therapeutic target for SCI.
Figure 7.
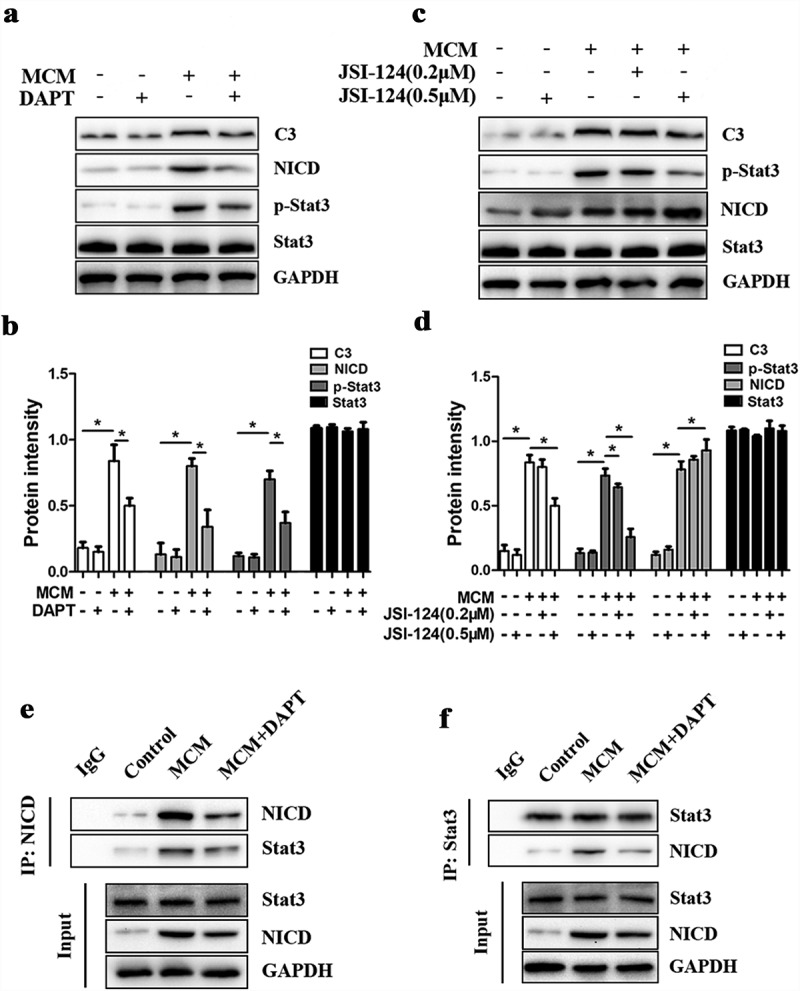
Activation of A1 astrocytes is mediated by the Notch/Stat3 pathway. (a) Western blot analysis of C3, NICD, phosphorylated (p)-Stat3, and Stat3 expression levels in astrocytes treated with MCM or MCM+DAPT for 24 h. (b) Semi-quantitative analysis (normalized to GAPDH) of C3, NICD, p-Stat3, and Stat3 expression in each group. The expression levels of NICD and p-Stat3 were substantially increased by MCM but not by MCM+DAPT. *p < 0.05. (c) Western blot analysis of C3, NICD, p-Stat3, and Stat3 expression in astrocytes treated with MCM or MCM plus the Stat3 inhibitor JSI-124 (0.2 or 0.5 µM) for 24 h. (d) Semi-quantitative analysis (normalized to GAPDH) showing that JSI-124 decreased C3 and p-Stat3 expression but increased NICD expression, *p < 0.05. (e) Association of NICD and Stat3 in A1 astrocytes. Astrocyte lysates obtained from Control (untreated), MCM, and MCM+DAPT treatment groups were immunoprecipitated with NICD antibody and the bound proteins analyzed using a Stat3 antibody. IgG was used as an internal loading control. (f) Astrocyte lysates were immunoprecipitated with Stat3 antibody and the bound proteins were analyzed using a NICD antibody. IgG was used as an internal loading control. The interaction of Stat3 and NICD was significantly increased in MCM-treated A1 astrocytes.
Discussion
Spinal cord injury can lead to severe movement and sensory disorders, including irreversible paralysis and blindness [44,45]. Limiting the development of secondary injury following the initial damage is essential for preservation of function, and reactive astrocytes [46] appear to both enhance and mitigate secondary injury following SCI. Numerous studies have reported that reactive astrocytes are highly heterogeneous, and a recent study identified two distinct classes, A1 and A2, induced by neuroinflammation and ischemia, respectively [12]. In the current study, A1 astrocyte activation was induced by conditioned medium from LPS-treated microglia (MCM) via the pro-inflammatory factors C1q, TNF-α, and IL-1α. A1 astrocytes lose most of their original functions and exhibit new properties, including the secretion of toxins that kill neurons and oligodendrocytes. By contrast, A2 astrocytes induced by ischemia strongly promote neuronal survival. Complement component 3 (C3) is expressed by A1 astrocytes but not A2 astrocytes and so can be used as a marker of the former. In this study, we used GFAP and C3 immunostaining to label A1 astrocytes in spinal cord of rats post-injury and found a marked increase in both proteins around the injury site by day 28. These astrocytes also demonstrated strong Notch1 signaling activity, and further in vitro investigations using microglial, astroglial, and neuronal cultures treated with conditioned media revealed that astrocytic Notch signaling is dependent on microglial activation and in turn is required for astrocyte-mediated neurotoxicity. Thus, this study defines the astrocyte Notch pathway as a promising target for therapeutic intervention against secondary inflammation-dependent SCI.
Astrocytes have many of the same immune cell characteristics as microglia, and can be activated under multiple pathogenic states, such as inflammation [47], ischemia [48,49], brain injury [50], and SCI [51,52]. A growing body of work has shown that the Notch pathway is involved in the astrocytic immune response [53,54]. Moreover, inhibition of Notch signaling can switch microglia/macrophages from a pro-inflammatory M1 phenotype toward an anti-inflammatory M2 phenotype [55]. Notch signaling also regulates various aspects of neural cell fate specification [56,57], including astrocyte differentiation from multipotent neural precursor cells [58]. Astrocytes exhibit profound phenotypic changes during activation, underscoring the strong relationship between Notch signaling and cell status at multiple developmental stages. However, it is still unclear whether Notch signaling can affect the activation or neurotoxicity of A1 astrocytes. As evidence for the requirement of Notch signaling in A1 astrocyte activation, we first demonstrated enhanced expression of NICD and the Notch target Hes1 concomitant with elevated C3 immunoexpression in GFAP+ cells following SCI. Next, we showed that the conditioned medium of LPS-treated microglia, which contains multiple pro-inflammatory factors such as C1q, TNF-α, and IL-1α, induced the A1 astrocyte phenotype in vitro. Further, this transition was blocked by the Notch signaling inhibitor DAPT.
Many CNS diseases involve neurodegeneration through necrosis and (or) apoptosis, as well as disrupted neurocircuit function through axonal degeneration and neurite retraction. Regeneration of neurons and axons is extremely limited following SCI, so these events must be blocked during the therapeutic window [59,60]. A1 astrocytes may be a central effector of secondary neurodegeneration because astrocyte conditioned medium (ACM) induced neuronal apoptosis as evidenced by AnnexinV-FITC/PI staining, TUNEL staining, enhanced expression of pro-apoptotic Bax and cleaved-caspase 3, and downregulation of anti-apoptotic Bcl-2. Furthermore, ACM also stunted axonal growth. These effects were greatly reduced when neurons were cultured with ACM generated in the presence of DAPT (ACM+DAPT). Thus, suppression of A1 astrocyte activation via Notch signaling appears to reduce the deleterious effects on neurons, possibly by suppressing the release of pro-inflammatory factors such as IL-6, TNF-α, and IL-1β. Moreover, targeted Notch inhibition in astrocytes may serve as an effective therapeutic strategy to improve functional recovery after SCI.
The Notch and Stat pathways exhibit pleiotropic effects on many processes regulating cell fate [61,62]. For example, both pathways are implicated in the promotion of astrocytic differentiation from neural precursor cells (as indicated by induction of the astrocytic marker GFAP) [63–65]. Notch can affect the phosphorylation status (activity) of Stat3, although the underlying mechanism remains largely undetermined. Recently, a phenotypic switch from A1 to A2 astrocytes was reported in Stat3-deficient AD mice [14], suggesting that Stat3 is also involved in the activation of A1 astrocytes. Indeed, p-Stat3 was upregulated in activated A1 astrocytes, while Notch inhibition reduced p-Stat3 expression (but not total Stat3 expression). Further, co-IP demonstrated a direct protein−protein interaction between NICD and Stat3. Thus, we suggested that after activation of Notch pathway, NICD is cleaved by γ-secretase and released into the cytoplasm. Free NICD binds to Stat3 and promotes phosphorylation of Stat3. The complex of NICD and phosphorylated Stat3 enters into the nucleus and initiates the expression of A1 astrocyte related genes, which finally facilitates the transformation of astrocytes to A1 phenotype (Figure 8).
Figure 8.

Schematic model showing the possible interaction between Notch and Stat3 pathway. Notch pathway in astrocytes is activated by MCM, NICD is cleaved by γ-secretase from Notch1 and released into the cytoplasm, which can be blocked by DAPT. In the cytoplasm, NICD binds to Stat3 and promotes phosphorylation of Stat3. JSI-124 can inhibit the phosphorylation of Stat3. The complex of NICD and phosphorylated Stat3 enters the nucleus and activates the expression of A1 astrocyte related genes, which promotes the transformation of astrocytes to A1 phenotype. Figure was produced using Photoshop.
In this study, we provide the first evidence that A1 astrocyte numbers are increased in the lesion area of rats following SCI, and that this phenotypic transition is dependent on the Notch-Stat3 axis. Furthermore, we also show that A1 astrocytes can induce neuronal apoptosis and axonal damage, likely through the Notch-dependent release of pro-inflammatory factors. Therefore, blocking Notch signaling in A1 astrocytes may mitigate inflammation-associated secondary damage following SCI. However, our in vitro results must be verified in vivo because the Notch inhibitor DAPT can also affect the polarization of microglia and interfere with functional recovery [66]. Therefore, we plan to re-examine these questions using astrocyte-specific miRNA interference of Notch signaling or conditional Notch knockout mice.
Supplementary Material
Funding Statement
This work was supported by grants from the National Natural Science Foundation of China [81772351, 81520108018, 81472080, 81772352, and 81401800], the Jiangsu Committee of Science and Technology–Social Development Plan [BE2017755], the Jiangsu Six Talents Peak [WSN-011], the Nanjing Committee of Science and Technology [201505005], and the Research Innovation Program for Academic Degree College Graduates of Jiangsu [KYLX16_1105].
Acknowledgments
We thank all colleagues who assisted in this study. This work was supported by grants from the National Natural Science Foundation of China (81772351, 81520108018, 81472080, 81772352, and 81401800), the Jiangsu Committee of Science and Technology–Social Development Plan (BE2017755), the Jiangsu Six Talents Peak (WSN-011), the Nanjing Committee of Science and Technology (201505005), and the Research Innovation Program for Academic Degree College Graduates of Jiangsu (KYLX16_1105).
Disclosure statement
No potential conflict of interest was reported by the authors.
Authors’ contribution
DQ and LL performed the experiments; YR, WL and QW collected data and prepared the manuscript. ZZ, CG, YH and XZ assisted in the experiments and analyzed the data. GY, JF and JC designed the study, analyzed data and edited the manuscript.
Data availability statement
The data that support the findings of this study are available from the corresponding author upon reasonable request.
References
- [1].Ahuja CS, Wilson JR, Nori S, et al. Traumatic spinal cord injury. Nat Rev Dis Primers. 2017;3:17018. [DOI] [PubMed] [Google Scholar]
- [2].Singh A, Tetreault L, Kalsi-Ryan S, et al. Global prevalence and incidence of traumatic spinal cord injury. Clin Epidemiol. 2014;6:309–331. [DOI] [PMC free article] [PubMed] [Google Scholar]
- [3].Jazayeri SB, Beygi S, Shokraneh F, et al. Incidence of traumatic spinal cord injury worldwide: a systematic review. Eur Spine J. 2015;24:905–918. [DOI] [PubMed] [Google Scholar]
- [4].Pineau I, Lacroix S.. Proinflammatory cytokine synthesis in the injured mouse spinal cord: multiphasic expression pattern and identification of the cell types involved. J Comp Neurol. 2007;500:267–285. [DOI] [PubMed] [Google Scholar]
- [5].Milich LM, Ryan CB, Lee JK. The origin, fate, and contribution of macrophages to spinal cord injury pathology. Acta Neuropathol. 2019;137:785–797. [DOI] [PMC free article] [PubMed] [Google Scholar]
- [6].Li H, Wang Y, Hu X, et al. Thymosin beta 4 attenuates oxidative stress-induced injury of spinal cord-derived neural stem/progenitor cells through the TLR4/MyD88 pathway. Gene. 2019;707:136–142. [DOI] [PubMed] [Google Scholar]
- [7].Pourkhodadad S, Oryan SH, Kaka G, et al. Neuroprotective effects of combined treatment with minocycline and olfactory ensheathing cells transplantation against inflammation and oxidative stress after spinal cord injury. Cell J. 2019;21:220–228. [DOI] [PMC free article] [PubMed] [Google Scholar]
- [8].McDonald JW, Sadowsky C. Spinal-cord injury. Lancet. 2002;359:417–425. [DOI] [PubMed] [Google Scholar]
- [9].Clarke LE, Barres BA. Emerging roles of astrocytes in neural circuit development. Nat Rev Neurosci. 2013;14:311–321. [DOI] [PMC free article] [PubMed] [Google Scholar]
- [10].Liddelow S, Barres B. SnapShot: astrocytes in health and disease. Cell. 2015;162:1170–1170.e1171. [DOI] [PubMed] [Google Scholar]
- [11].Sofroniew MV, Vinters HV. Astrocytes: biology and pathology. Acta Neuropathol. 2010;119:7–35. [DOI] [PMC free article] [PubMed] [Google Scholar]
- [12].Liddelow SA, Guttenplan KA, Clarke LE, et al. Neurotoxic reactive astrocytes are induced by activated microglia. Nature. 2017;541:481–487. [DOI] [PMC free article] [PubMed] [Google Scholar]
- [13].Xu X, Zhang A, Zhu Y, et al. MFG-E8 reverses microglial-induced neurotoxic astrocyte (A1) via NF-kappaB and PI3K-Akt pathways. J Cell Physiol. 2018;234:904–914. [DOI] [PubMed] [Google Scholar]
- [14].Reichenbach N, Delekate A, Plescher M, et al. Inhibition of Stat3-mediated astrogliosis ameliorates pathology in an Alzheimer’s disease model. EMBO Mol Med. 2019;11. [DOI] [PMC free article] [PubMed] [Google Scholar]
- [15].Siebel C, Lendahl U. Notch signaling in development, tissue homeostasis, and disease. Physiol Rev. 2017;97:1235–1294. [DOI] [PubMed] [Google Scholar]
- [16].Miele L, Golde T, Osborne B. Notch signaling in cancer. Curr Mol Med. 2006;6:905–918. [DOI] [PubMed] [Google Scholar]
- [17].Lai EC. Notch signaling: control of cell communication and cell fate. Development. 2004;131:965–973. [DOI] [PubMed] [Google Scholar]
- [18].Foldi J, Chung AY, Xu H, et al. Autoamplification of Notch signaling in macrophages by TLR-induced and RBP-J-dependent induction of Jagged1. J Immunol (baltimore, Md: 1950). 2010;185:5023–5031. [DOI] [PMC free article] [PubMed] [Google Scholar]
- [19].Zhang HM, Liu P, Jiang C, et al. Notch signaling inhibitor DAPT provides protection against acute craniocerebral injury. PloS One. 2018;13:e0193037. [DOI] [PMC free article] [PubMed] [Google Scholar]
- [20].Gopalakrishnan N, Sivasithamparam ND, Devaraj H. Synergistic association of Notch and NFkappaB signaling and role of Notch signaling in modulating epithelial to mesenchymal transition in colorectal adenocarcinoma. Biochimie. 2014;107(Pt B):310–318. [DOI] [PubMed] [Google Scholar]
- [21].Yao L, Kan EM, Kaur C, et al. Notch-1 signaling regulates microglia activation via NF-kappaB pathway after hypoxic exposure in vivo and in vitro. PloS One. 2013;8:e78439. [DOI] [PMC free article] [PubMed] [Google Scholar]
- [22].Arumugam TV, Cheng YL, Choi Y, et al. Evidence that gamma-secretase-mediated Notch signaling induces neuronal cell death via the nuclear factor-kappaB-Bcl-2-interacting mediator of cell death pathway in ischemic stroke. Mol Pharmacol. 2011;80:23–31. [DOI] [PubMed] [Google Scholar]
- [23].Huang Y, Mei W, Chen J, et al. Gamma-secretase inhibitor suppressed Notch1 intracellular domain combination with p65 and resulted in the inhibition of the NF-kappaB signaling pathway induced by IL-1beta and TNF-alpha in nucleus pulposus cells. J Cell Biochem. 2018;120:1903–1915. [DOI] [PMC free article] [PubMed] [Google Scholar]
- [24].Fischer A, Gessler M. Delta-Notch–and then? Protein interactions and proposed modes of repression by Hes and Hey bHLH factors. Nucleic Acids Res. 2007;35:4583–4596. [DOI] [PMC free article] [PubMed] [Google Scholar]
- [25].Kageyama R, Ohtsuka T, Hatakeyama J, et al. Roles of bHLH genes in neural stem cell differentiation. Exp Cell Res. 2005;306:343–348. [DOI] [PubMed] [Google Scholar]
- [26].Hojo M, Ohtsuka T, Hashimoto N, et al. Glial cell fate specification modulated by the bHLH gene Hes5 in mouse retina. Development. 2000;127:2515–2522. [DOI] [PubMed] [Google Scholar]
- [27].John GR, Shankar SL, Shafit-Zagardo B, et al. Multiple sclerosis: re-expression of a developmental pathway that restricts oligodendrocyte maturation. Nat Med. 2002;8:1115–1121. [DOI] [PubMed] [Google Scholar]
- [28].LeComte MD, Shimada IS, Sherwin C, et al. Notch1-STAT3-ETBR signaling axis controls reactive astrocyte proliferation after brain injury. Proceedings of the National Academy of Sciences of the United States of America; 2015. Vol. 112 p. 8726–8731. [DOI] [PMC free article] [PubMed] [Google Scholar]
- [29].Shimada IS, Borders A, Aronshtam A, et al. Proliferating reactive astrocytes are regulated by Notch-1 in the peri-infarct area after stroke. Stroke. 2011;42:3231–3237. [DOI] [PMC free article] [PubMed] [Google Scholar]
- [30].Villarino AV, Kanno Y, O’Shea JJ. Mechanisms and consequences of Jak-STAT signaling in the immune system. Nat Immunol. 2017;18:374–384. [DOI] [PMC free article] [PubMed] [Google Scholar]
- [31].Justicia C, Gabriel C, Planas AM. Activation of the JAK/STAT pathway following transient focal cerebral ischemia: signaling through Jak1 and Stat3 in astrocytes. Glia. 2000;30:253–270. [DOI] [PubMed] [Google Scholar]
- [32].Ben Haim L, Ceyzeriat K, Carrillo-de Sauvage MA, et al. The JAK/STAT3 pathway is a common inducer of astrocyte reactivity in Alzheimer’s and Huntington’s diseases. J Neurosci. 2015;35:2817–2829. [DOI] [PMC free article] [PubMed] [Google Scholar]
- [33].Okada S, Nakamura M, Katoh H, et al. Conditional ablation of Stat3 or Socs3 discloses a dual role for reactive astrocytes after spinal cord injury. Nat Med. 2006;12:829–834. [DOI] [PubMed] [Google Scholar]
- [34].Herrmann JE, Imura T, Song B, et al. STAT3 is a critical regulator of astrogliosis and scar formation after spinal cord injury. J Neurosci. 2008;28:7231–7243. [DOI] [PMC free article] [PubMed] [Google Scholar]
- [35].Chen X, Su J, Feng J, et al. TRIM72 contributes to cardiac fibrosis via regulating STAT3/Notch-1 signaling. J Cell Physiol. 2019;234:17749–17756. [DOI] [PubMed] [Google Scholar]
- [36].Yang J, Xing H, Lu D, et al. Role of Jagged1/STAT3 signalling in platinum-resistant ovarian cancer. J Cell Mol Med. 2019;23:4005–4018. [DOI] [PMC free article] [PubMed] [Google Scholar]
- [37].Schildge S, Bohrer C, Beck K, et al. Isolation and culture of mouse cortical astrocytes. J Vis Exp. 2013. [DOI] [PMC free article] [PubMed] [Google Scholar]
- [38].Saura J, Tusell JM, Serratosa J. High-yield isolation of murine microglia by mild trypsinization. Glia. 2003;44:183–189. [DOI] [PubMed] [Google Scholar]
- [39].Takei N, Numakawa T, Kozaki S, et al. Brain-derived neurotrophic factor induces rapid and transient release of glutamate through the non-exocytotic pathway from cortical neurons. J Biol Chem. 1998;273:27620–27624. [DOI] [PubMed] [Google Scholar]
- [40].Sofroniew MV. Molecular dissection of reactive astrogliosis and glial scar formation. Trends Neurosci. 2009;32:638–647. [DOI] [PMC free article] [PubMed] [Google Scholar]
- [41].John GR, Lee SC, Brosnan CF. Cytokines: powerful regulators of glial cell activation. Neuroscientist. 2003;9:10–22. [DOI] [PubMed] [Google Scholar]
- [42].Ribeiro LF, de Wit J. Neuronal polarity: MAP2 shifts secretory vesicles into high gear for long-haul transport down the axon. Neuron. 2017;94:223–225. [DOI] [PubMed] [Google Scholar]
- [43].Liu L, McBride KM, Reich NC. STAT3 nuclear import is independent of tyrosine phosphorylation and mediated by importin- 3. Proceedings of the National Academy of Sciences; 2005. Vol. 102 p. 8150–8155. [DOI] [PMC free article] [PubMed] [Google Scholar]
- [44].Giger RJ, Hollis ER 2nd, Tuszynski MH. Guidance molecules in axon regeneration. Cold Spring Harb Perspect Biol. 2010;2:a001867. [DOI] [PMC free article] [PubMed] [Google Scholar]
- [45].Maier IC, Schwab ME. Sprouting, regeneration and circuit formation in the injured spinal cord: factors and activity, philosophical transactions of the royal society of London. Ser B Bio sci. 2006;361:1611–1634. [DOI] [PMC free article] [PubMed] [Google Scholar]
- [46].Eng LF, Vanderhaeghen JJ, Bignami A, et al. An acidic protein isolated from fibrous astrocytes. Brain Res. 1971;28:351–354. [DOI] [PubMed] [Google Scholar]
- [47].Zamanian JL, Xu L, Foo LC, et al. Genomic analysis of reactive astrogliosis. J Neurosci. 2012;32:6391–6410. [DOI] [PMC free article] [PubMed] [Google Scholar]
- [48].Gao Q, Li Y, Chopp M. Bone marrow stromal cells increase astrocyte survival via upregulation of phosphoinositide 3-kinase/threonine protein kinase and mitogen-activated protein kinase kinase/extracellular signal-regulated kinase pathways and stimulate astrocyte trophic factor gene expression after anaerobic insult. Neuroscience. 2005;136:123–134. [DOI] [PubMed] [Google Scholar]
- [49].Cekanaviciute E, Dietrich HK, Axtell RC, et al. Astrocytic TGF-beta signaling limits inflammation and reduces neuronal damage during central nervous system toxoplasma infection. J Immunol (baltimore, Md: 1950). 2014;193:139–149. [DOI] [PMC free article] [PubMed] [Google Scholar]
- [50].Ren Z, Iliff JJ, Yang L, et al. ‘Hit & Run’ model of closed-skull traumatic brain injury (TBI) reveals complex patterns of post-traumatic AQP4 dysregulation. J Cereb Blood Flow and Metab. 2013;33:834–845. [DOI] [PMC free article] [PubMed] [Google Scholar]
- [51].Bloom O. Non-mammalian model systems for studying neuro-immune interactions after spinal cord injury. Exp Neurol. 2014;258:130–140. [DOI] [PMC free article] [PubMed] [Google Scholar]
- [52].Anderson MA, Burda JE, Ren Y, et al. Astrocyte scar formation aids central nervous system axon regeneration. Nature. 2016;532:195–200. [DOI] [PMC free article] [PubMed] [Google Scholar]
- [53].Cao Q, Lu J, Kaur C, et al. Expression of Notch-1 receptor and its ligands Jagged-1 and Delta-1 in amoeboid microglia in postnatal rat brain and murine BV-2 cells. Glia. 2008;56:1224–1237. [DOI] [PubMed] [Google Scholar]
- [54].Wei Z, Chigurupati S, Arumugam TV, et al. Notch activation enhances the microglia-mediated inflammatory response associated with focal cerebral ischemia. Stroke. 2011;42:2589–2594. [DOI] [PubMed] [Google Scholar]
- [55].Yin J, Hu H, Li X, et al. Inhibition of Notch signaling pathway attenuates sympathetic hyperinnervation together with the augmentation of M2 macrophages in rats post-myocardial infarction. Am J Physiol Cell Physiol. 2016;310:C41–53. [DOI] [PubMed] [Google Scholar]
- [56].Androutsellis-Theotokis A, Leker RR, Soldner F, et al. Notch signalling regulates stem cell numbers in vitro and in vivo. Nature. 2006;442:823–826. [DOI] [PubMed] [Google Scholar]
- [57].Fujimoto M, Takagi Y, Muraki K, et al. RBP-J promotes neuronal differentiation and inhibits oligodendroglial development in adult neurogenesis. Dev Biol. 2009;332:339–350. [DOI] [PubMed] [Google Scholar]
- [58].Ge W, Martinowich K, Wu X, et al. Notch signaling promotes astrogliogenesis via direct CSL-mediated glial gene activation. J Neurosci Res. 2002;69:848–860. [DOI] [PubMed] [Google Scholar]
- [59].Yakovlev AG, Faden AI. Mechanisms of neural cell death: implications for development of neuroprotective treatment strategies. NeuroRx. 2004;1:5–16. [DOI] [PMC free article] [PubMed] [Google Scholar]
- [60].Ackery A, Tator C, Krassioukov A. A global perspective on spinal cord injury epidemiology. J Neurotrauma. 2004;21:1355–1370. [DOI] [PubMed] [Google Scholar]
- [61].Artavanis-Tsakonas S, Rand MD, Lake RJ. Notch signaling: cell fate control and signal integration in development. Science. 1999;284:770–776. [DOI] [PubMed] [Google Scholar]
- [62].Levy DE, Darnell JE Jr.. Stats: transcriptional control and biological impact. Nat Rev Mol Cell Biol. 2002;3:651–662. [DOI] [PubMed] [Google Scholar]
- [63].Gaiano N, Fishell G. The role of notch in promoting glial and neural stem cell fates. Annu Rev Neurosci. 2002;25:471–490. [DOI] [PubMed] [Google Scholar]
- [64].Rajan P, McKay RD. Multiple routes to astrocytic differentiation in the CNS. J Neurosci. 1998;18:3620–3629. [DOI] [PMC free article] [PubMed] [Google Scholar]
- [65].Bonni A, Sun Y, Nadal-Vicens M, et al. Regulation of gliogenesis in the central nervous system by the JAK-STAT signaling pathway. Science. 1997;278:477–483. [DOI] [PubMed] [Google Scholar]
- [66].Cheng Z, Yang Y, Duan F, et al. Inhibition of Notch1 signaling alleviates endotoxin-induced inflammation through modulating retinal microglia polarization. Front Immunol. 2019;10:389. [DOI] [PMC free article] [PubMed] [Google Scholar]
Associated Data
This section collects any data citations, data availability statements, or supplementary materials included in this article.
Supplementary Materials
Data Availability Statement
The data that support the findings of this study are available from the corresponding author upon reasonable request.