

ABSTRACT
Pirin (PIR) protein belongs to the superfamily of cupin and is highly conserved between eukaryotic and prokaryotic organisms. It has been reported that PIR is upregulated in various tumors and involved in tumorigenesis. However, its biological functions particularly in promoting tumorigenesis are, to date, poorly characterized. Here we report that knockdown of PIR in MCF7 and MDA-MB-231 cell lines causes a dramatic decrease in cell proliferation and xenograft tumor growth in mice. Mechanistically, the cell cycle activator E2F1 and its target genes cdk4, cdk6, cycE, cycD and DDR1 are remarkably downregulated in PIR depleted cells, leading to G1/S phase arrest. Luciferase reporter assay and chromatin immunoprecipitation assay indicate that PIR can activate E2F1 transcription by binding to its promoter region. Consistent with the observation in PIR knockdown cells, PIR inhibitors markedly inhibit the proliferation of both cell lines. Furthermore, knockdown of PIR significantly decreases the abilities of MCF7 cells for mobility and invasion in vitro and their metastasis in mice, which may be attributed to the decrease of DDR1. In conclusion, PIR stimulates tumorigenesis and progression by activating E2F1 and its target genes. Our finding thus suggests PIR as a potential druggable target for the therapy of cancers with high expression level of PIR.
KEYWORDS: PIR, E2F1, tumorigenesis
Introduction
Cancer development and progression depend on abnormal proliferation which is accomplished by distorted expression or activation of proteins related to cell cycle regulations. Abnormal cell growth is also stimulated by the excessive activation of different signal transduction pathways [1]. Many genes involved in cell proliferation, differentiation and DNA damage response are known to be regulated by transcription factors family of E2F [2–5]. E2Fs are divided on the bases of functional mode into the typical (E2F1-E2F6) and the atypical (E2F7 and E2F) [6–9]. Typical E2Fs interact with their target proteins to regulate gene expression through a highly conserved DNA-binding domain and a dimerization domain that contains DNA-binding motif [TTT(C/G) (C/G) CGC] [6]. E2F1 is the master regulator of G1/S phase transition of cell cycle and trans-activator of multiple genes involved in DNA r`eplication, including its own promoter [10]. The abnormal expression of E2F1 is an oncogenic event that causes the malignant transformation of cells [11]. Pirin (PIR) protein belongs to the superfamily of cupin and is highly conserved between eukaryotic and prokaryotic organisms. However, its biological functions are, to date, poorly characterized [12,13]. According to the crystal structure of human PIR, it may have quercetinase activity that degrades the quercetin flavonoid and participate in the regulation of different cellular processes functioning as a protein kinase inhibitor, antioxidant or putative transcriptional co-factor [14–16]. Interestingly, several evidences indicate that PIR is up-regulated in various malignancies and involved in tumorigenesis and progression through forming a ternary complex with proto-oncogene Bcl3 and NF-κB and thus activating the expression of Bcl3 [17–23]. Our study reveals a novel mechanism underlying PIR stimulation of breast cancer cell proliferation, xenograft tumor formation and metastasis, in which PIR transcriptionally activates E2F1 expression and consequently forces G1/S phase transition of cell cycle.
Materials and methods
Constructs
Full-length complementary DNA (cDNAs) encoding the corresponding genes used in this study were obtained from Dr. Jiahuai Han (State Key Laboratory of Cellular Stress Biology, School of Life Sciences, Xiamen University) as a gift. The pcDNA3.3 vector was used for transient expression of protein, while pBOBi vector was used for packaging of lentiviruses. The pGEX 4T-1 vector was used to purify the GST tag protein for in-vitro study. pLKO.1-puro lentivirus vector was used to establish the shRNA. All the cDNAs were cloned by ligase independent cloning using the XhoI/BamH1 restriction sites. All the plasmids were verified by DNA sequencing and the details of plasmid sequence are available upon request. The nucleotides sequence used for shRNA against human PIR and E2F1 are as follows.
shPIR#1 5′-GAAGCCACTTTGTCTTAATT -3′,
shPIR#2 5′-GAACACCAATGAAGAGATTT-3′,
shE2F1 5′-CAGGATGGATATGAGATGGGA-3′.
Antibodies and reagents
Most of the drugs and reagents used in our project were provided by Sigma, Sangon Bioengineering, and New England Biolab (NEB). In addition, restriction enzyme, exonuclease III (ExoIII) and DNA standard molecular weight Marker were purchased from Takara Bioengineering Co., Ltd. or New England Biolab, USA; T4 DNA ligase (T4 Ligase), T4 PNK (polynucleotide kinase) PNK were purchased from Invitrogen, USA; PVDF membranes were purchased from Millipore. The polyclonal antibody against PIR was generated by immunizing rabbits with GST-fusion proteins of human PIR (aa 316–410). Mouse anti human PIR (catalog number: 10,263-1-AP) was purchased from Proteintech. Mouse anti-FLAG (M2) (catalog number: F3165) is the product of Millipore. Mouse anti-HA (clone number F-7, 1:1000), rabbit anti-HA (clone number Y-11, 1:1000), and Mouse anti-actin (catalog number: sc-8432) antibodies were purchased from Santa Cruz.
Transfection and western blot
Polyethylenimine (PEI) was purchased from Polyscience (23,966) and used for transient transfection in HEK 293T cells. To ensure that an equal amount of total DNA was transfected for each sample, corresponding blank vector was used for adjustment of total DNA. To stably reconstitute expression of PIR in MCF7 and MDA-MB-231 cell lines with their endogenous PIR already knocked down by shRNA, we packaged lentiviruses with corresponding pBOBi plasmid in HEK 293T cells using Turbofect transfection reagent according to the manufacturer’s instruction (#R0532). After purification and titration, a proper amount of virus was used to infect the cells. Cells cultured for Western blot analysis were harvested in a lysis buffer (20 mM Tris-HCl, pH 7.4, 150 mM NaCl, 1 mM EDTA, 1 mM EGTA, 1% Triton, 2.5 mM sodium pyrophosphate, 1mM β-glycerolphosphate, 1 mM sodium orthovanadate, 1 μg/ml leupeptin, 1 mM phenylmethylsulfonyl fluoride), sonicated 15 times for 1 s each, and centrifuged at 15,000 g for 15 min at 4°C to obtain the supernatant total cell lysate (TCL). TCLs were boiled and separated on 10% SDS–polyacrylamide gel followed by transferred to polyvinylidene difluoride membrane (PVDF). Then, the PVDF membrane was blocked with 5% nonfat milk diluted in Tris-buffered saline containing 0.1% Tween 20 for 1 h. Finally, the membrane was probed with corresponding antibodies and the proteins were visualized by enhanced chemiluminescence using horseradish peroxidase conjugated antibodies.
Qrt-pcr analysis
Total RNA from MCF7 and MDA-MB-231 cell lines was isolated using the TRIzol reagent (Invitrogen), according to the enlisted instructions. The extracted RNA was quantified by using Nano Drop spectrophotometer (ND-1000, Thermo Scientific, MA, USA). cDNA was synthesized using 5 μg of total RNA and a reverse transcriptase kit (Invitrogen). The Power SYBR Green qPCR SuperMix-UDG (Invitrogen) was used for qPCR to determine the mRNA levels of the target genes on an ABI Prism-7500 Sequence Detector System (ABI, Applied Biosystems, Carlsbad, CA, USA). The relative expression levels of mRNAs were normalized by the level of β-actin mRNA. The primers used in qPCR are shown in Table 1.
Table 1.
Primers used for qPCR.
| Primers | Sequences 5′ … … … … … … .3′ |
|---|---|
| PIR F | CGCAAACCTGTCCTCCCTTT |
| PIR R | TTTTTCAACTCGGGTCTGCCA |
| E2F1 F | AGGCCCTCGACTACCACT |
| E2F1 R | CCAAGCCCTGTCAGAAAT |
| CERK F | ACCTACTGCCAGAGAACCCT |
| CERK R | TCGATGGTTGGTGCTCGAAT |
| ERK F | AGGCTGTTCCCAAATGCTGA |
| ERK R | CAGATATGGGTGGGCCAGAG |
| ACTIN F | TCCATCATGAAGTGTGACGT |
| ACTIN R | TACTCCTGCTTGCTGATCCAC |
| CDK4 F | GTGTGAGAGTCCCCAATGGA |
| CDK4 R | GTCCATCAGCCGGACAACA |
| CDK6 F | AAGTCTTGCTCCAGTCCAGC |
| CDK6 R | CTGGGAGTCCAATCACGTCC |
| CYCD F | TGACCCCGCACGATTTCATT |
| CYCD R | CAGAGGGCAACGAAGGTCTG |
| CYCE F | AGAGGAAGGCAAACGTGACC |
| CYCE R | TATTGTCCCAAGGCTGGCTC |
| DDR1 F | TTTGTACATCGGGACCTGGC |
| DDR1 R | GCCCTGCACACGGTAATAGT |
Cell cycle analysis
MCF7 cells were synchronized by double thymidine for 24 h and then released for 12 h. Then, the cells were collected by centrifugation at 2000 rpm and washed twice with PBS, followed by treatment with pre-cooled 70% ethanol and fixed at −20°C overnight. Next day the fixed cells were collected by centrifugation at 2000 rpm, washed twice with 1 ml of PBS, and incubated in 500 μl of PBS containing 50 μg/ml ethidium bromide (PI), 100 μg/ml RNase A, 0.2% Triton X-100 at 4℃ for 30 min in the dark. Flow cytometry was used to analyze the cell cycle and the results were analyzed by the cell cycle fitting software ModFit.
Gst-pulldown assay
Full-length cDNA of PIR was cloned into pGEX 4T-1 plasmid and transformed into E. coli BL21 strain. Transformed bacteria were induced to express proteins with 0.5 mM isopropyl-β-D-thiogalactoside at 18 ℃. Then, the Bacteria were harvested and GST tagged PIR protein was purified with glutathione sepharose beads (GE). The E2F1 promoter (−1000 to +1) was amplified through PCR by using specific pair of primers. GST pulldown assays were performed by incubating GST-PIR protein (1μg) with amplified E2F1 promoter (1μg) in GST pull-down buffer for 3 h at 4℃, followed by pulldown with glutathione sepharose beads. The GST beads were washed five times and incubated in GST elution buffer for 30 min. Then centrifuged the tube for short time and used the supernatant for PCR reaction with E2F1 promoter specific primers to check the interactions.
Luciferase assay
HEK293T cells were transfected with 1 μg of pGL3-E2F1-luciferase and different concentration of pcDNA3.3 vector expressing Flag-tagged PIR or empty vector to equal the total concentration of plasmid. After 24 h of transfection, cells were washed with PBS and harvested with harvest buffer. Then, the Supernatant was collected by centrifugation at 13,000 g for 5 min and subjected to luciferase assay according to the standard protocol provided by the Promega official website. The data were normalized by the total protein concentration in the cells.
Chip-pcr assay
To identify the PIR binding region in the E2F1 promoter region, ChIP assay were carried out. 107 cells were cultured in 150 mm dish and chromatin was obtained according to manufacturer’s guide (9003, Cell Signaling Technology). Briefly, cells were cross-linked with 1% formaldehyde for 10 min at room temperature and stopped the cross-linking by adding glycine to a final concentration of 125 mM. Cells were then lysed and nuclei were pelledted by centrifugation. Chromatin were broken to 500 bp by enzymatic hydrolysis and sonication. The lysates were immunoprecipitated using antibody anti-Flag and control IgG. After purification, the precipitated DNA and input DNA was amplified by PCR with specific primer (Forward: 5ʹ-acagtctctggaaat-3ʹ, Reverse: 5ʹ-gctcccgcatcccac-3ʹ).
MTT assay
The MCF7 and MDA-MB-231 cells (1000–2000) were equally divided into 96 well plates into four replicates. After the cells entered exponential phase of growth, old medium was replaced with 200 μl of fresh medium for each well. Then, 20 μl of 3 mg/ml of MTT reagent (3-(4,5-dimethylthiazol-2-yl)-2,5-diphenyltetrazolium bromide) was added to each well and incubated for about 4 h at 37℃. After incubation, all the liquid were removed and 200 μl of DMSO was added. Then, the plate was kept for about 10 min at room temperature. Finally, mixed the samples well and read the absorbance at 490 nm.
Transwell and wound healing assays
The transwell chamber with Matrigel-coated filters (8 μm pore size) was used to perform the transwell assay. MCF7 cell suspensions were seeded onto the upper layer of chamber (about 1 × 10⁵ cell per well) containing 200 μl of medium (with no serum). The lower chamber was filled with complete media. Then allowed the plate kept in a cell culture incubator for 48 h. Invasive cells on the surface of filter in lower chamber were fixed using 4% formaldehyde for about 7 min at room temperature and stained with crystal violet. The stained cells were counted for five random fields in triplicates.
For wound healing assay, MCF7 and MDA-MB-231 cells were grown in 60 mm dish up to 90% of confluence. The cell monolayer was scratched with a 200 μl pipette tip and washed three times with PBS to remove the detached cells. Next, the cells were incubated in complete medium for about 36 (MDA-MB-231) or 48 (MCF7) h. The scratched areas were photographed at 0 and 48 h for MCF7 cells and 0 and 36 h for MDA-MB-231 cells. All the experiments were repeated for at least three times.
Xenograft tumor and in vivo metastasis assays
Cells infected with specific lentiviruses were selected in 2 μg/ml puromycin for 7 days and subjected to xenograft tumor assays. In all, 1 × 10⁶ cells of individually constructed cell lines were collected and re-suspended in PBS, and then injected subcutaneously into the left or right flank of six-week-old male BALB/c nude mice purchased from SHANGHAI SLAC LABORATORY ANIMAL COMPANY (n > 5). After 3 weeks, the mice were sacrificed, followed by isolation of xenograft tumors whose weights were determined accordingly.
For in vivo metastasis assays, MCF7 cells (1 × 10⁶ in 100 μl PBS) with PIR stably knocked down were injected into the 4-week-old male BALB/c nude mice via tail veins (n > 5). The mice were killed after 6 weeks and pictures of metastatic lung lesions were taken. The metastatic tumor nodules on the surface of mouse lungs were counted for statistical analysis. Tumor nodules were confirmed by IHC and western blot analysis.
In all of these animal assays, mice are randomly allocated to the experimental groups. Therefore, the investigators were blinded to the group allocation during the experiment.
All animal experimental protocols were approved by the institutional Animal Care and Use Committee at Xiamen University. According to our approved protocol for xenograft tumor assay, tumor size should be inspected daily and not allowed to exceed 1.2 cm in diameter.
Results
PIR is excessively expressed in breast cancer tissues
To identify the detailed mechanism, how PIR facilitates the generation and progression of human tumors, first, we wanted to know whether there exists any correlation between the PIR expression levels and tumorigenesis. We analyzed the breast cancer databases in Oncomine and found that the expression levels of PIR are significantly higher in breast cancer tissues than in their corresponding normal tissues (Figure 1(a–c)). To gain further insight into the relationship between PIR expression levels in tumor tissues and the prognoses of tumor patients, we analyzed the breast cancer databases in TCGA (The Cancer Genome Atlas). We observed that higher expression levels of PIR closely correlate with lower survival rates (Figure 1(d)). We next detected high expression of PIR in different types of breast cancer cell lines and used MCF7 and MDA-MB-231 as model cells for further study (Figure 1(e)). In summary, we conclude that high expression of PIR positively correlates with tumorigenesis.
Figure 1.
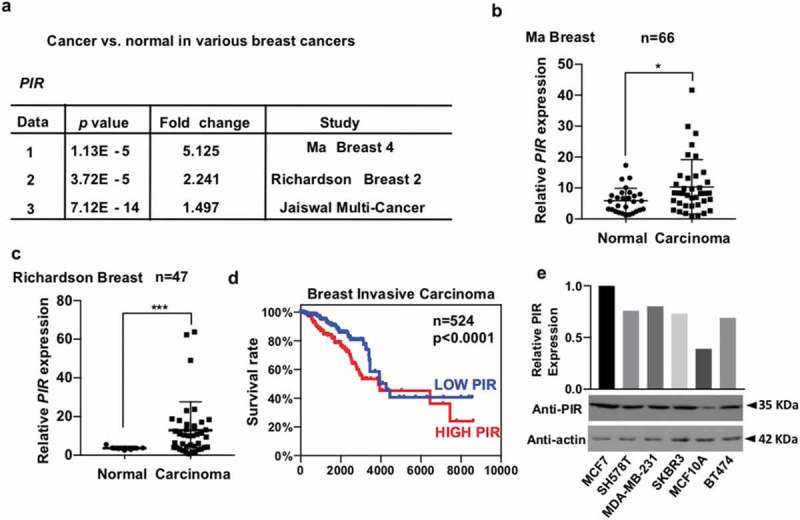
PIR mRNA is excessively expressed in various cancer tissues. (a) p values and fold changes show increased expression of PIR mRNA in various studies of breast cancers as compared with normal tissue. Data are publicly available in the Oncomine database. (b,c) Data 1 and 2 in Figure 1a are presented as scatter plots, individually, showing high expression levels of PIR mRNA in breast cancers as compared to normal tissues (*P < 0.05, ***P < 0.001, unpaired Students t-test). (d) The TCGA database showing that higher expression levels of PIR mRNA correlates with lower survival rates in breast cancer (***P < 0.001, unpaired Students t-test). (e) The breast cancer cell lines were cultured for 24 h, followed by detection of PIR and actin with Western blot (WB).
Inhibition of PIR significantly reduces cell proliferation and xenograft tumor growth
To explore the biological significance of PIR expression in malignancies, we knocked down PIR in MCF7 and MDA-MB-231 cell lines using shRNA and found a dramatic decrease in cell proliferation as indicated by morphology picture of both cell lines (Figure 2(a)). To further verify this observation, we rescued PIR expression in corresponding knockdown cells by employing a PIR expressing vector with synonymous mutations in shRNA targeting sequence of PIR. The knockdown and overexpression efficiencies of PIR in MCF7 and MDA-MB-231 cells were checked by Western blot (Figure 2(b) left, 2 (d) left). The cells counting assay was performed at different time intervals and the results indicate that the ablation of PIR considerably reduced the cell proliferation, while the rescuing expression of PIR significantly restored the normal cell proliferation (Figure 2(b) right, 2 (d) right). These data were also verified by MTT assay showing that the shPIR reduced MTT activity, while the overexpression of PIR significantly rescued MTT activity in both MCF7 and MDA-MB-231 cell lines (Figure 2(c,e)). To gain further insight into the effect of PIR in more detail, we used some of known PIR inhibitors like TphA, CCG-1423 and CCG-203,911 [24,25], which was reported to inhibit the function of PIR as a transcriptional co-factor. We treated MCF7 and MDA-MB-231 cells with these chemicals and detected a dramatic decrease in cell proliferation after 48 h (Figure 3(f,g)). We then investigated if PIR plays a key role in promoting tumorigenesis in nude mice. MCF cells were injected into six-week-old nude mice subcutaneously with wild-type cells to the left flank and PIR knockdown cells to the right flank. After 3 weeks, tumors were isolated and weighted. As expected, knockdown of PIR significantly slowed down xenograft tumor growth of MCF cells in nude mice as compared with the wild type cells (Figure 2(h)). Taken together, our data demonstrate that PIR is essential for in vitro proliferation of MCF7 and MDA-MB-231 breast cancer cells and xenograft tumor growth of these cells in nude mice.
Figure 2.
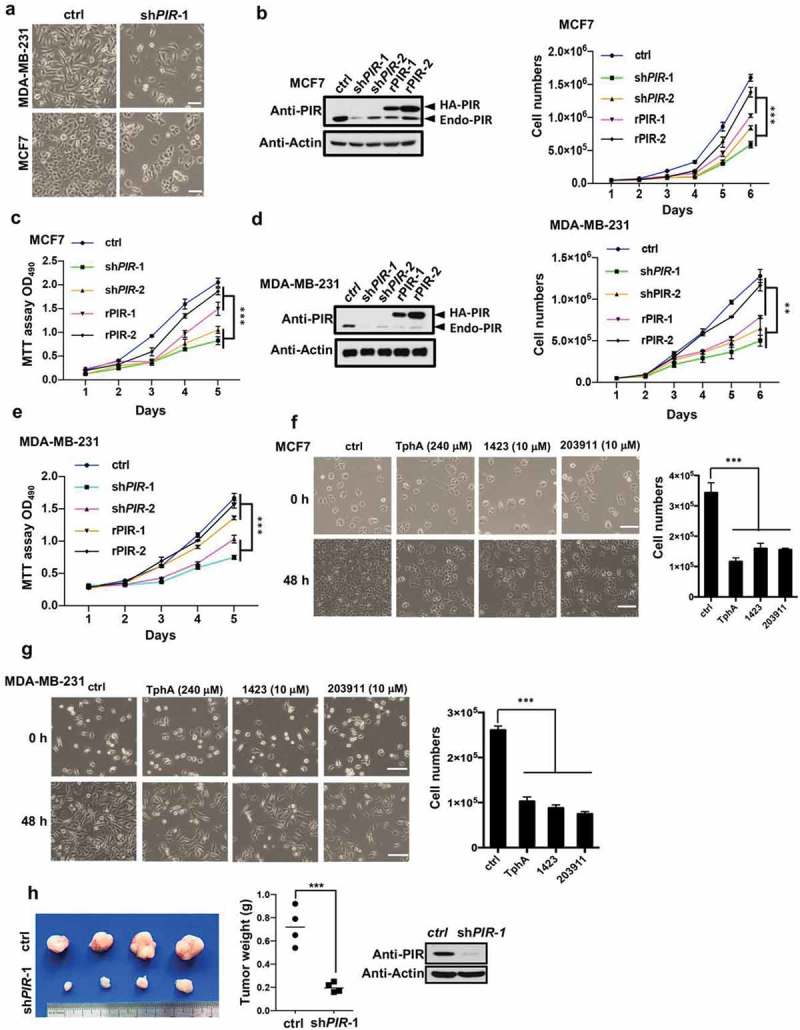
Inhibition of PIR significantly retards cell proliferation and xenograft tumor growth. (a) MCF7 and MDA-MB-231 cells were infected with lentiviruses expressing shPIR-1, followed by determination of morphologies under a microscope after 48 h of infection. The scale bars represent 100 mm. (b,c) MCF7 cells were infected with lentiviruses expressing shPIR-1/2 to knock down PIR and further reconstituted for PIR expression using rescuing PIR (rPIR) constructs. Proteins in total cell lysates were determined by WB (b, left);); HA-PIR: HA tagged PIR; Endo-PIR: endogenous PIR. Cell number (b, right) and MTT activity (c) were determined in the time courses indicated. The data are means±SEM of three independent experiments (***P< 0.001, unpaired Students t-test). (d,e) MDA-MB-231 cells were treated and measured for protein levels (d, left), cell numbers (d, right) and MTT activities (e) as in (b,c). The data are means±SEM of three independent experiments (**P< 0.01, ***P< 0.001, unpaired Students t-test). (f,g) MCF7 and MDA-MB-231 cells were treated with TphA (240 μM), CCG-1423 (10 μM) and CCG-203,911 (10 μM) or DMSO (control), followed by determination of cell numbers and morphologies under a microscope after 48 h of treatment. The data are means±SEM of three independent experiments (***P < 0.001, unpaired Students t-test). The scale bars represent 100 mm. (h) MCF7 cells stably expressing shGFP (control) and shPIR were separately injected on the left and right flanks of mice. Three weeks post-injection, tumors were isolated, followed by determination of weights (left) and expression of PIR (right). Unpaired Students t-test (***P< 0.001) was used to analyze the data (middle).
Figure 3.
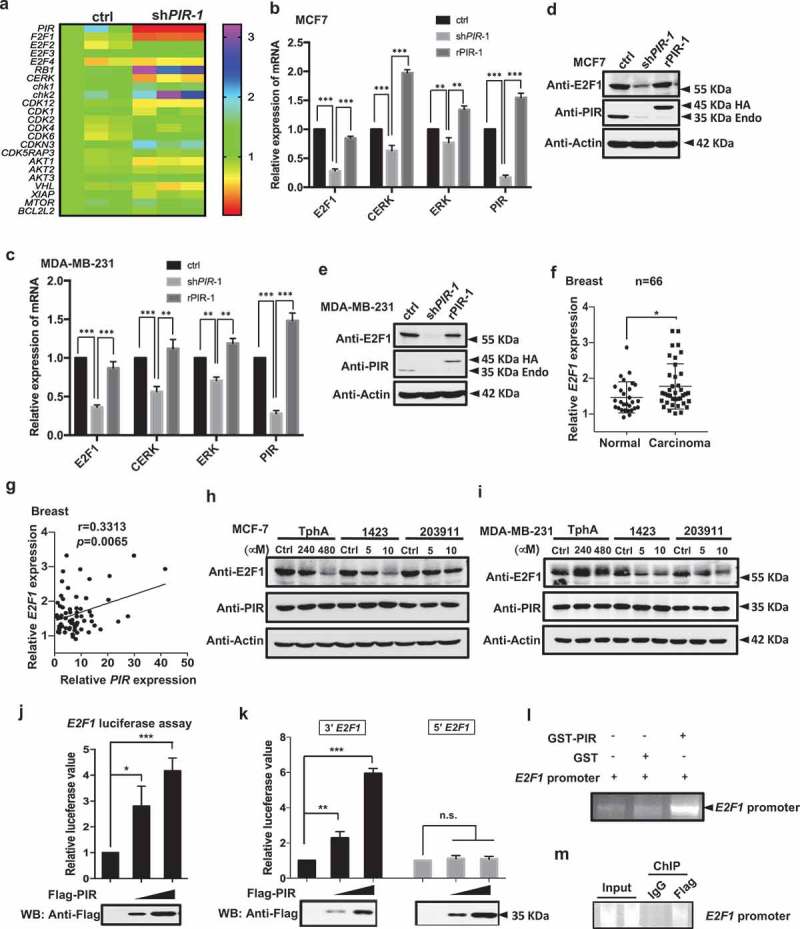
PIR activates the transcription of E2F1. (a) The total RNA was extracted 48 h after knockdown of PIR and subjected to RNA seq analysis. (b,c) MCF7 and MDA-MB-231 cell lines were infected with lentiviruses expressing shPIR-1 to knock down PIR and further reconstituted for HA-tagged PIR expression. After 48 h of reconstitution the mRNA expression levels of E2F1, CERK and ERK were analyzed by qRT-PCR. The data shown are means±SEM of three independent experiments (**P< 0.01, ***P< 0.001, unpaired Students t-test). (d,e) Total cell lysates of cells used in b and c were collected and subjected to SDS-PAGE and WB for detection of PIR protein levels. (f) A analysis from the Oncomine database showing higher expression levels of E2F1 in breast cancers as compared to corresponding normal tissues (*P< 0.05, unpaired Students t-test). (g) A study from the Oncomine database showing a positive correlation between PIR and E2F1 mRNA expression in breast cancer tissues. (h,i) MCF7 and MDA-MB-231 were treated with DMSO (control), TPhA (240 μM, 480 μM), CCG-1423 (5 μM, 10 μM) and CCG-203,911 (5 μM, 10 μM) and the total cell lysates were collected after 48 h of treatment and analyzed for the expressions of E2F1, PIR and actin. (j) HEK 293T cells were co-transfected with E2F1-luciferase plasmid and flag-tagged blank vector (control) or different doses of flag-PIR (0.5 μg, 1.0 μg). After 24 h of transfection, luciferase activities were determined and normalized to the sample of control cells. The data are presented as means±SD of three independent experiments. (***P< 0.001, unpaired Student’s t-test). (k) 293T cells were transfected with empty vector, Flag-PIR, 3′ terminal E2F1 (3′ E2F1: −539~+101) and 5′ terminal E2F1 (5′ E2F1: −1000~-540) luciferase plasmids and the luciferase activity was checked after 24 h of transfection. The data are means±SD of three independent experiments (**P < 0.01, ***P < 0.001, unpaired Student’s t-test). (l) GST or GST tagged PIR protein (1 μg) was mixed with E2F1 promoter DNA (1 μg) in GST binding buffer for 3 h and then GST or GST-PIR protein was pulled down with GST beads. After sufficient wash of the precipitates, promoter DNA was eluted and subjected to PCR amplification and detection with agarose gel. (m) In vivo ChIP-PCR assays were performed by immunoprecipitating overexpressed Flag-PIR and amplificating 3′ region of E2F1 promoter.
PIR promotes E2F1 expression transcriptionally
To identify the detailed mechanism why knockdown of PIR reduces breast cancer cell proliferation, we performed RNA seq assay to search for genes regulated by PIR. We found that in PIR knockdown cells some of the pro-survival factors like E2F1, CERK and ERK were dramatically downregulated as compared with the control cells (Figure 3(a)). The downregulations of E2F1, CERK and ERK were also verified by real-time q-PCR in MCF7 and MDA-MB-231 cell lines (Figure 3(b,c)). Because E2F1 is a direct activator of G1/S transition and its mRNA seemed to be more significantly downregulated than that of CERK and ERK, we mainly focused on the effect of E2F1 downregulation on cell proliferation and tumor growth in following investigation. As expected, the Western blot analysis revealed that the ablation of PIR remarkably downregulated E2F1 expression, conversely, the restoration of PIR in knockdown cells by expression of rescuing PIR recovered the expression of E2F1 in both MCF7 and MDA-MB-231 cells (Figure 3(d,e)). These data indicate that PIR is required for E2F1 expression in breast cancer cells. Consistently, the expression levels of E2F1 are higher in breast cancers than in their corresponding normal tissues (Figure 3(f)) and the expressions of PIR and E2F1 mRNA are positively correlated in breast cancer tissues according to a study from the Oncomine database (Figure 3(g)). Western blot analysis also showed that E2F1 was significantly down regulated by the treatment of PIR inhibitors (TPhA, CCG-1423 and CCG-203,911) in MCF7 and MDA-MB-231 cells in a dose dependent manner, implying that the downregulation of E2F1 might play a key role in retarded proliferation of cells with PIR depleted (Figure 3(h,i)). As we had already identified that the inhibition of PIR can downregulate E2F1, we constructed luciferase reporter plasmid containing E2F1 promoter to further dissect the mechanism how PIR regulates E2F1 expression. The overexpression of Flag-PIR significantly up regulated the reporter activity of E2F1-luc in a dose-dependent manner (Figure 3(j)). To narrow down the region of E2F1 promoter that binds the PIR protein, we divided the E2F1 promoter into 5′ terminal (−1000~-540) and 3′ terminal (−539~+101) regions and identified that only 3′ terminal region of E2F1 promoter shows similar response to PIR expression in luciferase activity assay as did the full-length promoter. These data indicate that the 3′-terminal region of E2F1 promoter is responsible for the PIR binding (Figure 3(k)). We also found the binding of PIR to E2F1 promoter through in-vitro GST pull-down assay by mixing E2F1 promoter sequence with GST tag PIR protein (Figure 3(l)). Finally, we performed in vivo ChIP-PCR assays and detected E2F1 promoter in the precipitates of PIR, establishing the binding of PIR to E2F1 promoter (Figure 3(m)). These observations indicate that PIR can activate E2F1 transcription by binding to 3′-terminal region of its promoter.
Overexpression of E2F1 recovers the proliferating ability of PIR depleted cells
As reported early overexpression of E2F1 is an oncogenic event that predisposes cells to malignant transformation [11]. To verify the link of E2F1 with tumorigenesis, we knocked down E2F1 in MCF7 and MDA-MB-231 cell lines through shRNA and found a significant decrease in cell proliferation while overexpression of PIR in shE2F1 cells failed to rescue the normal proliferation as indicated by growth curve (Figure 4(a,d)) and MTT assays (Figure 4(b,e)). The knockdown efficiencies of E2F1 in both cell lines were confirmed by Western blot (Figure 4(c,f)). Next, we examined whether the overexpression of E2F1 in PIR depleted cells can rescue the normal cell proliferation. For this purpose, we infected MCF7 and MDA-MB-231 cells with shPIR to knock down PIR and further overexpressed HA-E2F1 in PIR knock down cells. Both cells counting assays (Figure 4(g,j)) and MTT assays (Figure 4(h,k)) showed that knockdown of PIR considerably reduced cell proliferation, while the overexpression of E2F1 in PIR knockdown MCF7 and MDA-MB-231 cells significantly restored the normal cell proliferation. This observation is consistent with the protein levels of PIR knockdown and E2F1 overexpression (Figure 4(i,l)). In conclusion, downregulation of E2F1 is the predominant determinant in retarded proliferation of breast cancer cells with PIR depleted.
Figure 4.
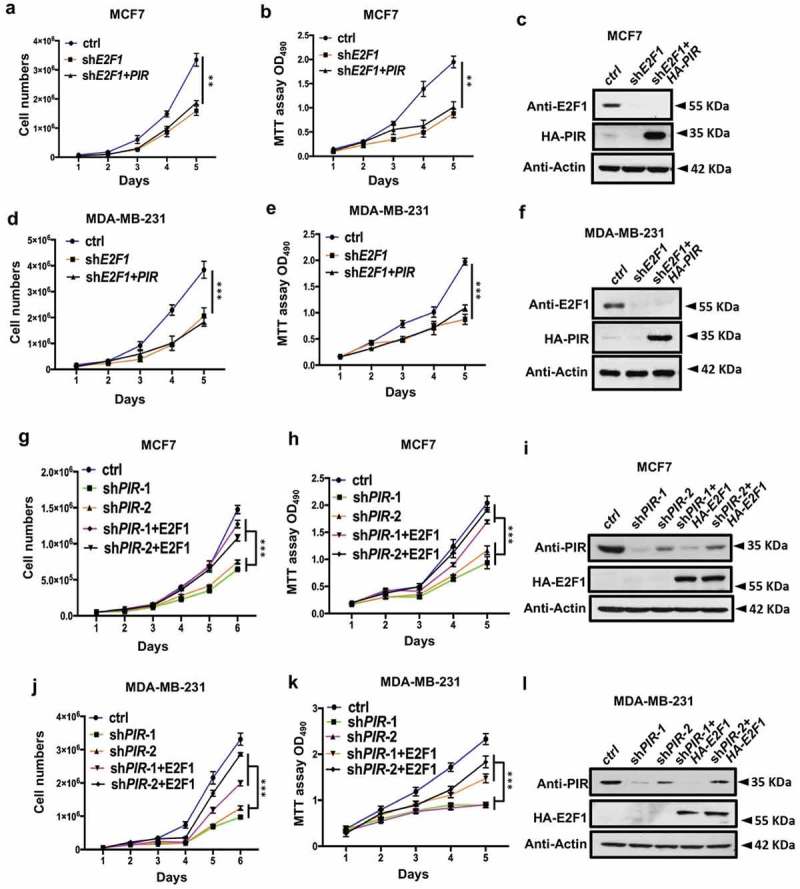
Overexpression of E2F1 recovers the cell viability in PIR depleted cell lines. (a,d) MCF7 and MDA-MB-231 cells were infected with lentiviruses expressing shE2F1 and PIR. Cells number were counted at 1, 2, 3, 4 and 5 days and the cells viability were shown by growth curves. The data are means±SEM of three independent experiments (**P< 0.01, ***P< 0.001, unpaired Students t-test). (b,e) After 1, 2, 3, 4 and 5 days of E2F1 knockdown and PIR overexpression in MCF7 and MDA-MB-231 cell lines, MTT activities were determined by measuring the absorption at 490. The data are means±SEM of three independent experiments (**P< 0.01, ***P< 0.001, unpaired Students t-test). (c,f) E2F1 and PIR protein in total cell lysates was determined by WB. (g–l) MCF7 and MDA-MB-231 cells were knocked down for PIR and further overexpressed for HA-E2F1. Cells number (g,j), MTT activity (h,k) and protein levels (i,l) were determined as in a–f. The data are means±SEM of three independent experiments (***P< 0.001, unpaired Students t-test).
PIR facilitates G1 to s phase transition of cell cycle
To further investigate the detailed mechanism of PIR mediated tumorigenesis, we knocked down PIR in MCF7 and MDA-MB-231 cell lines and found that some of the E2F1 target genes which regulate cell cycle such as cdk4, cdk6, cycE and cycD were significantly downregulated in PIR knockdown cells (Figure 5(a,b)). As we know that the transcription factor E2F1 is a key regulator of cell cycle progression and has a role in determining the progression through checkpoint at G1/S. Therefore, we tested whether this would also hold true in PIR knockdown cells. Interestingly, we found that knockdown of PIR in MDA-MB-231 cell dramatically arrested the cells at G1 phase and thus decrease the ratios of S and G2/M phases, while rescuing expression of PIR completely relieved G1 arrest (Figure 5(c)). These results demonstrate that PIR facilitates G1 to S phase transition by promoting the expression of E2F1 and its target genes. It was previously identified that E2F1 contributes to malignancy of tumor cells by activating the transcription of discoidin domain receptor 1 (DDR1) which plays an important role in many fundamental processes such as cell adhesion, migration and invasion [26]. To investigate the involvement of PIR in E2F1 mediated expression of DDR1, we knocked down PIR in MCF7 cells and found that DDR1 was markedly downregulated in PIR depleted cells and such downregulation was completely rescued by re-expression of PIR (Figure 5(d)), implying that PIR may also participate in the promotion of cell migration, invasion and metastasis by upregulating DDR1.
Figure 5.
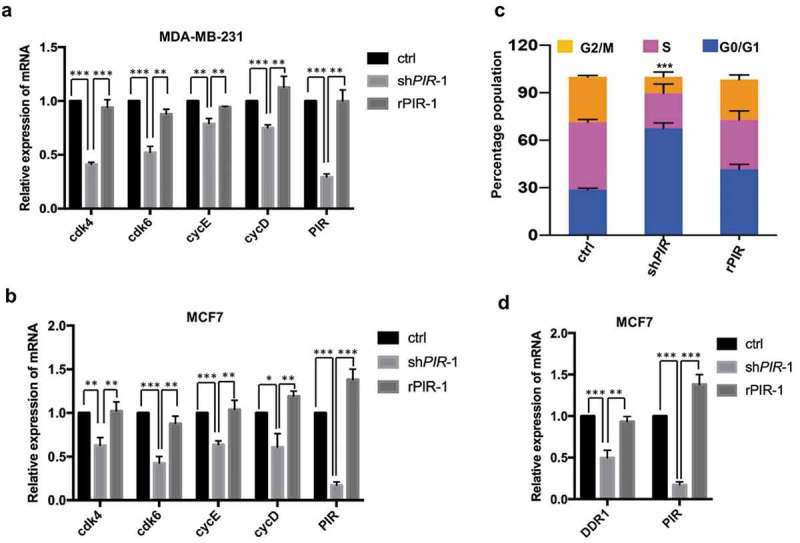
PIR facilitates G1 to S phase transition of cell cycle. (a,b) MCF7 and MDA-MB-231 cells were infected with lentiviruses expressing shPIR and rPIR. Forty-eight hours after infection the expression of cdk4, cdk6, cycE and cycD were analyzed with qRT-PCR. The data are means±SEM of three independent experiments (*P< 0.05, **P< 0.01, ***P< 0.001, unpaired Students t-test). (c) The flow cytometric analysis of cell cycle in PIR knockdown and rescuing MCF7 cells. The presented data are means±SD of three independent experiments. (***P< 0.001, Student’s t-test unpaired; compared with both control and rPIR). (d) MCF7 cells were infected with lentiviruses expressing shPIR and rPIR. Forty-eight hours after infection the expression of DDR1 was analyzed with qRT-PCR. The data are means±SEM of three independent experiments (**P< 0.01, ***P< 0.001, unpaired Students t-test).
PIR promotes tumor cell mobility, invasion and metastasis
To investigate whether PIR is involved in the promotion of tumor cell mobility, invasion and metastasis, we observed these phenotypes of the same MCF7 and MDA-MB-231 cell lines with PIR knocked down and re-expressed that we used in Figure 2. Knockdown of PIR suppressed cell mobility as measured by wound-healing assay, while re-expression of PIR significantly rescued the mobility of both MCF7 and MDA-MB-231 cells (Figure 6(a,b)). Transwell assay indicated that the invasion ability of MCF7 and MDA-MB-231 cells were remarkably disrupted by knockdown of PIR and restored by reconstitution of PIR expression (Figure 6(c,d)). Next to check the involvement of PIR in metastasis, we performed in-vivo metastasis tumor formation assay by using nude mice. We found that the knockdown of PIR in MCF7 cells significantly decreased the number of metastatic tumor on the surface of lungs as compared to control cells (Figure 6(e)). In conclusion, the above data indicate that the expression of PIR promotes the metastatic ability of breast cancer cells.
Figure 6.
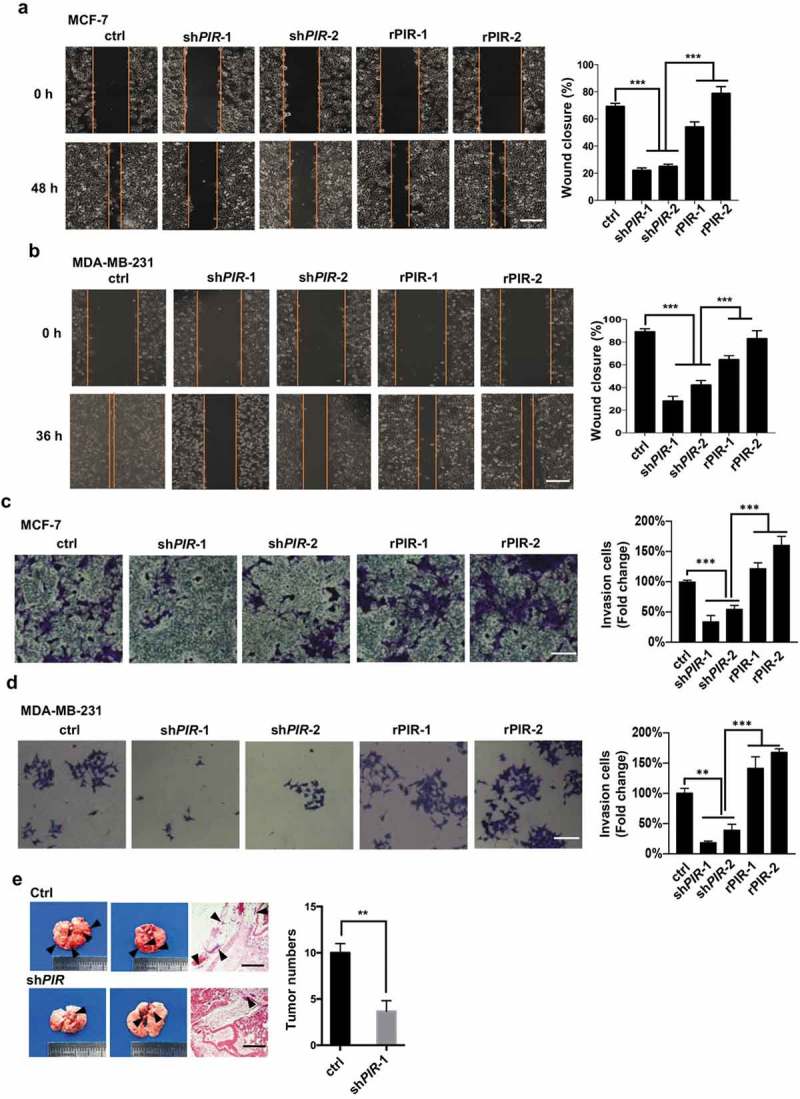
PIR promotes tumor cell migration, invasion and metastasis. (a,b) The same MCF7 (a) and MDA-MB-231 (b) cell lines with PIR knocked down and re-expressed as those used in Figure 2 were plated. After 24 h of plating, artificial wound was created by a 200 ml pipette tip, followed by determination of wound closure under microscope after another 48 h for MCF7 and 36 h for MDA-MB-231 cells. Left, representative morphologies; right, statistic results shown as means±SEM of three independent experiments (***P< 0.001, unpaired Student’s t-test). The scale bars represent 100 mm. (c,d) The transwell assay were performed with the same MCF7 (c) and MDA-MB-231 (d) cells as those used in wound healing assay. Left, representative morphologies; right, statistic results shown as means±SEM of three independent experiments (*P< 0.05, **P< 0.01,***P< 0.001, unpaired Student’s t-test). The scale bars represent 50 mm. (e) MCF7 cells (1´106 in 100 μl PBS) with PIR stably knocked down were injected into the four-week-old male BALB/c nude mice via tail veins. The mice were sacrificed after 6 weeks and pictures of metastatic lungs were taken. The scale bars represent 1 mm.
Discussion
Cancer development and progression depends on abnormal proliferation which is accomplished by distorted expression or activation of proteins related to cell cycle regulations. Identification of novel pathways that drive malignant transformation by activating cell cycle progression may provide new targets for the diagnosis and treatment of various cancers. PIR is a putative transcriptional regulator and upregulated in various tumors. However, a systematic analysis of PIR expression and their functions in human breast cancers has been lacking. In the present study, we found that excessive expression of PIR occurs in various breast cancers and promotes breast cancer cell proliferation, tumorigenesis and metastasis. First, on the basis of Oncomine databases, we found that the mRNA levels of PIR are much higher in tissues of breast cancer than in the corresponding normal tissues. Second, PIR is abundantly expresses in a lot of breast cancer cell lines including in MCF7 and MDA-MB-231, which are therefore used as model cells in this study. Third, we analyzed the breast cancer database in Oncomine and found that high expression levels of PIR are correlated with lower survival rates. Taken together, we provide multiple lines of evidence that PIR may participate in the malignant progression of breast cancer.
To explore the biological significance of PIR expression in malignancies, we knocked down PIR in MCF7 and MDA-MB-231 cell lines employing shRNA and found a dramatic decrease in cell proliferation and significantly slowed down xenograft tumor growth in nude mice. Next, we investigated the mechanism by which PIR promotes tumorigenesis and progression. We performed RNA seq assay in PIR knockdown cells and identified dramatic downregulation of pro-survival factor E2F1, which was further confirmed by real-time PCR and Western blot analysis in MCF7 and MDA-MB-231 cell lines. Next, we treated MCF7 and MDA-MB-231 cells with three reported PIR inhibitors, TphA, CCG-1423 and CCG-203,911, and found a dramatic decrease in proliferation of MCF7 and MDA-MB-231 cells, as well as the downregulation of E2F1. It is well known that transcription factor E2F1 is a key regulator of cell cycle progression and has a role in determining the G1/S transitions [27]. Consistent with the effect of E2F1 on cell cycle, knockdown of PIR dramatically blocks the G1/S transition while rescuing expression of PIR completely releases the G1 arrested cells to S phase. To provide more conclusive evidence that PIR promotes E2F1 mediated tumorigenesis, we overexpressed E2F1 in PIR knocked down MCF7 and MDA-MB-231 cells and found that overexpression of E2F1 significantly rescued the normal cell proliferation. We also found that PIR induces the luciferase activity of E2F1 promoter in a dose-dependent manner indicating that PIR promotes E2F1 transcription. However, the detailed mechanism about how PIR enhances E2F1 transcription remains far to be clarified. Through RNA seq assay, we also found that knockdown of PIR increased the expression of RB1 mRNA. This data implies that PIR may synergistically regulate both E2F1 and RB1. As RB1 is a inhibitor of E2F1, in the future we will do in-depth study to find out the role of RB1 in PIR mediated tumorigeneses. More interestingly, knocked down of PIR significantly decreased the migration and invasion of breast cancer cells in vitro and their metastasis in mice. Our research thus links PIR excessive expression to E2F1 expression, and further to cell proliferation, migration, invasion and metastasis.
In conclusion, our findings suggest that PIR stimulates tumorigenesis and progression by activating E2F1 pathway and thus provide convincing evidence for PIR as a novel druggable target for the treatment of breast cancer. In the future we will examine the therapeutic potential of PIR inhibitors toward vivo xenograft tumor in nude mice.
Funding Statement
This work was supported by the National Natural Science Foundation of China [91857102, U1705287, 31571473 and 31701252]; State Key Laboratory of Cellular Stress Biology, Xiamen University [SKLCSB2018KF007 and SKLCSB2019KF005].
Acknowledgments
In this section, you can acknowledge any support given which is not covered by the author contribution or funding sections. This may include administrative and technical support, or donations in kind (e.g., materials used for experiments).
Disclosure statement
No potential conflict of interest was reported by the authors.
References
- [1].Feitelson MA, Arzumanyan A, Kulathinal RJ, et al. Sustained proliferation in cancer: mechanisms and novel therapeutic targets. Semin Cancer Biol. 2015;35:25–54. [DOI] [PMC free article] [PubMed] [Google Scholar]
- [2].Crosby ME, Almasan A.. Opposing roles of E2Fs in cell proliferation and death. Cancer Biol Ther. 2004;3:1208–1211. [DOI] [PMC free article] [PubMed] [Google Scholar]
- [3].DeGregori J, Johnson DG. Distinct and overlapping roles for E2F family members in transcription, proliferation and apoptosis. Curr Mol Med. 2006;6:739–748. [DOI] [PubMed] [Google Scholar]
- [4].Chen C, Wells AD. Comparative analysis of E2F family member oncogenic activity. PLoS ONE. 2007;2:e912. [DOI] [PMC free article] [PubMed] [Google Scholar]
- [5].Endo-Munoz L, Dahler A, Teakle N, et al. E2F7 can regulate proliferation, differentiation, and apoptotic responses in human keratinocytes: implications for cutaneous squamous cell carcinoma formation. Cancer Res. 2009;69:1800–1808. [DOI] [PubMed] [Google Scholar]
- [6].Trimarchi JM, Lees JA. Sibling rivalry in the E2F family. Nat Rev Mol Cell Biol. 2002;3:11–20. [DOI] [PubMed] [Google Scholar]
- [7].Moon NS, Frolov MV, Kwon EJ, et al. Drosophila E2F1 has context-specific pro- and antiapoptotic properties during development. Dev Cell. 2005;9:463–475. [DOI] [PubMed] [Google Scholar]
- [8].Chong JL, Wenzel PL, Saenz-Robles MT, et al. E2f1-3 switch from activators in progenitor cells to repressors in differentiating cells. Nature. 2009;4:462–930. [DOI] [PMC free article] [PubMed] [Google Scholar]
- [9].Lee BK, Bhinge AA, Iyer VR. Wide-ranging functions of E2F4 in transcriptional activation and repression revealed by genome-wide analysis. Nucleic Acids Res. 2011;39:3558–3573. [DOI] [PMC free article] [PubMed] [Google Scholar]
- [10].DeGregori J. The genetics of the E2F family of transcription factors: shared functions and unique roles. Biochim Biophys Acta. 2002;1602:131–150. [DOI] [PubMed] [Google Scholar]
- [11].Pierce AM, Schneider-Broussard R, Gimenez-Conti IB, et al. E2F1 has both oncogenic and tumor-suppressive properties in a transgenic model. Mol Cell Biol. 1999;19:6408–6414. [DOI] [PMC free article] [PubMed] [Google Scholar]
- [12].Dunwell JM, Culham A, Carter CE, et al. Evolution of functional diversity in the cupin superfamily. Trends Biochem Sci. 2001;26:740–746. [DOI] [PubMed] [Google Scholar]
- [13].Pang H, Bartlam M, Zeng Q, et al. Crystal structure of human pirin: an iron-binding nuclear protein and transcription cofactor. J Biol Chem. 2004;279:1491–1498. [DOI] [PubMed] [Google Scholar]
- [14].Chen CC, Chow MP, Huang WC, et al. Flavonoids inhibit tumor necrosis factor-alpha-induced up-regulation of intercellular adhesion molecule-1 (ICAM-1) in respiratory epithelial cells through activator protein-1 and nuclear factor-kappaB: structure-activity relationships. Mol Pharmacol. 2004;66:683–693. [DOI] [PubMed] [Google Scholar]
- [15].Adams M, Jia Z. Structural and biochemical analysis reveal pirins to possess quercetinase activity. J Biol Chem. 2005;280:28675–28682. [DOI] [PubMed] [Google Scholar]
- [16].Wendler WM, Kremmer E, Forster R, et al. Identification of pirin, a novel highly conserved nuclear protein. J Biol Chem. 1997;272:8482–8489. [DOI] [PubMed] [Google Scholar]
- [17].Zhu G, Reynolds L, Crnogorac-Jurcevic T, et al. Combination of microdissection and microarray analysis to identify gene expression changes between differentially located tumour cells in breast cancer. Oncogene. 2003;22:3742–3748. [DOI] [PubMed] [Google Scholar]
- [18].Voz ML, Janick M, Karen H, et al. Microarray screening for target genes of the proto-oncogene PLAG1. Oncogene. 2004;23:179–191. [DOI] [PubMed] [Google Scholar]
- [19].Dechend R, Hirano F, Lehmann K, et al. The Bcl-3 oncoprotein acts as a bridging factor between NF-κB/Rel and nuclear co-regulators. Oncogene. 1999;18:3316–3323. [DOI] [PubMed] [Google Scholar]
- [20].Courtois G, Gilmore TD. Mutations in the NF-κB signaling pathway: implications for human disease. Oncogene. 2006;25:6831–6843. [DOI] [PubMed] [Google Scholar]
- [21].Park SG, Chung C, Kang H, et al. Up-regulation of cyclin D1 by HBx is mediated by NF-κB2/BCL3 complex through κB site of cyclin D1 promoter. J Biol Chem. 2006;281:31770–31777. [DOI] [PubMed] [Google Scholar]
- [22].Ahmed SU, Milner J. Basal cancer cell survival involves JNK2 suppression of a novel JNK1/c-Jun/Bcl-3 apoptotic network. PLoS One. 2009;4:e7305. [DOI] [PMC free article] [PubMed] [Google Scholar]
- [23].Massoumi R, Kuphal S, Hellerbrand C, et al. Down-regulation of CYLD expression by snail promotes tumor progression in malignant melanoma. J Exp Med. 2009;206:221–232. [DOI] [PMC free article] [PubMed] [Google Scholar]
- [24].Isao M, Siro S, Hideo O, et al. A small-molecule inhibitor shows that pirin regulates migration of melanoma cells. Nat Chem Biol. 2010;6:667–673. [DOI] [PubMed] [Google Scholar]
- [25].Lisabeth EM, Kahl D, Gopallawa I, et al. Identification of pirin as a molecular target of the CCG-1423/CCG- 203971 series of anti-fibrotic and anti-metastatic compounds. ACS Pharmacol Transl Sci. 2019;2:92–100. [DOI] [PMC free article] [PubMed] [Google Scholar]
- [26].Zhaofeng W, Xianjie S, Yi Bao JM, et al. E2F1 silencing inhibits migration and invasion of osteosarcoma cells via regulating DDR1 expression. Int J Oncol. 2016;6:1639–1650. [DOI] [PMC free article] [PubMed] [Google Scholar]
- [27].Sheldon LA. Inhibition of E2F1 activity and cell cycle progression by arsenic via retinoblastoma protein. Cell Cycle. 2017;16:2058–2072. [DOI] [PMC free article] [PubMed] [Google Scholar]