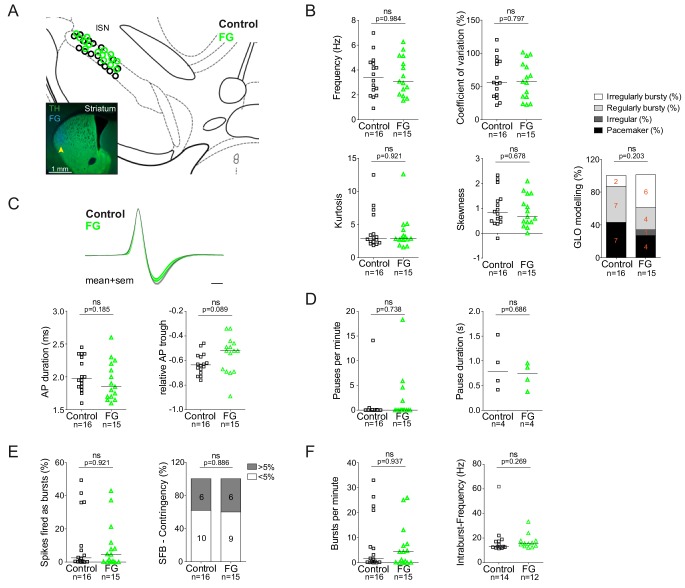
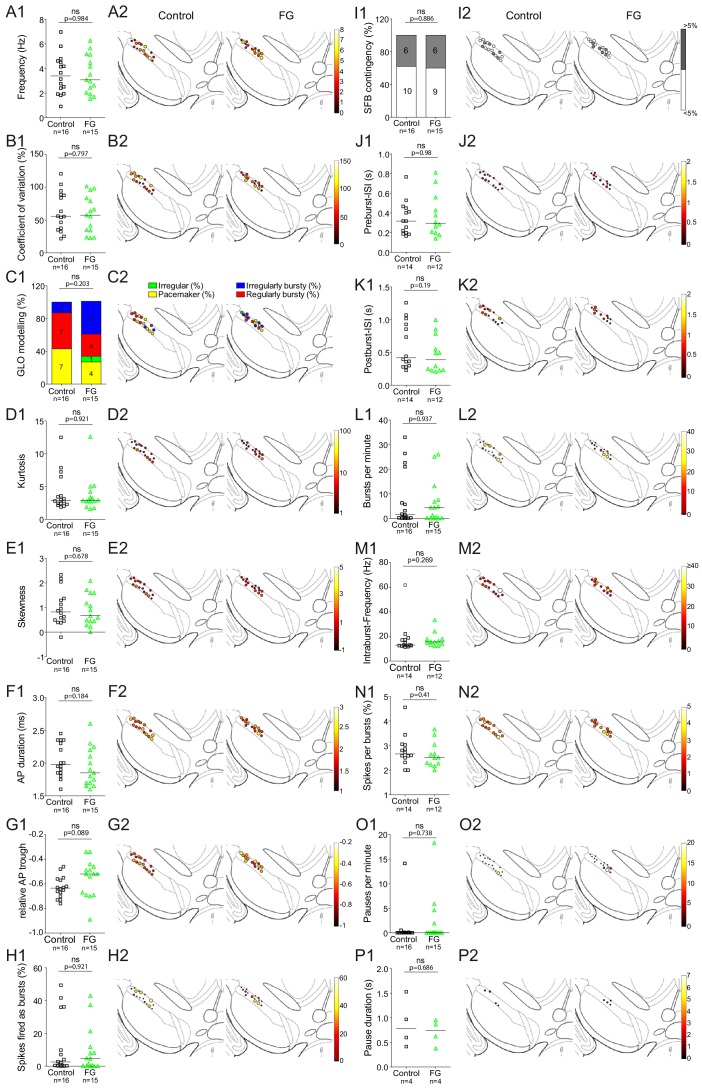
Figure 3. Retrograde tracing with highly-diluted (0.002%) fluorogold prevents perturbation of in vivo electrophysiological properties of identified nigrostriatal dopamine neurons.
(A) Anatomical mapping of all extracellularly recorded and juxtacellularly labelled neurons (projected to bregma −3.16 mm; control in black, FG-labelled in green). Note the anatomical overlap of recorded DA populations in the lSN. Inset, FG-injection site in DLS (FG in blue, TH in green). (B–F) Scatter dot-plots (line at median) showing no significant differences in firing frequency (Hz), coefficient of variation (%), kurtosis and skewness of the ISI-distributions, GLO-based firing pattern (all B), normalized AP waveform, AP duration (ms), relative AP trough (all C), pauses per minute, pause duration (s) (both D), SFB (%), SFB contingency (% of neurons > and < 5% SFB) (both E), bursts per minute, intraburst-frequency (Hz) (both F).


