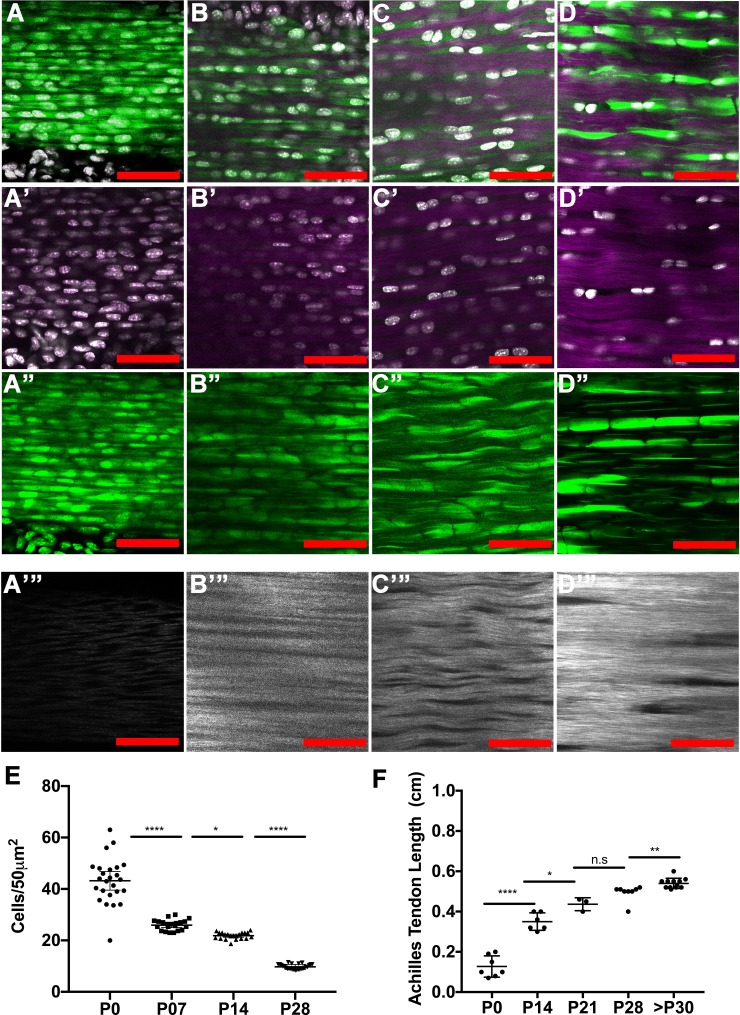
Figure 5. Tendon growth corresponds to changes in tendon cell density and matrix organization.
Two photon microscopy images of Achilles tendons showing second harmonic generation signal (purple, A-D’; white, A’’’–D’’’), Hoechst+ nuclei (white, A–D’), and Scx-GFP+ cells (green, A–D, A’’–D’’). Images show changes in cell density, cell shape, and collagen organization at P0 (A–A’’’), P7 (B–B’’’), P14 (C–C’’’), and P28 (D–D’’’). Using optical sections from 2-photon images, we found that tendon cell density significantly decreases at postnatal stages (E, each point represents cell counts from an optical section; n = 3 mice analyzed per stage). The Achilles tendon undergoes significant longitudinal growth from P0 to P30; no significant increases in Achilles length is detected after P30 (F, each point represents measurements from one mouse Achilles; n > 3 mice). Error bars are standard deviation. Scale bars = 100 µm.

