Abstract
Background
Neomorphic IDH1 mutations disrupt the redox balance by promoting reactive oxygen species (ROS) production. However, the mechanism by which IDH1-mutant cells maintain ROS homeostasis remains elusive. It is also not known whether reprogrammed ROS homeostasis establishes targetable vulnerability in IDH1-mutated cancers.
Methods
We investigated ROS homeostasis in wild-type (GSC827, GSC923, GSC627, and GSC711) and IDH1-mutated cells (IDH1R132C- and IDH1R132H-transduced U87, U251; MGG152, and TS603 cells). We analyzed the stability and transcriptional activity of NRF2 in IDH1-mutated cells. The oxidative DNA damage was analyzed using NRF2-targeting small interfering RNA. Moreover, we evaluated the effect of the NRF2 inhibitor brusatol in an IDH1-mutated subcutaneous xenograft nude mouse model (control group, n = 5; brusatol-treated group, n = 6). All statistical tests were two-sided.
Results
We showed that IDH1-mutated cells develop a dependency on the NRF2 antioxidative pathway. Genetic or pharmacologic blockade of NRF2 not only disrupted ROS homeostasis (mean [SD] ROS levels increased by 317 [42.1]%, P = .001, in IDH1R132C and by 286. 5 [48.7]%, P = .003, in IDH1R132H cells) but also enhanced oxidative DNA damage and decreased proliferation of IDH1-mutated cells. Brusatol selectively suppressed IDH1-mutated cancer progression in vivo (mean [SD] final tumor volume was 761.6 [391.6] mm3 in the control and 246.2 [215] mm3 in the brusatol-treated group, P = .02).
Conclusions
IDH1 mutation reprograms ROS homeostasis in cancer cells, which leads to dependency on the NRF2 antioxidant pathway for ROS scavenging. NRF2 blockade might be a novel therapeutic approach to treat malignancies with IDH1 mutation.
Glioma is the most frequent malignant primary brain tumor, accounting for 70% of cases in adults (1). Approximately 80% of the World Health Organization (WHO) grade II/III gliomas carry mutations in the IDH1 and IDH2 genes (2,3). IDH1 catalyzes the conversion of isocitrate to α-ketoglutarate and generates nicotinamide adenine dinucleotide phosphate (NADPH), which is involved in the maintenance of cellular redox balance. Pathogenic IDH1 mutations, such as the R132C/H variant, exhibit neomorphic activity that converts α-ketoglutarate into D-2-hydroxyglutarate (D-2-HG), simultaneously consuming NADPH (4). Several pioneer studies have suggested that IDH1 mutations are associated with NADPH and glutathione depletion, as well as elevated generation of reactive oxygen species (ROS), which could be related to malignant transformation (5–7). However, the biological relevance of IDH1 mutations and cellular redox homeostasis remains unknown. Because of the ROS burden and fragile redox homeostasis in IDH1-mutated cells, targeting the redox balance might be a promising approach for treating these tumors.
NRF2 (NFE2L2) is a transcription factor that governs redox homeostasis by initiating gene expression through binding with antioxidant response elements (ARE) in their regulatory regions (8,9). The function of NRF2 is regulated by the KEAP1/CUL1 E3 ligase complex, which mediates its ubiquitination and proteasomal degradation of NRF2. Oxidative stress disrupts KEAP1 activity, leading to the translocation of NRF2 into the nucleus and the consequent initiation of the transcription of antioxidant genes (10). In glioma, NRF2 has been found to be associated with therapy resistance and poor disease outcome (10,11). Several landmark studies revealed that brusatol, a quassinoid extracted from Brucea javanica, is a potent inhibitor of NRF2. Brusatol selectively reduces the transcriptional activity of NRF2, sensitizing tumor cells to chemotherapy (12,13). This suggests that targeting antioxidant-related pathways might lead to catastrophic consequences to ROS homeostasis, causing oxidative damage and cell death.
Because the mechanism by which IDH1-mutant cells maintain ROS homeostasis is unclear, we aimed to investigate ROS homeostasis in IDH1-mutated cells, with particular focus on NRF2 stability and transcriptional activity. We also evaluated the efficacy of targeting NRF2 using small interfering RNA as well as a chemical inhibitor brusatol. Additionally, we investigated patient-derived glioma cells to analyze the efficacy of NRF2 blockade in IDH1-mutated tumor xenografts.
Methods
Cell Culture
The U251 cell line was obtained from Sigma-Aldrich (St. Louis, MO). The U87 cell line was acquired from the American Type Culture Collection (ATCC; Manassas, VA). Cells were cultured in minimum essential alpha supplemented with 10% fetal bovine serum (Thermo Fisher Scientific, Waltham, MA). The brain tumor-initiating cell (BTIC) lines MGG152, TS603, GSC627, and GSC711 were cultured and maintained as previously described (14–17). GSC827 and GSC923 cell lines were derived from patient sample following the approval of the National Cancer Institute Institutional Review Board (18). All BTIC lines were cultured in NBE medium (19). The fibrosarcoma cell lines HT1080 and SW684 were acquired from ATCC.
Luciferase Reporter Assay
The transcriptional activity of ARE was determined using the reporter plasmid pGL4.37[luc2P/ARE/Hygro] or Dual-Luciferase Reporter Assay System (Promega, Madison, WI) according to the manufacturer’s protocol. The reporter plasmid (0.9 mg) and 0.1 mg of pRL-TK were transfected into 1×10⁵ cells using Lipofectamine 2000. Luminescence was measured using a plate reader and normalized to the amount of protein quantified or Renillaluciferase activity.
Xenograft Establishment
All animal experiments were conducted in accordance with the principles and procedures outlined in the National Institutes of Health (NIH) Guide for the Care and Use of Animals and approved by the Animal Care and Use Committee of the NIH. Four- to six-week-old athymic nude mice were injected with 5×10⁶ TS603 or GSC827 cells. Once the tumors reached above 50 mm3, the mice were randomly allocated into two groups and treated intraperitoneally with dimethylsulfoxide (DMSO) or brusatol (2 mg/kg) every other day for a total of five times, as previously described (12). Tumor size was measured using vernier calipers. The mice were sacrificed 25 days after brusatol treatment, and the tumors were harvested for analysis.
Statistical Analysis
The statistical significance of differences between two groups was analyzed using Student t tests. The statistical significance of differences among groups was tested using the one-way analysis of variance (ANOVA). We estimated the Kaplan-Meier survival curves to test for difference in survival distributions depending on the expression of oxidative response genes and IDH1 mutation status. The association between expression of oxidative response genes and disease progression was evaluated by Cox regression analysis. All statistical tests were two-sided. The results were presented as mean (SD). P values of less than .05 were considered statistically significant. All analyses were conducted using GraphPad Prism software version 7.01 (GraphPad Software, La Jolla, CA).
Detailed information on all other methods can be found in the Supplementary Methods (available online).
Results
Redox Homeostasis in IDH1-Mutated Cells
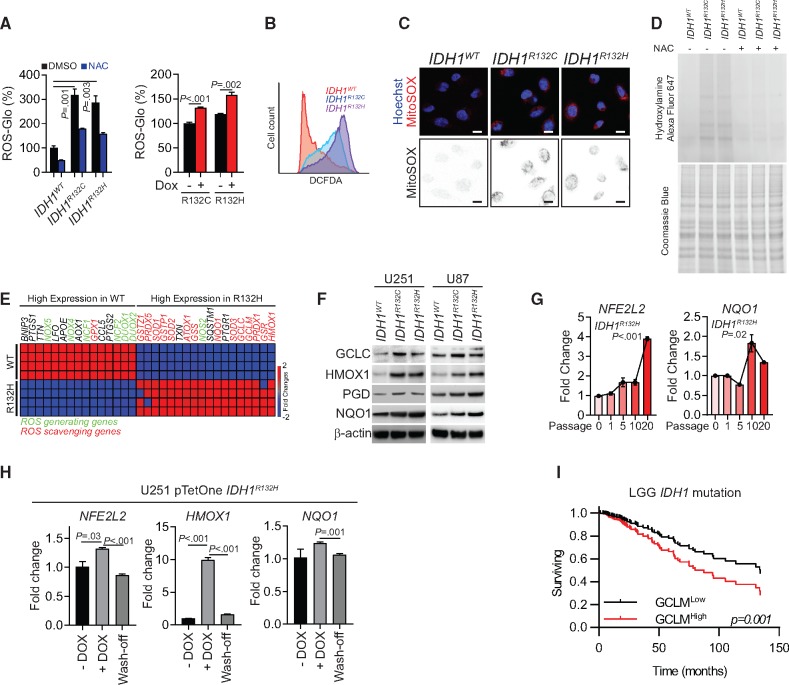
In the present study, we confirmed that mean (SD) ROS levels statistically significantly increased by 317.0 (42.1)% (P = .001) in IDH1R132C cells and 286.5 (48.7)% (P = .003) in IDH1R132H cells) when IDH1 mutations were introduced into U251 cells (Figure 1A). 2', 7'-dichlorodihydrofluorescein diacetate (H2DCFDA) flow cytometry and MitoSOX staining confirmed that the redox balance was disturbed (Figure 1, B and C). Moreover, increased protein carboxylation, a signature of protein oxidation, was found in IDH1-mutated cells (Figure 1D). To understand the molecular mechanism of reprogrammed redox balance, we compared the expression of oxidative stress response genes in IDH1WT and IDH1R132H cells. In IDH1-mutated cells, genes for ROS-scavenging enzymes such as superoxide dismutases, peroxiredoxins, and glutathione peroxidases were upregulated. Interestingly, several canonical NRF2 downstream genes such as NQO1, GCLC, GCLM, and HMOX1 were upregulated (Figure 1E), which was confirmed in IDH1-mutated U251 and U87 cell lines by immunoblotting (Figure 1F). To better understand the relationship between the NRF2 pathway and IDH1 mutation, we established doxycycline-inducible IDH1R132C/H cell lines. The upregulation of NRF2 and its downstream gene NQO1 was recorded 10–20 passages after introducing the IDH1 mutation (Figure 1G; Supplementary Figure 1A, available online). When mutated IDH1 expression was terminated, NRF2 and NQO1 expression returned to baseline levels, indicating that the IDH1 mutation and/or the high ROS environment is essential for NRF2 activity (Figure 1H;Supplementary Figure 1B, available online). Additionally, chemical inhibitors of the mutant IDH1 enzyme not only decreased D-2-HG levels but also suppressed ROS levels and the NRF2 antioxidant pathway (Supplementary Figure 1, C–E, available online). The ubiquitination assay confirmed that NRF2 degradation increased after inhibition of mutated IDH1 (Supplementary Figure 1F, available online).
Figure 1.
Redox homeostasis in IDH1-mutated cells. A) Quantification of reactive oxygen species (ROS) levels by ROS-Glo H2O2 assay is shown for IDH1-mutated U251 cells (left panel) or doxycycline (DOX)-induced mutated-IDH1 expression U251 model (right panel). All groups were normalized to IDH1WT dimethylsulfoxide group. N-acetylcysteine (NAC) was used as a ROS scavenger. B) Flow cytometry analysis of ROS level using CM-H2DCFDA staining in IDH1-mutated U251 cells is shown. C) Confocal microscopy of mitochondrial ROS in IDH1-mutated cells was performed using MitoSOX staining (red). Cell nuclei were labeled with Hoechst 33342 (blue). MitoSOX signal is highlighted in the binary image (lower panel). Scale bar = 10 μm. D) Protein carboxylation analysis was done in lysate from IDH1-mutated U251 cells (upper panel). Coomassie blue staining was used as loading control (lower panel). E) Gene expression assay quantified ROS generating and scavenging genes from IDH1WT and IDH1R132H U251 cells. F) Immunoblot analysis for expression of NRF2 and ROS scavenging genes in IDH1-mutated glioma cells is shown. β-actin was used as loading control. G) Expression of NFE2L2 and NQO1 was measured by real-time polymerase chain reaction after 10–20 passages of DOX-induced mutated-IDH1R132H expression in U251 cells. All groups were normalized to passage 0 group. H) Expression level of NFE2L2, HMOX1, and NQO1 were measured by real-time polymerase chain reaction after removing mutated-IDH1R132H expression in U251 cells. All groups were normalized to DOX group. I) Cox regression analysis for the association between IDH1-mutation status and patient outcome (n = 366) is shown for lower-grade gliomas. P values were calculated using a two-sided Student t test. Error bars represent standard deviation. DMSO = dimethylsulfoxide; LGG = low-grade glioma; NAC = N-acetylcysteine.
Furthermore, to evaluate the clinical relevance of these antioxidant genes in glioma progression, we investigated their expression in glioma patients. We found that the high expression level of glutamate-cysteine ligase modifier (GCLM), the key enzyme for glutathione synthesis, was negatively associated with overall survival and predicted poor disease outcome in IDH1-mutant low-grade gliomas (LGGs; Cox regression analysis, P<.001), implying a supportive role of the antioxidant pathway (Figure 1I). Similar trends were observed for other antioxidant genes such as GSR and HMOX1 (Supplementary Figure 2A, available online). However, the expression levels of these genes were not associated with disease outcomes in IDH1 wild-type LGG or glioblastoma (Supplementary Figure 2, B and C, available online).
NRF2 Activity in IDH1-Mutated Cells
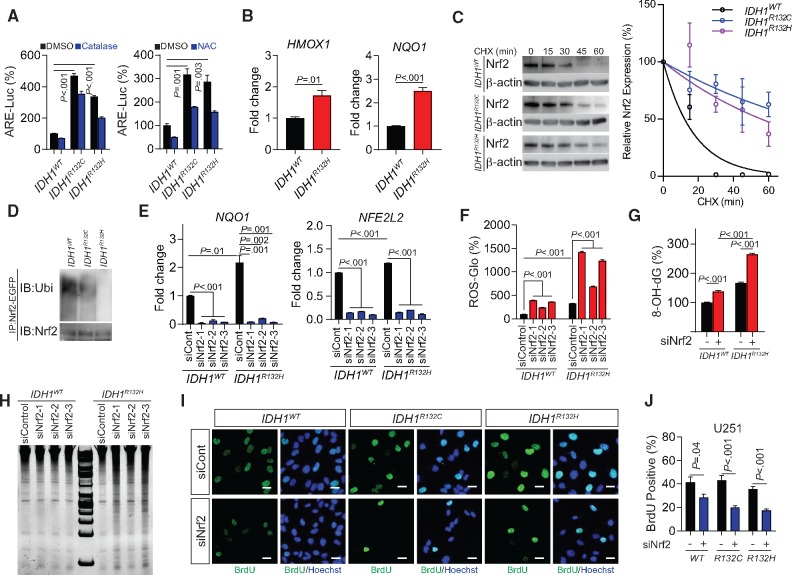
To further investigate the influence of the NRF2 antioxidant pathway, we measured NRF2 activation using an ARE-luciferase reporter assay. We recorded a marked elevation in ARE activity in IDH1-mutant cells (IDH1-mutant cells vs wildtype, all P ≤ .003), which was inhibited by application of ROS inhibitors N-acetylcysteine or catalase (Figure 2A). The chromatin immunoprecipitation (ChIP) assay confirmed increased affinity of NRF2 for NQO1 and HMOX1 promoters, suggesting that there is increased NRF2-derived transcriptional activity (Figure 2B). Moreover, the cycloheximide (CHX) chase assay showed a prolonged NRF2 protein half-life in IDH1-mutated cells (Figure 2C;Supplementary Figure 3B, available online). NRF2 ubiquitination was found to be lower in IDH1-mutant cells than their wild-type counterparts, indicating increased NRF2 stability and activation (Figure 2D). Suppression of NRF2 by each of the three siRNAs employed decreased the expression of the antioxidant gene NQO1, followed by a corresponding increase in ROS levels (Figure 2, E and F). Furthermore, we found that suppression of the NRF2/antioxidant pathway not only elevated the ROS burden but also exposed the cells to oxidation-derived damage and genetic instability. Gene silencing of NRF2 resulted in increased DNA oxidation (IDH1R132H siControl, 165.8 [8.3]% of IDH1WT siControl, siNRF2, 264.2 [10.3]%, P < .001), nucleotide fragmentation, and decreased cellular proliferation in IDH1-mutated cells (IDH1WT, siControl, 41.5 [10.9]% vs siNRF2 28.4 [7.4]%, P = .04; IDH1R132C, siControl, 43.2 [10.5]% vs siNRF2, 20.1 [3.4]%, P < .001; and IDH1R132H, siControl, 35.7 [5.2]% vs siNRF2, 17.4 [4.0]%, P < .001; Figure 2, G–J).
Figure 2.
Activity of NRF2 in IDH1-mutated cells. A) Antioxidant response elements transcriptional activity was measured using luciferase reporter assay in IDH1-mutated U251 cells with the presence of exogenous reactive oxygen species (ROS) scavenger catalase (left panel) or N-acetylcysteine (right panel). All groups were normalized to IDH1WT dimethylsulfoxide group. B) The affinity of NRF2 to the promoter region of HMOX1 and NQO1 was measured using chromatin immunoprecipitation quantitative polymerase chain reaction (PCR) assay in IDH1-mutated U251 cells. C) NRF2 protein half-lives in IDH1-mutated U251 cells were shown by cycloheximide pulse chase assay and Immunoblot (left panel). Quantification of Immunoblot band was performed using gray levels with Image J (right panel). β-actin was used as loading control. This experiment was repeated three times. D) NRF2 ubiquitination in IDH1-mutated U251 cells was shown by immunoprecipitation assay and Immunoblot. E) The mRNA levels of NFE2L2 and NQO1 were measured using real-time PCR with genetic silencing of NRF2 in IDH1WT and IDH1R132H U251 cells. F) ROS quantification using ROS-Glo H2O2 assay was performed with genetic silencing of NRF2 in IDH1-mutated U251 cells. G) Quantification of 8-hydroxydeoxyguanosine was performed using oxidative DNA damage ELISA assay in IDH1-mutated U251 cells at baseline level and with genetic silencing of NRF2 (siNRF2-1). H) DNA fragmentation was measured by electrophoresis in IDH1-mutated U251 cells with genetic silencing of NRF2. I) Cell proliferation was measured using bromodeoxyuridine (BrdU) incorporation assay in IDH1-mutated U251 cells with NRF2 silencing (siNRF2-1). BrdU was labeled with fluorescent-conjugated antibody (green). Cell nuclei were labeled with Hoechst 33342 (blue). Bar = 10 μm. J) Quantification of BrdU incorporation assay in Figure 2I using cell count with Image J was shown. For all the quantification of siRNA assay, all groups were normalized to IDH1WT siControl group. P values were calculated using a two-sided Student t test. Error bars represent standard deviation. ARE = antioxidant response elements; 8-OH-dG = 8-hydroxydeoxyguanosine; CHX = cycloheximide; DMSO = dimethylsulfoxide; NAC = N-acetylcysteine.
Effect of Brusatol on IDH1-Mutated Cells
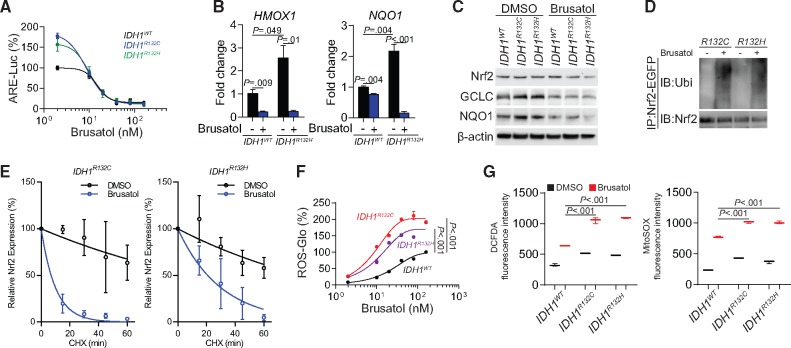
Brusatol is an extract from Brucea javanica, which was discovered as a selective inhibitor of NRF2 (12). Considering the critical roles of NRF2 in IDH1-mutated cells, we investigated the potential therapeutic value of brusatol in glioma treatment. We found that brusatol potently suppressed NRF2 activity in IDH1-mutated cells (Figure 3A). This was confirmed by investigating the transcription activity using ChIP polymerase chain reaction (PCR) and immunoblotting (Figure 3, B and C). Further, ubiquitination of NRF2 was enhanced (Figure 3D), and NRF2 protein half-life decreased after brusatol treatment (Figure 3E; Supplementary Figure 3C, available online). Interestingly, the IDH1-mutated cells showed markedly higher ROS accumulation after brusatol treatment than that observed in IDH1WT cells, indicating that the IDH1-mutated cells are dependent on the NRF2 ROS-scavenging pathway to relieve ROS burden (Figure 3, F and G).
Figure 3.
Effects of brusatol in NRF2 biology and reactive oxygen species (ROS) homeostasis. A) Antioxidant response elements transcriptional activity was measured using luciferase reporter assay in IDH1-mutated U251 cells after brusatol treatment. B) The affinity of NRF2 to the promoter regions of HMOX1 and NQO1 was measured using chromatin immunoprecipitation quantitative polymerase chain reaction assay quantifies in IDH1-mutated U251 cells with brusatol treatment. C) The expression of NRF2 downstream gene GCLC and NQO1 was measured using immunoblot in IDH1-mutated U251 cells after brusatol treatment. β-actin was used as loading control. D) NRF2 ubiquitination was measured by immunoprecipitation assay and immunoblot in IDH1-mutated U251 cells after brusatol treatment. E) Quantification of NRF2 half-lives were measured by cycloheximide pulse chase assay and immunoblot in IDH1-mutated U251 cells with brusatol treatment. This experiment was repeated three times. Data was quantified using gray levels with Image J. F) ROS quantification using ROS-Glo H2O2 assay was performed in IDH1-mutated U251 cells with brusatol treatment. G) Flow cytometry analysis using 2', 7'-dichlorodihydrofluorescein diacetate and MitoSOX staining was performed in IDH1-mutated U251 cells with brusatol treatment. All groups were normalized to IDH1WT dimethylsulfoxide group. P values were calculated using a two-sided Student t test. Error bars represent standard deviation. ARE = antioxidant response elements; CHX = cycloheximide; CM-H2DCFDA = 2', 7'-dichlorodihydrofluorescein diacetate; DMSO = dimethylsulfoxide; IB=immunoblotting.
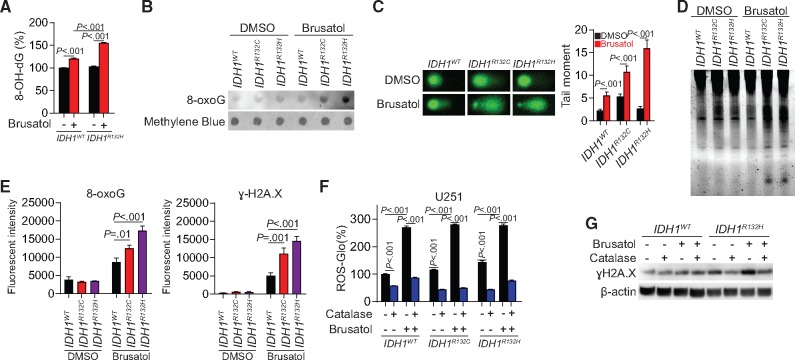
Brusatol might be especially effective in IDH1-mutant cells because they develop dependency on the NRF2/antioxidant pathway. 8-oxo-dG ELISA and dot blot results showed increased 8-oxoG levels in IDH1-mutated cells (IDH1R132H, brusatol, 155.3 [3.1]% of DMSO, P < .001; Figure 4, A and B). Similarly, comet and DNA fragmentation electrophoresis assays indicated that DNA damage and fragmentation were enhanced in IDH1-mutated cells upon brusatol treatment (P < .001; Figure 4, C and D). Immunofluorescence staining showed that both ɣH2A.X (IDH1R132C vs IDH1WT, P = .001; IDH1R132H vs IDH1WT, P < .001) and 8-oxoG (IDH1R132C vs IDH1WT, P = .01; IDH1R132H vs IDH1WT, P < .001) were increased, most notably in IDH1-mutated cells (Figure 4E). The ROS levels increased by brusatol treatment could be abolished by ROS-scavenging catalase (Figure 4F). Immunoblotting confirmed that the increased ɣH2A.X in IDH1R132H cells following brusatol treatment was mediated by increased generation of ROS because DNA damage was reduced by catalase (Figure 4G).
Figure 4.
Effect of Brusatol to the genetic integrity in IDH1-mutated cells. A) 8-hydroxydeoxyguanosine level was measured using oxidative DNA damage ELISA assay in IDH1-mutated U251 cells with brusatol treatment. B) 8-oxoguanine (8-oxoG) level was measured using dot blot assay in IDH1-mutated U251 cells with brusatol treatment. C) DNA fragmentation was measured by comet assay in IDH1-mutated U251 cells with brusatol treatment (left panel). Quantification of the tail moments is shown (right panel). D) DNA fragmentation was measured by electrophoresis in IDH1-mutated U251 cells with brusatol treatment. E) Quantification of immunofluorescent staining was performed by mean fluorescent intensity of 8-oxoG (left panel) and ɣH2A.X (right panel) in brusatol treated U251 cells. F) Reactive oxygen species (ROS) level was measured using ROS-Glo H2O2 assay in U251 cells treated with brusatol and exogenous ROS scavenger catalase. G) DNA damage (ɣH2A.X expression) was measured using Immunoblot in IDH1-mutated U251 cells treated with brusatol and ROS scavenger catalase. β-actin was used as loading control. All groups were normalized to IDH1WT dimethylsulfoxide group. P values were calculated using a two-sided Student t test. Error bars represent standard deviation. 8-OH-dG = 8-hydroxydeoxyguanosine; DMSO = dimethylsulfoxide.
Furthermore, we confirmed the tumor-suppressing effect of brusatol in BTICs and fibrosarcoma cell line with intrinsic IDH1 mutations (20): the IDH1-mutated BTIC line TS603 and fibrosarcoma cell line HT1080 exhibited increased ARE activity compared with their IDH1WT counterparts (Supplementary Figures 4A and 7A, available online). Both brusatol and ML385, a structurally irrelevant NRF2 inhibitor, inhibited ARE activity and expression of NRF2 downstream targets (Supplementary Figure 4, B and C, available online). Accordingly, ROS homeostasis was disrupted, and oxidative DNA damage and fragmentation accumulated in TS603 and HT1080 cells after NRF2 inhibition (Supplementary Figures 4, D–F, and 7, B and C, available online). These results imply that brusatol selectively inhibits NRF2 activity, which leads to the disruption of ROS homeostasis, especially in cancer cells with IDH1 mutations, where a certain ROS level is required to cause sufficient DNA damage, which may then lead to cell death pathways.
Effect of Brusatol on IDH1-Mutated Tumor Xenograft
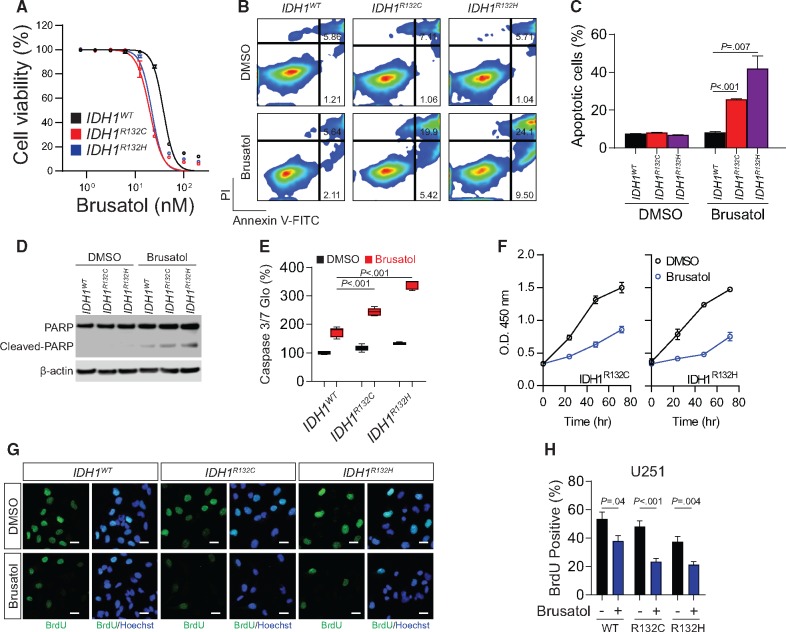
The elevated NRF2 activity in IDH1-mutated cells suggests that these tumors develop dependency on antioxidant pathways; therefore, they could be highly vulnerable to therapies disrupting redox balance. In a dose-response study, we found that IDH1-mutated cells were more vulnerable to brusatol, with IC50 of 19.82 nM for IDH1R132C and 21.87 nM for IDH1R132H, than were IDH1WT cells (IC50, 38.06 nM; nonlinear regression least squares fit; Figure 5A). The same results were obtained with ML385 (Supplementary Figure 5A, available online). The annexin-V/PI apoptosis assay showed that brusatol leads to profound apoptotic changes in IDH1-mutated U251 cells (IDH1R132C, DMSO = 8.3 [0.1]%, brusatol = 25.7 [0.3]%; IDH1R132H, DMSO = 6.9 [0.4]%, brusatol = 42.0 [11.4]%) and TS603 cells, whereas the apoptotic rate was statistically significantly lower in the corresponding IDH1WT cells (Figure 5, B and C; Supplementary Figure 5, B and C, available online; DMSO = 7.5 [0.5]%, P<.001; brusatol = 8.3 [0.8]%, P =.007). Moreover, immunoblotting showed that cleaved PARP, a marker of apoptosis, was abundant in IDH1-mutant cells treated with brusatol (Figure 5D). Likewise, the activity of caspase 3/7 was found to be increased in IDH1-mutated cells (Figure 5E). Furthermore, the growth rate of IDH1-mutated cells was markedly decreased after brusatol treatment (Figure 5F). Bromodeoxyuridine (BrdU) incorporation assay confirmed that the proliferation of IDH1-mutated cells was selectively reduced by brusatol (Figure 5, G and H).
Figure 5.
Cytotoxic effect of brusatol to IDH1-mutated cells. A) Dose-response curve of cell viability was measured by CCK8 assay in IDH1-mutated U251 cells with brusatol treatment. Data was fit to nonlinear regression. B) Cell apoptosis was measured by Annexin V/PI flow cytometry analysis in IDH1-mutated U251 cells with brusatol treatment. C) Quantification of apoptotic cells percentage in Figure 5B is shown. D) Cleaved poly (ADP-ribose) polymerase was measured using Immunoblot in IDH1-mutated U251 cells treated with brusatol. β-actin was used as loading control. E) Caspase 3/7 activity was measured using Caspase 3/7-Glo assay in IDH1-mutated U251 cells with brusatol treatment. Luminescence was measured and normalized to protein quantification. All groups were normalized to IDH1WT dimethylsulfoxide group. F) Cell proliferation was measured using CCK-8 assay in IDH1-mutated U251 cells with brusatol treatment. G) Cell proliferation was measured using bromodeoxyuridine (BrdU) incorporation immunofluorescence staining in IDH1-mutated cells with brusatol treatment. BrdU was labeled with antibody (green). Cell nuclei were labeled with Hoechst 33342 (blue). Bar = 10 μm. H) Quantification of BrdU staining in Figure 5G is shown by cell counting with Image J. P values were calculated using a two-sided Student t test. Error bars represent standard deviation. DMSO = dimethylsulfoxide; PARP = poly (ADP-ribose) polymerase; PI = propidium iodide.
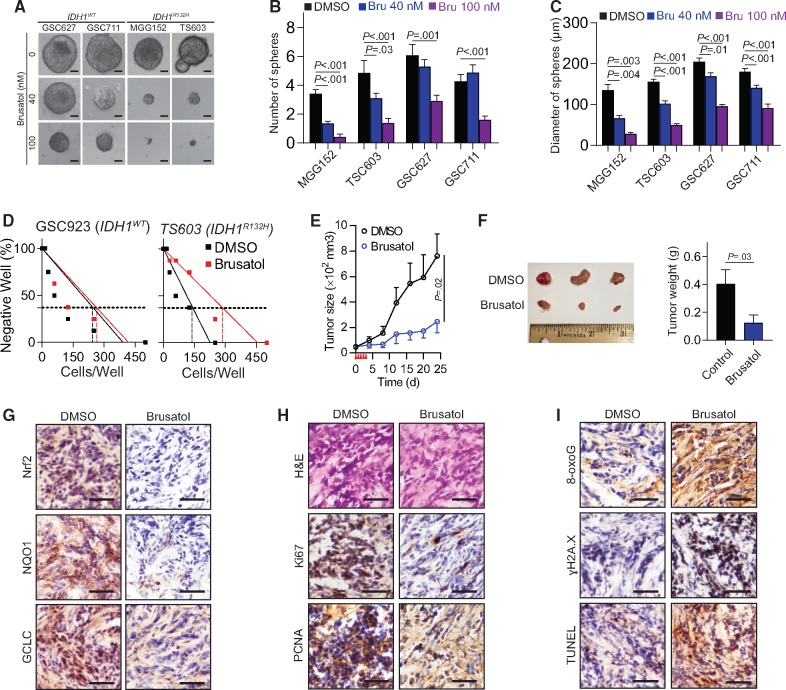
To test whether brusatol could be used as a therapeutic approach for IDH1-mutant glioma, we investigated the tumor-suppressing effect of brusatol in patient-derived BTICs in vitro. The sphere formation assay demonstrated that brusatol exhibited a robust inhibitory effect on the number and size of spheres of the IDH1-mutated BTICs MGG152 and TS603; this effect was less obvious in the IDH1WT cells GSC627 and GSC711 (Figure 6, A–C). This was confirmed by the limited dilution assay on the IDH1R132H mutated TS603 cells (0.37 intercept, DMSO=142.8 cells per well, brusatol=287.3 cells per well), but not on the IDH1WT GSC923 cells (Figure 6D; 0.37 intercept, DMSO=246.7 cells per well, brusatol=263.6 cells per well). In addition, brusatol effectively inhibited the growth of TS603 xenografts (DMSO group, n=5; brusatol group, n=6; Figure 6E). The tumor size (24 days, DMSO=761.6 [391.6] mm3, brusatol=246.2 [215] mm3, P=.02) and weight (DMSO=0.404 [0.228] g, brusatol=0.125 [0.136] g; P=.03) were statistically significantly reduced as well (Figure 6F). Histological staining (ɣH2A.X and 8-oxoG) and the TUNEL assay confirmed that brusatol impaired the NRF2 signaling pathway (Figure 6G), reduced the levels of cell proliferation markers Ki67 and PCNA (Figure 6H), and increased cytotoxic marker levels (Figure 6I). Furthermore, we treated IDH1WT GS827 xenografts with brusatol in vivo; however, no statistically significant tumor growth inhibition was observed (Supplementary Figure 6, available online). Collectively, these findings demonstrate that IDH1-mutant cells are particularly vulnerable to the oxidative stress and DNA instability, which is caused by NRF2 inhibition.
Figure 6.
Effect of brusatol to IDH1-mutated xenografts. A) Sphere formation assay was performed in brain tumor-initiating cell (BTIC) lines with brusatol treatment. (B) The quantification of spheres numbers in BTIC lines after culture. For each group, 7 to 14 regions of interest were quantified. C) The quantification of spheres diameter in BTIC lines after culture. For each group, 7 to 50 spheres were quantified. D) Sphere formation capability was measured by cell-limiting dilution assay in IDH1WT GSC927 and IDH1R132H TS603 cells with brusatol treatment. The 0.37 intercept was labeled in dash lines. E) Tumor growth curve of TS603 xenograft is shown. n = 5 for dimethylsulfoxide group, n = 6 for brusatol group. F) Tumor size and weight of TS603 xenograft is shown. Tumors were excised and weighed at the end of the experiment (25 days after treatment). G) The expression of NRF2, GCLC, and NQO1 was measured by immunohistochemistry staining in TS603 xenografts. Bar = 100 μm. H) The expression of tumor proliferation markers Ki67 and PCNA was measured by immunohistochemistry staining in TS603 xenografts. Bar = 100 μm. I) The level of DNA damage markers 8-oxoguanine and ɣH2A.X, as well as TUNEL staining, was measured by immunohistochemistry staining in TS603 xenografts. Bar = 100 μm. P values were calculated using a two-sided Student t test. Error bars represent standard deviation. 8-oxoG = 8-oxoguanine; Bru = brusatol; DMSO = dimethylsulfoxide.
Discussion
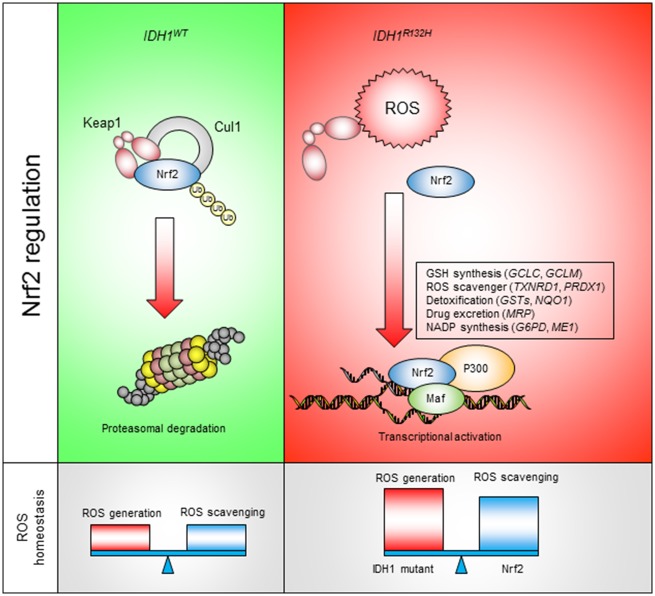
Introduction of cytotoxic oxidative stress has been proposed as a plausible therapeutic strategy for various types of cancer (21). High ROS levels not only suppress cancer cell proliferation but also trigger cell death mechanisms. In the present study, we showed that the redox homeostasis is disrupted by the IDH1 mutations R132C/H in cancer cells. The enhanced ROS production leads to oxidative modifications in major types of macromolecules; however, the IDH1-mutated cells manage to survive such high ROS levels by exploiting intrinsic antioxidant pathways to relieve the ROS burden. In fact, gene expression analysis showed an overall elevation in antioxidant gene expression, whereas ROS-generating genes were mostly downregulated. This increase in antioxidant gene expression is likely a consequence of the high ROS burden. As exogenous ROS scavengers reduce the activation of the antioxidant pathway in the presence of IDH1 mutations, the presence of the IDH1 mutations is essential for the continuous activation of antioxidant genes: once mutated IDH1 expression was terminated or inhibited by AGI5198, NRF2 expression, as well as ROS levels, decreased. Further, the activation of the antioxidant pathway predicted poor disease outcome and a decreased overall survival in IDH1-mutated LGG, but not in patients with wild-type IDH1. Considering the critical role of antioxidant pathways in cancer biology, these findings suggest that IDH1-mutated-mutant glioma develops a dependency on the antioxidant pathway, which not only supports its redox homeostasis and survival signaling but also affects oncogenesis and disease outcome (Figure 7) (11,22).
Figure 7.
Targeting NRF2 antioxidant pathway for IDH1-mutated cancers. IDHWT cells exhibit normal reactive oxygen species (ROS) burden. NRF2 is recognized by KEAP1 and constitutively removed through proteasomal degradation. In IDH1R132H cells, elevated ROS burden leads to NRF2 stabilization, nuclear translocation, and transcriptional activation of antioxidant genes. NRF2 downstream genes not only assist ROS homeostasis in IDH1-mutated cancer but also serve as potential resistance mechanism for chemotherapies.
NRF2 exhibits both oncogenic and tumor-suppressing roles in the context of cancer biology, therapy resistance, and microenvironment remodeling (23,24). Our results highlight an essential role of NRF2 in IDH1 glioma: metabolic shuffling with increased ROS detoxification capability. High NRF2 activity was found to be associated with IDH1 mutations; silencing of NRF2 further promoted ROS accumulation in IDH1-mutated cells, which increased oxidative DNA damage and limited cell proliferation. Moreover, we found that, in short-term culture, after induced expression of mutated IDH1, the redox balance varied greatly within 1–2 passages. At this stage, NRF2 activity was increased mainly by the KEAP1/CUL1 E3 ligase post-translational mechanism, as NRF2 mRNA remained unchanged. In long-term culture, i.e. after 20 passages, NRF2 mRNA and downstream genes were upregulated; this might be a result of IDH1-associated epigenetic reprogramming, because the timing matches the IDH1-induced CpG island methylator phenotype (25). Moreover, these alterations were highly dependent on IDH1 mutation, as NRF2 upregulation was reversible by eliminating mutated IDH1 expression.
The results of our study support a novel therapeutic strategy for IDH1-mutant cancers by targeting the NRF2 antioxidant pathway. This was revealed by the drastic changes in oxidative DNA damage, cellular proliferation, and xenograft expansion in vivo. Moreover, increased intracellular ROS levels may also serve to distinguish IDH1-mutated cancer cells from adjacent somatic cells with normal ROS levels, allowing selective targeting of cancer cells with minimal influence on normal cells. Although inhibitors of mutant IDH1/2 have shown promising efficacy against myeloid malignancies, their therapeutic efficacy was found less potent in solid tumors. Here, we showed that IDH1-mutated cells of several tumor types, including IDH1-transduced cells, BTICs, and the fibrosarcoma cell line HT1080, were consistently vulnerable to oxidative stress caused by brusatol-induced NRF2 inhibition.
In conclusion, our findings suggest that targeting the antioxidant pathway could be a successful strategy for treating cancers with an elevated ROS burden. However, because this study included a limited number of cell lines and IDH mutations, future preliminary studies should be conducted on a wider set of IDH mutant cell models to provide stronger justification for this approach. Moreover, clinical application will also require optimization of the molecular structure of NRF2 inhibitors to improve their toxicity profile and blood-brain barrier penetration.
Funding
This research was supported by the Intramural Research Program of the National Cancer Institute at the National Institutes of Health.
Notes
Affiliation of authors: Neuro-Oncology Branch, Center for Cancer Research, National Cancer Institute, Bethesda, MD (YL, YL, OC, AL, QW, YZ, CY).
The funders had no role in the design of the study; the collection, analysis, or interpretation of the data; the writing of the manuscript; or the decision to submit the manuscript for publication. We appreciate the help for manuscript editing from Mark R. Gilbert, MD. We appreciate the technical assistance from Dr Wei Zhang, Dr Hua Song, and Ms Dionne L. Davis to this project.
Author contributions: Yang Liu and Chunzhang Yang designed and performed experiments and wrote the manuscript; Yanxin Lu, Qixin Wu, and Yiqiang Zhou performed experiments; and Orieta Celiku and Aiguo Li interpreted data.
The authors have no conflicts of interest to disclose.
Supplementary Material
References
- 1. Ricard D, Idbaih A, Ducray F, et al. Primary brain tumours in adults. Lancet. 2012;3799830:1984–1996. [DOI] [PubMed] [Google Scholar]
- 2. Yan H, Parsons DW, Jin G, et al. IDH1 and IDH2 mutations in gliomas. N Engl J Med. 2009;3608:765–773. [DOI] [PMC free article] [PubMed] [Google Scholar]
- 3. Suzuki H, Aoki K, Chiba K, et al. Mutational landscape and clonal architecture in grade II and III gliomas. Nat Genet. 2015;475:458–468. [DOI] [PubMed] [Google Scholar]
- 4. Dang L, White DW, Gross S, et al. Cancer-associated IDH1 mutations produce 2-hydroxyglutarate. Nature. 2009;4627274:739–744. [DOI] [PMC free article] [PubMed] [Google Scholar]
- 5. Kolker S, Pawlak V, Ahlemeyer B, et al. NMDA receptor activation and respiratory chain complex V inhibition contribute to neurodegeneration in d-2-hydroxyglutaric aciduria. Eur J Neurosci. 2002;161:21–28. [DOI] [PubMed] [Google Scholar]
- 6. Latini A, Scussiato K, Rosa RB, et al. D-2-hydroxyglutaric acid induces oxidative stress in cerebral cortex of young rats. Eur J Neurosci. 2003;1710:2017–2022. [DOI] [PubMed] [Google Scholar]
- 7. Shi J, Sun B, Shi W, et al. Decreasing GSH and increasing ROS in chemosensitivity gliomas with IDH1 mutation. Tumour Biol. 2015;362:655–662. [DOI] [PubMed] [Google Scholar]
- 8. Motohashi H, Yamamoto M.. Nrf2-Keap1 defines a physiologically important stress response mechanism. Trends Mol Med. 2004;1011:549–557. [DOI] [PubMed] [Google Scholar]
- 9. Zhang DD. Mechanistic studies of the Nrf2-Keap1 signaling pathway. Drug Metab Rev. 2006;384:769–789. [DOI] [PubMed] [Google Scholar]
- 10. Kobayashi M, Yamamoto M.. Molecular mechanisms activating the Nrf2-Keap1 pathway of antioxidant gene regulation. Antioxid Redox Signal. 2005;7(3–4):385–394. [DOI] [PubMed] [Google Scholar]
- 11. Jaramillo MC, Zhang DD.. The emerging role of the Nrf2-Keap1 signaling pathway in cancer. Genes Dev. 2013;2720:2179–2191. [DOI] [PMC free article] [PubMed] [Google Scholar]
- 12. Ren D, Villeneuve NF, Jiang T, et al. Brusatol enhances the efficacy of chemotherapy by inhibiting the Nrf2-mediated defense mechanism. Proc Natl Acad Sci USA. 2011;1084:1433–1438. [DOI] [PMC free article] [PubMed] [Google Scholar]
- 13. Olayanju A, Copple IM, Bryan HK, et al. Brusatol provokes a rapid and transient inhibition of Nrf2 signaling and sensitizes mammalian cells to chemical toxicity-implications for therapeutic targeting of Nrf2. Free Radic Biol Med. 2015;78:202–212. [DOI] [PMC free article] [PubMed] [Google Scholar]
- 14. Zhang S, Zhao BS, Zhou A, et al. m(6)A Demethylase ALKBH5 maintains tumorigenicity of glioblastoma stem-like cells by sustaining FOXM1 expression and cell proliferation program. Cancer Cell. 2017;314:591–606 e6. [DOI] [PMC free article] [PubMed] [Google Scholar]
- 15. Wakimoto H, Tanaka S, Curry WT, et al. Targetable signaling pathway mutations are associated with malignant phenotype in IDH-mutant gliomas. Clin Cancer Res. 2014;2011:2898–2909. [DOI] [PMC free article] [PubMed] [Google Scholar]
- 16. Rohle D, Popovici-Muller J, Palaskas N, et al. An inhibitor of mutant IDH1 delays growth and promotes differentiation of glioma cells. Science. 2013;3406132:626–630. [DOI] [PMC free article] [PubMed] [Google Scholar]
- 17. Bhat KPL, Balasubramaniyan V, Vaillant B, et al. Mesenchymal differentiation mediated by NF-kappaB promotes radiation resistance in glioblastoma. Cancer Cell. 2013;243:331–346. [DOI] [PMC free article] [PubMed] [Google Scholar]
- 18. Lee J, Kotliarova S, Kotliarov Y, et al. Tumor stem cells derived from glioblastomas cultured in bFGF and EGF more closely mirror the phenotype and genotype of primary tumors than do serum-cultured cell lines. Cancer Cell. 2006;95:391–403. [DOI] [PubMed] [Google Scholar]
- 19. Yang C, Iyer RR, Yu AC, et al. beta-Catenin signaling initiates the activation of astrocytes and its dysregulation contributes to the pathogenesis of astrocytomas. Proc Natl Acad Sci USA. 2012;10918:6963–6968. [DOI] [PMC free article] [PubMed] [Google Scholar]
- 20. Singh A, Venkannagari S, Oh KH, et al. Small molecule inhibitor of NRF2 selectively intervenes therapeutic resistance in KEAP1-deficient NSCLC tumors. ACS Chem Biol. 2016;1111:3214–3225. [DOI] [PMC free article] [PubMed] [Google Scholar]
- 21. Gorrini C, Harris IS, Mak TW.. Modulation of oxidative stress as an anticancer strategy. Nat Rev Drug Discov. 2013;1212:931–947. [DOI] [PubMed] [Google Scholar]
- 22. Harris IS, Treloar AE, Inoue S, et al. Glutathione and thioredoxin antioxidant pathways synergize to drive cancer initiation and progression. Cancer Cell. 2015;272:211–222. [DOI] [PubMed] [Google Scholar]
- 23. Sporn MB, Liby KT.. NRF2 and cancer: the good, the bad and the importance of context. Nat Rev Cancer. 2012;128:564–571. [DOI] [PMC free article] [PubMed] [Google Scholar]
- 24. Menegon S, Columbano A, Giordano S.. The dual roles of NRF2 in cancer. Trends Mol Med. 2016;227:578–593. [DOI] [PubMed] [Google Scholar]
- 25. Turcan S, Rohle D, Goenka A, et al. IDH1 mutation is sufficient to establish the glioma hypermethylator phenotype. Nature. 2012;4837390:479–483. [DOI] [PMC free article] [PubMed] [Google Scholar]
Associated Data
This section collects any data citations, data availability statements, or supplementary materials included in this article.


