

Abstract
Background
Fluoxetine is a serotonin reuptake inhibitor indicated for major depression. It is also thought to affect weight control: this seems to happen through appetite changes resulting in decreased food intake and normalisation of unusual eating behaviours. However, the benefit‐risk ratio of this off‐label medication is unclear.
Objectives
To assess the effects of fluoxetine for overweight or obese adults.
Search methods
We searched the Cochrane Library, MEDLINE, Embase, LILACS, the ICTRP Search Portal and ClinicalTrials.gov and World Health Organization (WHO) ICTRP Search Portal. The last date of the search was December 2018 for all databases, to which we applied no language restrictions .
Selection criteria
We included randomised controlled trials (RCTs) comparing the administration of fluoxetine versus placebo, other anti‐obesity agents, non‐pharmacological therapy or no treatment in overweight or obese adults without depression, mental illness or abnormal eating patterns.
Data collection and analysis
Two review authors independently screened abstracts and titles for relevance. Screening for inclusion, data extraction and risk of bias assessment was performed by one author and checked by the second. We assessed trials for the overall certainty of the evidence using the GRADE instrument. For additional information we contacted trial authors by email. We performed random‐effects meta‐analyses and calculated the risk ratio (RR) with 95% confidence intervals (95% CI) for dichotomous outcomes and the mean difference (MD) with 95% CI for continuous outcomes.
Main results
We identified 1036 records, scrutinized 52 full‐text articles and included 19 completed RCTs (one trial is awaiting assessment). A total of 2216 participants entered the trials, 1280 participants were randomly assigned to fluoxetine (60 mg/d, 40 mg/d, 20 mg/d and 10 mg/d) and 936 participants were randomly assigned to various comparison groups (placebo; the anti‐obesity agents diethylpropion, fenproporex, mazindol, sibutramine, metformin, fenfluramine, dexfenfluramine, fluvoxamine, 5‐hydroxy‐tryptophan; no treatment; and omega‐3 gel). Within the 19 RCTs there were 56 trial arms. Fifteen trials were parallel RCTs and four were cross‐over RCTs. The participants in the included trials were followed up for periods between three weeks and one year. The certainty of the evidence was low or very low: the majority of trials had a high risk of bias in one or more of the risk of bias domains.
For our main comparison group — fluoxetine versus placebo — and across all fluoxetine dosages and durations of treatment, the MD was −2.7 kg (95% CI −4 to −1.4; P < 0.001; 10 trials, 956 participants; low‐certainty evidence). The 95% prediction interval ranged between −7.1 kg and 1.7 kg. The MD in body mass index (BMI) reduction across all fluoxetine dosages compared with placebo was −1.1 kg/m² (95% CI −3.7 to 1.4; 3 trials, 97 participants; very low certainty evidence). Only nine placebo‐controlled trials reported adverse events. A total of 399 out of 627 participants (63.6%) receiving fluoxetine compared with 352 out of 626 participants (56.2%) receiving placebo experienced an adverse event. Random‐effects meta‐analysis showed an increase in the risk of having at least one adverse event of any type in the fluoxetine groups compared with placebo (RR 1.18, 95% CI 0.99 to 1.42; P = 0.07; 9 trials, 1253 participants; low‐certainty evidence). The 95% prediction interval ranged between 0.74 and 1.88. Following fluoxetine treatment the adverse events of dizziness, drowsiness, fatigue, insomnia and nausea were observed approximately twice as often compared to placebo. A total of 15 out of 197 participants (7.6%) receiving fluoxetine compared with 12 out of 196 participants (6.1%) receiving placebo experienced depression. The RR across all fluoxetine doses compared with placebo was 1.20 (95% CI 0.57 to 2.52; P = 0.62; 3 trials, 393 participants; very low certainty evidence). All‐cause mortality, health‐related quality of life and socioeconomic effects were not reported.
The comparisons of fluoxetine with other anti‐obesity agents (3 trials, 234 participants), omega‐3 gel (1 trial, 48 participants) and no treatment (1 trial, 60 participants) showed inconclusive results (very low certainty evidence).
Authors' conclusions
Low‐certainty evidence suggests that off‐label fluoxetine may decrease weight compared with placebo. However, low‐certainty evidence suggests an increase in the risk for dizziness, drowsiness, fatigue, insomnia and nausea following fluoxetine treatment.
Plain language summary
Fluoxetine for overweight or obese adults
Review question What are the effects of fluoxetine treatment in overweight or obese adults?
Background Fluoxetine is a medicine used for the treatment of depression, which reduces appetite as a side effect. Therefore, it is suspected that fluoxetine could be used as a treatment for overweight or obese people. In this group of people administration of fluoxetine means an off‐label treatment which means it is not licensed for treating obesity.
Study characteristics We found 19 randomised controlled trials (clinical studies where people are randomly put into one of two or more treatment groups) evaluating mainly women receiving different doses of fluoxetine. A total of 1280 overweight or obese participants received fluoxetine and 936 participants received mainly placebo or another anti‐obesity medication. The participants in the included studies were followed up for periods varying between three weeks and one year.
Key results For our main comparison group — fluoxetine compared with placebo — and for all fluoxetine doses there was a 2.7 kg weight loss in favour of fluoxetine. We are uncertain, however, if an additional study would again show a benefit for fluoxetine. A total of 399 out of 627 participants (63.6%) receiving fluoxetine compared with 352 out of 626 participants (56.2%) receiving placebo experienced a side effect. Dizziness, drowsiness, fatigue, insomnia and nausea were observed approximately twice as often after fluoxetine compared to placebo. A total of 15 out of 197 participants (7.6%) receiving fluoxetine compared with 12 out of 196 participants (6.1%) receiving placebo experienced depression. The studies did not report on death from any cause, health‐related quality of life and socioeconomic effects.
This evidence is up to date as of December 2018.
Certainty of the evidence The overall certainty of the evidence was low or very low, mainly because of the small number of studies per outcome measurement and the small number of participants.
Summary of findings
Summary of findings 1. Summary of findings: fluoxetine compared with placebo.
| Fluoxetine compared with placebo | ||||||
|
Population: overweight or obese adults Settings: outpatients Intervention: fluoxetine Comparison: placebo | ||||||
| Outcomes | Placebo | Fluoxetine | Relative effect (95% CI) | No of participants (trials) | Certainty of the evidence (GRADE) | Comments |
|
Weight loss (kg) (a) All fluoxetine dosages (b) Fluoxetine 60 mg/d (c) Fluoxetine 40 mg/d (d) Fluoxetine 20 mg/d Follow‐up: (a) 11 days to 52 weeks (b) 11 days to 52 weeks (c) 8 & 12 weeks (d) 8 weeks to 52 weeks |
(a) The mean weight loss ranged across placebo groups from −4.9 kg to 0.3 kg (b) The mean weight loss ranged across placebo groups from −4.9 kg to 0.3 kg (c) The mean weight loss ranged across placebo groups from −1.7 kg to −0.5 kg (d) The mean weight loss ranged across placebo groups from −3.1 kg to −0.5 kg |
(a) The mean weight loss in the fluoxetine groups was 2.7 kg higher (4 kg higher to 1.4 kg higher) (b) The mean weight loss in the fluoxetine groups was 2.5 kg higher (3.8 kg higher to 1.2 kg higher) (c) The mean weight loss in the fluoxetine groups was 4 kg higher (8.8 kg higher to 0.8 kg lower) (d) The mean weight loss in the fluoxetine groups was 1.5 kg higher (3.5 kg higher to 0.5 kg lower) |
— | (a) 956 (10) (b) 819 (7) (c) 182 (2) (d) 279 (3) |
(a) & (b) ⊕⊝⊝⊝ lowa (c) & (d) ⊝⊝⊝⊝ verylowb |
(a) The 95% prediction interval ranged between −7.1 kg and 1.7 kg (b) The 95% prediction interval ranged between −6.4 kg and 1.4 kg |
| Health‐related quality of life | Not reported | |||||
|
Any adverse event (N) Follow‐up: median 3 months, maximum 12 months |
562 per 1000 | 664 per 1000 (557 to 798) | RR 1.18 (0.99 to 1.42) | 1253 (9) | ⊕⊝⊝⊝ lowc | Only 9/19 trials reported on the outcome 'any adverse event' Adverse events dizziness, drowsiness, fatigue, insomnia and nausea were observed approximately twice as often following fluoxetine treatment |
|
Anthropometric measurements other than weight loss in kg (BMI reduction measured inkg/m²) Follow‐up: median 3 months, maximum 12 months |
The mean BMI ranged across placebo groups from −0.4 kg/m² to −1.2 kg/m² | The mean BMI reduction in the fluoxetine groups was 1.1 kg/m² higher (3.7 kg/m² higher to 1.4 kg/m² lower) | — | 97 (3) | ⊕⊝⊝⊝ very lowd | |
|
Morbidity: depression (N) Follow‐up: median 9.2 months |
61 per 1000 | 73 per 1000 (35 to 154) | RR 1.20 (0.57 to 2.52) | 393 (3) | ⊕⊝⊝⊝ very lowe | |
| All‐cause mortality | Not reported | |||||
| Socioeconomic effects | Not reported | |||||
| *The basis for the assumed risk (e.g. the median control group risk across studies) is provided in footnotes. The corresponding risk (and its 95% CI) is based on the assumed risk in the comparison group and the relative effect of the intervention (and its 95% CI). BMI: boy mass index; CI: confidence interval; RR: risk ratio | ||||||
| GRADE Working Group grades of evidence High quality: Further research is very unlikely to change our confidence in the estimate of effect. Moderate quality: Further research is likely to have an important impact on our confidence in the estimate of effect and may change the estimate. Low quality: Further research is very likely to have an important impact on our confidence in the estimate of effect and is likely to change the estimate. Very low quality: We are very uncertain about the estimate. | ||||||
aDowngraded by 1 level because of reporting bias and by 1 level because of imprecision (small median sample size) ‒ see Appendix 1 bDowngraded by 1 level because of reporting bias and attrition bias, by 1 level because of inconsistency (point estimates varied widely) and by 1 level because of imprecision (small median sample size, small number of trials) ‒ see Appendix 1 cDowngraded by 1 level because of reporting bias and attrition bias, and by 1 level because of imprecision (small median sample) ‒ see Appendix 1 dDowngraded by 1 level because of reporting bias and performance bias and by 2 levels because of imprecision (CI consistent with benefit and harm, small median sample size, small number of trials) ‒ see Appendix 1 eDowngraded by 1 level because of reporting bias, performance bias and attrition bias, and by 2 levels because of imprecision (CI consistent with benefit and harm, small median sample size, small number of trials) ‒ see Appendix 1
Background
Description of the condition
Excess body weight is the sixth most important risk factor contributing to the overall burden of non‐communicable diseases (NCDs) worldwide. Over the past 30 years, the prevalence of weight gain has considerably increased in high‐, low‐ and middle‐income countries. According to the latest available estimates and projections, the World Health Organization (WHO) indicated that approximately 1.9 billion adults aged 18 years and over were overweight and 600 million were obese in 2014 (WHO 2014). In addition, the projection for the next 15 years is not promising: if current secular trends continue at the same pace, by 2030 the estimated total numbers of overweight and obese people will be 2.16 billion and 1.12 billion, respectively (Kelly 2008), with most residing in low‐ and middle‐income countries.
It is well known that NCDs are the leading causes of death worldwide. Of the 57 million deaths that occurred in 2008, the majority (36 million) were attributed to cardiovascular diseases, diabetes, cancers and chronic respiratory diseases (WHO 2014).
Body mass index (BMI) is useful for identifying individuals who are overweight and obese in adult populations. BMI is calculated by dividing a person's weight (in kilograms) by the square of her/his height (in metres) (kg/m²). Individuals with a BMI ranging from 25 to 29.9 are classified as being overweight, and those with a BMI of 30 or more are considered obese. Weight gain is associated with NCDs, including cardiovascular diseases, stroke, hypertension, osteoarthritis, fatty liver, several types of cancers, metabolic syndrome, respiratory disorders and type 2 diabetes mellitus (Haslam 2005; WHO 2014).
Obesity has become a major public health concern, and it alone represents an independent risk factor for cardiovascular disease; therefore, the global state of this condition necessitates effective preventive and therapeutic strategies to reduce its prevalence and abate the costs of complications. The adverse health consequences of obesity are manifold, potentially involving all major organ systems and the detriment of health‐related quality of life (NTF 2000). It has been shown, moreover, that life expectancy is reduced by seven years in obese individuals aged 40 years and older (Peeters 2003).
Description of the intervention
Non‐pharmacological, pharmacological and surgical strategies to reduce weight and maintain weight loss over time should be made available to individuals with these conditions. Pharmacological therapy has been used for some people, in addition to behaviour‐changing interventions, to facilitate weight loss and prevent weight rebound for a certain period of time.
Fluoxetine is a selective serotonin reuptake inhibitor (SSRI) with the capacity to enhance serotonin activity. Although it has not been approved for weight loss, it is being prescribed for this indication (Anelli 1992).
Approved indications for fluoxetine are major depression, obsessive behaviours, panic disorders and bulimia (Aigner 2011; Beasley 1990; Halpern 2003; Peeters 2003). However, physicians have used it off‐label to promote weight loss (Goldstein 1994; Reimherr 1998; Serretti 2010).
Adverse effects of the intervention
The adverse effects of fluoxetine with incidences of greater than 5% are headache, nausea, somnolence, asthenia, diarrhoea, insomnia, nervousness, sweating and tremor (Wise 1992). Additionally sexual dysfunction has been reported, including erectile dysfunction, anorgasmia and diminished libido, which have been well documented in 30% to 70% of people and frequently result in treatment non‐compliance (Colman 2012; Wenthur 2014).
How the intervention might work
As endogenous serotonin levels respond to both deprivation and energy excess, and reduced caloric intake lowers central nervous system serotonin levels and turnover, this neurotransmitter appears to operate on appetite. Fluoxetine acts specifically by blocking the reuptake of serotonin (5‐hydroxytryptamine (5‐HT)), which is a neurotransmitter shown to reduce food intake by preventing the membrane uptake carrier transport of serotonin from the extracellular space to the inside of serotonin nerve terminals (Leibowitz 1990). Fluoxetine increases extracellular concentrations of serotonin and amplifies signals sent by serotonin neurons. Because serotonin neurons are widespread in the central nervous system, the functional consequences of blocking its uptake are diverse and include symptoms such as decreased food intake; altered food selection; endocrine changes (increases in adrenocorticotropic hormone and corticosterone concentrations, potentiating a 5‐HT‐induced rise of corticosterone and prolactin concentrations) (Fuller 1991); and normalisation of unusual eating behaviours (such as the frequency and severity of binge eating episodes) (Halford 2008).
Additionally, the hypophagic effects of serotonergic drugs appear to be influenced by the anorexigenic melanocortin system. The hypothalamic serotonin satiety system is known to interact with orexigenic systems, a family of peptides that stimulate food consumption in the hypothalamus; major orexigenic representatives are orexin and neuropeptide Y (Gutiérrez 2002). In the case of serotonin, its potent anorexigenic effect can block hunger signals produced by neuropeptide Y (Dryden 1996; Ioannides‐Demos 2005). Furthermore, the hypophagic effects of serotonergic drugs appear to extend the effect to another anorexigenic system such as that driven by melanocortin. It has been postulated that fluoxetine can generate a reduction in body weight gain by inhibiting neuropeptide Y action in the paraventricular nucleus of the hypothalamus, a site where neuropeptide Y exerts its hyperphagic effects (Dryden 1996; Gutiérrez 2002). The neurons of the hypothalamic paraventricular nucleus contain moderate to abundant levels of serotonin receptor subtypes related to hypophagia (2A and 1B). The proximity of neuropeptide Y and 5‐HT neurons in the hypothalamus suggest that these two systems may interact on hyperphagia/hypophagia regulation but serotonin may also be responsible for altered appetite and feeding behaviours. In addition, these neurons contain corticotrophin‐releasing factor too, a neuropeptide that suppresses feeding behaviours (Boisvert 2011; Ioannides‐Demos 2005).
The effects of fluoxetine in reducing caloric intake by modifying appetite have been documented in both lean and obese humans. Specifically, this drug may reduce appetite before and after the consumption of fixed caloric loads, decreasing pre‐meal appetite and caloric intake during unrestricted meals (Halford 2007; McGuirk 1990). There are also some speculations that fluoxetine contributes to weight loss by increasing resting energy expenditure (Halford 2005; Suplicy 2013).
Why it is important to do this review
Fluoxetine is an SSRI that affects weight control, and can be used either alone or in combination with other behaviour‐changing or pharmacological interventions. The benefit‐risk ratio of this drug is, however, unclear. There has been no systematic review performed to date to evaluate the effects of fluoxetine in overweight or obese adult people. Given the prevalence of being overweight and obesity, it is important to establish the possible impact of fluoxetine on people affected by these conditions.
Objectives
To assess the effects of fluoxetine for overweight or obese adults.
Methods
Criteria for considering studies for this review
Types of studies
We included randomised controlled trials (RCT) comparing the administration of fluoxetine versus another pharmacological therapy with anti‐obesity agents, no treatment or placebo for overweight or obese adults.
Types of participants
We included adults (aged 18 years and older) who were overweight or obese according to WHO 2000 criteria, with or without comorbidities, of any ethnicity, who received fluoxetine as treatment for this condition.
Diagnostic criteria for being overweight and obese
We calculated BMI by dividing a person's weight by the square of her/his height (kg/m²). We calculated a range of between 25 and 29.9 as overweight, and 30 or more as indicating obesity (WHO 2014).
Types of interventions
We planned to investigate the following comparisons of any treatment duration of fluoxetine versus a control/comparator.
Intervention
Fluoxetine
Comparator
Placebo
Another anti‐obesity agent (e.g. orlistat, metformin)
Non‐pharmacological therapy for overweight or obesity (e.g. diet, exercise)
No treatment
Concomitant interventions had to be identical in the intervention and comparator groups to establish fair comparisons.
If a trial included multiple arms, we included any arm that met our review inclusion criteria.
Minimum duration of intervention
Minimal duration of intervention was three days.
Summary of specific exclusion criteria
We excluded trials of the following categories of participants.
Children
Pregnant women
People with diabetes mellitus
People with polycystic ovary syndrome
People with schizophrenia
People with eating disorders
People with HIV infection
People with cancer
Types of outcome measures
Primary outcomes
Weight loss (kg)
Health‐related quality of life
Adverse events
Secondary outcomes
Anthropometric measurements other than weight loss in kg
Morbidity
All‐cause mortality
Socioeconomic effects
Method of outcome measurement
Weight loss: measured in kg.
Health‐related quality of life: evaluated by a validated instrument, such as the Short‐Form Health Survey (SF‐36) or the 12‐item Short‐Form Health Survey (SF‐12).
Adverse events: such as headache, nausea, somnolence, asthenia, diarrhoea, insomnia, nervousness, sweating, tremor.
Anthropometric measurements other than weight loss in kg: defined as BMI.
Morbidity: cardiovascular diseases and psychiatric disorders.
All‐cause mortality: defined as death from any cause.
Socioeconomic effects: such as costs of treatment, hospitalisation, resources lost due to illness by the participant or absence from work.
Timing of outcome measurement
For weight loss, health‐related quality of life and anthropometric measurements: at 3, 6 and 12 months.
For adverse events, morbidity and all‐cause mortality: at any time after the randomisation of participants to intervention/comparator groups.
Socioeconomic effects: measured for up to 12 months.
Search methods for identification of studies
Electronic searches
We searched the following sources from the inception of each database to the specified date and placed no restrictions on the language of publications.
Cochrane Central Register of Controlled Trials (CENTRAL) via the Cochrane Register of Studies Online (CRSO) (until 20 December 2018).
MEDLINE Ovid (Epub Ahead of Print, In‐Process & Other Non‐Indexed Citations, Ovid MEDLINE(R) Daily and Ovid MEDLINE(R); from 1946 until 20 December 2018.
Embase Ovid (from 1974 until 25 December 2018).
LILACS (Latin American and Caribbean Health Science Information database; from 1982 until 28 December 2018).
ClinicalTrials.gov (www.clinicaltrials.gov) (until 31 December 2018).
World Health Organization International Clinical Trials Registry Platform (ICTRP) (www.who.int/trialsearch) (until 31 December 2018).
We continuously applied a MEDLINE (via Ovid SP) email alert service established by the Cochrane Metabolic and Endocrine Disorders (CMED) Group to identify newly published studies using the same search strategy as described for MEDLINE (for details on search strategies see Appendix 2). After supplying the final review draft for editorial approval, the CMED Group performed a complete updated search on all databases available at the editorial office and sent the results to the review authors. In case we detected new studies for inclusion, we evaluated these and incorporated findings in our review before submission of the final review draft.
Searching other resources
We planned to identify other potentially eligible trials or ancillary publications by searching the reference lists of retrieved included trials, systematic reviews, meta‐analyses and health technology assessment reports. In addition we contacted the authors of the included trials to identify any further studies we may have missed.
We defined grey literature as records detected in ClinicalTrials.gov or WHO ICTRP.
We did not use abstracts or conference proceedings for data extraction because this information source does not fulfil the CONSORT requirements which is "an evidence‐based, minimum set of recommendations for reporting randomized trials" (CONSORT; Scherer 2007). However, we planned to specify trial details in the table 'Characteristics of studies awaiting classification'.
Data collection and analysis
Selection of studies
Two review authors (AS and GM) independently scanned the title or abstract, or both, of every record retrieved, to determine which trials should be assessed further. We investigated the full text articles of all potentially relevant articles. We resolved any discrepancies through consensus or by recourse to a third review author (AGG). If we could not resolve a disagreement, we recorded the study in the 'Studies awaiting classification' section and contacted trial authors for clarification. We present an adapted PRISMA flow diagram to show the process of trial selection (Figure 1; Liberati 2009). We listed all articles excluded after full‐text assessment in the 'Characteristics of excluded studies' table and provided the reasons for exclusion.
1.

Trial flow diagram.
Data extraction and management
For trials that fulfilled our inclusion criteria, two review authors (AS and YR) independently abstracted relevant key participant and intervention characteristics. We reported data on efficacy outcomes and adverse events using standard data extraction sheets from the CMED Group. We resolved any disagreements by discussion or, if required, by consultation with a third review author (AGG) (for details see Characteristics of included studies; Table 2; Appendix 2; Appendix 3; Appendix 4; Appendix 5; Appendix 6; Appendix 7; Appendix 8; Appendix 9; Appendix 10; Appendix 11; Appendix 12; Appendix 13; Appendix 14; Appendix 15; Appendix 1).
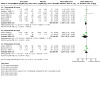
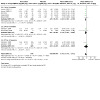
1. Overview of trial populations.
|
Trial ID (trial design) |
Intervention(s) and comparator(s) | Description of power and sample size calculation | Screened/eligible (N) | Randomised (N) | ITT (N) | Analysed (N) | Finishing trial (N) | Randomised finishing trial (%) | Duration of intervention |
| Al‐Helli 2015 (parallel RCT) | I1: fluoxetine 20 mg | — | 48/48 | 12 | 12 | 12 | 12 | 100 | 2 months |
| I2: omega‐3 gel | 12 | 12 | 12 | 12 | 100 | ||||
| I3: fluoxetine 20 mg + omega‐3 gel | 12 | 12 | 12 | 12 | 100 | ||||
| C: placebo | 12 | 12 | 12 | 12 | 100 | ||||
| total: | 48 | 48 | 48 | 48 | 100 | ||||
| Suplicy 2014 (parallel RCT) | I1: diethylpropion | "As we had calculated the day to day coefficient of variation of resting metabolic rate for this method to be less than 5% for a given subject, we calculated that it was necessary to study at least 26 subjects to have sufficient power" | 507/180 | 30 | 28 | 28 | 23 | 76.7 | 52 weeks |
| I2: fenproporex | 31 | 29 | 29 | 23 | 74.2 | ||||
| I3: mazindol | 29 | 29 | 29 | 24 | 82.7 | ||||
| I4: fluoxetine 20 mg | 31 | 29 | 29 | 20 | 64.5 | ||||
| I5: sibutramine | 30 | 30 | 30 | 24 | 80 | ||||
| C: placebo | 29 | 29 | 29 | 15 | 51.7 | ||||
| total: | 180 | 174 | 174 | 129 | 71.7 | ||||
| Guimaraes 2006 (parallel RCT) | I1: sibutramine | — | 35/35 | 8 | 8 | 8 | 8 | 100 | 90 days |
| I2: metformin | 8 | 8 | 8 | 8 | 100 | ||||
| I3: fluoxetine 60 mg | 9 | 9 | 9 | 9 | 100 | ||||
| C: placebo | 10 | 10 | 10 | 10 | 100 | ||||
| total: | 35 | 35 | 35 | 35 | 100 | ||||
| Bondi 2000 (parallel RCT) | I1: fluoxetine 40 mg | — | 32/32 | 8 | 8 | 8 | 8 | 100 | 12 weeks |
| I2: fluoxetine 60 mg | 12 | 12 | 12 | 12 | 100 | ||||
| C: placebo | 12 | 12 | 12 | 12 | 100 | ||||
| total: | 32 | 32 | 32 | 32 | 100 | ||||
| Huang 1998 (parallel RCT) | I: fluoxetine 60 mg | — | 60/60 | 30 | — | 28 | 28 | 93.3 | 12 weeks |
| C: no treatment | 30 | — | 22 | 22 | 73.3 | ||||
| total: | 60 | — | 50 | 50 | 83.3 | ||||
| Bross 1995 (parallel RCT) | I: fluoxetine 60 mg | — | 20/20 | 10 | 10 | 10 | 10 | 100 | 3 weeks |
| C: placebo | 10 | 10 | 10 | 10 | 100 | ||||
| total: | 20 | 20 | 20 | 20 | 100 | ||||
|
Fernández‐Soto 1995 (cross‐over RCT) |
I: fluoxetine 60 mg | — | 42 participants with full cross‐over | 23 | — | 18 | 18 | 78.2 | 3 months |
| C: placebo | 19 | — | 15 | 15 | 78.9 | ||||
| total: | 42 | — | 33 | 33 | 78.5 | ||||
| Lawton 1995 (cross‐over RCT) | I: fluoxetine 60 mg | — | 13 participants with full cross‐over | 13 | 12 | 12 | 12 | 92.3 | 2 weeks |
| C: placebo | 13 | 12 | 12 | 12 | 92.3 | ||||
| total: | 13 | 12 | 12 | 12 | 92.3 | ||||
| Goldstein 1994 (parallel RCT) | I: fluoxetine 60 mg | — | 458/458 | 230 | 217 | 217 | 99 | 43 | 52 weeks |
| C: placebo | 228 | 217 | 217 | 108 | 47.3 | ||||
| total: | 458 | 434 | 434 | 207 | 45.1 | ||||
| Goldstein 1993 (parallel RCT)a | I1: fluoxetine 60 mg | — | 458/450 | 106 | 61 | 61 | 60 | 56.6 | 40 weeks |
| I2: fluoxetine 20 mg | 104 | 72 | 72 | 70 | 67.3 | ||||
| C: placebo | 107 | 72 | 72 | 72 | 67.2 | ||||
| total: | 317 | 205 | 205 | 202 | 63.7 | ||||
| Pedrinola 1993 (parallel RCT) | I: fluoxetine 40 mg | — | 20/20 | 10 | — | 10 | 10 | 100 | 12 weeks |
| C: placebo | 10 | — | 8 | 8 | 80 | ||||
| total: | 20 | — | 18 | 18 | 90 | ||||
| Visser 1993 (parallel RCT) | I: fluoxetine 60 mg | "Based on earlier studies at our department 40 men in total were selected for detecting a 10% improvement in body weight, fat‐free mass and abdominal fat areas, with 80% probability" | 132/40 | 20 | — | 18 | 18 | 90 | 12 weeks |
| C: placebo | 20 | — | 20 | 20 | 100 | ||||
| total: | 40 | — | 38 | 38 | 95 | ||||
| Wurtman 1993 (parallel RCT) | I1: dexfenfluramine | — | 87/87 | 28 | 28 | 28 | 21 | 75 | 12 weeks |
| I2: fluoxetine 20 mg | 30 | 30 | 30 | 18 | 60 | ||||
| C: placebo | 29 | 29 | 29 | 25 | 86.2 | ||||
| total: | 87 | 87 | 87 | 64 | 73.5 | ||||
| Kopelman 1992 (cross‐over RCT) | I: fluoxetine 60 mg | — | 11 participants with full cross‐over | 11 | 11 | 11 | 11 | 100 | 3 days |
| C: placebo | 11 | 11 | 11 | 11 | 100 | ||||
| total: | 11 | 11 | 11 | 11 | 100 | ||||
| Stinson 1992 (cross‐over RCT) | I: fluoxetine 60 mg | "A 12‐wk placebo‐subtracted total weight loss of at least 5% was considered. It was assumed that roughly 10% of participants in the placebo group would have a weight loss of 5% at the end of the study and the magnitude of the effect (the minimum difference between treatment arms to be considered clinically relevant) was assumed to be 40%. "Power was set as 0.8 with an alpha level of 0.05, resulting in an estimate minimum sample size of 26 participants per group" |
30 participants with full cross‐over | 13 | 13 | 13 | 13 | 100 | 2 weeks |
| C: placebo | 17 | 17 | 17 | 17 | 100 | ||||
| total: | 30 | 30 | 30 | 30 | 100 | ||||
| Bagiella 1991 (parallel RCT) | I1: fenfluramine | — | 60/60 | — | — | — | — | — | 12 weeks |
| I2: 5‐hydroxy‐tryptophan | — | — | — | — | — | ||||
| I3: d‐fenfluramine | — | — | — | — | — | ||||
| I4: fluoxetine 20 mg | — | — | — | — | — | ||||
| I5: fluvoxamine | — | — | — | — | — | ||||
| C: placebo | — | — | — | — | — | ||||
| total: | 60 | 60 | 60 | 60 | 100 | ||||
| Pijl 1991 (parallel RCT) | I: fluoxetine 60 mg | — | 24/24 | 12 | — | 11 | 11 | 91.6 | 6 weeks |
| C: placebo | 12 | — | 12 | 12 | 100 | ||||
| total: | 24 | — | 23 | 23 | 95.8 | ||||
| Levine 1989 (parallel RCT) | I1: fluoxetine 10 mg | — | 655/655 | 131 | 131 | 131 | 80 | 61 | 8 weeks |
| I2: fluoxetine 20 mg | 131 | 131 | 131 | 86 | 65.6 | ||||
| I3: fluoxetine 40 mg | 131 | 131 | 131 | 90 | 68.7 | ||||
| I4: fluoxetine 60 mg | 131 | 131 | 131 | 87 | 66.4 | ||||
| C: placebo | 131 | 131 | 131 | 74 | 56.4 | ||||
| total: | 655 | 655 | 655 | 417 | 63.6 | ||||
| Levine 1987 (parallel RCT) | I: fluoxetine 60 mg | — | 120/120 | 60 | 59 | 48 | 48 | 80 | 11 days |
| C: placebo | 60 | 59 | 52 | 52 | 86.6 | ||||
| total: | 120 | 118 | 100 | 100 | 83.3 | ||||
| Grand totalb | All interventions | 1280 | 842 | ||||||
| All comparators | 936 | 761 | |||||||
| All interventions and comparators | 2216 | 1603 | |||||||
— denotes not reported
aObese outpatients were randomised who had lost 23.6 kg after 8 weeks of single‐blind fluoxetine 60 mg/d in the "qualification phase" bNumbers do not add up correctly because Bagiella 1991 did not provide the numbers of randomised participants per intervention and comparator group; Fernández‐Soto 1995, Kopelman 1992, Lawton 1995 and Stinson 1992 were cross‐over trials and were subsumed under all interventions only
C: comparator; I: Intervention; ITT: intention‐to‐treat; RCT: randomised controlled trial; wk: week.
We planned to provide information including the trial identifier for potentially relevant ongoing studies in the 'Characteristics of ongoing studies' table and in Appendix 8 'Matrix of trial endpoints (publications and trial documents)'. We tried to find the protocol of each included trial and reported primary, secondary and other outcomes measured by the study personnel (objectively) in comparison with the data from the publications in Appendix 8.
We planned to analyse clinical study reports from manufacturers, provided they were willing to share the information. We also planned to collect these clinical study reports from the regulatory agencies. We sent an email request to the authors of the included trials to enquire whether they were willing to answer questions regarding their trials: Appendix 14 shows the results of this survey. Thereafter, we sought relevant missing information on the trial from the primary author(s) of the article, if required.
Dealing with duplicate and companion publications
In the event of duplicate publications, companion documents or multiple reports of a primary trial, we planned to maximise the information yield by collating all available data and use the most complete data set aggregated across all known publications. We listed duplicate publications, companion documents, multiple reports of a primary trial and trial documents of included trials (such as trial registry information) as secondary references under the study identifier (ID) of the included trial. Furthermore, we listed duplicate publications, companion documents, multiple reports of a trial and trial documents of excluded trials (such as trial registry information) as secondary references under the study ID of the excluded trial.
Data from clinical trial registers
If data from included trials were available as study results in clinical trial registries such as ClinicalTrials.gov or similar sources, we planned to make full use of this information and to extract the data. If there was also a full publication of the trial, we collected and critically appraised all available data. If an included trial was marked as a completed study in a clinical trials registry but no additional information (study results, publication or both) was available, we planned to add this trial to the table 'Characteristics of studies awaiting classification'.
Assessment of risk of bias in included studies
Two review authors (AS and YR) independently assessed the 'Risk of bias' of each included trial. We resolved disagreements by consensus or by consulting a third review author (AGG). In case of disagreement, we consulted the rest of the review author team and we made a judgement based on consensus. If adequate information was unavailable from the trials or trial protocols, we contacted the trial authors to recover missing data on 'Risk of bias' items.
We used the Cochrane 'Risk of bias' assessment tool (Higgins 2011a; Higgins 2017), assigning assessments of low, high, or unclear risk of bias (for details, see Appendix 3; Appendix 4). We evaluated individual bias items as described in the Cochrane Handbook for Systematic Reviews of Interventions according to the criteria and associated categorisations contained therein (Higgins 2017).
Summary assessment of risk of bias
We present a 'Risk of bias' graph (Figure 2) and a 'Risk of bias' summary figure (Figure 3).
2.

Risk of bias graph: review authors' judgements about each risk of bias item presented as percentages across all included trials (blank cells indicate that the particular outcome was not measured in some trials).
3.
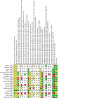
Risk of bias summary: review authors' judgements about each risk of bias item for each included trial ((blank cells indicate that the particular outcome was not measured in some trials).
We distinguished between self‐reported, investigator‐assessed and adjudicated outcome measures.
We accepted the following outcomes as self‐reported.
Health‐related quality of life.
Adverse events, if measured by participants.
Weight loss and other anthropometric measures, if measured by participants.
We required the following outcomes to be investigator‐assessed.
Weight loss and other anthropometric measures, if measured by study personnel.
Adverse events, if measured by study personnel.
All‐cause mortality.
Morbidity.
Socioeconomic effects.
Risk of bias for a trial across outcomes
Some 'Risk of bias' domains, such as selection bias (sequence generation and allocation sequence concealment), affect the risk of bias across all outcome measures in a trial. In case of high risk of selection bias, all endpoints investigated in the associated trial were marked as high risk. Otherwise, we did not perform a summary assessment of the risk of bias across all outcomes for a trial.
Risk of bias for an outcome within a trial and across domains
We assessed the risk of bias for an outcome measure by including all entries relevant to that outcome (i.e. both trial‐level entries and outcome‐specific entries). We considered low risk of bias to denote a low risk of bias for all key domains; unclear risk to denote an unclear risk of bias for one or more key domains; and high risk to denote a high risk of bias for one or more key domains.
Risk of bias for an outcome across trials and across domains
These are the main summary assessments that we incorporated into our judgements about the quality of the certainty of the 'Summary of findings' tables. We defined outcomes as at low risk of bias when most information came from trials at low risk of bias; unclear risk when most information came from trials at low or unclear risk of bias; and high risk when a sufficient proportion of information came from trials at high risk of bias.
Measures of treatment effect
When at least two included trials were available for a comparison of a given outcome, we planned to express dichotomous data as a risk ratio (RR) or an odds ratio (OR) with 95% confidence intervals (CIs). For continuous outcomes measured on the same scale (e.g. weight loss in kg) we planned to estimate the intervention effect using the mean difference (MD) with 95% CIs. For continuous outcomes that measured the same underlying concept (e.g. health‐related quality of life) but used different measurement scales, we planned to calculate the standardised mean difference (SMD). We wanted to express time‐to‐event data as a hazard ratio (HR) with 95% CIs.
Unit of analysis issues
We took into account the level at which randomisation occurred, such as cross‐over trials, cluster‐randomised trials and multiple observations for the same outcome. If more than one comparison from the same trial was eligible for inclusion in the same meta‐analysis, we either combined groups to create a single pair‐wise comparison or appropriately reduced the sample size so that the same participants did not contribute more than once (splitting the 'shared' group into two or more groups). While the latter approach offers some solution to adjusting the precision of the comparison, it does not account for correlation arising from inclusion of the same set of participants in multiple comparisons (Higgins 2011b).
We planned to re‐analyse cluster‐RCTs that had not appropriately adjusted for potential clustering of participants within clusters in their analyses. Variance of the intervention effects would have been inflated by a design effect. Calculation of a design effect involves estimation of an intra‐cluster correlation (ICC). We planned to obtain estimates of ICCs through contact with the trial authors, or by imputing ICC values using either estimates from other included trials that reported ICCs, or external estimates from empirical research (e.g. Bell 2013). We planned to examine the impact of clustering by performing sensitivity analyses.
Dealing with missing data
If possible, we obtained missing data from the authors of included trials. We carefully evaluated important numerical data such as screened, randomly assigned participants, as well as intention‐to‐treat and as‐treated and per‐protocol populations. We investigated attrition rates (e.g. dropouts, losses to follow‐up, withdrawals), and we critically appraised issues concerning missing data and use of imputation methods (e.g. last observation carried forward).
For trials in which the standard deviation (SD) of the outcome was not available at follow‐up or could not be re‐created, we planned to standardise by the average of the pooled baseline SD from those trials that reported this information.
When included trials did not report means and SDs for outcomes, and we did not receive requested information from trial authors, we planned to impute these values by estimating the mean and the variance from the median, the range, and the size of the sample (Hozo 2005).
We planned to investigate the impact of imputation on meta‐analyses by performing sensitivity analyses and we reported per outcome which trials were included with imputed SDs.
Assessment of heterogeneity
In the event of substantial clinical or methodological heterogeneity, we did not report trial results as the pooled effect estimate in a meta‐analysis.
We identified heterogeneity (inconsistency) by visually inspecting the forest plots and by using a standard Chi² test with a significance level of α = 0.1 (Deeks 2017). In view of the low power of this test, we also considered the I² statistic, which quantifies inconsistency across trials to assess the impact of heterogeneity on the meta‐analysis (Higgins 2002; Higgins 2003).
When we found heterogeneity, we attempted to determine possible reasons for this by examining individual trial and subgroup characteristics.
Assessment of reporting biases
If we included 10 or more studies in a meta‐analysis investigating a particular outcome, we used funnel plots to assess small‐study effects. Several explanations might account for funnel plot asymmetry, including true heterogeneity of effect with respect to trial size, poor methodological design (and hence bias of small trials), and publication bias (Sterne 2017). Therefore we interpreted results carefully (Sterne 2011).
Data synthesis
We planned to undertake (or display) a meta‐analysis only if we judged participants, interventions, comparisons, and outcomes to be sufficiently similar to ensure an answer that was clinically meaningful. Unless good evidence showed homogeneous effects across trials of different methodological quality, we primarily summarised low risk of bias data using a random‐effects model (Wood 2008). We interpreted random‐effects meta‐analyses with due consideration for the whole distribution of effects and presented a prediction interval (Borenstein 2017a; Borenstein 2017b; Higgins 2009). A prediction interval needs at least three trials to be calculated and specifies a predicted range for the true treatment effect in an individual trial (Riley 2011; Riley 2013). For rare events such as event rates below 1%, we planned to use the Peto's odds ratio method, provided that there was no substantial imbalance between intervention and comparator group sizes, and intervention effects were not exceptionally large. In addition, we performed statistical analyses according to the statistical guidelines presented in the Cochrane Handbook for Systematic Reviews of Interventions (Deeks 2017).
Subgroup analysis and investigation of heterogeneity
We expected the following characteristics to introduce clinical heterogeneity, and we planned to carry out the following subgroup analyses including investigation of interactions (Altman 2003).
Magnitude of obesity
Overweight versus obesity
Gender
Ethnicity
Age
Different comparison interventions
Fluoxetine dosage
Duration of intervention
Treatment compliance
Socioeconomic status
Sensitivity analysis
We planned to perform sensitivity analyses to explore the influence of the following factors (when applicable) on effect sizes by restricting analysis to the following.
Published trials
The effect of risk of bias, as specified in the Assessment of risk of bias in included studies section
Very long or large trials to establish the extent to which they dominated the results
Use of the following filters: diagnostic criteria, imputation, language of publication, source of funding (industry versus other), or country
We also tested the robustness of the results by repeating the analysis using different measures of effect size (RR, OR, etc.) and different statistical models (fixed‐effect and random‐effects models).
Summary of findings and assessment of the certainty of the evidence
Certainty of the evidence
We present the overall certainty of the evidence for each outcome specified below according to the GRADE approach, which takes into account issues related not only to internal validity (risk of bias, inconsistency, imprecision, publication bias) but also to external validity, such as directness of results. Two review authors (AS and YR) independently rated the certainty of the evidence for each outcome. We resolved disagreements by consensus or by consulting a third review author (AGG). In case of disagreement, we consulted the rest of the review author team and we made a judgement based on consensus.
We include an appendix entitled 'Checklist to aid consistency and reproducibility of GRADE assessments' (Appendix 1), to help with standardisation of the 'Summary of findings' tables (Meader 2014). Alternatively, we planned to use the GRADEpro Guideline Development Tool (GDT) software and planned to present evidence profile tables as an appendix (GRADEproGDT 2015). We present results for outcomes as described in the Types of outcome measures section. If meta‐analysis was not possible, we planned to present the results in a narrative format in the 'Table 1'. We justify all decisions to downgrade the quality of trials by using footnotes, and add comments to aid the reader's understanding of this Cochrane Review when necessary.
'Summary of findings' table
We present a summary of the evidence in the Table 1. This provides key information about the best estimate of the magnitude of effect, in relative terms and as absolute differences, for each relevant comparison of alternative management strategies, numbers of participants and trials addressing each important outcome and a rating of overall confidence in effect estimates for each outcome. We created the 'Summary of findings table' using the methods described in the Cochrane Handbook for Systematic Reviews of Interventions (Schünemann 2017), along with Review Manager 5 table editor (Review Manager 2014). Intervention presented in the 'Summary of findings' table was fluoxetine and comparator was placebo.
We reported the following outcomes, listed according to priority.
Weight loss (kg)
Health‐related quality of life
Any adverse event
Anthropometric measurements other than weight loss in kg
Morbidity
All‐cause mortality
Socioeconomic effects
Results
Description of studies
For a detailed description of trials, see Table 2, 'Characteristics of included studies' and 'Characteristics of excluded studies' sections.
Results of the search
From the last updated search performed in December 2018, we screened 1036 bibliographic records after removing duplicates. Of these we excluded 984 records on the basis of their abstracts because they were not relevant for this review. We retrieved 52 full‐text publications and conference abstracts for detailed examination. Of the 52 articles examined in detail, we excluded 34; one trial is awaiting classification. Nineteen trials met our inclusion criteria. There were 15 parallel clinical trials (Al‐Helli 2015; Bagiella 1991; Bondi 2000; Bross 1995; Goldstein 1993; Goldstein 1994; Guimaraes 2006; Huang 1998; Levine 1987; Levine 1989; Pedrinola 1993; Pijl 1991; Suplicy 2014; Visser 1993; Wurtman 1993); and four cross‐over clinical trials (Fernández‐Soto 1995; Kopelman 1992; Lawton 1995; Stinson 1992) (see Figure 1).
Included studies
Details of the characteristics of included trials are presented in the Characteristics of included studies table and the following appendices: Appendix 5; Appendix 6; Appendix 7; Appendix 8; Appendix 9; Appendix 10; Appendix 11; Appendix 12; Appendix 13; Appendix 14; Appendix 15. The following is a brief overview.
Source of data
We obtained data from published literature. We did not find data from trial registries, web‐based data repositories or correspondence with authors (Appendix 14).
Comparisons
We identified a great variety of interventions in our 19 included trials, which we grouped into five main comparisons with overall 56 trial arms.
A) Eighteen trials compared fluoxetine with placebo (Al‐Helli 2015; Bagiella 1991; Bondi 2000; Bross 1995; Fernández‐Soto 1995; Goldstein 1993; Goldstein 1994; Guimaraes 2006; Kopelman 1992; Lawton 1995; Levine 1987; Levine 1989; Pedrinola 1993; Pijl 1991; Stinson 1992; Suplicy 2014; Visser 1993; Wurtman 1993).
B) Four trials compared fluoxetine with another anti‐obesity agent (Bagiella 1991; Guimaraes 2006; Suplicy 2014; Wurtman 1993).
C) One trial compared fluoxetine with no treatment (Huang 1998).
D) One trial compared fluoxetine with a non‐pharmacological treatment (Al‐Helli 2015).
E) Three trials compared fluoxetine 60 mg/d with fluoxetine at smaller doses (10, 20 and 40 mg/d) (Bondi 2000; Goldstein 1993; Levine 1989).
Overview of trial populations
There were a total of 2216 participants in 19 trials, including one trial with 60 participants which did not specify how many participants constituted each arm of the study (Bagiella 1991). A total of 1280 participants without depression, mental illness or abnormal eating patterns were randomly assigned to the fluoxetine groups (680 participants received 60 mg/d, 149 received 40 mg/d, 320 received 20 mg/d and 131 received 10 mg/d). The comparator groups of interest for this review had 936 participants with 730 on placebo, 164 using other anti‐obesity agents, 12 being treated non‐pharmacologically and 30 who received no treatment.
The proportion of participants in the intervention groups who finished the trials was lowest in Goldstein 1993 with 43% at 52 weeks of follow‐up, and ranged from 56.6% to 82.7% in five other trials (Fernández‐Soto 1995; Goldstein 1994; Levine 1989; Suplicy 2014; Wurtman 1993). The 12 trials with highest proportion of participants in the intervention groups who finished the trials were Al‐Helli 2015, Bondi 2000, Bross 1995, Guimaraes 2006, Huang 1998, Kopelman 1992, Lawton 1995, Levine 1987, Pedrinola 1993, Pijl 1991, Stinson 1992and Visser 1993, with proportions of 80% to 100%. In the comparator groups, the proportion of participants who finished the trials was lowest in Goldstein 1994, Levine 1989 and Suplicy 2014 with 47.3% to 56.4% of participants. In four other trials, the proportion who finished ranged from 67.3% to 80% (Fernández‐Soto 1995; Goldstein 1993; Huang 1998; Pedrinola 1993). The 11 trials with the highest proportion of participants in the comparator groups who finished the trial were Al‐Helli 2015, Bondi 2000, Bross 1995, Guimaraes 2006, Kopelman 1992, Lawton 1995, Levine 1987, Pijl 1991, Stinson 1992, Visser 1993 and Wurtman 1993, with proportions ranging from 86.2% to 100%. The sample size ranged from 20 in Bross 1995 and Pedrinola 1993 to 655 in Levine 1989. See Table 2 for details.
Trial design
Of the 19 trials included in this review, 15 were parallel comparisons with individual randomisation (Al‐Helli 2015; Bagiella 1991; Bondi 2000; Bross 1995; Goldstein 1993; Goldstein 1994; Guimaraes 2006; Huang 1998; Levine 1987; Levine 1989; Pedrinola 1993; Pijl 1991; Suplicy 2014; Visser 1993; Wurtman 1993); and four trials were cross‐over comparisons (Fernández‐Soto 1995; Kopelman 1992; Lawton 1995; Stinson 1992).
Fifteen trials were performed with a parallel group superiority design and used a placebo as comparator (Al‐Helli 2015; Bagiella 1991; Bross 1995; Fernández‐Soto 1995; Goldstein 1994; Guimaraes 2006; Kopelman 1992; Lawton 1995; Levine 1987; Pedrinola 1993; Pijl 1991; Stinson 1992; Suplicy 2014; Visser 1993; Wurtman 1993), and only one trial used no treatment as the comparator (Huang 1998). Three trials used an equivalence design (Bondi 2000; Goldstein 1993; Levine 1989).
Of the 19 trials, one trial had six comparisons (five intervention groups and one placebo group) (Suplicy 2014); one trial had five arms (four fluoxetine groups and one placebo group) (Levine 1989); two trials had four arms (three intervention groups and one placebo arm) (Al‐Helli 2015; Guimaraes 2006); three trials had three arms (two intervention groups and one placebo group) (Bondi 2000; Goldstein 1993; Wurtman 1993); 11 trials had two arms (one intervention group and one placebo group) (Bagiella 1991; Bross 1995; Fernández‐Soto 1995; Goldstein 1994; Kopelman 1992; Lawton 1995; Levine 1987; Pedrinola 1993; Pijl 1991; Stinson 1992; Visser 1993); and one trial had two arms with a no‐treatment group used as the comparator group (Huang 1998).
Sixteen trials were performed in a single centre (Al‐Helli 2015; Bagiella 1991; Bondi 2000; Bross 1995; Fernández‐Soto 1995; Guimaraes 2006; Huang 1998; Kopelman 1992; Lawton 1995; Levine 1987; Pedrinola 1993; Pijl 1991; Stinson 1992; Suplicy 2014; Visser 1993; Wurtman 1993); and three trials were performed in multiple centres ranging from 6 to 10 centres (Goldstein 1993; Goldstein 1994; Levine 1989).
Twelve trials were reported as double‐blinded for participants and personnel (Bondi 2000; Bross 1995; Fernández‐Soto 1995; Goldstein 1993; Kopelman 1992; Lawton 1995; Levine 1989; Pedrinola 1993; Pijl 1991; Stinson 1992; Visser 1993; Wurtman 1993). Two trials were reported as single‐blinded for participants (Stinson 1992; Visser 1993); and two trials did not state whether they were blinded as to participants, personnel or assessors (Al‐Helli 2015; Bagiella 1991).
The trials were performed between 1987 and 2015. The duration of the interventions ranged from three days (Kopelman 1992) to 52 weeks (Goldstein 1994; Suplicy 2014), with a median of duration of 12 weeks. The duration of follow‐up ranged from three weeks (Bross 1995) to 52 weeks (Suplicy 2014; Goldstein 1994), with a median duration of 12 weeks. Eight trials reported a run‐in period of between four days and nine weeks (Bross 1995; Goldstein 1993). No trials were terminated before their prespecified end.
Settings
The interventions were performed in an outpatient setting in eight trials (Bagiella 1991; Fernández‐Soto 1995; Goldstein 1993; Goldstein 1994; Guimaraes 2006; Levine 1987; Levine 1989; Visser 1993); in an outpatient obesity or research clinic in nine trials (Al‐Helli 2015; Bondi 2000; Huang 1998; Lawton 1995; Pedrinola 1993; Pijl 1991; Stinson 1992; Suplicy 2014; Wurtman 1993); and on hospitalised participants during intervention or outcomes assessment in two trials (Bross 1995; Kopelman 1992). Five trials were performed in the USA (Goldstein 1994; Goldstein 1993; Wurtman 1993; Levine 1989; Levine 1987); three in Brazil (Guimaraes 2006; Pedrinola 1993; Suplicy 2014); two in the UK (Kopelman 1992; Lawton 1995); two in Italy (Bagiella 1991; Bondi 2000); two in the Netherlands (Pijl 1991; Visser 1993); and one each in Canada (Bross 1995), Spain (Fernández‐Soto 1995), Ireland (Stinson 1992), Iraq (Al‐Helli 2015) and the Republic of China (Huang 1998).
Participants
Three trials were performed on participants from low‐ to middle‐income countries (Brazil, Iraq and the Republic of China), and the remaining 16 trials were performed on participants from high‐income countries (Ireland, Italy, Canada, Spain, the UK, the USA and the Netherlands), according to definitions from the World Bank.
Only four trials reported ethnicities, being white participants in all four trials (Goldstein 1993; Goldstein 1994; Levine 1987; Levine 1989). No trial reported the duration of overweight or obesity.
Of the all trials reporting gender in our review, which involved 2216 participants, the majority of participants (from 80% to 100%) were female (see Appendix 7). In three trials, however, women constituted less than 62% of participants (Huang 1998, 46%; Kopelman 1992, 9%; and Stinson 1992, 61%), one trial included exclusively men (Visser 1993) and three trials did not report the sex of the participants (Al‐Helli 2015; Bagiella 1991; Pedrinola 1993). The mean age of the participants ranged from 30 years in Guimaraes 2006 to 51 years in Bondi 2000.
Baseline characteristics were similar between treatment groups in most of the trials. In one trial there was a difference in weight between the groups (84.9 kg in the fluoxetine group versus 89.2 kg in the placebo group) (Goldstein 1993). Mean BMI at baseline in 15 trials ranged from 27.9 kg/m² (Visser 1993) to 44 kg/m² (Kopelman 1992). However, two trials reported a mean BMI of 25 kg/m² or more (Levine 1987; Levine 1989), one trial reported a mean BMI of 30 kg/m² or more (Al‐Helli 2015), and one trial reported a mean BMI ranging from 30 kg/m² to 40 kg/m² (Bagiella 1991). Except for this last trial, all the trials reported the mean body weight of the participants at baseline, which ranged from 84.9 kg (Goldstein 1993) to 129 Kg (Kopelman 1992). No trial reported glycosylated haemoglobin A1c (HbA1c) values.
Of the 19 trials, only Wurtman 1993 reported comorbidities in the participants. No trials reported that participants used co‐medications.
The main inclusion criteria in the trials were adult participants (16 years or older) who were overweight (BMI 25 kg/m² to 29.9 kg/m²) or obese (BMI ≥ 30 kg/m²), with stable body weight before trial entry. The main exclusion criteria were pregnant or lactating women, previous bariatric surgery, use of appetite suppressants, antidepressants or medicines that could affect body weight, alcohol or drug abuse and serious medical conditions (e.g. hypertension, diabetes, viral infections).
Diagnosis
The diagnostic criteria for overweight and obese participants differed between the trials. Fifteen trials used BMI greater than 25 kg/m² (overweight) or greater than 30 kg/m² (obesity) as criteria (Bagiella 1991; Bondi 2000; Bross 1995; Fernández‐Soto 1995; Goldstein 1993; Goldstein 1994; Guimaraes 2006; Kopelman 1992; Lawton 1995; Levine 1987; Pedrinola 1993; Pijl 1991; Stinson 1992; Suplicy 2014; Visser 1993). One trial used more than 30% of ideal body weight according to Huang's formula (Huang 1998), another trial used more than 20% to 100% of ideal body weight (Levine 1989), and another trial used 40 lb to 60 lb above ideal body weight according to the Metropolitan Life Insurance Height and Weight Table (Wurtman 1993).
Interventions
Some of the included trials were performed with several arms. Of 19 trials, two had six arms (Suplicy 2014; Bagiella 1991), one had five arms (Levine 1989), two had four arms (Al‐Helli 2015; Guimaraes 2006), three had three arms (Bondi 2000; Goldstein 1993; Wurtman 1993), and 11 had two arms (Bross 1995; Fernández‐Soto 1995; Goldstein 1994; Huang 1998; Kopelman 1992; Lawton 1995; Levine 1987; Pedrinola 1993; Pijl 1991; Stinson 1992; Visser 1993).
Two trials reported that participants received treatment before starting the trial. In Goldstein 1993, the participants received fluoxetine 60 mg/d for eight weeks during qualification phase; in Guimaraes 2006, the participants received dietary re‐education for six months.
In all trials, the intervention was administered by the oral route. The doses differed between trials. In 14 trials, at least one group received 60 mg of fluoxetine once daily (Bondi 2000; Bross 1995; Fernández‐Soto 1995; Goldstein 1993; Goldstein 1994; Guimaraes 2006; Huang 1998; Kopelman 1992; Lawton 1995; Levine 1987; Levine 1989; Pijl 1991; Stinson 1992; Visser 1993); in two trials, at least one group received 40 mg of fluoxetine once daily (Pedrinola 1993; Levine 1989); in five trials, at least one group received 20 mg of fluoxetine once daily (Bagiella 1991; Goldstein 1993; Levine 1989; Suplicy 2014; Wurtman 1993); and in one trial, one group received 10 mg of fluoxetine once daily (Levine 1987). The average daily dose of fluoxetine was 55 mg.
A wide variety of interventions was performed. Eleven trials compared fluoxetine with placebo (Bondi 2000; Bross 1995; Fernández‐Soto 1995; Goldstein 1994; Kopelman 1992; Lawton 1995; Levine 1987; Pedrinola 1993; Pijl 1991; Stinson 1992; Visser 1993). Four trials compared fluoxetine with at least one anti‐obesity agent (diethylpropion, fenproporex, mazindol, sibutramine, metformin, fenfluramine, dexfenfluramine, fluvoxamine or 5‐hydroxy‐tryptophan) (Bagiella 1991; Guimaraes 2006; Suplicy 2014; Wurtman 1993) (see Appendix 5). One trial compared fluoxetine with omega‐3 gel intake (Al‐Helli 2015). One trial compared fluoxetine with no treatment (Huang 1998); and two trials compared 60 mg fluoxetine with smaller doses of fluoxetine (10, 20 and 40 mg/d) (Goldstein 1993; Levine 1989).
Of 19 trials included in our review, 15 used adequate interventions and comparators. However, four trials included at least one intervention (sibutramine and dexfenfluramine) with harmful effects on the cardiovascular system according to the Food and Drug Administration (FDA) (Bagiella 1991; Guimaraes 2006; Suplicy 2014; Wurtman 1993).
Outcomes
Twelve of nineteen included trials explicitly stated primary or secondary outcomes (Suplicy 2014; Guimaraes 2006; Bondi 2000; Lawton 1995; Goldstein 1993; Visser 1993; Wurtman 1993; Kopelman 1992; Stinson 1992; Bagiella 1991; Pijl 1991; Levine 1989). The most common outcome was a weight loss in kilograms (Suplicy 2014; Guimaraes 2006; Bondi 2000; Goldstein 1993; Wurtman 1993; Levine 1989).
Fifteen trials had a median of six outcomes (Al‐Helli 2015; Suplicy 2014; Guimaraes 2006; Bondi 2000; Huang 1998; Bross 1995; Fernández‐Soto 1995; Lawton 1995; Goldstein 1994; Goldstein 1993; Wurtman 1993; Kopelman 1992; Stinson 1992; Pijl 1991; Levine 1987), with a range of six (Bondi 2000; Goldstein 1993; Kopelman 1992; Stinson 1992; Pijl 1991; Levine 1987) to 26 outcomes (Wurtman 1993). See Appendix 8 for details.
Fourteen trials reported adverse events (Fernández‐Soto 1995; Goldstein 1993; Goldstein 1994; Guimaraes 2006; Huang 1998; Kopelman 1992; Lawton 1995; Levine 1987; Levine 1989; Pedrinola 1993; Pijl 1991; Suplicy 2014; Visser 1993; Wurtman 1993). One trial investigated health‐related quality of life but did not report results (Suplicy 2014); nine trials evaluated anthropometric measurements other than weight loss in kilograms (Al‐Helli 2015; Goldstein 1994; Guimaraes 2006; Huang 1998; Kopelman 1992; Levine 1987; Levine 1989; Pedrinola 1993; Suplicy 2014) (see Appendix 8 for detail). Three trials investigated morbidity (depression as psychiatric disorder) (Suplicy 2014; Goldstein 1993; Levine 1987); 13 trials investigated laboratory parameters (Bagiella 1991; Bondi 2000; Fernández‐Soto 1995; Goldstein 1993; Goldstein 1994; Guimaraes 2006; Huang 1998; Levine 1987; Levine 1989; Pedrinola 1993; Stinson 1992; Suplicy 2014; Wurtman 1993). No trial investigated all‐cause mortality or socioeconomic effects.
Excluded studies
After examination of 52 full‐text studies and records, we excluded 34 records. The reasons for exclusion were that the trial design was not a clinical trial (seven publications), participants did not meet the specified inclusion criteria (23 publications) and the participants did not receive the right intervention or comparator (four publications). For further details see Characteristics of excluded studies.
Risk of bias in included studies
For details on the risk of bias of the included trials see Characteristics of included studies. For an overview of the review authors' judgments about the risk of bias for individual trials and across all studies see Figure 2 and Figure 3.
Allocation
Only Pijl 1991 and Suplicy 2014 reported the method used for random sequence generation and described details of allocation concealment; hence we judged these studies at low risk of selection bias. We considered the risk of selection bias uncertain for all other trials.
Blinding
We judged four trials to be at high risk of performance bias for most of the reported outcomes (Guimaraes 2006; Huang 1998; Levine 1987; Suplicy 2014). The remaining trials reported sufficient information on how the blinding was performed, with the exception of two trials which described blinding methods in little detail, so we judged them as unclear risk of bias (Goldstein 1994; Pedrinola 1993). See Characteristics of included studies for details.
All included trials did not provide adequate information to evaluate blinding of outcome assessment for any outcome measure, with the exception of Pedrinola 1993 who reported that there was no blinding of outcome assessment.
Incomplete outcome data
For the outcome measure 'weight loss', 12 of 17 trials investigating this outcome reported attrition rates from 4.2% to 22% during the follow‐up; hence we judged these at low risk of selection bias (Bondi 2000; Bross 1995; Fernández‐Soto 1995; Guimaraes 2006; Huang 1998; Kopelman 1992; Lawton 1995; Levine 1987; Pedrinola 1993; Pijl 1991; Stinson 1992; Visser 1993). We identified a high risk of attrition bias in five trials, with attrition rates ranging from 26.5% to 55% (Goldstein 1993; Goldstein 1994; Levine 1989; Suplicy 2014; Wurtman 1993). We judged the only trial evaluating health‐related quality of life with an attrition rate of 28.3% to be at high risk of attrition bias (Suplicy 2014). We judged five out of 14 trials investigating adverse events to be at high risk of attrition bias (Goldstein 1993; Goldstein 1994; Levine 1989; Suplicy 2014; Wurtman 1993). We judged three out of nine trials investigating anthropometric measurements other than weight loss with attrition rates of 26.5% to 43.4% to be at high risk of attrition bias (Goldstein 1994; Levine 1989; Suplicy 2014). Three trials reported on morbidity and we judged two of them with attrition rates of 28.3% to 36.3% to be at high risk of attrition bias (Goldstein 1993; Suplicy 2014).
Selective reporting
With respect to the Outcome Reporting Bias in Trials classification (ORBIT), we judged nine trials to have a high risk of selection bias because their outcomes were incompletely reported or not reported at all: for weight loss two trials (Goldstein 1993; Levine 1989), for adverse events three trials (Guimaraes 2006; Kopelman 1992; Pedrinola 1993), for anthropometric measurements other than weight loss in kilograms three trials (Al‐Helli 2015; Goldstein 1994; Levine 1987), and for health‐related quality of life one trial (Suplicy 2014). The remaining 10 trials were judged to have low risk of reporting bias. For details see Appendix 9.
Other potential sources of bias
We judged six trials to have an unclear risk of other bias, mainly because of possible sponsor bias (Bross 1995; Goldstein 1994; Lawton 1995; Levine 1987; Stinson 1992; Suplicy 2014).
Effects of interventions
See: Table 1
Because there were very limited data comparing fluoxetine with other anti‐obesity drugs we only established a 'Summary of findings' table for the comparison 'fluoxetine with placebo'.
Baseline characteristics
For details of baseline characteristics, see Appendix 6 and Appendix 7. Only three trials included non‐obese participants (Levine 1987; Levine 1989; Visser 1993).
Fluoxetine versus placebo
For a summary of findings see Table 1.
Primary outcomes
Weight loss (kg)
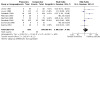
Ten trials with extractable data compared fluoxetine with placebo (Figure 4). Seven trials used a dose of 60 mg/d (Bondi 2000; Goldstein 1994; Guimaraes 2006; Levine 1987; Levine 1989; Pijl 1991; Visser 1993), two trials used a dose of 40 mg/d (Levine 1989; Pedrinola 1993) and three trials used a dose of 20 mg/d (Levine 1989; Suplicy 2014; Wurtman 1993).
4.

Forest plot of comparison: Fluoxetine versus placebo (parallel RCTs), outcome: 1.1 Weight loss, end of trial weight [kg].
Across all fluoxetine dosages and durations of treatment the MD was −2.7 kg (95% CI −4 to −1.4; P < 0.001; 10 trials (without Levine 1989 and fluoxetine 20 mg/d and 40 mg/d to avoid a unit of analysis error), 956 participants; low certainty evidence in favour of fluoxetine; Analysis 1.1). The 95% prediction interval ranged between −7.1 kg and 1.7 kg.
1.1. Analysis.
Comparison 1: Fluoxetine versus placebo, Outcome 1: Weight loss (end of trial weight)
The different fluoxetine dosages showed the following results (Analysis 1.1).
For fluoxetine 60 mg/d, the MD was −2.5 kg (95% CI −3.8 to −1.2; P < 0.001; 7 trials, 819 participants; low certainty evidence in favour of fluoxetine; Analysis 1.1). The 95% prediction interval ranged between −6.4 kg and 1.4 kg.
For fluoxetine 40 mg/d, the MD was −4 kg (95% CI −8.8 to 0.8; P = 0.10; 2 trials, 182 participants; very low certainty; Analysis 1.1). Fixed‐effect meta‐analysis performed because of the low number of trials showed a MD of −2.3 kg (95% CI −3 to −1.6; P < 0.001 in favour of fluoxetine).
For fluoxetine 20 mg/d, the MD was −1.5 kg (95% CI −3.5 to 0.5; P = 0.15; 3 trials, 279 participants; very low certainty evidence; Analysis 1.1). Fixed‐effect meta‐analysis performed because of the low number of trials showed an MD of −1.4 kg (95% CI −2.1 to −0.6; P < 0.001 in favour of fluoxetine). The 95% prediction interval did not provide a meaningful estimate.
Of the seven trials that administered fluoxetine 60 mg/d, five trials reported weight loss from zero to three months (Bondi 2000; Levine 1987; Levine 1989; Pijl 1991; Visser 1993); and two reported weight loss from four to six months (Goldstein 1994; Guimaraes 2006) (Analysis 1.2). The test for subgroup differences did not indicate a statistically significant difference (P = 0.62).
1.2. Analysis.
Comparison 1: Fluoxetine versus placebo, Outcome 2: Weight loss (duration of intervention)
The two trials with the longest duration of follow‐up (52 weeks) did not show a clear difference between fluoxetine and placebo (Goldstein 1993; Goldstein 1994).
Three cross‐over trials compared fluoxetine 60 mg/d with placebo (Fernández‐Soto 1995; Lawton 1995; Stinson 1992). Only Lawton 1995 provided adequate information to calculate a weight loss of 1.9 kg (95% CI 0.6 to 3.2; P = 0.004; 24 participants in favour of fluoxetine) (Analysis 1.3).
1.3. Analysis.
Comparison 1: Fluoxetine versus placebo, Outcome 3: Weight loss (cross‐over trial)
Health‐related quality of life
Only Suplicy 2014 planned to assess health‐related quality of life but did not report findings.
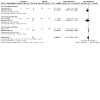
Adverse events
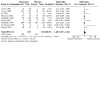
Nine trials reported adverse events in the comparison of fluoxetine with placebo (Goldstein 1993; Goldstein 1994; Guimaraes 2006; Levine 1987; Levine 1989; Pijl 1991; Suplicy 2014; Visser 1993; Wurtman 1993). The types of events and the fluoxetine dose differed between trials. A total of 399 out of 627 participants (63.6%) receiving fluoxetine compared with 352 out of 626 participants (56.2%) receiving placebo experienced an adverse event. Pooling the trials in a random‐effects meta‐analysis showed an increase in the risk of having at least one adverse event of any type in the fluoxetine groups compared with placebo: RR 1.18, 95% CI 0.99 to 1.42; P = 0.07; 9 trials; 1253 participants; low certainty evidence; Analysis 1.4. The 95% prediction interval ranged between 0.74 and 1.88.
1.4. Analysis.
Comparison 1: Fluoxetine versus placebo, Outcome 4: Any adverse event
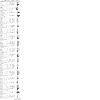
The most frequently reported adverse events comparing fluoxetine with placebo were the following (see Analysis 1.5).
1.5. Analysis.
Comparison 1: Fluoxetine versus placebo, Outcome 5: Specific adverse events
Abdominal pain: RR 1.51, 95% CI 0.58 to 3.90; P = 0.40; 5 trials, 504 participants.
Allergy: RR 0.17, 95% CI 0.03 to 0.98; P = 0.05; 3 trials, 780 participants.
Amnesia: RR 12.89, 95% CI 0.73 to 227.44; P = 0.08; 1 trial, 458 participants.
Anorexia: RR 8.89, 95% CI 1.36 to 57.89; P = 0.02; 1 trial, 19 participants in favour of placebo.
Anxiety: RR 1.07, 95% CI 0.56 to 2.03; P = 0.83; 7 trials, 1210 participants.
Constipation: RR 2.83, 95% CI 0.58 to 13.90; P = 0.20; 3 trials, 381 participants.
Diarrhoea: RR 1.44, 95% CI 0.97 to 2.13; P = 0.07; 7 trials, 1191 participants.
Dizziness: RR 2.40, 95% CI 1.03 to 5.60; P = 0.04; 5 trials, 693 participants in favour of placebo.
Drowsiness: RR 2.67, 95% CI 1.68 to 4.24; P < 0.001; 9 trials, 1253 participants in favour of placebo.
Dry mouth: RR 1.23, 95% CI 0.66 to 2.30; P = 0.52; 6 trials, 896 participants.
Dyspepsia: RR 1.99, 95% CI 0.71 to 5.55; P = 0.19; 4 trials, 501 participants.
Fatigue: RR 2.50, 95% CI 1.62 to 3.85; P < 0.001; 5 trials, 1112 participants in favour of placebo.
Headache: RR 1.17, 95% CI 0.94 to 1.47; P = 0.16; 8 trials, 1234 participants.
Insomnia: RR 2.23, 95% CI 1.22 to 4.08; P = 0.009; 7 trials, 1191 participants in favour of placebo.
Irritability: RR 1.41, 95% CI 0.63 to 3.15; P = 0.40; 3 trials, 442 participants.
Malaise: RR 0.60, 95% CI 0.15 to 2.46; P = 0.48; 2 trials, 322 participants.
Nausea: RR 1.99, 95% CI 1.35 to 2.91; P < 0.001; 7 trials, 1016 participants in favour of placebo.
Palpitations: RR 2.81, 95% CI 0.12 to 66.40; P = 0.52; 1 trial, 60 participants.
Rhinitis: RR 0.99, 95% CI 0.75 to 1.30; P = 0.94; 3 trials, 933 participants.
The adverse events dizziness, drowsiness, fatigue, insomnia and nausea were observed approximately twice as often following fluoxetine treatment.
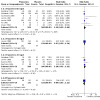
Across all fluoxetine dosages and durations of treatment the RR for the outcome 'any adverse event' was 1.18 (95% CI 0.99 to 1.42; P = 0.07; 9 trials (without Levine 1989 and fluoxetine 20 mg/d and 40 mg/d, and Goldstein 1993 and fluoxetine 20 mg/d to avoid a unit of analysis error), 1253 participants; low certainty evidence; Analysis 1.6).
1.6. Analysis.
Comparison 1: Fluoxetine versus placebo, Outcome 6: Participants with any adverse event (per dose)
Subgroup analyses of different fluoxetine doses for adverse events did not show statistically significant subgroup differences (Analysis 1.6).
For fluoxetine 60 mg/d the RR was 1.16, 95% CI 0.93 to 1.44; P = 0.18; 7 trials, 1134 participants.
For fluoxetine 40 mg/d the RR was 1.07, 95% CI 0.93 to 1.24; P = 0.32; 1 trial, 262 participants.
For fluoxetine 20 mg/d, the RR was 1.10, 95% CI 0.92 to 1.31; P = 0.30; 4 trials, 592 participants.
For fluoxetine 10 mg/d, the RR was 0.96, 95% CI 0.82 to 1.12; P = 0.59; 1 trial, 262 participants.
Of the seven trials administering fluoxetine 60 mg/d, four trials reported the outcome 'any adverse event' from zero to three months (Levine 1987; Levine 1989; Pijl 1991; Visser 1993); two reported 'any adverse event' from four to six months (Goldstein 1994; Guimaraes 2006); and one reported 'any adverse event' from 7 to 12 months (Goldstein 1993) (Analysis 1.7). The test for subgroup differences did not indicate a statistical significant difference.
1.7. Analysis.
Comparison 1: Fluoxetine versus placebo, Outcome 7: Participants with any adverse event (duration of intervention)
Two cross‐over trials reported adverse events in the comparison of fluoxetine 60 mg/d with placebo (Fernández‐Soto 1995; Lawton 1995). Adverse events were comparable between intervention and control groups. For further details see Appendix 11; Appendix 12; Appendix 13.
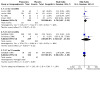
Discontinuation of the trial due to an adverse event comparing fluoxetine therapy with placebo had an RR of 1.88 (95% CI 0.87 to 4.06; P = 0.11; 8 trials, 1188 participants; Analysis 1.8). The 95% prediction interval ranged between 0.26 and 13.61.
1.8. Analysis.
Comparison 1: Fluoxetine versus placebo, Outcome 8: Participants discontinuing due to adverse events
Secondary outcomes
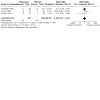
Anthropometric measurements other than weight loss in kilograms (reduction in BMI)
Three trials compared fluoxetine with placebo. The MD in BMI reduction across all fluoxetine doses compared with placebo was −1.1 kg/m² (95% CI −3.7 to 1.4; 3 trials, 97 participants; very low certainty evidence; Analysis 1.9). Calculation of the 95% prediction interval did not provide a meaningful estimate.
1.9. Analysis.
Comparison 1: Fluoxetine versus placebo, Outcome 9: Anthropometric measurements other than weight loss (BMI)
Subgroup analyses of different fluoxetine doses did not show statistically significant subgroup differences; Analysis 1.9.
For fluoxetine 60 mg/d the MD was −3.3 kg/m² (95% CI −7.3 to 0.7; P = 0.10; 1 trial, 19 participants (Guimaraes 2006)).
For fluoxetine 40 mg/d the MD was −2.8 kg/m² (95% CI −8.7 to 3.1; P = 0.35; 1 trial, 18 participants (Pedrinola 1993)).
For fluoxetine 20 mg/d the MD was 0.2 kg/m² (95% CI −0.6 to 1; P = 0.62; 1 trial, 60 participants (Suplicy 2014)).
Morbidity (depression)
Three trials compared fluoxetine with placebo on the incidence of depression (Goldstein 1993; Levine 1987; Suplicy 2014). A total of 15 out of 197 participants (7.6%) receiving fluoxetine compared with 12 out of 196 participants (6.1%) receiving placebo experienced depression. The risk ratio across all fluoxetine doses compared with placebo was 1.20 (95% CI 0.57 to 2.52; P = 0.62; 3 trials, 393 participants; very low certainty evidence; Analysis 1.10). Calculation of the 95% prediction interval did not provide a meaningful estimate.
1.10. Analysis.
Comparison 1: Fluoxetine versus placebo, Outcome 10: Morbidity (depression)
Three trials with four trial arms provided data for different doses of fluoxetine (Analysis 1.11). Subgroup analysis did not show a statistically significant subgroup difference.
1.11. Analysis.
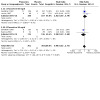
Comparison 1: Fluoxetine versus placebo, Outcome 11: Morbidity (depression per dose)
For fluoxetine 60 mg/d, the RR was 1.41 (95% CI 0.53 to 3.79; P = 0.49; 2 trials, 333 participants) (Goldstein 1993; Levine 1987).
For fluoxetine 20 mg/d, the RR was 0.58 (95% CI 0.23 to 1.48; P = 0.25; 2 trials, 271 participants) (Goldstein 1993; Suplicy 2014).
All‐cause mortality
None of the trials reported on all‐cause mortality.
Socioeconomic effects
None of the trials reported on socioeconomic effects.
Fluoxetine compared with another anti‐obesity agent
The certainty of the evidence for all outcomes was very low because of high risk of performance bias, attrition bias and selective reporting, and very serious imprecision (CI consistent with benefit and harm, small number of trials and small number of participants).
Primary outcomes
Weight loss (kg)
Three trials (234 participants) compared different doses of fluoxetine with six types of anti‐obesity agents (sibutramine, metformin, dexfenfluramine, diethylpropion, fenproporex and mazindol) (Analysis 2.1).
2.1. Analysis.
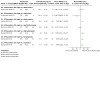
Comparison 2: Fluoxetine versus another anti‐obesity agent, Outcome 1: Weight loss, end of trial weight
For fluoxetine 60 mg/d versus sibutramine the MD was 4.3 kg (95% CI −3.2 to 11.8; P = 0.26; 1 trial, 17 participants) (Guimaraes 2006).
For fluoxetine 60 mg/d versus metformin the MD was −8.9 kg (95% CI −19.9 to 2.1; P = 0.11; 1 trial, 17 participants) (Guimaraes 2006).
For fluoxetine 20 mg/d versus sibutramine the MD was 7 kg (95% CI 4.4 to 9.6; P < 0.001; 1 trial, 61 participants) (Suplicy 2014).
For fluoxetine 20 mg/d versus dexfenfluramine the MD was −0.5 kg (95% CI −3.4 to 2.4; P = 0.73; 1 trial, 58 participants) (Wurtman 1993).
For fluoxetine 20 mg/d versus diethylpropion the MD was 7.5 kg (95% CI 4.7 to 10.3; P < 0.001; 1 trial, 61 participants) (Suplicy 2014).
For fluoxetine 20 mg/d versus fenproporex the MD was 5.3 kg (95% CI 2.4 to 8.2; P < 0.001; 1 trial, 62 participants) (Suplicy 2014).
For fluoxetine 20 mg/d versus mazindol the MD was 4.9 kg, 95% CI 2.6 to 7.3; P < 0.001; 1 trial; 60 participants (Suplicy 2014).
Health‐related quality of life
None of the trials assessed health‐related quality of life.
Adverse events
Three trials compared different doses of fluoxetine with six anti‐obesity agents (sibutramine, metformin, dexfenfluramine, diethylpropion, fenproporex and mazindol) for any adverse event (Analysis 2.2).
2.2. Analysis.
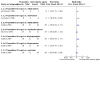
Comparison 2: Fluoxetine versus another anti‐obesity agent, Outcome 2: Any adverse event
For fluoxetine 60 mg/d versus sibutramine the RR was 1.19 (95% CI 0.75 to 1.88; P = 0.47; 1 trial, 17 participants) (Guimaraes 2006).
For fluoxetine 60 mg/d versus metformin the RR was 1.78 (95% CI 0.86 to 3.69; P = 0.12; 1 trial, 17 participants) (Guimaraes 2006).
For fluoxetine 20 mg/d versus sibutramine the RR was 1.58 (95% CI 0.91 to 2.77; P = 0.11; 1 trial, 61 participants) (Suplicy 2014).
For fluoxetine 20 mg/d versus dexfenfluramine the RR was 1.09 (95% CI 0.89 to 1.33; P = 0.42; 1 trial, 59 participants) (Wurtman 1993).
For fluoxetine 20 mg/d versus diethylpropion the RR was 1.58 (95% CI 0.91 to 2.77; P = 0.11; 1 trial, 61 participants) (Suplicy 2014).
For fluoxetine 20 mg/d versus fenproporex the RR was 1.20 (95% CI 0.75 to 1.92; P = 0.45; 1 trial, 62 participants) (Suplicy 2014).
For fluoxetine 20 mg/d versus mazindol the RR was 1.05 (95% CI 0.68 to 1.64; P = 0.82; 1 trial, 60 participants) (Suplicy 2014).
The comparisons of the various anti‐obesity agents with fluoxetine with regard to specific adverse events showed inconclusive findings (Analysis 2.3; Analysis 2.4; Analysis 2.5; Analysis 2.6; Analysis 2.7; Analysis 2.8; Analysis 2.9; Analysis 2.10; Analysis 2.11; Analysis 2.12; Analysis 2.13; Analysis 2.14; Analysis 2.15; Analysis 2.16; Analysis 2.17; Analysis 2.18; Analysis 2.19; Analysis 2.20; Analysis 2.21).
2.3. Analysis.
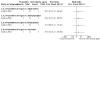
Comparison 2: Fluoxetine versus another anti‐obesity agent, Outcome 3: Adverse events (abdominal pain)
2.4. Analysis.
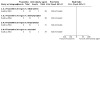
Comparison 2: Fluoxetine versus another anti‐obesity agent, Outcome 4: Adverse events (allergy)
2.5. Analysis.
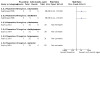
Comparison 2: Fluoxetine versus another anti‐obesity agent, Outcome 5: Adverse events (anorexia)
2.6. Analysis.
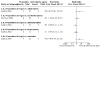
Comparison 2: Fluoxetine versus another anti‐obesity agent, Outcome 6: Adverse events (anxiety)
2.7. Analysis.
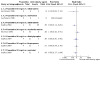
Comparison 2: Fluoxetine versus another anti‐obesity agent, Outcome 7: Adverse events (constipation)
2.8. Analysis.
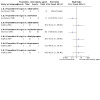
Comparison 2: Fluoxetine versus another anti‐obesity agent, Outcome 8: Adverse events (diarrhoea)
2.9. Analysis.
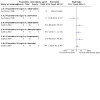
Comparison 2: Fluoxetine versus another anti‐obesity agent, Outcome 9: Adverse events (dizziness)
2.10. Analysis.
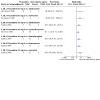
Comparison 2: Fluoxetine versus another anti‐obesity agent, Outcome 10: Adverse events (drowsiness)
2.11. Analysis.
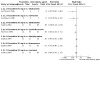
Comparison 2: Fluoxetine versus another anti‐obesity agent, Outcome 11: Adverse events (dry mouth)
2.12. Analysis.
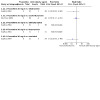
Comparison 2: Fluoxetine versus another anti‐obesity agent, Outcome 12: Adverse events (dyspepsia)
2.13. Analysis.
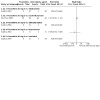
Comparison 2: Fluoxetine versus another anti‐obesity agent, Outcome 13: Adverse events (fatigue)
2.14. Analysis.
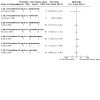
Comparison 2: Fluoxetine versus another anti‐obesity agent, Outcome 14: Adverse events (headache)
2.15. Analysis.
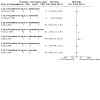
Comparison 2: Fluoxetine versus another anti‐obesity agent, Outcome 15: Adverse events (insomnia)
2.16. Analysis.
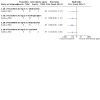
Comparison 2: Fluoxetine versus another anti‐obesity agent, Outcome 16: Adverse events (irritability)
2.17. Analysis.

Comparison 2: Fluoxetine versus another anti‐obesity agent, Outcome 17: Adverse events (malaise)
2.18. Analysis.
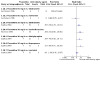
Comparison 2: Fluoxetine versus another anti‐obesity agent, Outcome 18: Adverse events (nausea)
2.19. Analysis.
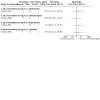
Comparison 2: Fluoxetine versus another anti‐obesity agent, Outcome 19: Adverse events (palpitation)
2.20. Analysis.
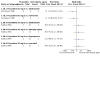
Comparison 2: Fluoxetine versus another anti‐obesity agent, Outcome 20: Adverse events (sweating)
2.21. Analysis.
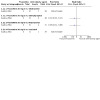
Comparison 2: Fluoxetine versus another anti‐obesity agent, Outcome 21: Adverse events (tremor)
Secondary outcomes
Anthropometric measurements other than weight loss in kilograms (reduction in BMI)
Two trials compared different dose of fluoxetine with five types of anti‐obesity agents (sibutramine, metformin, diethylpropion, fenproporex and mazindol); Analysis 2.22.
2.22. Analysis.
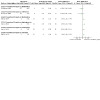
Comparison 2: Fluoxetine versus another anti‐obesity agent, Outcome 22: Anthropometric measurements other than weight loss in kg (BMI)
For fluoxetine 60 mg/d versus sibutramine the MD was −1.5 kg/m² (95% CI −5.2 to 2.2; P = 0.42; 1 trial, 17 participants) (Guimaraes 2006).
For fluoxetine 60 mg/d versus metformin the MD was −2.2 kg/m² (95% CI −8.4 to 4; P = 0.48; 1 trial, 17 participants) (Guimaraes 2006).
For fluoxetine 20 mg/d versus sibutramine the MD was 2.4 kg/m² (95% CI 1.4 to 3.4; P < 0.001; 1 trial, 61 participants) (Suplicy 2014).
For fluoxetine 20 mg/d versus diethylpropion the MD was 2.9 kg/m² (95% CI 1.8 to 4; P < 0.001; 1 trial, 61 participants) (Suplicy 2014).
For fluoxetine 20 mg/d versus fenproporex the MD was 2 kg/m² (95% CI 0.9 to 3.1; P < 0.001; 1 trial, 62 participants) (Suplicy 2014).
For fluoxetine 20 mg/d versus mazindol the MD was 2 kg/m² (95% CI 1.1 to 2.9; P < 0.001; 1 trial, 60 participants) (Suplicy 2014).
Morbidity (depression)
Only Suplicy 2014 compared fluoxetine 20 mg/d with four types of anti‐obesity agents (sibutramine, diethylpropion, fenproporex and mazindol). Two comparisons provided data for the outcome depression (Analysis 2.23).
2.23. Analysis.
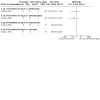
Comparison 2: Fluoxetine versus another anti‐obesity agent, Outcome 23: Morbidity (depression)
For fluoxetine versus sibutramine the RR was 0.32 (95% CI 0.01 to 7.63; P = 0.48; 1 trial, 61 participants).
For fluoxetine versus diethylpropion the RR was 0.19 (95% CI 0.01 to 3.88; P = 0.28; 1 trial, 61 participants).
All‐cause mortality
None of the trials reported on all‐cause mortality.
Socioeconomic effects
None of the trials reported on socioeconomic effects.
Fluoxetine versus non‐pharmacological therapy
One trial (48 participants) consisting of four trial arms included omega‐3 gel as monotherapy and in combination with fluoxetine (Al‐Helli 2015). None of the primary or secondary outcomes were reported.
Fluoxetine versus no treatment
The certainty of the evidence for all outcomes was very low because of high risk of performance bias and very serious imprecision (one trial only with 60 participants).
Primary outcomes
Weight loss (kg)
One trial compared fluoxetine 60 mg/d with no treatment (Huang 1998). The treatment showed a weight loss from 0 to 3 months with an MD of −2.7 kg in favour of fluoxetine (95% CI −3 to −2.4; P < 0.001; 60 participants, 1 trial) (Analysis 3.1).
3.1. Analysis.
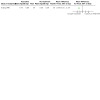
Comparison 3: Fluoxetine versus no treatment, Outcome 1: Weight loss
Health‐related quality of life
This outcome was not reported.
Adverse events
There was an increase in the risk of at least one adverse event in the fluoxetine 60 mg/d group compared with the no‐treatment group (RR 8.67, 95% CI 2.94 to 25.59; P < 0.001; 60 participants, 1 trial) (Analysis 3.2).
3.2. Analysis.
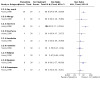
Comparison 3: Fluoxetine versus no treatment, Outcome 2: Adverse events
Comparisons for allergy, diarrhoea, headache, insomnia, malaise and drowsiness showed inconclusive results. Fluoxetine was associated with increased anorexia (RR 26.00, 95% CI 3.77 to 179.51; P < 0.001; 1 trial, 60 participants) and nausea (RR 8.00, 95% CI 1.07 to 60.09; P = 0.04; 1 trial, 60 participants) (Analysis 3.2).
Secondary outcomes
Morbidity, all‐cause mortality or socioeconomic effects were not reported.
Anthropometric measurements other than weight loss in kilograms (reduction in BMI)
The MD was −0.5 kg/m² in favour of fluoxetine (95% CI −0.6 to −0.3; P < 0.001; 1 trial, 60 participants) (Analysis 3.3).
3.3. Analysis.
Comparison 3: Fluoxetine versus no treatment, Outcome 3: Anthropometric measurements other than weight loss in kg (BMI)
Subgroup analyses
We only performed subgroup analyses for fluoxetine doses and duration of intervention for the outcome measures 'weight loss and adverse events' for fluoxetine versus placebo, because there were not enough trials to estimate effects for the other subgroups.
Sensitivity analyses
We did not perform sensitivity analyses because we could not include enough trials.
Assessment of reporting bias
We did not draw funnel plots because of the limited number of trials for a particular outcome.
Ongoing trials
We did not find ongoing trials.
Discussion
Summary of main results
We included 19 published trials in this review (one record is awaiting assessment), out of which 15 were parallel trials, and four had a cross‐over design. There were a total of 2216 overweight or obese participants without depression, mental illness or abnormal eating patterns who were followed up for between three weeks and one year. In 16 trials BMI was the diagnostic criterion.
The 19 included trials in the review had a great variety of interventions with overall 56 trial arms. Out of the total number of participants entered in completed studies, 1280 were assigned to four fluoxetine groups according to the dose administered (60 mg/d, 40 mg/d, 20 mg/d and 10 mg/d) and 936 participants were randomly assigned to 12 comparison groups: A) placebo, our main comparison, in 18 trials; B) anti‐obesity agents (diethylpropion, fenproporex, mazindol, sibutramine, metformin, fenfluramine, dexfenfluramine, fluvoxamine and 5‐hydroxy‐tryptophan) in four trials; C) no treatment in one trial; and D) non‐pharmacological treatment (omega‐3 gel) in another trial.
The outcomes assessed also varied among the included trials as: biochemical parameters (glucose, urea, uric acid, serum lipids, cholesterol, triglycerides, fasting glucose, fasting insulin, glycated haemoglobin, insulin resistance, HOMA, glucose‐induced thermogenesis, nitrogen balance, resting energy expenditure); anthropometric measurements (waist circumference, abdominal circumference, fatty tissue); cardiovascular parameters (blood pressure, heart rate, oxygen consumption, arterial oxygen saturation, changes in the electrocardiogram); and others composite outcomes (appetite, energy intake, macronutrient intake, resting metabolic rate, satiety, resting respiratory quotient, sleep‐breathing patterns).
Overall, the results of this systematic review suggest that 60 mg/d fluoxetine compared with placebo decreased weight by 2.5 kg; however the 95% prediction interval ranged between a 6.4 kg weight loss and a 1.4 kg weight increase. The adverse events of dizziness, drowsiness, fatigue, insomnia and nausea were observed approximately twice as often following treatment. There were no clear differences between fluoxetine and placebo with regard to morbidity (depression). All‐cause mortality, health‐related quality of life and socioeconomic effects were not reported. The comparisons of fluoxetine with other anti‐obesity agents (3 trials, 234 participants), omega‐3 gel (1 trial, 48 participants) and no treatment (1 trial, 60 participants) showed inconclusive results (very low certainty evidence).
Overall completeness and applicability of evidence
This review included 19 trials with the main comparison being fluoxetine versus placebo. Our included trials did not report on 'all‐cause mortality', 'health‐related quality of life' and 'socioeconomic effects' and there is a high degree of uncertainty regarding these outcome measures. Also, limited data were available for depression as a morbidity outcome.
Quality of the evidence
We identified a great variety of doses and durations of treatment in the intervention groups, many different groups of comparators, and variation in the diagnostic criteria and characteristics of the grade of obesity in the participants, which limited comparability and increased the heterogeneity between trials.
In most trials, the risk of selection bias was unclear, because their reports did not mention in detail the methods of random sequence generation and concealment of allocation. Blinding of outcome assessment was unclear in almost all trials. Approximately one‐third of the trials had a high risk of bias due to attrition rates of up 20% of their participants and almost half of the trials had a high risk of reporting bias.
The certainty of the evidence for all outcomes was overall low or very low, mainly because of risk of bias and serious imprecision due to low number of trials and participants, and CIs being consistent with benefit and harm.
Potential biases in the review process
This review was performed using standard Cochrane methodology and without any restrictions regarding the language or date of publication. All included trials were selected and assessed, and data were extracted by three review authors to minimise biases in the process of the review. When we identified substantial heterogeneity, we tried to reduce it by data stratification. When data were missing, we attempted to contact the trial authors. However, most of the trials were conducted in the late 1980s and early 1990s and information obtained from trial authors was very limited.
Agreements and disagreements with other studies or reviews
The finding of our review are consistent with those of previous systematic reviews conducted in other populations, which demonstrated a weight loss of 5.1 kg (95% CI 3.4 to 6.83; 4 trials, 97 participants) compared with placebo in participants with type 2 diabetes who received fluoxetine for 24 weeks to 26 weeks (Norris 2005); and 4.3 kg (95% CI 2.6 to 6; 5 trials, 213 participants) compared with placebo in participants who received fluoxetine for up to 12 months (Ye 2011). Another systematic review reported a weight loss of 1.3 kg (95% CI 0.2 to 2.4; 19 trials) in overweight or obese adults (BMI of 26 kg/m² to 39 kg/m²) treated with fluoxetine between 4 and 12 months compared with placebo (Domecq 2015).
Authors' conclusions
Implications for practice.
Approved indications for use of fluoxetine are major depression, obsessive behaviours, panic disorders and bulimia. We observed low‐certainty evidence suggesting that off‐label fluoxetine may produce a modest weight loss compared with placebo at any dose, especially when given at a dose of 60 mg/day. However, we found low‐certainty evidence of a small increase in the risk for specific adverse events, such as dizziness, drowsiness, fatigue, insomnia and nausea following fluoxetine consumption. With respect to other findings of our review, there were limited data from other comparator anti‐obesity agents and non‐pharmacological therapies were scarce.
Implications for research.
Further research is required to determine whether the administration of fluoxetine has any effect on morbidity, socioeconomic effects and health‐related quality of life in overweight and obese people, as well as whether this intervention might be useful in combination with other anti‐obesity agents or with non‐pharmacological interventions to reduce weight. To ensure the efficacy and safety of fluoxetine in overweight or obese adults high‐certainty evidence is needed to analyse the effects of long‐term use of fluoxetine to promote weight loss and to determine the severity of adverse events. On the other hand, researchers should improve their efforts to reduce high attrition rates in these types of long‐term therapies.
What's new
| Date | Event | Description |
|---|---|---|
| 29 July 2022 | Amended | Data was added on the co‐publication of the review. |
History
Protocol first published: Issue 5, 2015 Review first published: Issue 10, 2019
Notes
Portions of the background and Methods sections, the appendices, additional tables and figures 1 to 3 of this review are based on a standard template established by the Cochrane Metabolic and Endocrine Disorders Group.
An abridged version of this review was co‐published in the journal Obesity Facts in 2022 (Serralde‐Zuñiga 2022).
Acknowledgements
We thank the CMED Group for their assistance. We acknowledge the CMED Group Information Specialist, Maria‐Inti Metzendorf, for developing the search strategy and the Assistant Director of Scientific Information and Documentation of National Institute of Pediatrics, Cecilia Solis‐Galicia, for acquiring study reports.
The review authors, and the CMED editorial base, are grateful to the following peer reviewers for their time and comments: Dr Emma Axon, Cochrane systematic methodologist, Cochrane Skin Group, University of Nottingham, UK and Ian Caterson, University of Sydney.
Appendices
Appendix 1. Checklist to aid consistency and reproducibility of GRADE assessments: fluoxetine versus placebo
| Items | (1) Weight loss (kg) | (2) Health‐related quality of life | (3) Any adverse event | (4) Anthropometric measurements other than weight loss in kg (BMI) | (5) Morbidity: depression | (6) All‐cause mortality | (7) Socioeconomic effects | |
| Trial limitations (risk of bias)a | Was random sequence generation used (i.e. no potential for selection bias)? | Unclear | Not reported | Unclear | Unclear | Unclear | Not reported | Not reported |
| Was allocation concealment used (i.e. no potential for selection bias)? | Unclear | Unclear | Unclear | Unclear | ||||
| Was there blinding of participants and personnel (i.e. no potential for performance bias) or outcome not likely to be influenced by lack of blinding? | Yes | Yes | No (↓) | No (↓) | ||||
| Was there blinding of outcome assessment (i.e. no potential for detection bias) or was outcome measurement not likely to be influenced by lack of blinding? | Unclear | Unclear | Unclear | Unclear | ||||
| Were more than 80% of participants enrolled in trials included in the analysis (i.e. no potential reporting bias)?e | 60 mg/d: unclear 40 mg/d: no (↓) 20 mg/d: no (↓) |
No (↓) | Unclear | No (↓) | ||||
| Were data reported consistently for the outcome of interest (i.e. no potential selective reporting)? | No (↓) | No (↓) | No (↓) | No (↓) | ||||
| No other biases reported (i.e. no potential of other bias)? | Yes | Yes | Yes | Yes | ||||
| Inconsistencyb | Point estimates did not vary widely? | 60 mg/d: yes 40 mg/d: no (↓) 20 mg/d: no (↓) |
Yes | Yes | Yes | |||
| To what extent did confidence intervals overlap (substantial: all confidence intervals overlap at least one of the included studies point estimate;some: confidence intervals overlap but not all overlap at least one point estimate; no: at least one outlier: where the confidence interval of some of the studies do not overlap with those of most included studies)? | 60 mg/d: substantial 40 mg/d: no (↓) 20 mg/d: some |
Substantial | Substantial | Substantial | ||||
| Was the direction of effect consistent? | Yes | Yes | Yes | Yes | ||||
| What was the magnitude of statistical heterogeneity (as measured by I²) ‐ low (I²<40%), moderate (I² 40%‐60%), high I²>60%)? | High (↓) | High (↓) | Moderate | Low | ||||
| Was the test for heterogeneity statistically significant (P < 0.1)? | Statistically significant (↓) | Statistically significant (↓) | Not statistically significant | Not statistically significant | ||||
| Indirectness | Were the populations in included studies applicable to the decision context? | Highly applicable | Highly applicable | Highly applicable | Highly applicable | |||
| Were the interventions in the included studies applicable to the decision context? | Highly applicable | Highly applicable | Highly applicable | Highly applicable | ||||
| Was the included outcome not a surrogate outcome? | Yes | Yes | Yes | Yes | ||||
| Were the conclusions based on direct comparisons? | Yes | Yes | Yes | Yes | ||||
| Imprecisionc | Was the confidence interval for the pooled estimate not consistent with benefit and harm? | 60 mg/d: yes 40 mg/d: unclear 20 mg/d: unclear |
Yes | No (↓) | No (↓) | |||
| What is the magnitude of the median sample size (high: 300 participants, intermediate: 100‐300 participants, low: <100 participants)?e | Low (↓) | Low (↓) | Low (↓) | Low (↓) | ||||
| What was the magnitude of the number of included studies (large: >10 studies, moderate: 5‐10 studies, small: <5 studies)?e | 60 mg/d: moderate 40 mg/d: small (↓) 20 mg/d: small (↓) |
Moderate | Small (↓) | Small (↓) | ||||
| Was the outcome a common event (e.g. occurs more than 1/100)? | NA | Yes | NA | NA | ||||
| Publication biasd | Was a comprehensive search conducted? | Yes | Yes | Yes | Yes | |||
| Was grey literature searched? | Yes | Yes | Yes | Yes | ||||
| Were no restrictions applied to study selection on the basis of language? | Yes | Yes | Yes | Yes | ||||
| There was no industry influence on studies included in the review? | Yes | Yes | Yes | Yes | ||||
| There was no evidence of funnel plot asymmetry? | NA | NA | NA | NA | ||||
| There was no discrepancy in findings between published and unpublished trials? | NA | NA | NA | NA | ||||
|
aQuestions on risk of bias are answered in relation to the majority of the aggregated evidence in the meta‐analysis rather than to individual trials
bQuestions on inconsistency are primarily based on visual assessment of forest plots and the statistical quantification of heterogeneity based on I² cWhen judging the width of the confidence interval it is recommended to use a clinical decision threshold to assess whether the imprecision is clinically meaningful dQuestions address comprehensiveness of the search strategy, industry influence, funnel plot asymmetry and discrepancies between published and unpublished trials eDepends on the context of the systematic review area (↓): key item for potential downgrading the quality of the evidence (GRADE) as shown in the footnotes of the 'Summary of finding' table(s); BMI: body mass index; GRADE: Grading of Recommendations Assessment, Development and Evaluation; NA: not applicable. | ||||||||
Appendix 2. Search strategies
| CENTRAL (Cochrane Library) |
| 1. [mh ^Obesity] 2. [mh ^"Obesity, Abdominal"] 3. [mh ^"Obesity, Morbid"] 4. [mh ^Adiposity] 5. [mh ^"Body Weight Changes"] 6. [mh ^"Body Weight"] 7. [mh ^"Weight Loss"] 8. [mh ^Overweight] 9. ("over weight*" or overweight*):ti,ab 10. adipos*:ti,ab 11. obes*:ti,ab 12. (weight near/4 (cyc* or reduc* or los* or maint* or decreas* or control* or gain* or chang* or improv* or modif* or exessiv*)):ti,ab 13. "fat":ti,ab 14. {or #1‐#13} 15. [mh Fluoxetine] 16. fluoxetin*:ti,ab 17. ("prozac" or "sarafem"):ti,ab 18. {or #15‐#17} 19. #14 and #18 |
| MEDLINE (Ovid SP) |
| 1. Obesity/ 2. Obesity, Abdominal/ 3. Obesity, Morbid/ 4. Adiposity/ 5. Body Weight Changes/ 6. Body Weight/ 7. Weight Loss/ 8. Overweight/ 9. (overweight* or over weight*).tw. 10. adipos*.tw. 11. obes*.tw. 12. (weight adj3 (cyc* or reduc* or los* or maint* or decreas* or control* or gain* or chang* or improv* or modif* or exessiv*)).tw. 13. fat.tw. 14. or/1‐13 15. Fluoxetine/ 16. fluoxetin*.tw. 17. (prozac or sarafem).tw. 18. or/15‐17 19. 14 and 18 [20‐30: Cochrane Handbook 2008 RCT filter ‐ sensitivity maximizing version] 20. randomized controlled trial.pt. 21. controlled clinical trial.pt. 22. randomized.ab. 23. placebo.ab. 24. drug therapy.fs. 25. randomly.ab. 26. trial.ab. 27. groups.ab. 28. or/20‐27 29. exp animals/ not humans/ 30. 28 not 29 31. 19 and 30 |
| Embase (Ovid SP) |
| 1. obesity/ 2. abdominal obesity/ 3. morbid obesity/ 4. weight control/ 5. weight reduction/ 6. (overweight* or over weight*).tw. 7. adipos*.tw. 8. obes*.tw. 9. (weight adj (reduc* or los* or control* or gain*)).tw. 10. or/1‐9 11. (fluoxetin* or prozac or sarafem).tw. 12. 10 and 11 [13 Wong et al. 2006 "sound treatment studies" filter – BS version] 13. random*.tw. or clinical trial*.mp. or exp health care quality/ 14. 12 and 13 [15‐18 TSC Portal filter for exclusion of animal references] 15. exp animals/ or exp invertebrate/ or animal experiment/ or animal model/ or animal tissue/ or animal cell/ or nonhuman/ 16. human/ or normal human/ or human cell/ 17. 15 and 16 18. 15 not 17 19. 14 not 18 |
| LILACS (iAHx) |
| (MH:"Obesity" OR MH:"Obesity, Morbid" OR MH:"Obesity, Abdominal" OR MH:"Pediatric Obesity" OR MH:"Overweight" OR MH:"Weight Loss" OR adipos$ OR obes$ OR overweight$ OR "over weight" OR sobrepes$ OR "exceso de peso" OR "excesso de peso" OR "weight reduction" OR "weight loss" OR "weight control") AND (MH:"Fluoxetine" OR fluoxetin$ OR prozac OR sarafem) + Filter "Controlled Clinical Trial" |
| ClinicalTrials.gov (Advanced search) |
| Conditions: obesity OR obese OR adiposity OR adipose OR overweight OR "over weight" OR "weight reduction" OR "weight loss" OR "weight control" Interventions: fluoxetin OR fluoxetine OR prozac OR sarafem Age Group: Adult (18‐65), Senior (66+) |
| WHO ICTRP Search Portal (Standard search) |
| obes* AND fluoxetin* OR adipos* AND fluoxetin* OR overweight* AND fluoxetin* OR weight AND fluoxetin* OR obes* AND fluoxetine OR adipos* AND fluoxetine OR overweight* AND fluoxetine OR weight AND fluoxetine OR obes* AND prozac OR adipos* AND prozac OR overweight* AND prozac OR weight AND prozac OR obes* AND sarafem OR adipos* AND sarafem OR overweight* AND sarafem OR weight AND sarafem |
Appendix 3. 'Risk of bias' assessment
| 'Risk of bias' domains |
|
Random sequence generation (selection bias due to inadequate generation of a randomised sequence) For each included trial, we described the method used to generate the allocation sequence in sufficient detail to allow an assessment of whether it should produce comparable groups.
Allocation concealment (selection bias due to inadequate concealment of allocation prior to assignment) We described for each included trial the method used to conceal allocation to interventions prior to assignment and we assessed whether intervention allocation could have been foreseen in advance of or during recruitment or changed after assignment.
We also evaluated trial baseline data to incorporate assessment of baseline imbalance into the 'Risk of bias' judgement for selection bias (Corbett 2014). Chance imbalances may also affect judgements on the risk of attrition bias. In the case of unadjusted analyses, we distinguished between trials that we rate as being at low risk of bias on the basis of both randomisation methods and baseline similarity, and trials that we judge as being at low risk of bias on the basis of baseline similarity alone (Corbett 2014). We reclassified judgements of unclear, low, or high risk of selection bias as specified in Appendix 4. Blinding of participants and study personnel (performance bias due to knowledge of the allocated interventions by participants and personnel during the trial) We evaluated the risk of detection bias separately for each outcome (Hróbjartsson 2013). We noted whether endpoints were self‐reported, investigator‐assessed, or adjudicated outcome measures (see below).
Blinding of outcome assessment (detection bias due to knowledge of the allocated interventions by outcome assessment) We evaluated the risk of detection bias separately for each outcome (Hróbjartsson 2013). We noted whether endpoints were self‐reported, investigator‐assessed, or adjudicated outcome measures (see below).
Incomplete outcome data (attrition bias due to quantity, nature or handling of incomplete outcome data) For each included trial or each outcome, or both, we described the completeness of data, including attrition and exclusions from the analyses. We stated whether the trial reported attrition and exclusions, and we reported the number of participants included in the analysis at each stage (compared with the number of randomised participants per intervention/comparator groups). We also noted if the trial reported the reasons for attrition or exclusion, and whether missing data were balanced across groups or were related to outcomes. We considered the implications of missing outcome data per outcome such as high dropout rates (e.g. above 15%) or disparate attrition rates (e.g. difference of 10% or more between trial arms).
Selective reporting (reporting bias due to selective outcome reporting) We assessed outcome reporting bias by integrating the results of the appendix 'Matrix of trial endpoints (publications and trial documents)' (Boutron 2014; Jones 2015; Mathieu 2009), with those of the appendix 'High risk of outcome reporting bias according to the Outcome Reporting Bias In Trials (ORBIT) classification' (Kirkham 2010). This analysis formed the basis for the judgement of selective reporting.
Other bias
|
Appendix 4. Selection bias decisions
| Selection bias decisions for trials that reported unadjusted analyses: comparison of results obtained using method details alone versus results obtained using method details and trial baseline informationa | |||
| Reported randomisation and allocation concealment methods | Risk of bias judgement using methods reporting | Information gained from study characteristics data | Risk of bias using baseline information and methods reporting |
| Unclear methods | Unclear risk | Baseline imbalances present for important prognostic variable(s) | High risk |
| Groups appear similar at baseline for all important prognostic variables | Low risk | ||
| Limited or no baseline details | Unclear risk | ||
| Would generate a truly random sample, with robust allocation concealment | Low risk | Baseline imbalances present for important prognostic variable(s) | Unclear riskb |
| Groups appear similar at baseline for all important prognostic variables | Low risk | ||
| Limited baseline details, showing balance in some important prognostic variablesc | Low risk | ||
| No baseline details | Unclear risk | ||
| Sequence is not truly randomised or allocation concealment is inadequate | High risk | Baseline imbalances present for important prognostic variable(s) | High risk |
| Groups appear similar at baseline for all important prognostic variables | Low risk | ||
| Limited baseline details, showing balance in some important prognostic variablesc | Unclear risk | ||
| No baseline details | High risk | ||
| aTaken from Corbett 2014; judgements highlighted in bold indicate situations in which the addition of baseline assessments would change the judgement about risk of selection bias compared with using methods reporting alone. bImbalance was identified that appears likely to be due to chance. cDetails for the remaining important prognostic variables are not reported. | |||
Appendix 5. Description of interventions
| Trial ID | Intervention(s) (route, frequency, total dose/day) | Comparator(s) (route, frequency, total dose/day) |
| Al‐Helli 2015 | I1: fluoxetine (oral, once per day for 2 months, 20 mg/day) | Placebo (oral, once per day for 2 months) |
| I2: omega‐3 gel (oral, twice per day for 2 months, 1000 mg) | ||
| I3: fluoxetine + omega‐3 gel (oral, once per day for 2 months, 20 mg/day + 1000 mg) | ||
| Suplicy 2014 | I1: diethylpropion (oral, once per day for 52 weeks, 75 mg/day) | Placebo (oral,once per day for 52 weeks) |
| I2: fenproporex (oral, once per day for 52 weeks, 25 mg/day) | ||
| I3: mazindol (oral, once per day for 52 weeks, 2 mg/day) | ||
| I4: fluoxetine (oral, once per day for 52 weeks, 20 mg/day) | ||
| I5: sibutramine (oral, once per day for 52 weeks, 15 mg/day) | ||
| Guimaraes 2006 | I1: sibutramine (oral, once per day for 90 days, 15 mg/day) | Placebo (oral, once per day for 90 days) |
| I2: metformin (oral, once per day for 90 days, 1700 mg/day) | ||
| I3: fluoxetine (oral, once per day for 90 days, 60 mg/day) | ||
| Bondi 2000 | I1: fluoxetine (oral, single dose, 40 mg) | Placebo (oral, once per day for 12 weeks) |
| I2: fluoxetine (oral, once per day before breakfast for 12 weeks, 40 mg/day and once per day before lunch for 12 weeks, 20 mg/day) | ||
| Huang 1998 | Fluoxetine (oral, once per day for 12 weeks, 60 mg/day) | No treatment |
| Bross 1995 | Fluoxetine (oral, once per day for 3 weeks, 60 mg/day) | Placebo (oral, once per day for 3 weeks) |
| Fernández‐Soto 1995 | Fluoxetine (oral, once per day for 3 months, 60 mg/day) | Placebo (oral, once per day for 3 months) |
| Lawton 1995 | Fluoxetine (oral, once per day for 2 weeks, 60 mg/day) | Placebo (oral, once per day for 2 weeks) |
| Goldstein 1994 | Fluoxetine (oral, once per day for 52 weeks, 60 mg/day) | Placebo (oral, once per day for 52 weeks) |
| Goldstein 1993 | I1: fluoxetine (oral, once per day for 40 weeks, 60 mg/day) | Placebo (oral, once per day for 40 weeks) |
| I2: fluoxetine (oral, once per day for 40 weeks, 20 mg/day) | ||
| Pedrinola 1993 | Fluoxetine (oral, twice per day for 12 weeks, 40 mg/day) | Placebo (oral, twice per day for 12 weeks) |
| Visser 1993 | Fluoxetine (oral, once per day for 12 weeks, 60 mg/day) | Placebo (oral, once per day for 12 weeks) |
| Wurtman 1993 | I1: dexfenfluramine (oral, once per day for 12 weeks, 15 mg/day) | Placebo (oral, once per day for 12 weeks) |
| I2: fluoxetine (oral, once per day for 12 weeks, 20 mg/day) | ||
| Kopelman 1992 | Fluoxetine (oral, once per day for 3 days, 60 mg/day) | Placebo (oral, daily for 3 days) |
| Stinson 1992 | Fluoxetine (oral, once per day for 2 weeks, 60 mg/day) | Placebo (oral, once per day for 2 weeks) |
| Bagiella 1991 | I1: fenfluramine (oral, every 8 hours for 12 weeks, 20 mg/day) | Placebo (oral, every 8 or 12 hours for 12 weeks) |
| I2: 5‐hydroxy‐tryptophan (oral, every 8 hours for 12 weeks, 300 mg/day) | ||
| I3: d‐fenfluramine (oral, twice per day for 12 weeks, 15 mg/day) | ||
| I4: fluoxetine (oral, every 8 hours for 12 weeks, 20 mg/day) | ||
| I5: fluvoxamine (oral, every 8 hours for 12 weeks, 50 mg/day) | ||
| Pijl 1991 | Fluoxetine (oral, once per day for 6 weeks, 60 mg/day) | Placebo (oral, once per day for 6 weeks) |
| Levine 1989 | I1: fluoxetine (oral, once per day for 8 weeks, 10 mg/day) | Placebo (oral, once per day for 8 weeks) |
| I2: fluoxetine (oral, once per day for 8 weeks, 20 mg/day) | ||
| I3: fluoxetine (oral, once per day for 8 weeks, 40 mg/day) | ||
| I4: fluoxetine (oral, once per day for 8 weeks, 60 mg/day) | ||
| Levine 1987 | Fluoxetine (oral, once per day, 20 mg day 1; 40 mg days 2‐3; 60 mg days 4‐14; 40‐80 mg/day at the discretion of the investigator based on weight loss and adverse events to 8 weeks) | Placebo (oral, once per day for 8 weeks) |
| C: comparator; FDA: Food and Drug Administration I: intervention; NA: not applicable. | ||
Appendix 6. Baseline characteristics (I)
| Trial ID | Intervention(s) and comparator(s) | Duration of intervention | Description of participants | Trial period (year to year) | Country | Setting | Ethnic groups (%) | Duration of being overweight or obese |
| Al‐Helli 2015 | I1: fluoxetine 20 mg | 2 months | Age 18 to 40 years, either sex with BMI > 30 kg/m² | — | Iraq | Obesity research and treatment centre/Al‐Kindy medical college, Iraq | — | — |
| I2: omega‐3 gel | ||||||||
| I3: fluoxetine 20 mg + omega‐3 gel | ||||||||
| C: placebo | — | — | ||||||
| Suplicy 2014 | I1: diethylpropion | 52 weeks | Premenopausal women between 18 and 50 years old with BMI 30 to 39.9 kg/m² who were weight stable within the previous 3 months (< 3 kg) | — | Brazil | Obesity Outpatient Clinic of the Endocrine Division (SEMPR) of the Parana Federal University Hospital, Curitiba, Brazil | — | — |
| I2: fenproporex | ||||||||
| I3: mazindol | ||||||||
| I4: fluoxetine 20 mg | ||||||||
| I5: sibutramine | ||||||||
| C: placebo | — | — | ||||||
| Guimaraes 2006 | I1: sibutramine | 90 days | Age 30 to 38 years, either sex with BMI > 30 kg/m² | — | Brazil | University of Riberao Preto | — | — |
| I2: metformin | ||||||||
| I3: fluoxetine 60 mg | ||||||||
| C: placebo | — | — | ||||||
| Bondi 2000 | I1: fluoxetine 40 mg | 12 weeks | Obese women between 48 and 51 years old with BMI 38 to 43 kg/m² who did not achieve a significant weight change during previous 6 months with diet. | — | Italy | Centro di Nutrizione Clinica, Università di Modena | — | — |
| I2: fluoxetine 60 mg | ||||||||
| C: placebo | — | — | ||||||
| Huang 1998 | I: fluoxetine 60 mg | 12 weeks | Either sex, between 17 and 65 years old, who no clinical problems other than moderate obesity (30% over ideal body weight) | 1994 to 1995 | Republic of China | Departament of Internal Medicine and Nutrition, Memorial Hospital, Taipei | — | — |
| C: no treatment | — | — | ||||||
| Bross 1995 | I: fluoxetine 60 mg | 3 weeks | Nondepressed healthy women between 32 and 33 years old, who maintained their body weight at 91 to 93 kg and BMI at 34 to 35 kg/m² for several months | — | Canada | Clinical Investigation Unit of the Royal Victoria Hospital | — | — |
| C: placebo | — | — | ||||||
| Fernández‐Soto 1995 | I: fluoxetine 60 mg | 3 months | Obese women with mean age of 39 years and BMI 35 to 37 kg/m² | — | Spain | Endocrine and Metabolic Unit. Department of Internal Medicine, University Hospital, Granada | — | — |
| C: placebo | — | — | ||||||
| Lawton 1995 | I: fluoxetine 60 mg | 2 weeks | Women with mean age of 32 years, BMI > 30 kg/m² and intention to diet or to restrict food intake | — | United Kingdom | Obesity Clinic of the General Infirmary, Leeds | — | — |
| C: placebo | — | — | ||||||
| Goldstein 1994 | I: fluoxetine 60 mg | 52 weeks | Either sex, at least 18 years old with BMI > 25 kg/m² | — | USA | Multi‐centre (10 sites) | White | — |
| C: placebo | White | — | ||||||
| Goldstein 1993 | I1: fluoxetine 60 mg | 40 weeks | Either sex, older than 18 years, BMI 30 to 39 kg/m² and not using an appetite suppressant within 2 weeks before trial | — | USA | — | White | — |
| I2: fluoxetine 20 mg | ||||||||
| C: placebo | White | — | ||||||
| Pedrinola 1993 | I: fluoxetine 40 mg | 12 weeks | Obese participants (> 80 kg) of either sex, between 20 and 50 years old with BMI 33 to 36 kg/m² | — | Brazil | Outpatient Endocrinology Clinic of the Clinical Hospital of the University of Sao Paulo | — | — |
| C: placebo | — | — | ||||||
| Visser 1993 | I: fluoxetine 60 mg | 12 weeks | Obese men (87 to 90 kg) between 38 and 43 years old with stable body weight for the last 2 months of trial | — | The Netherlands | University Hospital Utrecht | — | — |
| C: placebo | — | — | ||||||
| Wurtman 1993 | I1: dexfenfluramine | 12 weeks | Women between 39 and 42 years old, weight 85 to 91 kg with BMI 32 to 34 kg/m² | — | USA | Massachusetts Institute of Technology, Clinical Research Center, Cambridge MA | — | — |
| I2: fluoxetine 20 mg | ||||||||
| C: placebo | — | — | ||||||
| Kopelman 1992 | I: fluoxetine 60 mg | 3 days | Either sex, extremely obese (mean weight 131 kg) between 25 and 53 years old with normal thyroid function | — | United Kingdom | Royal London Hospital Obesity Clinic | — | — |
| C: placebo | — | — | ||||||
| Stinson 1992 | I: fluoxetine 60 mg | 2 weeks | Healthy men and women < 65 years old, weight 97 kg to 99 kg, mean BMI 36.7 kg/m² without history of depression | — | Ireland | Departament of Metabolic Medicine, Adelaide Hospital, Dublin | — | — |
| C: placebo | — | — | ||||||
| Bagiella 1991 | I1: fenfluramine | 12 weeks | Men and women between 16 and 57 years old with BMI 30 to 40 kg/m² | — | Italy | Istituto di Terapia Medica Sistematica Univeristà "La Sapienza" | — | — |
| I2: 5‐hydroxy‐tryptophan | ||||||||
| I3: d‐fenfluramine | ||||||||
| I4: fluoxetine 20 mg | ||||||||
| I5: fluvoxamine | ||||||||
| C: placebo | — | — | ||||||
| Pijl 1991 | I: fluoxetine 60 mg | 6 weeks | Women between 37 to 39 years old with BMI > 30 kg/m² | — | The Netherlands | Clinic of Internal Medicine for Obesity, University Hospital, Leiden | — | — |
| C: placebo | — | — | ||||||
| Levine 1989 | I1: fluoxetine 10 mg | 8 weeks | Nondepressed participants weighing 20% to 100% in excess of ideal body weight, either sex, 18 to 65 years old and not pregnant or lactating | — | USA | — | White | — |
| I2: fluoxetine 20 mg | ||||||||
| I3: fluoxetine 40 mg | ||||||||
| I4: fluoxetine 60 mg | ||||||||
| C: placebo | White | — | ||||||
| Levine 1987 | I: fluoxetine 60 mg | 11 days | Nondepressed participants of either sex, between 18 and 65 years old and mean weight 93 kg who had not taken an appetite suppressant within 2 weeks before trial | — | USA | — | White | — |
| C: placebo | White | — | ||||||
| — denotes not reported BMI: body mass index; C: comparator; I: intervention; SD: standard deviation. | ||||||||
Appendix 7. Baseline characteristics (II)
| Trial ID | Intervention(s) and comparator(s) | Sex (female %) | Age (mean/range years (SD), or as reported) | BMI (mean kg/m² (SD)) | Comedications/Cointerventions (% of participants) | Comorbidities (% of participants) |
| Al‐Helli 2015 | I1: fluoxetine 20 mg | — | 18 to 40 | ≥ 30 | — | — |
| I2: omega‐3 gel | ||||||
| I3: fluoxetine 20 mg + omega‐3 gel | ||||||
| C: placebo | ||||||
| Suplicy 2014 | I1: diethylpropion | 100 | 36.1 (33.1 to 39.0) | 34.6 (33.6 to 35.6) | Balanced hypocaloric diet and encouraged to maintain at least 150 min per week of moderate physical activity | — |
| I2: fenproporex | 35.6 (33.1 to 38.1) | 34.0 (33.1 to 34.8) | ||||
| I3: mazindol | 37.0 (34.5 to 39.6) | 34.8 (33.8 to 35.9) | ||||
| I4: fluoxetine 20 mg | 38.5 (35.7 to 41.2) | 34.7 (33.8 to 35.6) | ||||
| I5: sibutramine | 35.4 (32.8 to 38.0) | 34.9 (33.8 to 35.9) | ||||
| C: placebo | 100 | 37.1 (34.4 to 39.8) | 34.9 (33.9 to 35.9) | |||
| Guimaraes 2006 | I1: sibutramine | 88.5 | 30.2 (—) | 32.0 (2.4) | Dietary reeducation containing on average 1500 kcal/d | — |
| I2: metformin | 38.9 (—) | 37.2 (5.8) | ||||
| I3: fluoxetine 60 mg | 30.9 (—) | 36.1 (3.2) | ||||
| C: placebo | 31.4 (—) | 32.2 (3.2) | ||||
| Bondi 2000 | I1: fluoxetine 40 mg | 100 | 51.4 (2.6) | 42.8 (1.9) | Diet (55% carbohydrates, 20% protein, 25% fat), caloric deficit of 500 kcal/d of 70% energy expenditure by indirect calorimetry | — |
| I2: fluoxetine 60 mg | 48.2 (5.2) | 38.8 (2.9) | ||||
| C: placebo | 100 | 47.8 (3.6) | 39.7 (2.4) | |||
| Huang 1998 | I: fluoxetine 60 mg | 54 | 41.2 (10.9) | 33.5 (4.2) | Participants were instructed to follow a weight‐reducing low calorie diet ([25‐35 kcal/d adjusted to work load * ideal body weight ‐ 500 kcal]. The energy distribution of the diet consisted of 50% carbohydrates, 20% protein and 30% fat. |
— |
| C: no treatment | 41 | 44.5 (13.6) | 32.6 (3.9) | |||
| Bross 1995 | I: fluoxetine 60 mg | 100 | 32.0 (3.2) | 34.0 (1.3) | Formula diet (420 kcal including 70 g protein/d and ≥ 100% RDA vitamins and minerals). Treatment duration: 3 weeks | — |
| C: placebo | 100 | 33.0 (3.9) | 34.1 (1.3) | |||
| Fernández‐Soto 1995 | I: fluoxetine 60 mg | 100 | 39.0 (16) | 35.1 (6.0) | Diet 1200 kcal maintained throughout the trial; 2 to 3 L/d, no caloric liquids, vitamins, minerals and trace elements FDA requirements; psychotherapy | — |
| C: placebo | 100 | 39.0 (16) | 36.8 (4.6) | |||
| Lawton 1995 | I: fluoxetine 60 mg | 100 | 32.8 (—) | 39.9 (—) | Diet: each treatment phase incorporated 2 separate test days on which the participants response to either a high‐carbohydrate or a high‐fat meal was assessed (days 7 and 14) | — |
| C: placebo | 100 | 32.8 (—) | 39.9 (—) | |||
| Goldstein 1994 | I: fluoxetine 60 mg | 81 | 43 (12) | 36.2 (6.5) | Diet with caloric intake designed to produce a weight loss of 0.45 kg per week | — |
| C: placebo | 79 | 43 (12) | 35.8 (6.7) | |||
| Goldstein 1993 | I1: fluoxetine 60 mg | 87 | 44.9 (10.9) | 31.6 (3.0) | Advised to reduce overall caloric consumption and offered a diet to lose 0.45 kg per week | — |
| I2: fluoxetine 20 mg | 78 | 43.4 (10.3) | 31.8 (3.1) | |||
| C: placebo | 73 | 42.6 (11.9) | 31.9 (2.9) | |||
| Pedrinola 1993 | I: fluoxetine 40 mg | — | 20 to 50 | 35.1 (5.1) | Counselled by a dietician to follow a standard 1000 kcal diet | — |
| C: placebo | 33.6 (4.0) | |||||
| Visser 1993 | I: fluoxetine 60 mg | 0 | 42.6 (5.6) | 27.9 (1.0) | Received dietary advice on healthy nutrition and means to lose weight | — |
| C: placebo | 0 | 38.8 (7.7) | 27.9 (1.3) | |||
| Wurtman 1993 | I1: dexfenfluramine | 100 | 41.2 (1.7) | 32.0 (0.5) | — | Seasonal affective disorders |
| I2: fluoxetine 20 mg | 41.0 (1.9) | 33.1 (0.6) | ||||
| C: placebo | 100 | 39.5 (1.7) | 32.8 (0.5) | |||
| Kopelman 1992 | I: fluoxetine 60 mg | 9 | Men: 40 (25 to 53) Women: 47 (—) |
44 (6) | — | — |
| C: placebo | ||||||
| Stinson 1992 | I: fluoxetine 60 mg | 61.7 | < 65 | 36.7 (0.8) | — | — |
| C: placebo | ||||||
| Bagiella 1991 | I1: fenfluramine | — | 16 to 57 | 30 to 40 | — | — |
| I2: 5‐hydroxy‐tryptophan | ||||||
| I3: d‐fenfluramine | ||||||
| I4: fluoxetine 20 mg | ||||||
| I5: fluvoxamine | ||||||
| C: placebo | ||||||
| Pijl 1991 | I: fluoxetine 60 mg | 100 | 38.1 (2.9) | 35.2 (0.8) | — | — |
| C: placebo | 100 | 37.3 (2.7) | 36.4 (1.3) | |||
| Levine 1989 | I1: fluoxetine 10 mg | 85 | 40 (11) | ≥ 25 | — | — |
| I2: fluoxetine 20 mg | 85 | 41 (11) | ||||
| I3: fluoxetine 40 mg | 85 | 39 (10) | ||||
| I4: fluoxetine 60 mg | 80 | 39 (10) | ||||
| C: placebo | 81 | 39 (10) | ≥ 25 | |||
| Levine 1987 | I: fluoxetine 60 mg | 88 | 43 (12) | ≥ 25 | Advised to reduce overall calorie consumption by 20% | — |
| C: placebo | 88 | 46 (11) | ≥ 25 | |||
| — denotes not reported BMI: body mass index; C: comparator; FDA: Food and Drug Administration; I: intervention; RDA: recommended dietary allowances; SD: standard deviation. | ||||||
Appendix 8. Matrix of trial endpoints (publications and trial documents)
| Trial ID | Endpoints quoted in trial document(s) (ClinicalTrials.gov, FDA/EMA document, manufacturer's website, published design paper)a | Endpoints quoted in publication(s)b,c | Endpoints quoted in abstract of publication(s)b,c |
| Al‐Helli 2015 | Source: NT | Primary outcome measure(s): — | Primary outcome measure(s): — |
| Secondary outcome measure(s): — | Secondary outcome measure(s): — | ||
| Other outcome measure(s): BMI, serum lipids: total cholesterol, low‐density‐lipoprotein cholesterol, high‐density‐lipoprotein cholesterol, triglycerides, fasting blood glucose, malondialdehyde, leptin | Other outcome measure(s): BMI, fasting blood glucose, lipid profile, liver enzymes, malondialdehyde, leptin | ||
| Suplicy 2014 | Source: NT | Primary outcome measure(s): "Efficacy was evaluated by the differences in weight loss promoted by medications and placebo and the proportion of patients in each arm who experienced a reduction in the baseline body weight of at least 5% or 10% after 52 wks" | Primary outcome measure(s): changes in body weight, % of women who achieved at least 5% weight loss by week 52 in the intent‐to‐treat population |
| Secondary outcome measure(s): changes from the baseline values in anthropometric measures (waist circumference, BMI) | Secondary outcome measure(s): — | ||
| Other outcome measure(s): safety was evaluated by reports of adverse events in the follow‐up visits, with an emphasis on serious events and events that led to the patient’s discontinuation. Key secondary safety endpoints included changes from the baseline in measures of blood pressure, heart rate, serum lipids (total cholesterol, low‐density lipoprotein cholesterol, high‐density lipoprotein cholesterol and triglycerides, glycaemic variables (fasting glucose, fasting insulin, glycated haemoglobin and the HOMA assessment of insulin resistance) and quality of life | Other outcome measure(s): anthropometry, safety, metabolic and cardiovascular parameters | ||
| Guimaraes 2006 | Source: NT | Primary outcome measure(s): — | Primary outcome measure(s): — |
| Secondary outcome measure(s): — | Secondary outcome measure(s): — | ||
| Other outcome measure(s): BMI, weight, abdominal circumference, % fatty tissue, HDL‐cholesterol, triglycerides, systolic and diastolic BP, adverse events, HOMA, insulin, glycaemia | Other outcome measure(s): BMI, weight, abdominal circumference, % fatty tissue, HDL‐cholesterol, triglycerides, systolic and diastolic BP, adverse events | ||
| Bondi 2000 | Source: NT | Primary outcome measure(s): — | Primary outcome measure(s): — |
| Secondary outcome measure(s): — | Secondary outcome measure(s): — | ||
| Other outcome measure(s): compliance by pill count, resting respiratory quotient, resting energy expenditure, fasting blood glucose, plasma insulin | Other outcome measure(s): resting and glucose‐induced thermogenesis | ||
| Huang 1998 | Source: NT | Primary outcome measure(s): — | Primary outcome measure(s): — |
| Secondary outcome measure(s): — | Secondary outcome measure(s): — | ||
| Other outcome measure(s): body weight, BMI, BP, fasting blood sugar, triglycerides, total cholesterol, uric acid, glutamic pyruvic transaminase (GPT), alkaline phosphatase (AP), adverse events | Other outcome measure(s): mean total body weight reduction, adverse events | ||
| Bross 1995 | Source: NT | Primary outcome measure: — | Primary outcome measure(s): — |
| Secondary outcome measure(s): — | Secondary outcome measure(s): — | ||
| Other outcome measure(s): body weight, resting energy expenditure, oxygen consumption, carbon dioxide production, thermic effect, urinary norepinephrine excretion, normetanephrine excretion, serum triiodothyronine and thyroxine, nitrogen balance, urinary sodium and potassium, basal body temperature, adverse events | Other outcome measure(s): weight loss, resting energy expenditure, basal body temperature, urinary norepinephrine excretion, normetanephrine excretion, serum triiodothyronine | ||
| Fernández‐Soto 1995 | Source: NT | Primary outcome measure(s): — | Primary outcome measure(s): — |
| Secondary outcome measure(s): — | Secondary outcome measure(s): — | ||
| Other outcome measure(s): weight, pulse, count of unused medication, patients' report of medical problems, adverse events, glucose, urea, uric acid, creatinine, ions, total cholesterol, triglycerides, HDL‐cholesterol | Other outcome measure(s): weight loss | ||
| Lawton 1995 | Source: NT | Primary outcome measure(s): — | Primary outcome measure(s): — |
| Secondary outcome measure(s): — | Secondary outcome measure(s): — | ||
| Other outcome measure(s): satiety, weight loss, adverse events, appetite, energy intake, macronutrient intake, motivational ratings (hunger), food intake preferences, post‐lunch meal palatability rating, blood and urine analyses, check of concomitant medication, resting pulse, BP | Other outcome measure(s): satiety, weight loss, appetite, energy intake, macronutrient intake, | ||
| Goldstein 1994 | Source: NT | Primary outcome measure(s): — | Primary outcome measure(s): — |
| Secondary outcome measure(s): — | Secondary outcome measure(s): — | ||
| Other outcome measure(s): weight loss, weight change, adverse events, BP (sitting), heart rate, oral temperature, blood chemistry, haematology and urinalysis, compliance (capsule record cards) | Other outcome measure(s): weight loss, adverse events | ||
| Goldstein 1993 | Source: NT | Primary outcome measure(s): weight | Primary outcome measure(s): — |
| Secondary outcome measure(s): — | Secondary outcome measure(s): — | ||
| Other outcome measure(s): BP (sitting), pulse rate, oral temperature, carbohydrate craving scores, adverse events, urinalysis and blood chemistry, haematology | Other outcome measure(s): weight loss, adverse events, discontinuation due to adverse events | ||
| Pedrinola 1993 | Source: NT | Primary outcome measure(s): — | Primary outcome measure(s): — |
| Secondary outcome measure(s): — | Secondary outcome measure(s): | ||
| Other outcome measure(s): weight loss, BMI, adverse events, cholesterol, triglycerides | Other outcome measure(s): weight loss, BMI, adverse events, cholesterol, triglycerides | ||
| Visser 1993 | Source: NT | Primary outcome measure(s): — | Primary outcome measure(s): — |
| Secondary outcome measure(s): — | Secondary outcome measure(s): — | ||
| Other outcome measure(s): body weight, body composition, anthropometry (waist‐hip ratio), abdominal fat areas, adverse events and illnesses, count of returned capsules | Other outcome measure(s): weight loss, body composition, abdominal fat | ||
| Wurtman 1993 | Source: NT | Primary outcome measure(s): — | Primary outcome measure(s): — |
| Secondary outcome measure(s): — | Secondary outcome measure(s): — | ||
| Other outcome measure(s): weight, carbohydrate intake, adverse events, glucose, triglycerides, urinalysis, thyroid profile, complete blood count, biochemical parameters, Hamilton Depression Rating Scale (HDRS), the self‐administered ProfIle of Mood States (POMS), the Center for Epidemiological Studies‐Depression (CESD) test, Stanford Sleepiness Scale (SSS) and the Menstrual Symptomatology Questionnaire (MSQ), drug levels | Other outcome measure(s): weight loss, carbohydrate intake, discontinuation due to adverse effects, withdrawals | ||
| Kopelman 1992 | Source: NT | Primary outcome measure(s): — | Primary outcome measure(s): — |
| Secondary outcome measure(s): — | Secondary outcome measure(s): — | ||
| Other outcome measure(s): sleep‐breathing patterns, weight loss, BMI, adverse events, BP, haematology, nocturnal arterial oxygen saturation, apnoea/hypopnoea index, total sleep time, qualitative assessment of sleep | Other outcome measure(s): nocturnal arterial oxygen saturation, apnoea/hypopnoea index, total sleep time, qualitative assessment of sleep | ||
| Stinson 1992 | Source: NT | Primary outcome measure(s): — | Primary outcome measure(s): — |
| Secondary outcome measure(s): — | Secondary outcome measure(s): — | ||
| Other outcome measure(s): resting metabolic rate, diet‐induced thermogenesis, weight reduction, BP, serum urea and creatinine levels, hematocrit | Other outcome measure(s): resting metabolic rate, diet‐induced thermogenesis, weight reduction | ||
| Bagiella 1991 | Source: NT | Primary outcome measure(s): — | Primary outcome measure(s): — |
| Secondary outcome measure(s): — | Secondary outcome measure(s): — | ||
| Other outcome measure(s): questionnaire, divided into 4 sections, intended to evaluate the cognitive and critical, behavioral, and cognitive aspects of the patient's dietary habits | Other outcome measure(s): questionnaire, divided into 4 sections, intended to evaluate the cognitive and critical, behavioral, and cognitive aspects of the patient's dietary habits | ||
| Pijl 1991 | Source: NT | Primary outcome measure(s): — | Primary outcome measure(s): — |
| Secondary outcome measure(s): — | Secondary outcome measure(s): — | ||
| Other outcome measure(s): body weight, total caloric intake, macronutrient selection, adverse events, spontaneous food choice | Other outcome measure(s): weight loss, food intake, total caloric intake | ||
| Levine 1989 | Source: NT | Primary outcome measure(s): — | Primary outcome measure(s): — |
| Secondary outcome measure(s): — | Secondary outcome measure(s): — | ||
| Other outcome measure(s): weight loss, BMI, adverse events, BP, heart rate | Other outcome measure(s): weight loss, BMI, adverse events | ||
| Levine 1987 | Source: NT | Primary outcome measure(s): — | Primary outcome measure(s): — |
| Secondary outcome measure(s): — | Secondary outcome measure(s): — | ||
| Other outcome measure(s): weight loss (kg), anthropometric measurements other than weight loss in kilograms (BMI), adverse events, morbidity (blood pressure, heart rate, changes in the electrocardiogram) | Other outcome measure(s): weight loss (kg), adverse events | ||
| — denotes not reported a Trial document(s) refers to all available information from published design papers and sources other than regular publications (e.g. FDA/EMA documents, manufacturer's websites, trial registers) b Publication(s) refers to trial information published in scientific journals (primary reference, duplicate publications, companion documents or multiple reports of a primary trial) c Other outcome measures refer to all outcomes not specified as primary or secondary outcome measures BP: blood pressure; EMA: European Medicines Agency; FDA: Food and Drug Administration (US); HDL: high‐density lipoprotein; NT: no trial document available; BMI: body mass index; HOMA: homeostatic model assessment of insulin resistance. | |||
Appendix 9. High risk of outcome reporting bias according to Outcome Reporting Bias In Trials (ORBIT) classification
| Trial ID | Outcome | High risk of bias (category A)a | High risk of bias (category D)b | High risk of bias (category E)c | High risk of bias (category G)d |
| Al‐Helli 2015 | Anthropometric measurements other than weight loss in kilograms | Yes | No | No | No |
| Suplicy 2014 | Health‐related quality of life | No | Yes | No | No |
| Guimaraes 2006 | Adverse events | No | Yes | No | No |
| Goldstein 1994 | Anthropometric measurements other than weight loss in kilograms | Yes | No | No | No |
| Goldstein 1993 | Weight loss (kg) | No | Yes | No | No |
| Pedrinola 1993 | Adverse events | Yes | No | No | No |
| Kopelman 1992 | Adverse events | Yes | No | No | No |
| Levine 1989 | Weight loss (kg) | No | Yes | No | No |
| Levine 1987 | Anthropometric measurements other than weight loss in kilograms | No | No | Yes | No |
| aClear that outcome was measured and analysed; trial report states that outcome was analysed but reports only that result was not significant (Classification 'A', table 2, Kirkham 2010) bClear that outcome was measured and analysed; trial report states that outcome was analysed but reports no results (Classification 'D', table 2, Kirkham 2010) cClear that outcome was measured but was not necessarily analysed; judgement says likely to have been analysed but not reported because of non‐significant results (Classification 'E', table 2, Kirkham 2010) dUnclear whether outcome was measured; not mentioned, but clinical judgement says likely to have been measured and analysed but not reported on the basis of non‐significant results (Classification 'G', table 2, Kirkham 2010) | |||||
Appendix 10. Definition of endpoint measurementa
| Trial ID | Weight (kg) | Health‐related quality of life | Patient satisfaction | Anthropometric measurements other than weight loss | Socioeconomic effects | Severe/serious adverse events | Cardiovascular parameters | Metabolic parameters |
| Al‐Helli 2015 | NR | NR | NR | ND | NR | NR | NR | ND |
| Suplicy 2014 | ND | Assessed by Short‐Form Health Survey (SF‐36), a general health questionnaire and the Impact of Weight on Quality of Life (IWQOL‐LITE) with higher scores indicating a better quality of life (IO) | NR | ND | NR | Assessed by reports of adverse events in the follow‐up visits (SO) | Measured with electrocardiogram and transthoracic echocardiography, with the participant in the left lateral decubitus position, using Sonos 5500, Hewlett‐Packard with an electronic multifrequential transducer of 2 to 4 MHz (IO) | ND |
| Guimaraes 2006 | Assessed by Filizola anthropometric scale while participant is wearing only a hospital gown (IO) | NR | NR |
Height: measured with Filizola anthropometric scale BMI: Ratio of weight (kg) to height (m) squared Abdominal circumference: measured half way between the last rib and the iliac crest in the position of inspiration using a measuring tape % Fatty tissue: assessed by bioelectric impedance using a model 101‐A RJL Prizum apparatus with electrodes (IO) |
NR | Assessed by reports of adverse events at follow‐up visits (SO) | Blood pressure: measured with an Oxigel sphygmomanometer, always at the same time of the day (IO) | ND |
| Bondi 2000 | ND | NR | NR | NR | NR | NR | Oxygen concentration: measured by a paramagnetic differential oxygen sensor and expired carbon dioxide concentration continuously with an infrared sensor (IO) |
Resting energy expenditure: measured by indirect calorimetry (Datex Instrumentarium) with a constant flow rate of 40 L/min through a transparent canopy over the participant´s head to the Deltatrac metabolic monitor (IO) Plasma glucose: measured by glucose oxidase colorimetric method (Glucofix, by Menarini Diagnostics) (AO) Serum insulin: measured in duplicate by immunoradiometric assays (Sorin Biomedica) (IO) |
| Huang 1998 | ND | NR | NR |
Ideal body weight: calculated by Huang´s formula:
body height (cm) — 80 * 0.7 in men body height (cm) — 70 * 0.6 in women (IO) |
NR | Assessed by self‐reported by direct questionnaire recorded at each visit (SO) | ND | ND |
| Bross 1995 | Assessed each morning with the participants wearing light bedclothes, after voiding and before breakfast, with a high‐precision digital platform scale (Scale‐Tronix)(IO) | NR | NR | NR | NR | NR | ND |
Resting energy expenditure: measured by ventilated‐hood indirect calorimetry (Deltatrac; SensorMedics) (IO) Thermic effect: measured by subtracting the contribution due to resting energy expenditure from total energy expenditure (IO) Serum thyroxine and triiodothyronine: measured by automated radioimmunoassay (ARIA II; Becton Dickinson Immunodiagnostics) Urine samples: collected in serial 24‐h aliquots in bottles containing 15 mL of 12 mol HCl/L, then analysed daily for (IO) Creatinine, sodium and potassium (Beckman Syncron CX4 and CX5 Systems) (IO) Norepinephrine and normetanephrine: measured by an automated HLPC system (Bio Rad, Richmond) Urine total nitrogen: determined by colorimetrically after Kjeldahl digestion by Technicon Autoanalyzer II (Chauncey) (IO) Nitrogen balance: calculated as nitrogen intake minus the sum of urinary and estimated fecal (0.6 g/d) and losses (8 mg * kg‐1 * d‐1) (IO) |
| Fernández‐Soto 1995 | ND | NR | NR | NR | NR | Assessed by participants' report of medical problems since their last visit (SO) | ND | ND |
| Lawton 1995 | ND | NR | NR | NR | NR | Assessed by reports of adverse events at follow‐up visits (SO) | ND | NR |
| Goldstein 1994 | ND | NR | NR | BMI: ratio of weight (kg) to height (m) squared (IO) | NR | Assessed by treatment‐emergent adverse event reports (SO) | ND | ND |
| Goldstein 1993 | ND | NR | NR | NR | NR | All adverse events were elicited by non‐probing inquiry (SO) | Measured by scalar electrocardiogram (IO) | ND |
| Pedrinola 1993 | ND | NR | NR | ND | NR | Assessed by treatment‐emergent adverse event reports (SO) | ND | Haematology and biochemical profile: assessed by automated methods in the University Hospital clinical laboratories (IO) |
| Visser 1993 | Measured with the participants wearing indoor clothing without shoes with a scale (Berkel ED‐60T) minus a correction of 1.2 kg for the clothes (IO) | NR | NR |
Height: measured to the nearest 1 mm by a microtoise (IO) Body composition: measured by hydro‐densitometry; participants were weighed underwater with simultaneous assessment of the residual lung volume by a helium dilution technique. Underwater weight was measured to the nearest 0.05 kg (Sartorius 3826PM 81) Body fat percentage: calculated from body density using Siri´s formula (IO) Body circumferences: measured to the nearest 1 mm with a plastic tape at the levels of the waist and hip with the participant standing (IO) Waist‐hip circumference ratio: calculated by dividing waist circumference by hip circumference (IO) Abdominal fat: assessed by magnetic resonance imaging with the participant in the supine position (GYROSCAN S15, Philips Medical Systems) with a 1.5 T magnetic field (64 MHz) by use of a body coil with a diameter of 56 cm. An inversion recovery sequence was used: inversion time 300 ms, repetition time 820 mg and echo time 20 ms (IO) |
NR | Assessed by reports of adverse events at follow‐up visits (SO) | NR | NR |
| Wurtman 1993 | ND | NR | Assessed by log book (SO) | NR | NR | Monitored by recording spontaneous descriptions of mood and physical status during the previous week (SO) | Assessed by electrocardiogram (IO) | ND |
| Kopelman 1992 | ND | NR | NR | NR | NR | ND |
Arterial oxygen saturation: measured with an earlobe probe with a BIOX III pulse oximeter (Ohmeda Ltd) (IO) Electroencephalogram: Obtained with conventional surface electrodes with Nikon‐Kohden amplifiers Air flow: Measured at the nose and mouth with thermistors (Comark Ltd). (IO) |
Pulmonary function: assessed with a Wright peak flow meter and a Vitalograph dry spirometer (IO) Apnoea: Calculated from the number of recorded episodes divided by the length of rapid eye movements (IO) |
| Stinson 1992 | Participant was weighed wearing light summer clothing on the same weighing balance at the same time of day with the participant fasting and having micturated and defaecated before the recordings (IO) | NR | NR | NR | NR | NR | ND |
Metabolic rate: measured by indirect open circuit calorimetry with a transparent ventilated hood over the participant´s head. Air was drawn through at a rate of 100 L/min, and inspired and expired air were analysed by a Taylor Servomex OA 272 oxygen analyser (IO) Resting metabolic rate: recorded by estimating the resting oxygen consumption over a 30‐min period after consumption of a glucose load drink (1 g/kg body weight, dissolved in water and lemon juice) (IO) |
| Bagiella 1991 | NR | NR | NR | NR | NR | NR | ND | NR |
| Pijl 1991 | ND | NR | NR | NR | NR | Assessed by reports of adverse events at follow‐up visits (SO) | NR | ND |
| Levine 1989 | ND | NR | NR | ND | NR | At each visit, participants were questioned in a open‐ended manner about adverse events based on the 1200 FDA COSTART terms (SO) | Measured by 12‐lead scalar electrocardiogram (IO) | NR |
| Levine 1987 | ND | NR | NR | ND | NR | Elicited by non‐probing inquiry at each follow‐up visit (SO) | Measured by scalar electrocardiogram (IO) | NR |
|
aIn addition to definition of endpoint measurement, description who measured the outcome (AO: adjudicated outcome measurement; IO: investigator‐assessed outcome measurement; SO: self‐reported outcome measurement) BMI: body mass index; ND: not defined; NR: not reported. | ||||||||
Appendix 11. Adverse events (I)
| Trial ID | Intervention(s) and comparator(s) | Participants included in analysis (N) | Deaths (N) | Deaths (% of participants) | Participants with at least one adverse event (N) | Participants with at least one adverse event (%) | Participants with at least one severe/serious adverse event (N) | Participants with at least one severe/serious adverse event (%) |
| Al‐Helli 2015 | I1: fluoxetine 20 mg | 12 | — | — | — | — | — | — |
| I2: omega‐3 gel | 12 | |||||||
| I3: fluoxetine 20 mg + omega‐3 gel | 12 | |||||||
| C: placebo | 12 | |||||||
| Suplicy 2014 | I1: diethylpropion | 28 | — | — | 11 | 39.3 | 0 | 0 |
| I2: fenproporex | 29 | 15 | 51.7 | 0 | 0 | |||
| I3: mazindol | 29 | 16 | 55.2 | 0 | 0 | |||
| I4: fluoxetine 20 mg | 29 | 18 | 60 | 0 | 0 | |||
| I5: sibutramine | 30 | 11 | 35.5 | 0 | 0 | |||
| C: placebo | 29 | 8 | 27.5 | 0 | 0 | |||
| Guimaraes 2006 | I1: sibutramine | 8 | — | — | 6 | 79.2 | 0 | 0 |
| I2: metformin | 8 | 4 | 45.6 | 0 | 0 | |||
| I3: fluoxetine 60 mg | 9 | 8 | 92.6 | 0 | 0 | |||
| C: placebo | 10 | 1 | 10 | 0 | 0 | |||
| Bondi 2000 | I1: fluoxetine 40 mg | 8 | — | — | — | — | — | — |
| I2: fluoxetine 60 mg | 12 | |||||||
| C: placebo | 12 | — | — | — | — | |||
| Huang 1998 | I: fluoxetine 60 mg | 28 | — | — | 26 | 92.8 | 0 | 0 |
| C: no treatment | 22 | 3 | 13.6 | 0 | 0 | |||
| Bross 1995 | I: fluoxetine 60 mg | I: 10 | 0 | 0 | 0 | 0 | 0 | 0 |
| C: placebo | C: 10 | 0 | 0 | 0 | 0 | |||
| Fernández‐Soto 1995 | I: fluoxetine 60 mg | 18 | — | — | 4 | 22.2 | — | — |
| C: placebo | 15 | 4 | 26.6 | — | — | |||
| Lawton 1995 | I: fluoxetine 60 mg | 12 | — | — | 9 | 75 | 0 | 0 |
| C: placebo | 12 | 6 | 50 | 0 | 0 | |||
| Goldstein 1994 | I: fluoxetine 60 mg | 230 | — | — | 200 | 86.9 | 0 | 0 |
| C: placebo | 228 | 194 | 85.1 | 0 | 0 | |||
| Goldstein 1993 | I1: fluoxetine 60 mg | 106 | — | — | 19 | 17.9 | 0 | 0 |
| I2: fluoxetine 20 mg | 104 | 16 | 15.4 | |||||
| C: placebo | 107 | 20 | 18.7 | 0 | 0 | |||
| Pedrinola 1993 | I: fluoxetine 40 mg | 10 | — | — | — | — | 0 | 0 |
| C: placebo | 8 | |||||||
| Visser 1993 | I: fluoxetine 60 mg | 18 | — | — | 7 | 38.8 | 0 | 0 |
| C: placebo | 20 | 2 | 10 | 0 | 0 | |||
| Wurtman 1993 | I1: dexfenfluramine | 28 | — | — | 23 | 82.1 | 0 | 0 |
| I2: fluoxetine 20 mg | 30 | 27 | 90 | |||||
| C: placebo | 29 | 24 | 82.7 | 0 | 0 | |||
| Kopelman 1992 | I: fluoxetine 60 mg | 11 | 0 | 0 | 0 | 0 | 0 | 0 |
| C: placebo | 11 | |||||||
| Stinson 1992 | I: fluoxetine 60 mg | 13 | — | — | — | — | — | — |
| C: placebo | 17 | |||||||
| Bagiella 1991 | I1: fenfluramine | 60 | — | — | — | — | — | — |
| I2: 5‐hydroxy‐tryptophan | ||||||||
| I3: d‐fenfluramine | ||||||||
| I4: fluoxetine 20 mg | ||||||||
| I5: fluvoxamine | ||||||||
| C: placebo | ||||||||
| Pijl 1991 | I: fluoxetine 60 mg | 11 | — | — | 4 | 36.4 | 0 | 0 |
| C: placebo | 12 | 2 | 16.7 | 0 | 0 | |||
| Levine 1989 | I1: fluoxetine 10 mg | 131 | — | — | 90 | 68.7 | 0 | 0 |
| I2: fluoxetine 20 mg | 131 | 100 | 76.3 | |||||
| I3: fluoxetine 40 mg | 131 | 101 | 77.1 | |||||
| I4: fluoxetine 60 mg | 131 | 101 | 77.1 | |||||
| C: placebo | 131 | 94 | 71.7 | 0 | 0 | |||
| Levine 1987 | I: fluoxetine 60 mg | 60 | — | — | 15 | 25 | 0 | 0 |
| C: placebo | 60 | 7 | 11.6 | 0 | 0 | |||
| — denotes not reported C: comparator; I: intervention. | ||||||||
Appendix 12. Adverse events (II)
| Trial ID | Intervention(s) and comparator(s) | Participants included in analysis (N) | Participants discontinuing trial due to an adverse event (N) | Participants discontinuing trial due to an adverse event (%) | Participants with at least one hospitalisation (N) | Participants with at least one hospitalisation (%) | Participants with at least one outpatient treatment (N) | Participants with at least one outpatient treatment (%) |
| Al‐Helli 2015 | I1: fluoxetine 20 mg | 12 | — | — | — | — | — | — |
| I2: omega‐3 gel | 12 | |||||||
| I3: fluoxetine 20 mg + omega‐3 gel | 12 | |||||||
| C: placebo | 12 | |||||||
| Suplicy 2014 | I1: diethylpropion | 28 | 2 | 7.1 | — | — | — | — |
| I2: fenproporex | 29 | 2 | 6.8 | |||||
| I3: mazindol | 29 | 1 | 3.4 | |||||
| I4: fluoxetine 20 mg | 29 | 3 | 10.3 | |||||
| I5: sibutramine | 30 | 2 | 6.6 | |||||
| C: placebo | 29 | 3 | 10.3 | |||||
| Guimaraes 2006 | I1: sibutramine | 8 | 0 | 0 | — | — | — | — |
| I2: metformin | 8 | |||||||
| I3: fluoxetine 60 mg | 9 | |||||||
| C: placebo | 10 | 0 | 0 | |||||
| Bondi 2000 | I1: fluoxetine 40 mg | 8 | — | — | — | — | — | — |
| I2: fluoxetine 60 mg | 12 | |||||||
| C: placebo | 12 | |||||||
| Huang 1998 | I: fluoxetine 60 mg | 28 | 1 | 3.5 | — | — | 1 | 3.5 |
| C: no treatment | 22 | 0 | 0 | 0 | 0 | |||
| Bross 1995 | I: fluoxetine 60 mg | 10 | — | — | — | — | — | — |
| C: placebo | 10 | |||||||
| Fernández‐Soto 1995 | I: fluoxetine 60 mg | 18 | — | — | — | — | — | — |
| C: placebo | 15 | |||||||
| Lawton 1995 | I: fluoxetine 60 mg | 12 | — | — | 2 | 8.3 | — | — |
| C: placebo | 12 | |||||||
| Goldstein 1994 | I: fluoxetine 60 mg | 230 | 41 | 17.8 | — | — | — | — |
| C: placebo | 228 | 19 | 8.3 | |||||
| Goldstein 1993 | I1: fluoxetine 60 mg | 106 | 14 | 13.2 | — | — | — | — |
| I2: fluoxetine 20 mg | 104 | 2 | 1.9 | |||||
| C: placebo | 107 | 6 | 5.6 | |||||
| Pedrinola 1993 | I: fluoxetine 40 mg | 10 | 0 | 0 | — | — | — | — |
| C: placebo | 8 | 0 | 0 | |||||
| Visser 1993 | I: fluoxetine 60 mg | 18 | — | — | — | — | — | — |
| C: placebo | 20 | |||||||
| Wurtman 1993 | I1: dexfenfluramine | 21 | 1 | 4.7 | — | — | — | — |
| I2: fluoxetine 20 mg | 18 | 7 | 38.8 | |||||
| C: placebo | 25 | 2 | 8 | |||||
| Kopelman 1992 | I: fluoxetine 60 mg | 11 | — | — | — | — | — | — |
| C: placebo | 11 | |||||||
| Stinson 1992 | I: fluoxetine 60 mg | 13 | — | — | — | — | — | — |
| C: placebo | 17 | |||||||
| Bagiella 1991 | I1: fenfluramine | 60 | — | — | — | — | — | — |
| I2: 5‐hydroxy‐tryptophan | ||||||||
| I3: d‐fenfluramine | ||||||||
| I4: fluoxetine 20 mg | ||||||||
| I5: fluvoxamine | ||||||||
| C: placebo | ||||||||
| Pijl 1991 | I: fluoxetine 60 mg | 11 | — | — | — | — | — | — |
| C: placebo | 12 | |||||||
| Levine 1989 | I1: fluoxetine 10 mg | 131 | 10 | 7.6 | — | — | — | — |
| I2: fluoxetine 20 mg | 131 | 10 | 7.6 | |||||
| I3: fluoxetine 40 mg | 131 | 10 | 7.6 | |||||
| I4: fluoxetine 60 mg | 131 | 8 | 6.1 | |||||
| C: placebo | 131 | 11 | 8.3 | |||||
| Levine 1987 | I: fluoxetine 60 mg | 60 | 6 | 10 | — | — | — | — |
| C: placebo | 60 | 1 | 1.7 | |||||
| — denotes not reported C: comparator; I: intervention. | ||||||||
Appendix 13. Adverse events (III)
| Trial ID | Intervention(s) and comparator(s) | Participants included in analysis (N) | Participants with a specific adverse event (description) | Participants with at least one specific adverse events (N) | Participants with at least one specific adverse event (%) |
| Al‐Helli 2015 | I1: fluoxetine 20 mg | 12 | — | — | — |
| I2: omega‐3 gel | 12 | ||||
| I3: fluoxetine 20 mg + omega‐3 gel | 12 | ||||
| C: placebo | 12 | ||||
| Suplicy 2014 | I1: diethylpropion | 28 | (1) dry mouth (2) constipation (3) insomnia (4) anxiety (5) headache (6) irritability (7) nausea (8) somnolence (9) dizziness (10) tremor (11) palpitation | (1) 11 (2) 6 (3) 2 (4) 9 (5) 3 (6) 6 (7) 2 (8) 2 (9) 2 (10) 1 (11) 1 | (1) 39.3 (2) 21.4 (3) 7.1 (4) 32.1 (5) 10.7 (6) 28.6 (7) 7.1 (8) 7.1 (9) 7.1 (10) 3.6 (11) 3.6 |
| I2: fenproporex | 29 | (1) dry mouth (2) constipation (3) insomnia (4) anxiety (5) headache (6) irritability (7) nausea (8) somnolence (9) dizziness (10) tremor (11) diarrhoea (12) hair loss (13) fatigue | (1) 15 (2) 5 (3) 7 (4) 6 (5) 3 (6) 7 (7) 1 (8) 2 (9) 1 (10) 1 (11) 2 (12) 2 (13) 1 | (1) 51.7
(2) 17.2
(3) 24.1
(4) 20.7
(5) 10.3
(6) 33.3
(7) 3.4
(8) 6.9 (9) 3.4 (10) 3.4 (11) 6.9 (12) 6.9 (13) 3.4 |
|
| I3: mazindol | 29 | (1) dry mouth (2) constipation (3) insomnia (4) anxiety (5) headache (6) irritability (7) nausea (8) somnolence (9) dizziness (10) dyspepsia (11) malaise | (1) 16 (2) 7 (3) 7 (4) 1 (5) 4 (6) 4 (7) 6 (8) 1 (9) 3 (10) 3 (11) 2 | (1) 55.2 (2) 24.1 (3) 24.1 (4) 3.4 (5) 13.8 (6) 19.0 (7) 20.7 (8) 3.5 (9) 10.3 (10) 10.3 (11) 6.9 |
|
| I4: fluoxetine 20 mg | 29 | (1) dry mouth (2) constipation (3) insomnia (4) anxiety (5) headache (6) irritability (7) nausea (8) somnolence (9) dizziness (10) dyspepsia (11) malaise | (1) 18 (2) 3 (3) 7 (4) 1 (5) 5 (6) 3 (7) 2 (8) 2 (9) 1 (10) 2 (11) 1 | (1) 60 (2) 43.3 (3) 23.3 (4) 3.3 (5) 16.7 (6) 14.3 (7) 6.7 (8) 6.7 (9) 3.3 (10) 6.7 (11) 3.3 | |
| I5: sibutramine | 30 | (1) dry mouth (2) constipation (3) insomnia (4) anxiety (5) headache (6) nausea (7) somnolence (8) dizziness (9) diarrhoea (10) palpitation (11) polyuria (12) sweating (13) cramps (14) abdominal pain | (1) 11 (2) 4 (3) 7 (4) 4 (5) 4 (6) 7 (7) 7 (8) 5 (9) 1 (10) 1 (11) 2 (12) 1 (13) 1 (14) 1 | (1) 35.5 (2) 12.9 (3) 22.6 (4) 12.9 (5) 12.9 (6) 22.6 (7) 22.6 (8) 16.1 (9) 3.2 (10) 3.2 (11) 6.4 (12) 3.2 (13) 3.2 (14) 3.2 | |
| C: placebo | 29 | (1) dry mouth (2) constipation (3) insomnia (4) anxiety (5) headache (6) irritability (7) nausea (8) somnolence (9) dyspepsia (10) tremor (11) urticaria (12) edema | (1) 8 (2) 1 (3) 1 (4) 2 (5) 3 (6) 1 (7) 2 (8) 4 (9) 1 (10) 1 (11) 1 (12) 1 | (1) 27.5 (2) 3.4 (3) 3.4 (4) 6.8 (5) 10.3 (6) 3.4 (7) 6.8 (8) 13.7 (9) 3.4 (10) 3.4 (11) 3.4 (12) 3.4 | |
| Guimaraes 2006 | I1: sibutramine | 8 | (1) mouth dryness (2) sudoresis (3) constipation (4) insomnia (5) headache | (1) 6 (2) 4 (3) 3 (4) 2 (5) 1 | (1) 79.2 (2) 45.8 (3) 41.7 (4) 20.8 (5) 16.7 |
| I2: metformin | 8 | (1) mouth dryness (2) sudoresis (3) diarrhoea (4) vertigo (5) nausea | (1) 3 (2) 2 (3) 4 (4) 2 (5) 2 | (1) 37.5 (2) 29.2 (3) 45.8 (4) 29.2 (5) 20.8 | |
| I3: fluoxetine 60 mg | 9 | (1) insomnia (2) sleepiness (3) anorexia | (1) 3 (2) 3 (3) 8 | (1) 29.6 (2) 29.6 (3) 92.6 | |
| C: placebo | 10 | (1) anorexia (2) thirst (3) diarrhoea | (1) 1 (2) 1 (3) 1 | (1) 10 (2) 10 (3) 10 | |
| Bondi 2000 | I1: fluoxetine 40 mg | 8 | — | — | — |
| I2: fluoxetine 60 mg | 12 | ||||
| C: placebo | 12 | ||||
| Huang 1998 | I: fluoxetine 60 mg | 28 | (1) anorexia (2) nausea (3) malaise (4) diarrhoea (5) lethargy | (1) 26 (2) 8 (3) 5 (4) 4 (5) 4 | (1) 92.8 (2) 28.5 (3) 17.8 (4) 14.2 (5) 14.2 |
| C: no treatment | 22 | (1) anorexia (2) nausea (3) malaise (4) diarrhoea (5) lethargy | (1) 1 (2) 1 (3) 3 (4) 1 (5) 2 | (1) 4.5 (2) 4.5 (3) 13.6 (4) 4.5 (5) 9 | |
| Bross 1995 | I: fluoxetine 60 mg | 10 | — | — | — |
| C: placebo | 10 | ||||
| Fernández‐Soto 1995 | I: fluoxetine 60 mg | 18 | (1) cephalalgia (2) drowsiness (3) insomnia (4) fatigue (5) dryness of mouth | (1) 2 (2) 2 (3) 3 (4) 4 (5) 1 | (1) 11.1 (2) 11.1 (3) 16.6 (4) 22.2 (5) 11.1 |
| C: placebo | 15 | (1) cephalalgia (2) drowsiness (3) insomnia (4) fatigue (5) dryness of mouth | (1) 1 (2) 1 (3) 1 (4) 4 (5) 1 | (1) 6.6 (2) 6.6 (3) 6.6 (4) 26.6 (5) 6.6 | |
| Lawton 1995 | I: fluoxetine 60 mg | 12 | (1) nausea (2) dizziness (3) indigestion (4) heartburn (5) insomnia (6) migraine (7) headache (8) tiredness (9) drowsiness (10) lightheadedness (11) vomiting (12) breathlessness (13) flushes (14) constipation (15) osteomyelitis (16) cough (17) hay fever | (1) 6 (2) 1 (3) 1 (4) 1 (5) 2 (6) 1 (7) 2 (8) 4 (9) 1 (10) 2 (11) 1 (12) 1 (13) 1 (14) 1 (15) 1 (16) 1 (17) 1 | (1) 50 (2) 8.3 (3) 8.3 (4) 8.3 (5) 16.6 (6) 8.3 (7) 16.6 (8) 33.3 (9) 8.3 (10) 16.6 (11) 8.3 (12) 8.3 (13) 8.3 (14) 8.3 (15) 8.3 (16) 8.3 (17) 8.3 |
| C: placebo | 12 | (1) nausea
(2) diarrhoea
(3) stomach discomfort (4) sore throat (5) common cold (6) inflamed tendon (7) hay fever |
(1) 1 (2) 1 (3) 1 (4) 1 (5) 1 (6) 1 (7) 1 | (1) 8.3 (2) 8.3 (3) 8.3 (4) 8.3 (5) 8.3 (6) 8.3 (7) 8.3 | |
| Goldstein 1994 | I: fluoxetine 60 mg | 230 | (1) headache (2) rhinitis (3) asthenia (4) diarrhoea (5) nausea (6) sweating (7) insomnia (8) somnolence (9) bronchitis (10) nervousness (11) nausea and vomiting (12) tremor (13) amnesia (14) thirst | (1) 62 (2) 55 (3) 41 (4) 33 (5) 31 (6) 25 (7) 23 (8) 21 (9) 20 (10) 16 (11) 12 (12) 10 (13) 6 (14) 4 | (1) 26.9 (2) 23.9 (3) 17.8 (4) 14.3 (5) 13.5 (6) 10.9 (7) 10 (8) 9.1 (9) 8.7 (10) 7 (11) 5.2 (12) 4.3 (13) 2.6 (14) 1.7 |
| C: placebo | 228 | (1) headache (2) rhinitis (3) asthenia (4) diarrhoea (5) nausea (6) sweating (7) insomnia (8) somnolence (9) bronchitis (10) nervousness (11) nausea and vomiting (12) allergic reaction | (1) 50 (2) 52 (3) 18 (4) 19 (5) 14 (6) 2 (7) 11 (8) 7 (9) 4 (10) 5 (11) 4 (12) 5 | (1) 21.9 (2) 22.8 (3) 7.9 (4) 8.3 (5) 6.1 (6) 0.9 (7) 4.8 (8) 3.1 (9) 1.8 (10) 2.2 (11) 1.8 (12) 2.2 | |
| Goldstein 1993 | I1: fluoxetine 60 mg | 106 | (1) headache (2) rhinitis (3) asthenia (4) insomnia (5) diarrhoea (6) infection (7) pain (8) dizziness (9) increased appetite (10) pharyngitis (11) sinusitis (12) somnolence (13) anxiety (14) back pain | (1) 19 (2) 18 (3) 17 (4) 11 (5) 10 (6) 9 (7) 8 (8) 7 (9) 7 (10) 7 (11) 6 (12) 6 (13) 3 (14) 1 | (1) 17.9 (2) 17 (3) 16 (4) 10.2 (5) 9.4 (6) 8.5 (7) 7.5 (8) 6.6 (9) 6.6 (10) 6.6 (11) 5.7 (12) 5.7 (13) 2.8 (14) 0.9 |
| I2: fluoxetine 20 mg | 104 | (1) headache (2) rhinitis (3) asthenia (4) insomnia (5) diarrhoea (6) infection (7) pain (8) dizziness (9) increased appetite (10) pharyngitis (11) sinusitis (12) somnolence (13) anxiety (14) back pain | (1) 13 (2) 16 (3) 8 (4) 3 (5) 10 (6) 11 (7) 7 (8) 4 (9) 5 (10) 3 (11) 4 (12) 3 (13) 8 (14) 10 | (1) 12.5 (2) 15.4 (3) 7.7 (4) 2.9 (5) 9.6 (6) 10.6 (7) 6.7 (8) 3.8 (9) 4.8 (10) 2.9 (11) 3.8 (12) 2.9 (13) 7.7 (14) 9.6 | |
| C: placebo | 107 | (1) headache (2) rhinitis (3) asthenia (4) insomnia (5) diarrhoea (6) infection (7) pain (8) dizziness (9) increased appetite (10) pharyngitis (11) sinusitis (12) somnolence (13) anxiety (14) back pain | (1) 10 (2) 20 (3) 5 (4) 10 (5) 7 (6) 14 (7) 10 (8) 2 (9) 15 (10) 8 (11) 5 (12) 4 (13) 7 (14) 10 | (1) 9.3 (2) 18.7 (3) 4.7 (4) 9.3 (5) 6.5 (6) 13.1 (7) 9.3 (8) 1.9 (9) 14 (10) 7.5 (11) 4.7 (12) 3.7 (13) 6.5 (14) 9.3 | |
| Pedrinola 1993 | I: fluoxetine 40 mg | 10 | (1) headache (2) decreased libido (3) diarrhoea (4) dizziness | — | — |
| C: placebo | 8 | (1) headache (2) decreased libido (3) diarrhoea (4) dizziness | — | — | |
| Visser 1993 | I: fluoxetine 60 mg | 18 | (1) somnolence (2) dry mouth (3) decreased libido (4) tremor (5) nausea (6) sweating (7) intestinal discomfort (8) nervousness (9) dizziness | (1) 7 (2) 4 (3) 4 (4) 2 (5) 2 (6) 1 (7) 1 (8) 1 (9) 1 | (1) 38.8 (2) 22.2 (3) 22.2 (4) 11.1 (5) 11.1 (6) 5.5 (7) 5.5 (8) 5.5 (9) 5.5 |
| C: placebo | 20 | (1) intestinal discomfort (2) nervousness (3) dizziness | (1) 2 (2) 1 (3) 1 | (1) 10 (2) 5 (3) 5 | |
| Wurtman 1993 | I1: dexfenfluramine | 28 | (1) headache (2) fatigue (3) insomnia (4) drowsiness (5) anxiety (6) dry mouth (7) diarrhoea (8) nausea (9) upper gastrointestinal distress (10) constipation (11) polyuria (12) menstrual disturbances | (1) 21 (2) 14 (3) 6 (4) 4 (5) 3 (6) 25 (7) 10 (8) 1 (9) 4 (10) 3 (11) 3 (12) 7 | (1) 75 (2) 50 (3) 21.4 (4) 14.2 (5) 10.7 (6) 89.2 (7) 35.7 (8) 3.5 (9) 14.2 (10) 10.7 (11) 10.7 (12) 25 |
| I2: fluoxetine 20 mg | 30 | (1) headache (2) fatigue (3) insomnia (4) drowsiness (5) anxiety (6) dry mouth (7) diarrhoea (8) nausea (9) upper gastrointestinal distress (10) constipation (11) polyuria (12) menstrual disturbances | (1) 17 (2) 16 (3) 16 (4) 9 (5) 4 (6) 12 (7) 1 (8) 7 (9) 3 (10) 5 (11) 1 (12) 4 | (1) 62.9 (2) 59.2 (3) 59.2 (4) 33.3 (5) 14.8 (6) 44.4 (7) 3.7 (8) 25.9 (9) 11.1 (10) 18.5 (11) 3.7 (12) 14.8 | |
| C: placebo | 29 | (1) headache (2) fatigue (3) insomnia (4) drowsiness (5) anxiety (6) dry mouth (7) diarrhoea (8) nausea (9) upper gastrointestinal distress (10) constipation (11) polyuria | (1) 15 (2) 6 (3) 4 (4) 1 (5) 3 (6) 9 (7) 1 (8) 3 (9) 4 (10) 1 (11) 1 | (1) 51.7 (2) 20.6 (3) 13.7 (4) 3.4 (5) 10.3 (6) 31 (7) 3.4 (8) 10.3 (9) 13.7 (10) 3.4 (11) 3.4 | |
| Kopelman 1992 | I: fluoxetine 60 mg | 11 | — | — | — |
| C: placebo | 11 | ||||
| Stinson 1992 | I: fluoxetine 60 mg | 13 | — | — | — |
| C: placebo | 17 | ||||
| Bagiella 1991 | I1: fenfluramine | 60 | — | — | — |
| I2: 5‐hydroxy‐tryptophan | |||||
| I3: d‐fenfluramine | |||||
| I4: fluoxetine 20 mg | |||||
| I5: fluvoxamine | |||||
| C: placebo | |||||
| Pijl 1991 | I: fluoxetine 60 mg | 11 | (1) drowsiness (2) stomach discomfort (3) sweating (4) tremor (5) headache | (1) 4 (2) 4 (3) 3 (4) 3 (5) 2 | (1) 36.3 (2) 36.3 (3) 27.2 (4) 27.2 (5) 18.1 |
| C: placebo | 12 | (1) drowsiness (2) stomach discomfort (3) sweating (4) tremor (5) headache | (1) 1 (2) 1 (3) 2 (4) 1 (5) 1 | (1) 8.3 (2) 8.3 (3) 16.6 (4) 8.3 (5) 8.3 | |
| Levine 1989 | I1: fluoxetine 10 mg | 131 | (1) headache (2) nervousness (3) diarrhoea (4) nausea (5) asthenia (6) rhinitis (7) somnolence (8) dry mouth (9) insomnia (10) injection (11) anxiety (12) dyspepsia (13) dysmenorrhoea (14) sweating (15) abdominal pain (16) pain (17) dizziness (18) pharyngitis (19) rash (20) back pain (21) sinusitis (22) myalgia (23) flu syndrome (24) constipation (25) decreased libido | (1) 35 (2) 13 (3) 15 (4) 8 (5) 7 (6) 9 (7) 5 (8) 8 (9) 4 (10) 6 (11) 7 (12) 5 (13) 5 (14) 5 (15) 5 (16) 5 (17) 4 (18) 3 (19) 5 (20) 5 (21) 2 (22) 5 (23) 2 (24) 3 (25) 2 | (1) 26.7 (2) 9.9 (3) 11.4 (4) 6.1 (5) 5.3 (6) 6.8 (7) 3.8 (8) 6.1 (9) 3 (10) 4.5 (11) 5.3 (12) 3.8 (13) 3.8 (14) 3.8 (15) 3.8 (16) 3.8 (17) 3 (18) 2.2 (19) 3.8 (20) 3.8 (21) 1.5 (22) 3.8 (23) 1.5 (24) 2.2 (25) 1.5 |
| I2: fluoxetine 20 mg | 131 | (1) headache (2) nervousness (3) diarrhoea (4) nausea (5) asthenia (6) rhinitis (7) somnolence (8) dry mouth (9) insomnia (10) injection (11) anxiety (12) dyspepsia (13) dysmenorrhoea (14) sweating (15) abdominal pain (16) pain (17) dizziness (18) pharyngitis (19) rash (20) back pain (21) sinusitis (22) myalgia (23) flu syndrome (24) constipation (25) decreased libido (26) allergic reaction | (1) 37 (2) 15 (3) 17 (4) 15 (5) 6 (6) 15 (7) 8 (8) 9 (9) 5 (10) 6 (11) 5 (12) 8 (13) 6 (14) 5 (15) 6 (16) 5 (17) 2 (18) 5 (19) 5 (20) 5 (21) 3 (22) 3 (23) 4 (24) 3 (25) 5 (26) 8 | (1) 28.2 (2) 11.4 (3) 12.9 (4) 11.4 (5) 4.5 (6) 11.4 (7) 6.1 (8) 6.8 (9) 3.8 (10) 4.5 (11) 3.8 (12) 6.1 (13) 4.5 (14) 3.8 (15) 4.5 (16) 3.8 (17) 1.5 (18) 3.8 (19) 3.8 (20) 3.8 (21) 2.2 (22) 2.2 (23) 3 (24) 2.2 (25) 3.8 (26) 6.1 | |
| I3: fluoxetine 40 mg | 131 | (1) headache (2) nervousness (3) diarrhoea (4) nausea (5) asthenia (6) rhinitis (7) somnolence (8) dry mouth (9) insomnia (10) injection (11) anxiety (12) dyspepsia (13) dysmenorrhoea (14) sweating (15) abdominal pain (16) pain (17) dizziness (18) pharyngitis (19) rash (20) back pain (21) sinusitis (22) myalgia (23) flu syndrome (24) constipation (25) decreased libido (26) allergic reaction | (1) 34 (2) 15 (3) 15 (4) 15 (5) 17 (6) 9 (7) 9 (8) 8 (9) 8 (10) 9 (11) 5 (12) 6 (13) 5 (14) 5 (15) 4 (16) 2 (17) 4 (18) 6 (19) 2 (20) 1 (21) 4 (22) 1 (23) 5 (24) 5 (25) 4 (26) 2 | (1) 25.9 (2) 11.4 (3) 11.4 (4) 11.4 (5) 12.9 (6) 6.8 (7) 6.8 (8) 6.1 (9) 6.1 (10) 6.8 (11) 3.8 (12) 4.5 (13) 3.8 (14) 3.8 (15) 3.0 (16) 1.5 (17) 3 (18) 4.5 (19) 1.5 (20) 0.7 (21) 3 (22) 0.7 (23) 3.8 (24) 3.8 (25) 3 (26) 1.5 | |
| I4: fluoxetine 60 mg | 131 | (1) headache (2) nervousness (3) diarrhoea (4) nausea (5) asthenia (6) rhinitis (7) somnolence (8) dry mouth (9) insomnia (10) injection (11) anxiety (12) dyspepsia (13) dysmenorrhoea (14) sweating (15) abdominal pain (16) pain (17) dizziness (18) pharyngitis (19) rash (20) back pain (21) sinusitis (22) myalgia (23) flu syndrome (24) constipation (25) decreased libido | (1) 34 (2) 18 (3) 13 (4) 15 (5) 15 (6) 7 (7) 12 (8) 6 (9) 8 (10) 2 (11) 5 (12) 6 (13) 3 (14) 8 (15) 5 (16) 3 (17) 5 (18) 2 (19) 4 (20) 3 (21) 3 (22) 4 (23) 4 (24) 2 (25) 4 | (1) 25.9 (2) 13.7 (3) 9.9 (4) 11.4 (5) 11.4 (6) 5.3 (7) 9.1 (8) 4.5 (9) 6.1 (10) 1.5 (11) 3.8 (12) 4.5 (13) 2.2 (14) 6.1 (15) 3.8 (16) 2.2 (17) 3.8 (18) 1.5 (19) 3 (20) 2.2 (21) 2.2 (22) 3 (23) 3 (24) 1.5 (25) 3 | |
| C: placebo | 131 | (1) headache (2) nervousness (3) diarrhoea (4) nausea (5) asthenia (6) rhinitis (7) somnolence (8) dry mouth (9) insomnia (10) injection (11) anxiety (12) dyspepsia (13) dysmenorrhoea (14) sweating (15) abdominal pain (16) pain (17) dizziness (18) pharyngitis (19) rash (20) back pain (21) sinusitis (22) myalgia (23) flu syndrome (24) constipation (25) allergic reaction | (1) 32 (2) 15 (3) 9 (4) 11 (5) 6 (6) 9 (7) 5 (8) 5 (9) 5 (10) 8 (11) 7 (12) 3 (13) 5 (14) 3 (15) 2 (16) 5 (17) 4 (18) 2 (19) 3 (20) 3 (21) 6 (22) 4 (23) 1 (24) 1 (25) 2 | (1) 24.4 (2) 11.4 (3) 6.8 (4) 8.3 (5) 4.5 (6) 6.8 (7) 3.8 (8) 3.8 (9) 3.8 (10) 6.1 (11) 5.3 (12) 2.2 (13) 3.8 (14) 2.2 (15) 1.5 (16) 3.8 (17) 3 (18) 1.5 (19) 2.2 (20) 2.2 (21) 4.5 (22) 3 (23) 0.7 (24) 0.7 (25) 1.5 | |
| Levine 1987 | I: fluoxetine 60 mg | 60 | (1) nausea (2) asthenia (3) nervousness (4) excessive sweating (5) drowsiness (6) sinusitis (7) upper respiratory infection (8) headache (9) anxiety (10) dizziness/lightheadedness (11) insomnia (12) arthritis (13) dyspepsia (14) viral infection (15) tremor (16) diarrhoea (17) gastroenteritis (18) abdominal pain | (1) 15 (2) 14 (3) 7 (4) 7 (5) 6 (6) 6 (7) 6 (8) 5 (9) 4 (10) 4 (11) 4 (12) 3 (13) 3 (14) 3 (15) 3 (16) 1 (17) 1 (18) 1 | (1) 25
(2) 23.3
(3) 11.6
(4) 11.6
(5) 10
(6) 10
(7) 10
(8) 8.3
(9) 6.6
(10) 6.6 (11) 6.6 (12) 5 (13) 5 (14) 5 (15) 5 (16) 1.6 (17) 1.6 (18) 1.6 |
| C: placebo | 60 | (1) nausea (2) asthenia (3) nervousness (4) excessive sweating (5) drowsiness (6) sinusitis (7) upper respiratory infection (8) headache (9) anxiety (10) dyspepsia (11) viral infection (12) diarrhoea (13) gastroenteritis (14) abdominal pain | (1) 7 (2) 2 (3) 2 (4) 5 (5) 1 (6) 2 (7) 6 (8) 4 (9) 5 (10) 1 (11) 2 (12) 5 (13) 7 (14) 3 | (1) 11.6
(2) 3.3
(3) 3.3
(4) 8.3 (5) 1.6 (6) 3.3 (7) 10 (8) 6.6 (9) 8.3 (10) 1.6 (11) 3.3 (12) 8.3 (13) 11.6 (14) 5 |
|
| — denotes not reported C: comparator; I: intervention. | |||||
Appendix 14. Survey of trial investigators providing information on included trials
| Trial ID | Date trial author contacted | Date trial author replied | Date trial author was asked for additional information (short summary) | Date trial author provided data (short summary) |
| Al‐Helli 2015 | 19 July 2018 | No answer | NA | NA |
| Suplicy 2014 | 04 September 2017 | 18 September 2017 | 02 August 2016 and 03 September 2017 (How was the randomisation technique performed for participants? | 04 September 2017 (Patients were consecutively randomized by choosing a paper identified with the number of each study group) |
| Guimaraes 2006 | 13 May 2017 | No answer | NA | NA |
| Bondi 2000 | 09 May 2017 | No answer | NA | NA |
| Huang 1998 | 03 September 2017 | No answer | NA | NA |
| Bross 1995 | 13 May 2017 | No answer | NA | NA |
| Fernández‐Soto 1995 | 13 May 2017 | No answer | NA | NA |
| Lawton 1995 | 03 September 2017 | No answer | NA | NA |
| Goldstein 1994 | 13 May 2017 | No answer | NA | NA |
| Goldstein 1993 | 13 May 2017 | No answer | NA | NA |
| Pedrinola 1993 | 03 August 2016 and 03 September 2017 | 05 September 2017 | 03 August 2016 and 03 September 2017 (How was the randomisation and blindness performed for participants?) | 05 September 2017 (both groups included patients randomly selected from out outpatient clinic; patients were allocated to each group without previous selection; the personnel of the hospital were blind and there was no blinding of outcome of assessment) |
| Visser 1993 | 03 September 2017 | 04 September | 03 September 2017 (How was the randomisation and blindness performed for participants?) | 04 September 2017 (the randomisation was performed by a third party, but I believe that participants were given a number in the order of the date and time of their baseline assessment. That number corresponded with a code which was indicated on the pill bottles; participants and researchers were blinded for all outcomes) |
| Wurtman 1993 | 03 September 2017 | No answer | NA | NA |
| Kopelman 1992 | 03 August 2016 and 03 September 2017 | No answer | NA | NA |
| Stinson 1992 | 03 September 2017 | No answer | NA | NA |
| Bagiella 1991 | 09 May 2017 | No answer | NA | NA |
| Pijl 1991 | 03 September 2017 | 06 September 2017 | 03 September 2017 (How was the randomisation technique of the participants and how was the allocation concealment performed?) | 06 September 2017 (the randomisation was performed by a computer random sequence generator; treatments were allocated in order of inclusion/study number; which were provided by the pharmacy to the study staff in similar capsules) |
| Levine 1989 | 05 August 2016 | No answer | NA | NA |
| Levine 1987 | 05 August 2016 | No answer | NA | NA |
| C: comparator; I: intervention; NA: not applicable. | ||||
Appendix 15. Health‐related quality of life: instruments
| Instrument | Dimensions (subscales) (no. of items) | Validated instrument | Answer options | Scores |
Minimum score Maximum score |
Weighting of scores | Direction of scales | Minimal important difference |
| Short‐Form Health Survey (SF‐36) Employed in: Suplicy 2014 |
|
Yes | 1, 3, 6‐11 items Likert scale | Scores for dimensions: Physical component summary (PCS) Mental component summary (MCS) |
Minimum scores: Scores for dimensions/PCS/MCS: norm‐based scale Maximum scores: scores for dimensions/PCS/MCS: norm‐based scale |
No | Higher values mean better assessment | PCS: 2 to 3 points MCS: 3 points Dimensions: PF/BT/VT: 2 points, if score < 40; 3 points, if score ≥ 40 RP: 2 points SF/MH: 3 points RE: 4 points |
| Impact of Weight on Quality of Life (IWQOL‐LITE) Employed in: Suplicy 2014 |
|
Yes | Likert scale |
|
|
No | Higher values mean better quality of life | — |
| G: generic; S: specific; SF: short‐form health survey. | ||||||||
Data and analyses
Comparison 1. Fluoxetine versus placebo.
| Outcome or subgroup title | No. of studies | No. of participants | Statistical method | Effect size |
|---|---|---|---|---|
| 1.1 Weight loss (end of trial weight) | 10 | Mean Difference (IV, Random, 95% CI) | Subtotals only | |
| 1.1.1 Fluoxetine 60 mg/d | 7 | 819 | Mean Difference (IV, Random, 95% CI) | ‐2.50 [‐3.78, ‐1.22] |
| 1.1.2 Fluoxetine 40 mg/d | 2 | 182 | Mean Difference (IV, Random, 95% CI) | ‐3.97 [‐8.75, 0.81] |
| 1.1.3 Fluoxetine 20 mg/d | 3 | 279 | Mean Difference (IV, Random, 95% CI) | ‐1.50 [‐3.53, 0.54] |
| 1.2 Weight loss (duration of intervention) | 8 | 1466 | Mean Difference (IV, Random, 95% CI) | ‐2.72 [‐3.73, ‐1.71] |
| 1.2.1 0 to 3 months | 5 | 366 | Mean Difference (IV, Random, 95% CI) | ‐3.34 [‐3.93, ‐2.76] |
| 1.2.2 4 to 6 months | 2 | 453 | Mean Difference (IV, Random, 95% CI) | ‐2.75 [‐3.91, ‐1.59] |
| 1.2.3 7 to 12 months | 2 | 647 | Mean Difference (IV, Random, 95% CI) | ‐1.34 [‐5.71, 3.03] |
| 1.3 Weight loss (cross‐over trial) | 1 | Mean Difference (IV, Fixed, 95% CI) | Totals not selected | |
| 1.4 Any adverse event | 9 | 1253 | Risk Ratio (M‐H, Random, 95% CI) | 1.18 [0.99, 1.42] |
| 1.5 Specific adverse events | 9 | Risk Ratio (M‐H, Random, 95% CI) | Subtotals only | |
| 1.5.1 Abdominal pain | 5 | 504 | Risk Ratio (M‐H, Random, 95% CI) | 1.51 [0.58, 3.90] |
| 1.5.2 Allergy | 3 | 780 | Risk Ratio (M‐H, Random, 95% CI) | 0.17 [0.03, 0.98] |
| 1.5.3 Amnesia | 1 | 458 | Risk Ratio (M‐H, Random, 95% CI) | 12.89 [0.73, 227.44] |
| 1.5.4 Anorexia | 1 | 19 | Risk Ratio (M‐H, Random, 95% CI) | 8.89 [1.36, 57.89] |
| 1.5.5 Anxiety | 7 | 1210 | Risk Ratio (M‐H, Random, 95% CI) | 1.07 [0.56, 2.03] |
| 1.5.6 Constipation | 3 | 381 | Risk Ratio (M‐H, Random, 95% CI) | 2.83 [0.58, 13.90] |
| 1.5.7 Diarrhoea | 7 | 1191 | Risk Ratio (M‐H, Random, 95% CI) | 1.44 [0.97, 2.13] |
| 1.5.8 Dizziness | 5 | 693 | Risk Ratio (M‐H, Random, 95% CI) | 2.40 [1.03, 5.60] |
| 1.5.9 Drowsiness | 9 | 1253 | Risk Ratio (M‐H, Random, 95% CI) | 2.67 [1.68, 4.24] |
| 1.5.10 Dry mouth | 6 | 896 | Risk Ratio (M‐H, Random, 95% CI) | 1.23 [0.66, 2.30] |
| 1.5.11 Dyspepsia | 4 | 501 | Risk Ratio (M‐H, Random, 95% CI) | 1.99 [0.71, 5.55] |
| 1.5.12 Fatigue | 5 | 1112 | Risk Ratio (M‐H, Random, 95% CI) | 2.50 [1.62, 3.85] |
| 1.5.13 Headache | 8 | 1234 | Risk Ratio (M‐H, Random, 95% CI) | 1.17 [0.94, 1.47] |
| 1.5.14 Insomnia | 7 | 1191 | Risk Ratio (M‐H, Random, 95% CI) | 2.23 [1.22, 4.08] |
| 1.5.15 Irritability | 3 | 442 | Risk Ratio (M‐H, Random, 95% CI) | 1.41 [0.63, 3.15] |
| 1.5.16 Malaise | 2 | 322 | Risk Ratio (M‐H, Random, 95% CI) | 0.60 [0.15, 2.46] |
| 1.5.17 Nausea | 7 | 1016 | Risk Ratio (M‐H, Random, 95% CI) | 1.99 [1.35, 2.91] |
| 1.5.18 Palpitation | 1 | 60 | Risk Ratio (M‐H, Random, 95% CI) | 2.81 [0.12, 66.40] |
| 1.5.19 Rhinitis | 3 | 933 | Risk Ratio (M‐H, Random, 95% CI) | 0.99 [0.75, 1.30] |
| 1.6 Participants with any adverse event (per dose) | 9 | Risk Ratio (M‐H, Random, 95% CI) | Subtotals only | |
| 1.6.1 Fluoxetine 60 mg/d | 7 | 1134 | Risk Ratio (M‐H, Random, 95% CI) | 1.16 [0.93, 1.44] |
| 1.6.2 Fluoxetine 40 mg/d | 1 | 262 | Risk Ratio (M‐H, Random, 95% CI) | 1.07 [0.93, 1.24] |
| 1.6.3 Fluoxetine 20 mg/d | 4 | 592 | Risk Ratio (M‐H, Random, 95% CI) | 1.10 [0.92, 1.31] |
| 1.6.4 Fluoxetine 10 mg/d | 1 | 262 | Risk Ratio (M‐H, Random, 95% CI) | 0.96 [0.82, 1.12] |
| 1.7 Participants with any adverse event (duration of intervention) | 7 | Risk Ratio (M‐H, Random, 95% CI) | Subtotals only | |
| 1.7.1 0 to 3 months | 4 | 444 | Risk Ratio (M‐H, Random, 95% CI) | 1.71 [0.87, 3.33] |
| 1.7.2 4 to 6 months | 2 | 477 | Risk Ratio (M‐H, Random, 95% CI) | 2.51 [0.27, 23.63] |
| 1.7.3 7 to 12 months | 1 | 213 | Risk Ratio (M‐H, Random, 95% CI) | 0.96 [0.54, 1.69] |
| 1.8 Participants discontinuing due to adverse events | 8 | 1188 | Risk Ratio (M‐H, Random, 95% CI) | 1.88 [0.87, 4.06] |
| 1.9 Anthropometric measurements other than weight loss (BMI) | 3 | 97 | Mean Difference (IV, Random, 95% CI) | ‐1.11 [‐3.66, 1.43] |
| 1.9.1 Fluoxetine 60 mg/d | 1 | 19 | Mean Difference (IV, Random, 95% CI) | ‐3.30 [‐7.25, 0.65] |
| 1.9.2 Fluoxetine 40 mg/d | 1 | 18 | Mean Difference (IV, Random, 95% CI) | ‐2.80 [‐8.71, 3.11] |
| 1.9.3 Fluoxetine 20 mg/d | 1 | 60 | Mean Difference (IV, Random, 95% CI) | 0.20 [‐0.60, 1.00] |
| 1.10 Morbidity (depression) | 3 | 393 | Risk Ratio (M‐H, Random, 95% CI) | 1.20 [0.57, 2.52] |
| 1.11 Morbidity (depression per dose) | 3 | 604 | Risk Ratio (M‐H, Random, 95% CI) | 0.94 [0.52, 1.73] |
| 1.11.1 Fluoxetine 60 mg/d | 2 | 333 | Risk Ratio (M‐H, Random, 95% CI) | 1.41 [0.53, 3.79] |
| 1.11.2 Fluoxetine 20 mg/d | 2 | 271 | Risk Ratio (M‐H, Random, 95% CI) | 0.58 [0.23, 1.48] |
Comparison 2. Fluoxetine versus another anti‐obesity agent.
| Outcome or subgroup title | No. of studies | No. of participants | Statistical method | Effect size |
|---|---|---|---|---|
| 2.1 Weight loss, end of trial weight | 3 | Mean Difference (IV, Fixed, 95% CI) | Totals not selected | |
| 2.1.1 Fluoxetine 60 mg/d vs. sibutramine | 1 | Mean Difference (IV, Fixed, 95% CI) | Totals not selected | |
| 2.1.2 Fluoxetine 60 mg/d vs. metformin | 1 | Mean Difference (IV, Fixed, 95% CI) | Totals not selected | |
| 2.1.3 Fluoxetine 20 mg/d vs. sibutramine | 1 | Mean Difference (IV, Fixed, 95% CI) | Totals not selected | |
| 2.1.4 Fluoxetine 20 mg/d vs. dexfenfluramine | 1 | Mean Difference (IV, Fixed, 95% CI) | Totals not selected | |
| 2.1.5 Fluoxetine 20 mg/d vs. diethylpropion | 1 | Mean Difference (IV, Fixed, 95% CI) | Totals not selected | |
| 2.1.6 Fluoxetine 20 mg/d vs. fenproporex | 1 | Mean Difference (IV, Fixed, 95% CI) | Totals not selected | |
| 2.1.7 Fluoxetine 20 mg/d vs. mazindol | 1 | Mean Difference (IV, Fixed, 95% CI) | Totals not selected | |
| 2.2 Any adverse event | 3 | Risk Ratio (M‐H, Fixed, 95% CI) | Totals not selected | |
| 2.2.1 Fluoxetine 60 mg/d vs. sibutramine | 1 | Risk Ratio (M‐H, Fixed, 95% CI) | Totals not selected | |
| 2.2.2 Fluoxetine 60 mg/d vs. metformin | 1 | Risk Ratio (M‐H, Fixed, 95% CI) | Totals not selected | |
| 2.2.3 Fluoxetine 20 mg/d vs. sibutramine | 1 | Risk Ratio (M‐H, Fixed, 95% CI) | Totals not selected | |
| 2.2.4 Fluoxetine 20 mg/d vs. dexfenfluramine | 1 | Risk Ratio (M‐H, Fixed, 95% CI) | Totals not selected | |
| 2.2.5 Fluoxetine 20 mg/d vs diethylpropion | 1 | Risk Ratio (M‐H, Fixed, 95% CI) | Totals not selected | |
| 2.2.6 Fluoxetine 20 mg/d vs. fenproporex | 1 | Risk Ratio (M‐H, Fixed, 95% CI) | Totals not selected | |
| 2.2.7 Fluoxetine 20 mg/d vs. mazindol | 1 | Risk Ratio (M‐H, Fixed, 95% CI) | Totals not selected | |
| 2.3 Adverse events (abdominal pain) | 1 | Risk Ratio (M‐H, Fixed, 95% CI) | Totals not selected | |
| 2.3.1 Fluoxetine 20 mg/d vs. sibutramine | 1 | Risk Ratio (M‐H, Fixed, 95% CI) | Totals not selected | |
| 2.3.2 Fluoxetine 20 mg/d vs. diethylpropion | 1 | Risk Ratio (M‐H, Fixed, 95% CI) | Totals not selected | |
| 2.3.3 Fluoxetine 20 mg/d vs. fenproporex | 1 | Risk Ratio (M‐H, Fixed, 95% CI) | Totals not selected | |
| 2.3.4 Fluoxetine 20 mg/d vs. mazindol | 1 | Risk Ratio (M‐H, Fixed, 95% CI) | Totals not selected | |
| 2.4 Adverse events (allergy) | 1 | Risk Ratio (M‐H, Fixed, 95% CI) | Totals not selected | |
| 2.4.1 Fluoxetine 20 mg/d vs. sibutramine | 1 | Risk Ratio (M‐H, Fixed, 95% CI) | Totals not selected | |
| 2.4.2 Fluoxetine 20 mg/d vs. diethylpropion | 1 | Risk Ratio (M‐H, Fixed, 95% CI) | Totals not selected | |
| 2.4.3 Fluoxetine 20 mg/d vs. fenproporex | 1 | Risk Ratio (M‐H, Fixed, 95% CI) | Totals not selected | |
| 2.4.4 Fluoxetine 20 mg/d vs. mazindol | 1 | Risk Ratio (M‐H, Fixed, 95% CI) | Totals not selected | |
| 2.5 Adverse events (anorexia) | 2 | Risk Ratio (M‐H, Fixed, 95% CI) | Totals not selected | |
| 2.5.1 Fluoxetine 60 mg/d vs. sibutramine | 1 | Risk Ratio (M‐H, Fixed, 95% CI) | Totals not selected | |
| 2.5.2 Fluoxetine 60 mg/d vs. metformin | 1 | Risk Ratio (M‐H, Fixed, 95% CI) | Totals not selected | |
| 2.5.3 Fluoxetine 20 mg/d vs. sibutramine | 1 | Risk Ratio (M‐H, Fixed, 95% CI) | Totals not selected | |
| 2.5.4 Fluoxetine 20 mg/d vs. diethylpropion | 1 | Risk Ratio (M‐H, Fixed, 95% CI) | Totals not selected | |
| 2.5.5 Fluoxetine 20 mg/d vs. fenproporex | 1 | Risk Ratio (M‐H, Fixed, 95% CI) | Totals not selected | |
| 2.5.6 Fluoxetine 20 mg/d vs. mazindol | 1 | Risk Ratio (M‐H, Fixed, 95% CI) | Totals not selected | |
| 2.6 Adverse events (anxiety) | 2 | Risk Ratio (M‐H, Fixed, 95% CI) | Totals not selected | |
| 2.6.1 Fluoxetine 20 mg/d vs. sibutramine | 1 | Risk Ratio (M‐H, Fixed, 95% CI) | Totals not selected | |
| 2.6.2 Fluoxetine 20 mg/d vs. dexfenfluramine | 1 | Risk Ratio (M‐H, Fixed, 95% CI) | Totals not selected | |
| 2.6.3 Fluoxetine 20 mg/d vs. diethylpropion | 1 | Risk Ratio (M‐H, Fixed, 95% CI) | Totals not selected | |
| 2.6.4 Fluoxetine 20 mg/d vs. fenproporex | 1 | Risk Ratio (M‐H, Fixed, 95% CI) | Totals not selected | |
| 2.6.5 Fluoxetine 20 mg/d vs. mazindol | 1 | Risk Ratio (M‐H, Fixed, 95% CI) | Totals not selected | |
| 2.7 Adverse events (constipation) | 3 | Risk Ratio (M‐H, Fixed, 95% CI) | Totals not selected | |
| 2.7.1 Fluoxetine 60 mg/d vs. sibutramine | 1 | Risk Ratio (M‐H, Fixed, 95% CI) | Totals not selected | |
| 2.7.2 Fluoxetine 60 mg/d vs. metformin | 1 | Risk Ratio (M‐H, Fixed, 95% CI) | Totals not selected | |
| 2.7.3 Fluoxetine 20 mg/d vs. sibutramine | 1 | Risk Ratio (M‐H, Fixed, 95% CI) | Totals not selected | |
| 2.7.4 Fluoxetine 20 mg/d vs. dexfenfluramine | 1 | Risk Ratio (M‐H, Fixed, 95% CI) | Totals not selected | |
| 2.7.5 Fluoxetine 20 mg/d vs. diethylpropion | 1 | Risk Ratio (M‐H, Fixed, 95% CI) | Totals not selected | |
| 2.7.6 Fluoxetine 20 mg/d vs. fenproporex | 1 | Risk Ratio (M‐H, Fixed, 95% CI) | Totals not selected | |
| 2.7.7 Fluoxetine 20 mg/d vs. mazindol | 1 | Risk Ratio (M‐H, Fixed, 95% CI) | Totals not selected | |
| 2.8 Adverse events (diarrhoea) | 3 | Risk Ratio (M‐H, Fixed, 95% CI) | Totals not selected | |
| 2.8.1 Fluoxetine 60 mg/d vs. sibutramine | 1 | Risk Ratio (M‐H, Fixed, 95% CI) | Totals not selected | |
| 2.8.2 Fluoxetine 60 mg/d vs. metformin | 1 | Risk Ratio (M‐H, Fixed, 95% CI) | Totals not selected | |
| 2.8.3 Fluoxetine 20 mg/d vs. sibutramine | 1 | Risk Ratio (M‐H, Fixed, 95% CI) | Totals not selected | |
| 2.8.4 Fluoxetine 20 mg/d vs. dexfenfluramine | 1 | Risk Ratio (M‐H, Fixed, 95% CI) | Totals not selected | |
| 2.8.5 Fluoxetine 20 mg/d vs. diethylpropion | 1 | Risk Ratio (M‐H, Fixed, 95% CI) | Totals not selected | |
| 2.8.6 Fluoxetine 20 mg/d vs. fenproporex | 1 | Risk Ratio (M‐H, Fixed, 95% CI) | Totals not selected | |
| 2.8.7 Fluoxetine 20 mg/d vs. mazindol | 1 | Risk Ratio (M‐H, Fixed, 95% CI) | Totals not selected | |
| 2.9 Adverse events (dizziness) | 2 | Risk Ratio (M‐H, Fixed, 95% CI) | Totals not selected | |
| 2.9.1 Fluoxetine 60 mg/d vs. sibutramine | 1 | Risk Ratio (M‐H, Fixed, 95% CI) | Totals not selected | |
| 2.9.2 Fluoxetine 60 mg/d vs. metformin | 1 | Risk Ratio (M‐H, Fixed, 95% CI) | Totals not selected | |
| 2.9.3 Fluoxetine 20 mg/d vs. sibutramine | 1 | Risk Ratio (M‐H, Fixed, 95% CI) | Totals not selected | |
| 2.9.4 Fluoxetine 20 mg/d vs. diethylpropion | 1 | Risk Ratio (M‐H, Fixed, 95% CI) | Totals not selected | |
| 2.9.5 Fluoxetine 20 mg/d vs. fenproporex | 1 | Risk Ratio (M‐H, Fixed, 95% CI) | Totals not selected | |
| 2.9.6 Fluoxetine 20 mg/d vs. mazindol | 1 | Risk Ratio (M‐H, Fixed, 95% CI) | Totals not selected | |
| 2.10 Adverse events (drowsiness) | 3 | Risk Ratio (M‐H, Fixed, 95% CI) | Totals not selected | |
| 2.10.1 Fluoxetine 60 mg/d vs. sibutramine | 1 | Risk Ratio (M‐H, Fixed, 95% CI) | Totals not selected | |
| 2.10.2 Fluoxetine 60 mg/d vs. metformin | 1 | Risk Ratio (M‐H, Fixed, 95% CI) | Totals not selected | |
| 2.10.3 Fluoxetine 20 mg/d vs. sibutramine | 1 | Risk Ratio (M‐H, Fixed, 95% CI) | Totals not selected | |
| 2.10.4 Fluoxetine 20 mg/d vs. dexfenfluramine | 1 | Risk Ratio (M‐H, Fixed, 95% CI) | Totals not selected | |
| 2.10.5 Fluoxetine 20 mg/d vs. diethylpropion | 1 | Risk Ratio (M‐H, Fixed, 95% CI) | Totals not selected | |
| 2.10.6 Fluoxetine 20 mg/d vs. fenproporex | 1 | Risk Ratio (M‐H, Fixed, 95% CI) | Totals not selected | |
| 2.10.7 Fluoxetine 20 mg/d vs. mazindol | 1 | Risk Ratio (M‐H, Fixed, 95% CI) | Totals not selected | |
| 2.11 Adverse events (dry mouth) | 3 | Risk Ratio (M‐H, Fixed, 95% CI) | Totals not selected | |
| 2.11.1 Fluoxetine 60 mg/d vs. sibutramine | 1 | Risk Ratio (M‐H, Fixed, 95% CI) | Totals not selected | |
| 2.11.2 Fluoxetine 60 mg/d vs. metformin | 1 | Risk Ratio (M‐H, Fixed, 95% CI) | Totals not selected | |
| 2.11.3 Fluoxetine 20 mg/d vs. sibutramine | 1 | Risk Ratio (M‐H, Fixed, 95% CI) | Totals not selected | |
| 2.11.4 Fluoxetine 20 mg/d vs. dexfenfluramine | 1 | Risk Ratio (M‐H, Fixed, 95% CI) | Totals not selected | |
| 2.11.5 Fluoxetine 20 mg/d vs. diethylpropion | 1 | Risk Ratio (M‐H, Fixed, 95% CI) | Totals not selected | |
| 2.11.6 Fluoxetine 20 mg/d vs. fenproporex | 1 | Risk Ratio (M‐H, Fixed, 95% CI) | Totals not selected | |
| 2.11.7 Fluoxetine 20 mg/d vs. mazindol | 1 | Risk Ratio (M‐H, Fixed, 95% CI) | Totals not selected | |
| 2.12 Adverse events (dyspepsia) | 2 | Risk Ratio (M‐H, Fixed, 95% CI) | Totals not selected | |
| 2.12.1 Fluoxetine 20 mg/d vs. sibutramine | 1 | Risk Ratio (M‐H, Fixed, 95% CI) | Totals not selected | |
| 2.12.2 Fluoxetine 20 mg/d vs. dexfenfluramine | 1 | Risk Ratio (M‐H, Fixed, 95% CI) | Totals not selected | |
| 2.12.3 Fluoxetine 20 mg/d vs. diethylpropion | 1 | Risk Ratio (M‐H, Fixed, 95% CI) | Totals not selected | |
| 2.12.4 Fluoxetine 20 mg/d vs. fenproporex | 1 | Risk Ratio (M‐H, Fixed, 95% CI) | Totals not selected | |
| 2.12.5 Fluoxetine 20 mg/d vs. mazindol | 1 | Risk Ratio (M‐H, Fixed, 95% CI) | Totals not selected | |
| 2.13 Adverse events (fatigue) | 2 | Risk Ratio (M‐H, Fixed, 95% CI) | Totals not selected | |
| 2.13.1 Fluoxetine 20 mg/d vs. sibutramine | 1 | Risk Ratio (M‐H, Fixed, 95% CI) | Totals not selected | |
| 2.13.2 Fluoxetine 20 mg/d vs. dexfenfluramine | 1 | Risk Ratio (M‐H, Fixed, 95% CI) | Totals not selected | |
| 2.13.3 Fluoxetine 20 mg/d vs. diethylpropion | 1 | Risk Ratio (M‐H, Fixed, 95% CI) | Totals not selected | |
| 2.13.4 Fluoxetine 20 mg/d vs. fenproporex | 1 | Risk Ratio (M‐H, Fixed, 95% CI) | Totals not selected | |
| 2.13.5 Fluoxetine 20 mg/d vs. mazindol | 1 | Risk Ratio (M‐H, Fixed, 95% CI) | Totals not selected | |
| 2.14 Adverse events (headache) | 3 | Risk Ratio (M‐H, Fixed, 95% CI) | Totals not selected | |
| 2.14.1 Fluoxetine 60 mg/d vs. sibutramine | 1 | Risk Ratio (M‐H, Fixed, 95% CI) | Totals not selected | |
| 2.14.2 Fluoxetine 60 mg/d vs. metformin | 1 | Risk Ratio (M‐H, Fixed, 95% CI) | Totals not selected | |
| 2.14.3 Fluoxetine 20 mg/d vs. sibutramine | 1 | Risk Ratio (M‐H, Fixed, 95% CI) | Totals not selected | |
| 2.14.4 Fluoxetine 20 mg/d vs. dexfenfluramine | 1 | Risk Ratio (M‐H, Fixed, 95% CI) | Totals not selected | |
| 2.14.5 Fluoxetine 20 mg/d vs. diethylpropion | 1 | Risk Ratio (M‐H, Fixed, 95% CI) | Totals not selected | |
| 2.14.6 Fluoxetine 20 mg/d vs. fenproporex | 1 | Risk Ratio (M‐H, Fixed, 95% CI) | Totals not selected | |
| 2.14.7 Fluoxetine 20 mg/d vs. mazindol | 1 | Risk Ratio (M‐H, Fixed, 95% CI) | Totals not selected | |
| 2.15 Adverse events (insomnia) | 3 | Risk Ratio (M‐H, Fixed, 95% CI) | Totals not selected | |
| 2.15.1 Fluoxetine 60 mg/d vs. sibutramine | 1 | Risk Ratio (M‐H, Fixed, 95% CI) | Totals not selected | |
| 2.15.2 Fluoxetine 60 mg/d vs. metformin | 1 | Risk Ratio (M‐H, Fixed, 95% CI) | Totals not selected | |
| 2.15.3 Fluoxetine 20 mg/d vs. sibutramine | 1 | Risk Ratio (M‐H, Fixed, 95% CI) | Totals not selected | |
| 2.15.4 Fluoxetine 20 mg/d vs. dexfenfluramine | 1 | Risk Ratio (M‐H, Fixed, 95% CI) | Totals not selected | |
| 2.15.5 Fluoxetine 20 mg/d vs. diethylpropion | 1 | Risk Ratio (M‐H, Fixed, 95% CI) | Totals not selected | |
| 2.15.6 Fluoxetine 20 mg/d vs. fenproporex | 1 | Risk Ratio (M‐H, Fixed, 95% CI) | Totals not selected | |
| 2.15.7 Fluoxetine 20 mg/d vs. mazindol | 1 | Risk Ratio (M‐H, Fixed, 95% CI) | Totals not selected | |
| 2.16 Adverse events (irritability) | 1 | Risk Ratio (M‐H, Fixed, 95% CI) | Totals not selected | |
| 2.16.1 Fluoxetine 20 mg/d vs. sibutramine | 1 | Risk Ratio (M‐H, Fixed, 95% CI) | Totals not selected | |
| 2.16.2 Fluoxetine 20 mg/d vs diethylpropion | 1 | Risk Ratio (M‐H, Fixed, 95% CI) | Totals not selected | |
| 2.16.3 Fluoxetine 20 mg/d vs. fenproporex | 1 | Risk Ratio (M‐H, Fixed, 95% CI) | Totals not selected | |
| 2.16.4 Fluoxetine 20 mg/d vs. mazindol | 1 | Risk Ratio (M‐H, Fixed, 95% CI) | Totals not selected | |
| 2.17 Adverse events (malaise) | 1 | Risk Ratio (M‐H, Fixed, 95% CI) | Totals not selected | |
| 2.17.1 Fluoxetine 20 mg/d vs. sibutramine | 1 | Risk Ratio (M‐H, Fixed, 95% CI) | Totals not selected | |
| 2.17.2 Fluoxetine 20 mg/d vs. diethylpropion | 1 | Risk Ratio (M‐H, Fixed, 95% CI) | Totals not selected | |
| 2.17.3 Fluoxetine 20 mg/d vs. fenproporex | 1 | Risk Ratio (M‐H, Fixed, 95% CI) | Totals not selected | |
| 2.17.4 Fluoxetine 20 mg/d vs. mazindol | 1 | Risk Ratio (M‐H, Fixed, 95% CI) | Totals not selected | |
| 2.18 Adverse events (nausea) | 3 | Risk Ratio (M‐H, Fixed, 95% CI) | Totals not selected | |
| 2.18.1 Fluoxetine 60 mg/d vs. sibutramine | 1 | Risk Ratio (M‐H, Fixed, 95% CI) | Totals not selected | |
| 2.18.2 Fluoxetine 60 mg/d vs. metformin | 1 | Risk Ratio (M‐H, Fixed, 95% CI) | Totals not selected | |
| 2.18.3 Fluoxetine 20 mg/d vs. sibutramine | 1 | Risk Ratio (M‐H, Fixed, 95% CI) | Totals not selected | |
| 2.18.4 Fluoxetine 20 mg/d vs. dexfenfluramine | 1 | Risk Ratio (M‐H, Fixed, 95% CI) | Totals not selected | |
| 2.18.5 Fluoxetine 20 mg/d vs. diethylpropion | 1 | Risk Ratio (M‐H, Fixed, 95% CI) | Totals not selected | |
| 2.18.6 Fluoxetine 20 mg/d vs. fenproporex | 1 | Risk Ratio (M‐H, Fixed, 95% CI) | Totals not selected | |
| 2.18.7 Fluoxetine 20 mg/d vs. mazindol | 1 | Risk Ratio (M‐H, Fixed, 95% CI) | Totals not selected | |
| 2.19 Adverse events (palpitation) | 1 | Risk Ratio (M‐H, Fixed, 95% CI) | Totals not selected | |
| 2.19.1 Fluoxetine 20 mg/d vs. sibutramine | 1 | Risk Ratio (M‐H, Fixed, 95% CI) | Totals not selected | |
| 2.19.2 Fluoxetine 20 mg/d vs. diethylpropion | 1 | Risk Ratio (M‐H, Fixed, 95% CI) | Totals not selected | |
| 2.19.3 Fluoxetine 20 mg/d vs. fenproporex | 1 | Risk Ratio (M‐H, Fixed, 95% CI) | Totals not selected | |
| 2.19.4 Fluoxetine 20 mg/d vs. mazindol | 1 | Risk Ratio (M‐H, Fixed, 95% CI) | Totals not selected | |
| 2.20 Adverse events (sweating) | 2 | Risk Ratio (M‐H, Fixed, 95% CI) | Totals not selected | |
| 2.20.1 Fluoxetine 60 mg/d vs. sibutramine | 1 | Risk Ratio (M‐H, Fixed, 95% CI) | Totals not selected | |
| 2.20.2 Fluoxetine 60 mg/d vs. metformin | 1 | Risk Ratio (M‐H, Fixed, 95% CI) | Totals not selected | |
| 2.20.3 Fluoxetine 20 mg/d vs. sibutramine | 1 | Risk Ratio (M‐H, Fixed, 95% CI) | Totals not selected | |
| 2.20.4 Fluoxetine 20 mg/d vs. diethylpropion | 1 | Risk Ratio (M‐H, Fixed, 95% CI) | Totals not selected | |
| 2.20.5 Fluoxetine 20 mg/d vs. fenproporex | 1 | Risk Ratio (M‐H, Fixed, 95% CI) | Totals not selected | |
| 2.20.6 Fluoxetine 20 mg/d vs. mazindol | 1 | Risk Ratio (M‐H, Fixed, 95% CI) | Totals not selected | |
| 2.21 Adverse events (tremor) | 1 | Risk Ratio (M‐H, Fixed, 95% CI) | Totals not selected | |
| 2.21.1 Fluoxetine 20 mg/d vs. sibutramine | 1 | Risk Ratio (M‐H, Fixed, 95% CI) | Totals not selected | |
| 2.21.2 Fluoxetine 20 mg/d vs. diethylpropion | 1 | Risk Ratio (M‐H, Fixed, 95% CI) | Totals not selected | |
| 2.21.3 Fluoxetine 20 mg/d vs. fenproporex | 1 | Risk Ratio (M‐H, Fixed, 95% CI) | Totals not selected | |
| 2.21.4 Fluoxetine 20 mg/d vs. mazindol | 1 | Risk Ratio (M‐H, Fixed, 95% CI) | Totals not selected | |
| 2.22 Anthropometric measurements other than weight loss in kg (BMI) | 2 | Mean Difference (IV, Fixed, 95% CI) | Totals not selected | |
| 2.22.1 Fluoxetine 60 mg/d vs. sibutramine | 1 | Mean Difference (IV, Fixed, 95% CI) | Totals not selected | |
| 2.22.2 Fluoxetine 60 mg/d vs. metformin | 1 | Mean Difference (IV, Fixed, 95% CI) | Totals not selected | |
| 2.22.3 Fluoxetine 20 mg/d vs. sibutramine | 1 | Mean Difference (IV, Fixed, 95% CI) | Totals not selected | |
| 2.22.4 Fluoxetine 20 mg/d vs. diethylpropion | 1 | Mean Difference (IV, Fixed, 95% CI) | Totals not selected | |
| 2.22.5 Fluoxetine 20 mg/d vs. fenproporex | 1 | Mean Difference (IV, Fixed, 95% CI) | Totals not selected | |
| 2.22.6 Fluoxetine 20 mg/d vs. mazindol | 1 | Mean Difference (IV, Fixed, 95% CI) | Totals not selected | |
| 2.23 Morbidity (depression) | 1 | Risk Ratio (M‐H, Fixed, 95% CI) | Totals not selected | |
| 2.23.1 Fluoxetine 20 mg/d vs. sibutramine | 1 | Risk Ratio (M‐H, Fixed, 95% CI) | Totals not selected | |
| 2.23.2 Fluoxetine 20 mg/d vs. diethylpropion | 1 | Risk Ratio (M‐H, Fixed, 95% CI) | Totals not selected | |
| 2.23.3 Fluoxetine 20 mg/d vs. fenproporex | 1 | Risk Ratio (M‐H, Fixed, 95% CI) | Totals not selected | |
| 2.23.4 Fluoxetine 20 mg/d vs. mazindol | 1 | Risk Ratio (M‐H, Fixed, 95% CI) | Totals not selected |
Comparison 3. Fluoxetine versus no treatment.
| Outcome or subgroup title | No. of studies | No. of participants | Statistical method | Effect size |
|---|---|---|---|---|
| 3.1 Weight loss | 1 | Mean Difference (IV, Fixed, 95% CI) | Totals not selected | |
| 3.2 Adverse events | 1 | Risk Ratio (M‐H, Fixed, 95% CI) | Totals not selected | |
| 3.2.1 Any event | 1 | Risk Ratio (M‐H, Fixed, 95% CI) | Totals not selected | |
| 3.2.2 Allergy | 1 | Risk Ratio (M‐H, Fixed, 95% CI) | Totals not selected | |
| 3.2.3 Anorexia | 1 | Risk Ratio (M‐H, Fixed, 95% CI) | Totals not selected | |
| 3.2.4 Diarrhoea | 1 | Risk Ratio (M‐H, Fixed, 95% CI) | Totals not selected | |
| 3.2.5 Headache | 1 | Risk Ratio (M‐H, Fixed, 95% CI) | Totals not selected | |
| 3.2.6 Insomnia | 1 | Risk Ratio (M‐H, Fixed, 95% CI) | Totals not selected | |
| 3.2.7 Malaise | 1 | Risk Ratio (M‐H, Fixed, 95% CI) | Totals not selected | |
| 3.2.8 Nauseas | 1 | Risk Ratio (M‐H, Fixed, 95% CI) | Totals not selected | |
| 3.2.9 Drowsiness | 1 | Risk Ratio (M‐H, Fixed, 95% CI) | Totals not selected | |
| 3.3 Anthropometric measurements other than weight loss in kg (BMI) | 1 | Mean Difference (IV, Fixed, 95% CI) | Totals not selected |
Characteristics of studies
Characteristics of included studies [ordered by study ID]
Al‐Helli 2015.
| Study characteristics | ||
| Methods | Study design: parallel RCT (randomisation ratio 1:1:1:1) | |
| Participants |
Inclusion criteria: obese subjects (males & females) 18 to 40 years old with BMI ≥ 30 kg/m² Exclusion criteria: not reported Diagnostic criteria: BMI Setting: obesity research and treatment centre/Al‐Kindy medical college Gender distribution: females & males Country/countries where trial was performed: Iraq |
|
| Interventions |
Interventions: I1: experimental group A (EGA): fluoxetine 20 mg orally, once a day for 2 months I2: experimental group B (EGB): omega‐3 gel (1000 mg) orally twice a day for 2 months I3: experimental group C (EGC): fluoxetine 20 mg plus omega‐3 gel (1000 mg) orally daily for 2 months Comparator: 4. Control group (CG): placebo orally once daily for 2 months Cointervention: not reported Duration of intervention: 2 months Duration of follow‐up: 2 months Run‐in period: no Number of study centres: 1 Treatment before study: no Titration period: no Treatment duration: 2 months |
|
| Outcomes | BMI, serum lipids: total cholesterol, low‐density‐lipoprotein cholesterol, high‐density‐lipoprotein cholesterol, triglycerides, fasting blood glucose, malondialdehyde, leptin | |
| Study registration |
Trial identifier: — Trial terminated early (for benefit/because of adverse events): no |
|
| Publication details |
Language of publication: English Commercial funding: not reported Publication status: full article |
|
| Stated aim for study | Quote from publication: "… study the effects of fluoxetine and omega3 drugs alone or their combination on BMI, casting blood glucose, lipid profile, liver enzymes (ALT, AST), Malondiadehyde (MDA), and leptin” | |
| Notes | 1. A priori sample size estimation: not reported 2. Conflict of interest: not reported |
|
| Risk of bias | ||
| Bias | Authors' judgement | Support for judgement |
| Random sequence generation (selection bias) | Unclear risk |
Quote from publication: "… they were randomly allocated" (page 91) Comment: insufficient information |
| Allocation concealment (selection bias) | Unclear risk |
Quote from publication: "… they were randomly allocated" (page 91) Comment: insufficient information |
| Blinding of participants and personnel (performance bias) anthropometric measurements other than weight loss | Unclear risk | Comment: not reported |
| Blinding of outcome assessment (detection bias) anthropometric measurements other than weight loss | Unclear risk | Comment: not reported |
| Incomplete outcome data (attrition bias) anthropometric measurements other than weight loss | Low risk | Comment: no missing data for primary outcome |
| Selective reporting (reporting bias) | High risk | Comment: anthropometric measurements other than weight loss (BMI) were analysed but only reports that results were not significant (see Appendix 9) |
| Other bias | Low risk | Comment: no other potential source of bias. |
Bagiella 1991.
| Study characteristics | ||
| Methods | Study design: parallel RCT | |
| Participants |
Inclusion criteria: obese adult individuals (body mass index ranging between 30 kg/m² to 40 kg/m²) Exclusion criteria: no data Diagnostic criteria: BMI Setting: Istituto di Terapia Medica Sistematica Univeristà "La Sapienza" Gender distribution: females & males Country/countries where trial was performed: Italy |
|
| Interventions |
Interventions: I1: experimental group A (EGA): fenfluramine 20 mg orally, every 8 hours for 12 weeks I2: experimental group B (EGB): 5‐hydroxy‐tryptophan 300 mg orally, every 8 hours for 12 weeks I3: experimental group C (EGC): d‐ fenfluramine 15 mg orally, twice per day for 12 weeks I4: experimental group D (EGD): fluoxetine 20 mg orally, every 8 hours for 12 weeks I5: experimental group E (EGE): fluvoxamine 50 mg orally, every 8 hours for 12 weeks Comparator: 6. Control group (CG): placebo 1 capsule orally, 2 or 3 times per day for 12 weeks Cointervention: 2 consecutive 6 week periods: during first period no diet restriction, whereas during second period a 5016 kJ diet was prescribed Duration of intervention: 12 weeks Duration of follow‐up: 12 weeks Run‐in period: 20 days Number of study centres: 1 Treatment before study: none Titration period: no Treatment duration: 12 weeks |
|
| Outcomes | Questionnaire, divided into 4 sections, intended to evaluate the cognitive and critical, behavioral, and cognitive aspects of the patient's dietary habits | |
| Study registration |
Trial identifier: — Trial terminated early: no |
|
| Publication details |
Language of publication: English Commercial funding: non‐funding Publication status: full article |
|
| Stated aim for study | Quote from publication: “To evaluate the modifications in attitude toward food intake produced by treatment” | |
| Notes | 1. A priori sample size estimation: not reported 2. Conflict of interest: none specified 3. Outcome measures: changes in attitude toward food (questionnaires for dietary habits) |
|
| Risk of bias | ||
| Bias | Authors' judgement | Support for judgement |
| Random sequence generation (selection bias) | Unclear risk |
Quote from publication: "… individuals were assigned at random to six treatment groups” (page 206) Comment: insufficient information |
| Allocation concealment (selection bias) | Unclear risk |
Quote from publication: "… individuals were assigned at random to six treatment groups” (page 206) Comment: insufficient information |
| Selective reporting (reporting bias) | Low risk | Comment: all the outcomes listed in the Method section described in results |
| Other bias | Low risk | Comment: no other potential source of bias |
Bondi 2000.
| Study characteristics | ||
| Methods | Study design: parallel RCT (randomisation ratio 2:3:3) | |
| Participants |
Inclusion criteria: obese but otherwise healthy menopausal women, did not achieve a significant weight change during previous 6 months with diet therapy alone, did not take appetite suppressant medications or drugs Exclusion criteria: diagnosis of depression or Beck inventory questionnaire score ≥ 18 Diagnostic criteria: BMI Setting: Università di Modena Gender distribution: females Country/countries where trial was performed: Italy |
|
| Interventions |
Interventions: I1: experimental group A (EGA): fluoxetine 40 mg orally, single doses (acute study) I2: experimental group B (EGB): fluoxetine 40 mg (before breakfast) and 20 mg (before lunch), for 12 weeks (chronic study) Comparator: 3. Control group (CG): placebo orally for 12 weeks (chronic study) Cointervention: EGB and CG: Diet (55%‒20%‒25%), caloric deficit of 500 kcal/d of 70% energy expenditure by indirect calorimetry Duration of intervention: 12 weeks Duration of follow‐up: 12 weeks Run‐in period: 1 day Number of study centres: 1 Treatment before study: diet Titration period: no Treatment duration: 12 weeks |
|
| Outcomes | Compliance by pill count, resting respiratory quotient, resting energy expenditure, fasting blood glucose, plasma insulin | |
| Study registration |
Trial identifier: — Trial terminated early: no |
|
| Publication details |
Language of publication: English Commercial funding: non funding Publication status: full article |
|
| Stated aim for study | Quote from publication: “Investigate the metabolic effects of fluoxetine both after acute administration and during chronic therapy on glucose‐induced thermogenesis and weight loss in obese individuals” | |
| Notes | 1. A priori sample size estimation: not reported 2. Conflict of interest: none specified |
|
| Risk of bias | ||
| Bias | Authors' judgement | Support for judgement |
| Random sequence generation (selection bias) | Unclear risk |
Quote from publication: "... participants were randomly assigned ..." (page 281) Comment: insufficient information |
| Allocation concealment (selection bias) | Unclear risk |
Quote from publication: "It was a double‐blind, placebo‐controlled design ..." (page 280) Comment: insufficient information |
| Blinding of participants and personnel (performance bias) weight loss | Low risk | Quote from publication: "It was a double‐blind, placebo‐controlled design ..." (page 280) |
| Blinding of outcome assessment (detection bias) weight loss | Unclear risk | Comment: not reported |
| Incomplete outcome data (attrition bias) weight loss | Low risk | Comment: no missing data for primary outcome |
| Selective reporting (reporting bias) | Low risk | Comment: all the outcomes listed in the method section described in results |
| Other bias | Low risk | Comment: no other potential source of bias |
Bross 1995.
| Study characteristics | ||
| Methods | Study design: parallel RCT (randomisation ratio 1:1) | |
| Participants |
Inclusion criteria: non‐depressed obese women, but otherwise healthy, non‐smokers who had maintained a stable body weight for several months and had taken no medication in recent weeks Exclusion criteria: hypertension, diabetes, or any other endocrine or significant medical condition Diagnostic criteria: BMI Setting: Clinical Investigation Unit of the Royal Victoria Hospital Gender distribution: females Country/countries where trial was performed: Canada |
|
| Interventions |
Country centre: USA Interventions: 1. Experimental group (EG): fluoxetine 60 mg orally, once per day for 3 weeks Comparator: 2. Control group (CG): placebo orally, once per day for 3 weeks Cointervention: formula diet (420 kcal including 70 g protein/d and ≥ 100% RDA vitamins and minerals) Duration of intervention: 3 weeks Duration of follow‐up: 3 weeks Run‐in period: 4 to 5 days, liquid formula diet (Ensure with added polycose glucose polymer to provide 150% of basal energy expenditure and 80 g protein) Number of study centres: 1 Treatment before study: no Titration period: no Treatment duration: 3 weeks |
|
| Outcomes | Body weight, resting energy expenditure, O₂ consumption, CO₂ production, thermic effect, urinary norepinephrine excretion, normetanephrine excretion, serum triiodothyronine and thyroxine, nitrogen balance, urinary sodium and potassium, basal body temperature, adverse events | |
| Study registration |
Trial identifier:Scinet (Science and Technology Information web page) Trial terminated early: no |
|
| Publication details |
Language of publication: English Commercial funding: grant from Lilly Research Laboratories. Authors received partial support from Fonds pour la Formation de chercheurs et l'aide à la recherche Publication status: full article |
|
| Stated aim for study | Quote from publication: "Determine whether increased energy expenditure contributes to this weight loss." | |
| Notes | 1. A priori sample size estimation: yes 2. Conflict of interest: not reported |
|
| Risk of bias | ||
| Bias | Authors' judgement | Support for judgement |
| Random sequence generation (selection bias) | Unclear risk |
Quote from publication: "... they were randomly assigned to …" (page 1020) Comment: insufficient information |
| Allocation concealment (selection bias) | Unclear risk |
Quote from publication: "... they were randomly assigned to …" (page 1020) Comment: insufficient information |
| Blinding of participants and personnel (performance bias) weight loss | Low risk | Quote from publication: "... in double blind fashion …" (page 1020) |
| Blinding of outcome assessment (detection bias) weight loss | Unclear risk | Comment: not reported |
| Incomplete outcome data (attrition bias) weight loss | Low risk | Comment: no missing data for primary outcome |
| Selective reporting (reporting bias) | Low risk | Comment: all the outcomes listed in the method section described in results |
| Other bias | Unclear risk | Comment: this study was funding by Lilly Research Laboratories |
Fernández‐Soto 1995.
| Study characteristics | ||
| Methods | Study design: cross‐over RCT (randomisation ratio 1:1) | |
| Participants |
Inclusion criteria: women with obesity Exclusion criteria: not reported Diagnostic criteria: BMI Setting: hospital Gender distribution: females Country/countries where trial was performed: Spain |
|
| Interventions |
Interventions: 1. Experimental group (EG): fluoxetine 60 mg orally, once per day for 3 months Comparator: 2. Control group (CG): placebo orally, once per day for 3 months Cointervention: diet 1200 kcal which maintained throughout the study, 2‐3 L/d no caloric liquids, vitamins, minerals and trace elements covered the requirements FDA and psychotherapy Duration of intervention: 6 months Duration of follow‐up: 7 months Run‐in period: no Number of study centres: 1 Treatment before study: no Titration period: no Treatment duration: 3 months each and 4 weeks washout period |
|
| Outcomes | Weight, pulse, count of unused medication, patients' report of medical problems, adverse events, glucose, urea, uric acid, creatinine, ions, total cholesterol, triglycerides, HDL‐cholesterol | |
| Study registration |
Trial identifier: — Trial terminated early: no |
|
| Publication details |
Language of publication: English Commercial funding: not reported Publication status: full article |
|
| Stated aim for study | Quote from publication: "Assesing the efficacy and safety of fluoxetine as compared with placebo in the treatment of obesity" | |
| Notes | 1. A priori sample size estimation: no 2. Conflict of interest: not reported |
|
| Risk of bias | ||
| Bias | Authors' judgement | Support for judgement |
| Random sequence generation (selection bias) | Unclear risk |
Quote from publication: “The participants were randomly assigned to two groups …" (page 160) Comment: insufficient information |
| Allocation concealment (selection bias) | Unclear risk |
Quote from publication: “The participants were randomly assigned to two groups …" (page 160) Comment: insufficient information |
| Blinding of participants and personnel (performance bias) adverse events | Low risk | Quote from publication: "... using a double blind crossover study ..." (page 160) |
| Blinding of participants and personnel (performance bias) weight loss | Low risk | Quote from publication: "... using a double blind crossover study ..." (page 160) |
| Blinding of outcome assessment (detection bias) adverse events | Unclear risk | Comment: not reported |
| Blinding of outcome assessment (detection bias) weight loss | Unclear risk | Comment: not reported |
| Incomplete outcome data (attrition bias) adverse events | Low risk |
Quote from publication: "By the end of the 7 months 5 participants in group A and 4 in group B had been withdrawn from the study" (page 161) Comment: data for primary outcome available for 78% of the randomised sample, with balanced reasons for withdrawals or losses to follow‐up |
| Incomplete outcome data (attrition bias) weight loss | Low risk |
Quote from publication: "By the end of the 7 months 5 participants in group A and 4 in group B had been withdrawn from the study" (page 161) Comment: data for primary outcome available for 78% of the randomised sample, with balanced reasons for withdrawals or losses to follow‐up |
| Selective reporting (reporting bias) | Low risk | Comment: all the outcomes listed in the Method section described in results |
| Other bias | Low risk | Comment: cross‐over design; appropriate design; order of receiving treatments randomised; no carry‐over effects; no unbiased data available |
Goldstein 1993.
| Study characteristics | ||
| Methods | Study design: parallel RCT (randomisation ratio 1:1:1), superiority design | |
| Participants |
Inclusion criteria: individuals were at least 18 years, BMI 30 kg/m² to 39 kg/m², women were neither pregnant nor lactating, had not used an appetite suppressant nor monoamine oxidase inhibitor within 2 weeks of starting the study nor other antidepressant drugs or lithium within 1 week of starting the study Exclusion criteria: non‐responders in qualification phase Diagnostic criteria: BMI, responders in qualification phase Setting: — Gender distribution: females & males Country/countries where trial was performed: USA |
|
| Interventions |
Interventions: I1. Experimental group A (EGA): fluoxetine 60 mg orally, once per day for 40 weeks I2. Experimental group B (EGB): fluoxetine 20 mg orally, once per day for 40 weeks Comparator: 3. Control group (CG): placebo orally, once per day for 40 weeks Cointervention: advised to reduce their overall caloric consumption and were offered a diet to lose 0.45 kg per week. Counselling about nutrition and behavior change varied among sites Duration of intervention: 40 weeks Duration of follow‐up: 40 weeks Run‐in period: 9 weeks (1 week with placebo + 8 weeks of qualification phase, single‐blind fluoxetine 60 mg/d) Number of study centres: 6 Treatment before study: fluoxetine 60 mg orally, once per day for 8 weeks (qualification phase) Titration period: no Treatment duration: 48 weeks |
|
| Outcomes | BP (sitting), pulse rate, oral temperature, carbohydrate craving scores, adverse events, urinalysis and blood chemistry, haematology | |
| Study registration |
Trial identifier: — Trial terminated early: no |
|
| Publication details |
Language of publication: English Commercial funding: not reported Publication status: full article |
|
| Stated aim for study | Quote from publication: "Compare the effects of the specific serotonin uptake inhibitor, fluoxetine hydrochloride and placebo on maintenance of weight loss..." | |
| Notes | 1. A priori sample size estimation: no 2. Conflict of interest: not reported |
|
| Risk of bias | ||
| Bias | Authors' judgement | Support for judgement |
| Random sequence generation (selection bias) | Unclear risk |
Quote from publication: "… were randomly assigned to …" (page 94) Comment: insufficient information |
| Allocation concealment (selection bias) | Unclear risk |
Quote from publication: "… were randomly assigned to …" (page 94) Comment: insufficient information |
| Blinding of participants and personnel (performance bias) adverse events | Low risk | Quote from publication: "… to double blind therapy ..." (page 94) |
| Blinding of participants and personnel (performance bias) morbidity | Low risk | Quote from publication: "… to double blind therapy ..." (page 94) |
| Blinding of participants and personnel (performance bias) weight loss | Low risk | Quote from publication: "… to double blind therapy ..." (page 94) |
| Blinding of outcome assessment (detection bias) adverse events | Unclear risk | Comment: not reported |
| Blinding of outcome assessment (detection bias) morbidity | Unclear risk | Comment: not reported |
| Blinding of outcome assessment (detection bias) weight loss | Unclear risk | Comment: not reported |
| Incomplete outcome data (attrition bias) adverse events | High risk |
Quote from publication: "... 115 participants failed to complete the study" (page 95) Comment: data available for 56.6% group fluoxetine 60 mg, 67.3% fluoxetine 20 mg and 67.3% placebo group |
| Incomplete outcome data (attrition bias) morbidity | High risk |
Quote from publication: "... 115 participants failed to complete the study" (page 95) Comment: data available for 56.6% group fluoxetine 60 mg, 67.3% fluoxetine 20 mg and 67.3% placebo group |
| Incomplete outcome data (attrition bias) weight loss | High risk |
Quote from publication: "... 115 participants failed to complete the study". (page 95) Comment: data available for 56.6% group fluoxetine 60 mg, 67.3% fluoxetine 20 mg and 67.3% placebo group |
| Selective reporting (reporting bias) | High risk | Comment: weight loss and morbidity outcomes were analysed but their results were not reported |
| Other bias | Low risk | Comment: no other potential source of bias. |
Goldstein 1994.
| Study characteristics | ||
| Methods | Study design: parallel RCT (randomisation ratio 1:1) | |
| Participants |
Inclusion criteria: at least 18 years of age and had a BMI of at least 25 kg/m² Exclusion criteria: women pregnant or lactating. Participants had used an appetite suppressant within 2 weeks of starting the study Diagnostic criteria: BMI Setting: multi‐centre Gender distribution: females & males Country/countries where trial was performed: USA |
|
| Interventions |
Invervention: 1. Experimental group (EG): fluoxetine 60 mg orally, once per day for 52 weeks Comparator: 2. Control group (CG): placebo orally, once per day for 52 weeks Cointervention: diet with caloric intake designed to produce a weight loss of 0.45 kg per week Duration of intervention: 52 weeks Duration of follow‐up: 52 weeks Run‐in period: 1 week Number of study centres: 10 Treatment before study: no Titration period: no Treatment duration: 52 weeks |
|
| Outcomes | Weight loss, adverse events, BP (sitting), heart rate, oral temperature, blood chemistry, haematology and urinalysis, compliance (capsule record cards) | |
| Study registration |
Trial identifier: — Trial terminated early: no |
|
| Publication details |
Language of publication: English Commercial funding: sponsored by Lilly Research Laboratories. Publication status: full article |
|
| Stated aim for study | Quote from publication: “... evaluate the effectiveness of fluoxetine in producing weight loss.” | |
| Notes | 1. A priori sample size estimation: no 2. Conflict of interest: not specified |
|
| Risk of bias | ||
| Bias | Authors' judgement | Support for judgement |
| Random sequence generation (selection bias) | Unclear risk |
Quote from publication: "… participants were randomly assigned ..." (page 130) Comment: insufficient information |
| Allocation concealment (selection bias) | Unclear risk |
Quote from publication: "… participants were randomly assigned ..." (page 130) Comment: insufficient information |
| Blinding of participants and personnel (performance bias) adverse events | Unclear risk |
Quote from publication: "The participants, observers, study personnel and sponsor were blinded to the treatment assignments" (page 130) Comment: insufficient information |
| Blinding of participants and personnel (performance bias) anthropometric measurements other than weight loss | Unclear risk |
Quote from publication: "The participants, observers, study personnel and sponsor were blinded to the treatment assignments" (page 130) Comment: insufficient information |
| Blinding of participants and personnel (performance bias) weight loss | Unclear risk |
Quote from publication: "The participants, observers, study personnel and sponsor were blinded to the treatment assignments" (page 130) Comment: insufficient information |
| Blinding of outcome assessment (detection bias) adverse events | Unclear risk |
Quote from publication: "The participants, observers, study personnel and sponsor were blinded to the treatment assignments" (page 130) Comment: insufficient information |
| Blinding of outcome assessment (detection bias) anthropometric measurements other than weight loss | Unclear risk |
Quote from publication: "The participants, observers, study personnel and sponsor were blinded to the treatment assignments" (page 130) Comment: insufficient information |
| Blinding of outcome assessment (detection bias) weight loss | Unclear risk |
Quote from publication: "The participants, observers, study personnel and sponsor were blinded to the treatment assignments" (page 130) Comment: insufficient information |
| Incomplete outcome data (attrition bias) adverse events | High risk |
Quote from publication: "... individuals who completed the study were similar for the fluoxetine (N = 99) and placebo (N = 108) ..." (page 132) Comment: data for primary outcome available for 50.7% of the randomised sample |
| Incomplete outcome data (attrition bias) anthropometric measurements other than weight loss | High risk |
Quote from publication: "... participants who completed the study were similar for the fluoxetine (N = 99) and placebo (N = 108) ..." (page 132) Comment: data for primary outcome available for 50.7% of the randomised sample |
| Incomplete outcome data (attrition bias) weight loss | High risk |
Quote from publication: "... participants who completed the study were similar for the fluoxetine (N = 99) and placebo (N = 108) ..." (page 132) Comment: data for primary outcome available for 50.7% of the randomised sample |
| Selective reporting (reporting bias) | High risk | Comment: anthropometric measurements other than weight loss outcomes were analysed but only reports that results were not significant (see Appendix 9) |
| Other bias | Unclear risk | Comment: this trial was sponsored by Lilly Research Laboratories |
Guimaraes 2006.
| Study characteristics | ||
| Methods | Study design: parallel RCT (randomisation ratio 1:1:1:1) | |
| Participants |
Inclusion criteria: BMI > 30 kg/m² Exclusion criteria: alcoholic, diabetes, pregnant and nursing women, acquired immunodeficiency and those with viral liver infection Diagnostic criteria: BMI Setting: University of Riberao Preto Gender distribution: females & males Country/countries where trial was performed: Brazil |
|
| Interventions |
Interventions: I1. Experimental group A (EGA): sibutramine 15 mg orally for 90 days I2. Experimental group B (EGB): metformin 1700 mg orally for 90 days I3. Experimental group C (EGC): fluoxetine 60 mg orally for 90 days Comparator: 4. Control group (CG): placebo orally for 90 days Cointervention: dietary re‐education containing on average 1500 kcal/d Duration of intervention: 90 days Duration of follow‐up: 90 days Run‐in period: 6 months Number of study centres: 1 Treatment before study: dietary reeducation for 6 months Titration period: no Treatment duration: 90 days |
|
| Outcomes | BMI, weight, abdominal circumference, % fatty tissue, HDL‐cholesterol, triglycerides, systolic and diastolic BP, adverse events, HOMA, insulin, glycaemia | |
| Study registration |
Trial identifier: — Trial terminated early: no |
|
| Publication details |
Language of publication: English Other funding: Faculty of Pharmaceutical Sciences of Riberao Preto, University of Sao Paulo and CAPES Publication status: full article |
|
| Stated aim for study | Quote from publication: "Assess the effects of sibutramine, fluoxetine and metformin as an adjunct therapy to a 1500 kcal/d diet in reducing anthropometric and metabolic parameters" | |
| Notes | 1. A priori sample size estimation: not reported 2. Conflict of interest: not reported |
|
| Risk of bias | ||
| Bias | Authors' judgement | Support for judgement |
| Random sequence generation (selection bias) | Unclear risk |
Quote from publication: "This study was randomized ..." (page 1021) Comment: insufficient information |
| Allocation concealment (selection bias) | Unclear risk |
Quote from publication: "This study was randomized ..." (page 1021) Comment: insufficient information |
| Blinding of participants and personnel (performance bias) adverse events | High risk |
Quote from publication: "This study was randomized and single blind" (page 1021) Comment: outcome measure likely influenced by lack of blinding for either participant or study personnel |
| Blinding of participants and personnel (performance bias) anthropometric measurements other than weight loss | High risk |
Quote from publication: "This study was randomized and single blind" (page 1021) Comment: outcome measure likely influenced by lack of blinding for either participant or study personnel |
| Blinding of participants and personnel (performance bias) weight loss | High risk |
Quote from publication: "This study was randomized and single blind" (page 1021) Comment: outcome measure likely influenced by lack of blinding for either participant or study personnel |
| Blinding of outcome assessment (detection bias) adverse events | Unclear risk | Comment: not reported |
| Blinding of outcome assessment (detection bias) anthropometric measurements other than weight loss | Unclear risk | Comment: not reported |
| Blinding of outcome assessment (detection bias) weight loss | Unclear risk | Comment: not reported |
| Incomplete outcome data (attrition bias) adverse events | Low risk | Comment: no missing data for primary outcome |
| Incomplete outcome data (attrition bias) anthropometric measurements other than weight loss | Low risk | Comment: no missing data for primary outcome |
| Incomplete outcome data (attrition bias) weight loss | Low risk | Comment: no missing data for primary outcome |
| Selective reporting (reporting bias) | High risk | Comment: adverse events were analysed but no results reported (see Appendix 9) |
| Other bias | Low risk | Comment: no other potential source of bias |
Huang 1998.
| Study characteristics | ||
| Methods | Study design: parallel RCT (randomisation ratio 1:1) | |
| Participants |
Inclusion criteria: either sex, between 17 and 65 years old, who demonstrated no significant clinical problems other than moderate obesity (30% over the ideal body weight according Huang's formula) Exclusion criteria: individuals using antidepressants, monoamine oxidase inhibitors, neuroleptics and anti epileptics, chronic alcoholism and individuals who were suspected to be non‐compliant with treatment Diagnostic criteria: obese moderate (130% of IBW) Setting: hospital Gender distribution: females & males Country/countries where trial was performed: Republic of China |
|
| Interventions |
Interventions: 1. Experimental group (EG): fluoxetine 60 mg orally, once per day for 12 weeks Comparator: 2. Control group (CG): no treatment Cointervention: participants were instructed to follow a weight‐reducing low calorie diet ([25‐35 kcal/d adjusted to work load * ideal body weight ‐ 500 kcal]. The energy distribution of the diet consisted of 50% carbohydrates, 20% protein and 30% fat. Duration of intervention: 12 weeks Duration of follow‐up: 12 weeks Run‐in period: no Number of study centres: 1 Treatment before study: no Titration period: no Treatment duration: 12 weeks |
|
| Outcomes | Body weight, BMI, BP, fasting blood sugar, triglycerides, total cholesterol, uric acid, glutamic pyruvic transaminase (GPT), alkaline phosphatase (AP), adverse events | |
| Study registration |
Trial identifier: — Trial terminated early: no |
|
| Publication details |
Language of publication: English Commercial funding: not reported Publication status: full article |
|
| Stated aim for study | Quote from publication: "Assess the possible weight‐reducing effects of fluoxetine in obese Taiwanese" | |
| Notes | 1. A priori sample size estimation: no reported 2. Conflict of interest: not reported |
|
| Risk of bias | ||
| Bias | Authors' judgement | Support for judgement |
| Random sequence generation (selection bias) | Unclear risk |
Quote from publication: "All participants were randomized to receive ...” (page 50) Comment: insufficient information |
| Allocation concealment (selection bias) | Unclear risk |
Quote from publication: "All participants were randomized to receive ...” (page 50) Comment: insufficient information |
| Blinding of participants and personnel (performance bias) adverse events | High risk | Comment: the experimental group received the intervention, while the control group did not receive any intervention |
| Blinding of participants and personnel (performance bias) anthropometric measurements other than weight loss | High risk | Comment: the experimental group received the intervention, while the control group did not receive any intervention |
| Blinding of participants and personnel (performance bias) weight loss | High risk | Comment: the experimental group received the intervention, while the control group did not receive any intervention |
| Blinding of outcome assessment (detection bias) adverse events | Unclear risk | Comment: not reported |
| Blinding of outcome assessment (detection bias) anthropometric measurements other than weight loss | Unclear risk | Comment: not reported |
| Blinding of outcome assessment (detection bias) weight loss | Unclear risk | Comment: not reported |
| Incomplete outcome data (attrition bias) adverse events | Low risk |
Quote from publication: "individuals who completed less than 4 weeks of the treatment were excluded from the efficacy analysis based on 50 participants" (page 51) Comment: data for primary outcome available for 83.3% of the randomised sample, with balanced reasons for withdrawals or losses to follow‐up |
| Incomplete outcome data (attrition bias) anthropometric measurements other than weight loss | Low risk |
Quote from publication: "individuals who completed less than 4 weeks of the treatment were excluded from the efficacy analysis based on 50 participants" (page 51) Comment: data for primary outcome available for 83.3% of the randomised sample, with balanced reasons for withdrawals or losses to follow‐up |
| Incomplete outcome data (attrition bias) weight loss | Low risk |
Quote from publication: "individuals who completed less than 4 weeks of the treatment were excluded from the efficacy analysis based on 50 participants" (page 51) Comment: data for primary outcome available for 83.3% of the randomised sample, with balanced reasons for withdrawals or losses to follow‐up |
| Selective reporting (reporting bias) | Low risk | Comment: all the outcomes listed in the Method section described in results |
| Other bias | Low risk | Comment: no other potential source of bias |
Kopelman 1992.
| Study characteristics | ||
| Methods | Study design: cross‐over RCT | |
| Participants |
Inclusion criteria: extremely obese but asymptomatic, normal thyroid function and were not taking any regular medication at the time of the study Exclusion criteria: evidence on direct laryngoscopy of obstruction or narrowing of the pharynx or larynx. Diagnostic criteria: BMI Setting: hospital Gender distribution: females & males Country/countries where trial was performed: UK |
|
| Interventions |
Intervention: 1. Experimental group (EG): fluoxetine 60 mg, orally per day for 3 days Comparator: 2. Control group (CG): placebo orally, once per day for 3 days Cointervention: none Duration of intervention: 3 days Duration of follow‐up: 5 weeks Run‐in period: no Number of study centres: 1 Treatment before study: no, for any of the groups Titration period: not reported Treatment duration: 3 days and 4 weeks washout period |
|
| Outcomes | Sleep‐breathing patterns, weight loss, adverse events, BP, haematology, nocturnal arterial oxygen saturation, apnoea/hypopnoea index, total sleep time, qualitative assessment of sleep | |
| Study registration |
Trial identifier: — Trial terminated early: no |
|
| Publication details |
Language of publication: English Commercial funding: not reported Publication status: full article |
|
| Stated aim for study | Quote from publication: "… whether the compound may have a role in the management of the obese hypoventilation syndrome and investigated this by evaluating the effect of three days treatment with fluoxetine on the sleep‐breathing patterns in extremely obese, but asymptomatic individuals." | |
| Notes | 1. A priori sample size estimation: not reported 2. Conflict of interest: not reported |
|
| Risk of bias | ||
| Bias | Authors' judgement | Support for judgement |
| Random sequence generation (selection bias) | Unclear risk |
Quote from publication: "… participants were assigned at random to one of two treatment schedules …" (page 826) Comment: insufficient information |
| Allocation concealment (selection bias) | Unclear risk |
Quote from publication: "… participants were assigned at random to one of two treatment schedules …" (page 826) Comment: insufficient information |
| Blinding of participants and personnel (performance bias) adverse events | Low risk | Quote from publication: "A double‐blind cross‐over placebo‐drug trial was used to …" (page 826) |
| Blinding of participants and personnel (performance bias) weight loss | Low risk | Quote from publication: "A double‐blind cross‐over placebo‐drug trial was used to …" (page 826) |
| Blinding of outcome assessment (detection bias) adverse events | Unclear risk | Comment: not reported |
| Blinding of outcome assessment (detection bias) weight loss | Unclear risk | Comment: not reported |
| Incomplete outcome data (attrition bias) adverse events | Low risk | Comment: no missing data for primary outcome |
| Incomplete outcome data (attrition bias) weight loss | Low risk | Comment: no missing data for primary outcome |
| Selective reporting (reporting bias) | High risk | Comment: adverse events were analysed but only reports that results were not significant (see Appendix 9) |
| Other bias | Low risk | Comment: cross‐over design; appropriate design; unclear randomised order of receiving treatments; no carry‐over effects; no unbiased data available |
Lawton 1995.
| Study characteristics | ||
| Methods | Study design: cross‐over RCT | |
| Participants |
Inclusion criteria: females, BMI > 30 kg/m², intent to diet or to restrict food intake (score > 12) Exclusion criteria: none Diagnostic criteria: BMI and intention to diet or to restrict food intake Setting: obesity clinic of the general infirmary Gender distribution: females Country/countries where trial was performed: UK |
|
| Interventions |
Intervention: 1. Experimental group (EG): fluoxetine 60 mg orally, once per day for 2 weeks Comparator: 2. Control group (CG): placebo orally, once per day for 2 weeks Cointervention: diet: each treatment phase incorporated 2 separate test days on which the participant response to either a high carbohydrates or a high‐fat meal was assessed (days 7 and 14). Participants received these meals in a counterbalanced order. The order of presentation of these meals in the first treatment phase was swapped in the second treatment phase Duration of intervention: 2 weeks Duration of follow‐up: 8 weeks Run‐in period: "A 3‐day placebo run‐in period preceded each 14‐day treatment phase " (page 346) Number of study centres: 1 Treatment before study: no Titration period: no Treatment duration: 2 weeks each and 6 weeks washout period |
|
| Outcomes | Satiety, weight loss, adverse events, appetite, energy intake, macronutrient intake, motivational ratings (hunger), food intake preferences, post‐lunch meal palatability rating, blood and urine analyses, check of concomitant medication, resting pulse, BP | |
| Study registration |
Trial identifier: — Trial terminated early: no |
|
| Publication details |
Language of publication: English Commercial funding: Lilly Research Laboratories Publication status: full article |
|
| Stated aim for study | Quote from publication: “Investigate the effect of 5‐HT stimulation on the capacity of high CHO and high‐fat foods to control appetite in obese individuals”. | |
| Notes | 1. A priori sample size estimation: not reported 2. Conflict of interest: not specified |
|
| Risk of bias | ||
| Bias | Authors' judgement | Support for judgement |
| Random sequence generation (selection bias) | Unclear risk |
Quote from publication: "… randomized cross over design" (page 346) Comment: insufficient information |
| Allocation concealment (selection bias) | Unclear risk |
Quote from publication: "the study medication was administered in the form of a kit specific to each participant. The kit number determined which medication ... the individual was to receive in each treatment phase" (page 346) Comment: insufficient information |
| Blinding of participants and personnel (performance bias) adverse events | Low risk | Quote from publication: "The study conformed to a 2‐week double blind randomized cross over design with a minimum 6‐week washout and crossover period" (page 346) |
| Blinding of participants and personnel (performance bias) weight loss | Low risk | Quote from publication: "The study conformed to a 2‐week double blind randomized cross over design with a minimum 6‐week washout and crossover period" (page 346) |
| Blinding of outcome assessment (detection bias) adverse events | Unclear risk | Comment: not reported |
| Blinding of outcome assessment (detection bias) weight loss | Unclear risk | Comment: not reported |
| Incomplete outcome data (attrition bias) adverse events | Low risk |
Quote from publication: "One participant failed to return after the second visit and decided to withdraw. Twelve evaluable participants completed the study." (page 346) Comment: data for primary outcome available for 92% of the randomised sample, with balanced reasons for withdrawals or losses to follow‐up |
| Incomplete outcome data (attrition bias) weight loss | Low risk |
Quote from publication: "One participant failed to return after the second visit and decided to withdraw. Twelve evaluable participants completed the study." (page 346) Comment: data for primary outcome available for 92% of the randomised sample, with balanced reasons for withdrawals or losses to follow‐up |
| Selective reporting (reporting bias) | Low risk | Comment: all the outcomes listed in the method section described in results |
| Other bias | Unclear risk |
Comment: the trial was sponsored by Lilly Research Laboratories Comment: carry‐over effects unclear |
Levine 1987.
| Study characteristics | ||
| Methods | Study design: parallel RCT (randomisation ratio 1:1) | |
| Participants |
Inclusion criteria: non‐depressed of either sex, between 18 and 65 years, having no significant medical problems. Obesity. Individuals had not taken used an appetite suppressant or other psychotropic drug within 2 weeks of starting the study Exclusion criteria: women who were pregnant or lactating Diagnostic criteria: medical history, physical examination, scalar electrocardiogram, routine blood chemical and hematological test and urinalysis Setting: — Gender distribution: females & males Country/countries where trial was performed: USA |
|
| Interventions |
Intervention: 1. Experimental group (EG): fluoxetine 20 mg single dose on day 1, 40 mg for the next 2 days, 60 mg for 11 days, 40 mg to 80 mg at the discretion of the investigator Comparator: 2. Control group (CG): placebo for 8 weeks Cointervention: individuals were advised to reduce overall calorie consumption by 20%, but were given no other dietary advice Duration of intervention: 11 days Duration of follow‐up: 8 weeks Run‐in period: no Number of study centres: 1 Treatment before study: no Titration period: no Treatment duration: 11 days |
|
| Outcomes | Weight loss (kg), anthropometric measurements other than weight loss in kilograms (BMI), adverse events, morbidity (blood pressure, heart rate, changes in the electrocardiogram) | |
| Study registration |
Trial identifier: — Trial terminated early: no |
|
| Publication details |
Language of publication: English Commercial funding: none declared but the principal author works in Lilly Research Laboratories Publication status: full article |
|
| Stated aim for study | Quote from publication: "Each patient was given fluoxetine or placebo for 8 weeks in conjunction with minimal dietary advice, and body weight was determined weekly." (page 186) | |
| Notes | 1. A priori sample size estimation: not reported 2. Conflict of interest: not reported |
|
| Risk of bias | ||
| Bias | Authors' judgement | Support for judgement |
| Random sequence generation (selection bias) | Unclear risk |
Quote from publication: "Participants were randomly and blindly assigned to receive …" (page 186) Comment: insufficient information |
| Allocation concealment (selection bias) | Unclear risk |
Quote from publication: "Participants were randomly and blindly assigned to receive …" (page 186) Comment: insufficient information |
| Blinding of participants and personnel (performance bias) adverse events | High risk |
Quote from publication: "Participants were randomly and blindly assigned ..." (page 186) Comment: outcome likely influenced by lack of blinding of study personnel |
| Blinding of participants and personnel (performance bias) anthropometric measurements other than weight loss | High risk |
Quote from publication: "Participants were randomly and blindly assigned ..." (page 186) Comment: outcome likely influenced by lack of blinding of study personnel |
| Blinding of participants and personnel (performance bias) morbidity | High risk |
Quote from publication: "Participants were randomly and blindly assigned ..." (page 186) Comment: outcome likely influenced by lack of blinding of study personnel |
| Blinding of participants and personnel (performance bias) weight loss | High risk |
Quote from publication: "Participants were randomly and blindly assigned ..." (page 186) Comment: outcome likely influenced by lack of blinding of study personnel |
| Blinding of outcome assessment (detection bias) adverse events | Unclear risk | Comment: not reported |
| Blinding of outcome assessment (detection bias) anthropometric measurements other than weight loss | Unclear risk | Comment: not reported |
| Blinding of outcome assessment (detection bias) morbidity | Unclear risk | Comment: not reported |
| Blinding of outcome assessment (detection bias) weight loss | Unclear risk | Comment: not reported |
| Incomplete outcome data (attrition bias) adverse events | Low risk |
Quote from publication: "Only 100 participants (52 placebo and 48 in fluoxetine group) completing the study" (page 187) Comment: data for primary outcome available for 83% of the randomised sample, with balanced reasons for withdrawals or losses to follow‐up |
| Incomplete outcome data (attrition bias) anthropometric measurements other than weight loss | Low risk |
Quote from publication: "Only 100 participants (52 placebo and 48 in fluoxetine group) completing the study" (page 187) Comment: data for primary outcome available for 83% of the randomised sample, with balanced reasons for withdrawals or losses to follow‐up |
| Incomplete outcome data (attrition bias) morbidity | Low risk |
Quote from publication: "Only 100 participants (52 placebo and 48 in fluoxetine group) completing the study" (page 187) Comment: data for primary outcome available for 83% of the randomised sample, with balanced reasons for withdrawals or losses to follow‐up |
| Incomplete outcome data (attrition bias) weight loss | Low risk |
Quote from publication: "Only 100 participants (52 placebo and 48 in fluoxetine group) completing the study" (page 187) Comment: data for primary outcome available for 83% of the randomised sample, with balanced reasons for withdrawals or losses to follow‐up |
| Selective reporting (reporting bias) | High risk | Comment: anthropometric measurements other than weight loss were measured but not analysed (see Appendix 9) |
| Other bias | Unclear risk | Comment: the principal author worked in Lilly Research Laboratories but did not specify conflict of interest |
Levine 1989.
| Study characteristics | ||
| Methods | Study design: parallel RCT (randomisation ratio 1:1:1:1:1) | |
| Participants |
Inclusion criteria: individuals weighed 20% to 100% in excess of ideal body weight, 18 to 65 years and were not pregnant or lactating Exclusion criteria: suspicion of clinical depression: Hopkins Symptom Checklist. Serious medical illness, use of an appetite suppressant within 2 weeks of starting the study; and use of diuretics, antidepressant or other drugs which could affect body weight Diagnostic criteria: ideal body weight Setting: — Gender distribution: females & males Country/countries where trial was performed: USA |
|
| Interventions |
Interventions: I1. Experimental group A (EGA): fluoxetine 10 mg orally, once per day for 8 weeks I2. Experimental group B (EGB): fluoxetine 20 mg orally, once per day for 8 weeks I3. Experimental group C (EGC): fluoxetine 40 mg orally, once per day for 8 weeks I4. Experimental group D (EGD): fluoxetine 60 mg orally, once per day for 8 weeks Comparator: 5. Control group (CG): placebo once daily Cointervention: none Duration of intervention: 8 weeks Duration of follow‐up: 8 weeks Run‐in period: no Number of study centres: 8 Treatment before study: no Titration period: no Treatment duration: 8 weeks |
|
| Outcomes | Weight loss, BMI, adverse events, BP, heart rate | |
| Study registration |
Trial identifier: — Trial terminated early: no |
|
| Publication details |
Language of publication: English Commercial funding: none declared but the principal author works in Lilly Research Laboratories Publication status: full article |
|
| Stated aim for study | Quote from publication: "Assess the dose‐response relationship of a fixed daily dose of this specific serotoninergic agent on weight loss of non depressed obese participants" | |
| Notes | 1. A priori sample size estimation: not reported 2. Conflict of interest: not reported |
|
| Risk of bias | ||
| Bias | Authors' judgement | Support for judgement |
| Random sequence generation (selection bias) | Unclear risk |
Quote from publication: "Participants were allocated randomly to one of the five treatment groups ..." (page 636) Comment: insufficient information |
| Allocation concealment (selection bias) | Unclear risk |
Quote from publication: "Participants, investigators and monitors were all blinded ..." (page 636) Comment: insufficient information |
| Blinding of participants and personnel (performance bias) adverse events | Low risk | Quote from publication: "Participants, investigators and monitors were all blinded ..." (page 636) |
| Blinding of participants and personnel (performance bias) anthropometric measurements other than weight loss | Low risk | Quote from publication: "Participants, investigators and monitors were all blinded ..." (page 636) |
| Blinding of participants and personnel (performance bias) weight loss | Low risk | Quote from publication: "Participants, investigators and monitors were all blinded ..." (page 636) |
| Blinding of outcome assessment (detection bias) adverse events | Unclear risk | Comment: not reported |
| Blinding of outcome assessment (detection bias) anthropometric measurements other than weight loss | Unclear risk | Comment: not reported |
| Blinding of outcome assessment (detection bias) weight loss | Unclear risk | Comment: not reported |
| Incomplete outcome data (attrition bias) adverse events | High risk |
Quote from publication: "417 participants remained in the study" (page 639) Comment: data for primary outcome available for 63.6% of the randomised sample |
| Incomplete outcome data (attrition bias) anthropometric measurements other than weight loss | High risk |
Quote from publication: "417 participants remained in the study" (page 639) Comment: data for primary outcome available for 63.6% of the randomised sample |
| Incomplete outcome data (attrition bias) weight loss | High risk |
Quote from publication: "417 participants remained in the study" (page 639) Comment: data for primary outcome available for 63.6% of the randomised sample |
| Selective reporting (reporting bias) | High risk | Comment: weight loss was analysed but their results were not reported (see Appendix 9) |
| Other bias | Low risk | Comment: none detected |
Pedrinola 1993.
| Study characteristics | ||
| Methods | Study design: parallel RCT (randomisation ratio 1:1) | |
| Participants |
Inclusion criteria: adult male and female aged 20‐50 years with BMI > 30 kg/m² Exclusion criteria: pregnancy, hypertension, diabetes mellitus, lactation, use of depression suppressants, and serious medical illness Diagnostic criteria: BMI Setting: outpatient endocrinology clinic of the clinical hospital of the university of Sao Paulo Gender distribution: females & males Country/countries where trial was performed: Brazil |
|
| Interventions |
Intervention: 1. Experimental group (EG): fluoxetine 20 mg orally, twice per day for 12 weeks Comparator: 2. Control group (CG): placebo orally, twice per day for 12 weeks Cointervention: individuals were counselled by a dietitian to follow a standard 1000 kcal Duration of intervention: 12 weeks Duration of follow‐up: 12 weeks Run‐in period: 2 weeks Number of study centres: 1 Treatment before study: no Titration period: no Treatment duration: 12 weeks |
|
| Outcomes | Weight loss, BMI, adverse events, cholesterol, triglycerides | |
| Study registration |
Trial identifier: — Trial terminated early: no |
|
| Publication details |
Language of publication: English Commercial funding: donation of fluoxetine by Farmasa SA Publication status: full article |
|
| Stated aim for study | Quote from publication: "... investigate the effects of fluoxetine in a double ‐blind, placebo‐controlled randomized trial in non‐depressed obese individuals" | |
| Notes | 1. A priori sample size estimation: not reported 2. Conflict of interest: not reported |
|
| Risk of bias | ||
| Bias | Authors' judgement | Support for judgement |
| Random sequence generation (selection bias) | Unclear risk |
Quote from publication: "... the participants were randomized for …" (page 31); information by trial author: "both groups included patients randomly selected from our outpatient clinic" Comment: insufficient information |
| Allocation concealment (selection bias) | Unclear risk |
Quote from publication: "… for a double‐blind, placebo controlled trial" (page 31); information by trial author: "patients were allocated to each group without previous selection" Comment: insufficient information |
| Blinding of participants and personnel (performance bias) adverse events | Unclear risk |
Quote from publication: "… for a double‐blind, placebo controlled trial" (page 31); information by trial author: "the personnel of the hospital were blind if the patients were from one or another group" Comment: insufficient information |
| Blinding of participants and personnel (performance bias) anthropometric measurements other than weight loss | Unclear risk |
Quote from publication: "… for a double‐blind, placebo controlled trial" (page 31); information by trial author: "the personnel of the hospital were blind if the patients were from one or another group" Comment: insufficient information |
| Blinding of participants and personnel (performance bias) weight loss | Unclear risk |
Quote from publication: "… for a double‐blind, placebo controlled trial" (page 31); information by trial author: "the personnel of the hospital were blind if the patients were from one or another group" Comment: insufficient information |
| Blinding of outcome assessment (detection bias) adverse events | High risk | Comment (information by trial author): "there was no blinding of outcome of assessment" |
| Blinding of outcome assessment (detection bias) anthropometric measurements other than weight loss | High risk | Comment (information by trial author): "there was no blinding of outcome of assessment" |
| Blinding of outcome assessment (detection bias) weight loss | High risk | Comment (information by trial author): "there was no blinding of outcome of assessment" |
| Incomplete outcome data (attrition bias) adverse events | Low risk |
Quote from publication: "Two participants…dropped out" (page 32) Comment: data for primary outcome available for 90% of the randomised sample, with balanced reasons for withdrawals or losses to follow‐up |
| Incomplete outcome data (attrition bias) anthropometric measurements other than weight loss | Low risk |
Quote from publication: "Two participants…dropped out" (page 32) Comment: data for primary outcome available for 90% of the randomised sample, with balanced reasons for withdrawals or losses to follow‐up |
| Incomplete outcome data (attrition bias) weight loss | Low risk |
Quote from publication: "Two participants…dropped out" (page 32) Comment: data for primary outcome available for 90% of the randomised sample, with balanced reasons for withdrawals or losses to follow‐up |
| Selective reporting (reporting bias) | High risk | Comment: adverse events were analysed but only reports that results were not significant (see Appendix 9) |
| Other bias | Low risk | Comment: no other potential source of bias |
Pijl 1991.
| Study characteristics | ||
| Methods | Study design: parallel RCT (randomisation ratio 1:1) | |
| Participants |
Inclusion criteria: BMI > 30 kg/m² Exclusion criteria: depression (Hamilton Depression Scale score > 10), pregnancy, use of an anorectic drug in a period of 2 months preceding and unstable body weight (± 2 kg) in the 2 weeks prior to the study Diagnostic criteria: BMI Setting: clinic of internal medicine for obesity, university hospital Gender distribution: females Country/countries where trial was performed: the Netherlands |
|
| Interventions |
Intervention: 1. Experimental group (EG): fluoxetine 60 mg orally, once per day for 6 weeks Comparator: 2. Control group (CG): placebo orally, once per day for 6 weeks Cointervention: none Duration of intervention: 6 weeks Duration of follow‐up: 6 weeks Run‐in period: 1 week single blind placebo Number of study centres: 1 Treatment before study: no Titration period: no Treatment duration: 6 weeks |
|
| Outcomes | Body weight, total caloric intake, macronutrient selection, adverse events, spontaneous food choice | |
| Study registration |
Trial identifier: — Trial terminated early: no |
|
| Publication details |
Language of publication: English Commercial funding: grant provided by Lilly Research Laboratories Publication status: full article |
|
| Stated aim for study | Quote from publication: “Determine the effect of serotonin re‐uptake inhibition on body weight, total caloric intake and macronutrient selection” | |
| Notes | 1. A priori sample size estimation: not reported 2. Conflict of interest: not reported |
|
| Risk of bias | ||
| Bias | Authors' judgement | Support for judgement |
| Random sequence generation (selection bias) | Low risk | Quote from publication: "... participants received..in random order.." (page 238); information by trial author: "we used a computer random sequence generator for random sequence generation" |
| Allocation concealment (selection bias) | Low risk | Quote from publication: "... participants received..in random order.." (page 238); information by trial author: "treatments were allocated in order of inclusion/study number. The medication and placebo were provided by the pharmacy to the study staff in boxes labelled with study numbers of patients" |
| Blinding of participants and personnel (performance bias) adverse events | Low risk | Quote from publication: "... participants received..under double blind conditions" (page 238); information by trial author: "participants and study staff were not aware of treatment allocation (Prozac and placebo were provided in similar capsules and boxes which were provided by the pharmacy and labelled with study number)" |
| Blinding of participants and personnel (performance bias) weight loss | Low risk | Quote from publication: "... participants received..under double blind conditions" (page 238); information by trial author: "participants and study staff were not aware of treatment allocation (Prozac and placebo were provided in similar capsules and boxes which were provided by the pharmacy and labelled with study number)" |
| Blinding of outcome assessment (detection bias) adverse events | Unclear risk | Comment: insufficient information |
| Blinding of outcome assessment (detection bias) weight loss | Unclear risk | Comment: insufficient information |
| Incomplete outcome data (attrition bias) adverse events | Low risk |
Quote from publication: "Twenty‐three participants were evaluable at the end of the study" (page 239) Comment: data for primary outcome available for 95.3% of the randomised sample, with balanced reasons for withdrawals or losses to follow‐up |
| Incomplete outcome data (attrition bias) weight loss | Low risk |
Quote from publication: "Twenty‐three participants were evaluable at the end of the study" (page 239) Comment: data for primary outcome available for 95.3% of the randomised sample, with balanced reasons for withdrawals or losses to follow‐up |
| Selective reporting (reporting bias) | Low risk | Comment: all the outcomes listed in the Method section described in results |
| Other bias | Low risk | Comment: no other potential source of bias |
Stinson 1992.
| Study characteristics | ||
| Methods | Study design: cross‐over RCT | |
| Participants |
Inclusion criteria: healthy (normal ECG, haematological and biochemical screen) males < 65 years and post‐menopausal women attending the obesity clinic, no history of depression or medication known to interfere with metabolism Exclusion criteria: history of depression and medication known to interfere with metabolism; use of biguanides, bulking agents, thyroid hormones or beta blockers. Recent use of antidepressants or appetite suppressant drugs, weight loss greater than 2.5 kg in previous 2 months, any major illness in previous 6 months Setting: hospital Gender distribution: females & males Country/countries where trial was performed: Ireland |
|
| Interventions |
Intervention: 1. Experimental group (EG): fluoxetine 60 mg orally, once per day for 2 weeks Comparator: 2. Control group (CG): placebo orally, once per day for 2 weeks Cointervention: no Duration of intervention: 2 weeks Duration of follow‐up: 10 weeks Run‐in period: 2 weeks placebo Number of study centres: 1 Treatment before study: none Titration period: no Treatment duration: 2 weeks for each intervention and 6 weeks of wash‐out period |
|
| Outcomes | Resting metabolic rate, diet induced thermogenesis, weight reduction, BP, serum urea and creatinine levels, hematocrit | |
| Study registration |
Trial identifier: — Trial terminated early: no |
|
| Publication details |
Language of publication: English Commercial funding: Lilly Research Laboratories Publication status: full article |
|
| Stated aim for study | Quote from publication: "The aim of this study was to ascertain whether some of the weight reducing effect of fluoxetine is due to an increase in resting metabolic rate and/or an increase” | |
| Notes | 1. A priori sample size estimation: yes 2. Conflict of interest: not reported |
|
| Risk of bias | ||
| Bias | Authors' judgement | Support for judgement |
| Random sequence generation (selection bias) | Unclear risk |
Quote from publication: "… the study was randomized." (page 392) Comment: insufficient information |
| Allocation concealment (selection bias) | Unclear risk |
Quote from publication: "The study was randomized double blind …" (page 392) Comment: insufficient information |
| Blinding of participants and personnel (performance bias) weight loss | Low risk | Quote from publication: "The study was… double blind …" (page 392) |
| Blinding of outcome assessment (detection bias) weight loss | Unclear risk | Comment: not reported |
| Incomplete outcome data (attrition bias) weight loss | Low risk | Comment: no missing data for primary outcome |
| Selective reporting (reporting bias) | Low risk | Comment: not detected |
| Other bias | Unclear risk |
Comment: this study was supported by a grant from Lilly Research Laboratories Comment: no carry‐over effects |
Suplicy 2014.
| Study characteristics | ||
| Methods | Study design: parallel RCT (randomisation ratio 1:1:1:1:1:1) | |
| Participants |
Inclusion criteria: premenopausal women, 18 to 50 years, BMI 30 kg/m² to 39.9 kg/m², weight stable within the previous 3 months (< 3 kg) Exclusion criteria: male, previous bariatric surgery, menopause, pregnancy or lactation, desire to become pregnant during the study, uncontrolled hypertension (160/100 mmHg at the time of enrolment), diabetes mellitus, clinically significant history diseases or drug/alcohol abuse, use of medications that could alter body weight Diagnostic criteria: BMI Setting: obesity outpatient clinic of the endocrine division (SEMPR) of the Clinical Hospital of the Federal University of Paraná Gender distribution: females Country/countries where trial was performed: Brazil |
|
| Interventions |
Interventions: I1. Experimental group A (EGA): diethylpropion 75 mg orally, once per day for 52 weeks I2. Experimental group B (EGB): fenproporex 25 mg orally, once per day for 52 weeks I3. Experimental group C (EGC): mazindol 2 mg orally, once per day for 52 weeks I4. Experimental group D (EGD): sibutramine 15 mg orally, once per day for 52 weeks I5. Experimental group E (EGE): fluoxetine 20 mg orally, once per day for 52 weeks Comparator: 6. Control group (CG): placebo orally, once per day for 52 weeks Cointervention: balanced hypocaloric diet and were encouraged to maintain at least 150 minutes per week of moderate physical activity Duration of intervention: 52 weeks Duration of follow‐up: 52 weeks Run‐in period: 2 weeks Number of study centres: 1 Treatment before study: no Titration period: no Treatment duration: 52 weeks |
|
| Outcomes | Differences in weight loss, changes from the baseline values in anthropometric measures (waist circumference, BMI), safety was evaluated by reports of adverse events in the follow‐up visits, with an emphasis on serious events and events that led to the patient’s discontinuation. Key secondary safety endpoints included changes from the baseline in measures of blood pressure, heart rate, serum lipids (total cholesterol, low‐density lipoprotein cholesterol, high‐density lipoprotein cholesterol and triglycerides, glycaemic variables (fasting glucose, fasting insulin, glycated haemoglobin and the HOMA assessment of insulin resistance) and quality of life | |
| Study registration |
Trial identifier: — Trial terminated early: no |
|
| Publication details |
Language of publication: English Commercial funding: sibutramine and fluoxetine were provided by Medley Pharmaceuticals; fenproponex and diethylpropion by Aché Pharmaceuticals; mazindol and placebo were prepared by Apparenza Drugstore Publication status: full article |
|
| Stated aim for study | Quote from publication: "The main goal of the study was to compare, in a single‐blind, randomized, placebo‐controlled design, the efficacy and safety of a 52‐week (wk) therapeutic program with DEP, FEN, MZD, FXT or SIB for promoting weight loss in a group of obese premenopausal women." (page 1097) | |
| Notes | 1. A priori sample size estimation: not reported 2. Conflict of interest: not reported |
|
| Risk of bias | ||
| Bias | Authors' judgement | Support for judgement |
| Random sequence generation (selection bias) | Low risk |
Quote from publication: "... participants were randomly assigned in equal numbers to one of the six following treatment arms …" (page 1098); information by trial author: "participants were consecutively randomised by choosing a paper identified with the number of each study group" Comment: the randomisation was by a simple random method |
| Allocation concealment (selection bias) | Unclear risk |
Quote from publication: "... participants were randomly assigned in equal numbers to one of the six following treatment arms …" (page 1098); information by trial author: "participants were consecutively randomised by choosing a paper identified with the number of each study group" Comment: insufficient information |
| Blinding of participants and personnel (performance bias) adverse events | High risk | Quote from publication: "The double design could not be employed, and uncoated capsules were utilized (the gel covered capsules have different pharmacokinetic pattern)" (page 1098) |
| Blinding of participants and personnel (performance bias) anthropometric measurements other than weight loss | High risk | Quote from publication: "The double design could not be employed, and uncoated capsules were utilized (the gel covered capsules have different pharmacokinetic pattern)" (page 1098) |
| Blinding of participants and personnel (performance bias) morbidity | High risk | Quote from publication: "The double design could not be employed, and uncoated capsules were utilized (the gel covered capsules have different pharmacokinetic pattern)" (page 1098) |
| Blinding of participants and personnel (performance bias) weight loss | High risk | Quote from publication: "The double design could not be employed, and uncoated capsules were utilized (the gel covered capsules have different pharmacokinetic pattern)" (page 1098) |
| Blinding of outcome assessment (detection bias) adverse events | Unclear risk | Comment: not reported |
| Blinding of outcome assessment (detection bias) anthropometric measurements other than weight loss | Unclear risk | Comment: not reported |
| Blinding of outcome assessment (detection bias) morbidity | Unclear risk | Comment: not reported |
| Blinding of outcome assessment (detection bias) weight loss | Unclear risk | Comment: not reported |
| Incomplete outcome data (attrition bias) adverse events | High risk |
Quote from publication: "… with a dropout rate of 25.9%, mostly during the first 6 months of treatment" (page 1098) Comment: data for primary outcome available for 74% of the randomised sample, with balanced reasons for withdrawals or losses to follow‐up |
| Incomplete outcome data (attrition bias) anthropometric measurements other than weight loss | High risk |
Quote from publication: "… with a dropout rate of 25.9%, mostly during the first 6 months of treatment" (page 1098) Comment: data for primary outcome available for 74% of the randomised sample, with balanced reasons for withdrawals or losses to follow‐up |
| Incomplete outcome data (attrition bias) morbidity | High risk |
Quote from publication: "… with a dropout rate of 25.9%, mostly during the first 6 months of treatment" (page 1098) Comment: data for primary outcome available for 74% of the randomised sample, with balanced reasons for withdrawals or losses to follow‐up |
| Incomplete outcome data (attrition bias) weight loss | High risk |
Quote from publication: "… with a dropout rate of 25.9%, mostly during the first 6 months of treatment" (page 1098) Commennt: data for primary outcome available for 74% of the randomised sample, with balanced reasons for withdrawals or losses to follow‐up |
| Selective reporting (reporting bias) | High risk | Comment: trial report states that outcome was analysed but reports no results (see Appendix 9) |
| Other bias | Unclear risk | Comment: in this trial sibutramine and fluoxetine were provided by Medley and fenproporex and diethylpropion by Ache‐ Pharmaceuticals (page 1103) |
Visser 1993.
| Study characteristics | ||
| Methods | Study design: parallel RCT (randomisation ratio 1:1) | |
| Participants |
Inclusion criteria: male 25 to 50 with stable body weight for the last 2 months, BMI 26 Kg/m² to 30 Kg/m² and a waist‒hip ratio > 0.97 Exclusion criteria: any medication, participation in other studies, previous treatment with fluoxetine, alcohol abuse or smoking Diagnostic criteria: BMI Setting: university hospital Utrecht Gender distribution: males Country/countries where trial was performed: the Netherlands |
|
| Interventions |
Intervention: 1. Experimental group (EG): fluoxetine 60 mg orally, once per day for 12 weeks Comparator: 2. Control group (CG): placebo orally, once per day for 12 weeks Cointervention: diet advice Duration of intervention: 12 weeks Duration of follow‐up: 12 weeks Run‐in period: 2 weeks Number of study centres: 1 Treatment before study: none Titration period: no Treatment duration: 12 weeks |
|
| Outcomes | Body weight, body composition, anthropometry (waist‐hip ratio), abdominal fat areas, adverse events and illnesses, count of returned capsules | |
| Study registration |
Trial identifier: — Trial terminated early: no |
|
| Publication details |
Language of publication: English Commercial funding: not reported Publication status: full article |
|
| Stated aim for study | Quote from publication: “Describe the effect of dietary advice with placebo or fluoxetine on body weight, body composition and abdominal fat accumulation” | |
| Notes | 1. A priori sample size estimation: not reported 2. Conflict of interest: not reported |
|
| Risk of bias | ||
| Bias | Authors' judgement | Support for judgement |
| Random sequence generation (selection bias) | Unclear risk | Quote from publication: "..participants were randomly assigned.." (page 248); answer of author: "the randomisation was performed by a third party. I do not know the details" Comment: insufficient information |
| Allocation concealment (selection bias) | Unclear risk | Quote from publication: "..participants were randomly assigned.." (page 248); answer of author: "I do not recall exactly our procedure, but I believe that participants were given a number in the order of the date and time of their baseline assessment" Comment: insufficient information |
| Blinding of participants and personnel (performance bias) adverse events | Unclear risk | Quote from publication: "….the double blind treatment period.." (page 248); answer of author: "both participants and researchers were blinded" Comment: self‐reported outcome measurement. Insufficient information |
| Blinding of participants and personnel (performance bias) anthropometric measurements other than weight loss | Unclear risk | Quote from publication: "….the double blind treatment period.." (page 248) Comment: insufficient information |
| Blinding of participants and personnel (performance bias) weight loss | Unclear risk | Quote from publication: "….the double blind treatment period.." (page 248) Comment: insufficient information |
| Blinding of outcome assessment (detection bias) adverse events | Unclear risk | Quote from publication: "….the double blind treatment period.." (page 248); answer of author: "both participants and researchers were blinded" Comment: insufficient information |
| Blinding of outcome assessment (detection bias) anthropometric measurements other than weight loss | Unclear risk | Quote from publication: "….the double blind treatment period.." (page 248) Comment: insufficient information |
| Blinding of outcome assessment (detection bias) weight loss | Unclear risk | Quote from publication: "….the double blind treatment period..". (page 248) Comment: insufficient information |
| Incomplete outcome data (attrition bias) adverse events | Low risk | Quote from publication: "38 individuals completed the study..." (page 248) Comment: data for primary outcome available for 95% of the randomised sample, with balanced reasons for withdrawals or losses to follow‐up |
| Incomplete outcome data (attrition bias) anthropometric measurements other than weight loss | Low risk | Quote from publication: "38 individuals completed the study..." (page 248) Comment: data for primary outcome available for 95% of the randomised sample, with balanced reasons for withdrawals or losses to follow‐up |
| Incomplete outcome data (attrition bias) weight loss | Low risk | Quote from publication: "38 individuals completed the study..." (page 248) Comment: data for primary outcome available for 95% of the randomised sample, with balanced reasons for withdrawals or losses to follow‐up |
| Selective reporting (reporting bias) | Low risk | Comment: all the outcomes listed in the method section described in results |
| Other bias | Low risk | Comment: no other potential source of bias |
Wurtman 1993.
| Study characteristics | ||
| Methods | Study design: parallel RCT (randomisation ratio 1:1:1) | |
| Participants |
Inclusion criteria: women who were 40 lbs to 60 lbs above ideal body weight according to the Metropolitan Life Insurance Height and Weight table for midpoint frames and who perceived their obesity as being sustained by an excessive appetite for sweet and starchy snack foods. Good general health, a non‐smoker and least 3 months beyond the completion of any weight loss programme Exclusion criteria: moderate to severe premenstrual mood and appetite changes and/or a clear pattern of seasonal weight gain and loss Diagnostic criteria: 40 lbs to 60 lbs above ideal body weight Setting: clinical research centre Gender distribution: females Country/countries where trial was performed: USA |
|
| Interventions |
Interventions: I1. Experimental group A (EGA): dexfenfluramine 15 mg orally, once per day for 12 weeks I2. Experimental group B (EGB): fluoxetine 20 mg orally, once per day for 12 weeks Comparator: 3. Control group (CG): placebo orally, once per day for 12 weeks Cointervention: no Duration of intervention: 12 weeks Duration of follow‐up: 12 weeks and 4 days Run‐in period: 4 days Number of study centres: 1 Treatment before study: 4 day outpatient measurement of their meal and snack intakes to identify those whose food intake reflected a consistent appetite for CHO‐rich snack foods Titration period: no Treatment duration: 12 weeks |
|
| Outcomes | Weight, carbohydrate intake, adverse events, glucose, triglycerides, urinalysis, thyroid profile, complete blood count, biochemical parameters, Hamilton Depression Rating Scale (HDRS), the self‐administered ProfIle of Mood States (POMS), the Center for Epidemiological Studies ‒ Depression (CESD) test, Stanford Sleepiness Scale (SSS) and the Menstrual Symptomatology Questionnaire (MSQ), drug levels | |
| Study registration |
Trial identifier: — Trial terminated early: no |
|
| Publication details |
Language of publication: English Commercial funding: no Publication status: full article |
|
| Stated aim for study | Quote from publication: “Compare the effects of dexfenfluramine and fluoxetine treatment on calorie, macro nutriment intake, and weight loss among obese women” | |
| Notes | 1. A priori sample size estimation: not reported 2. Conflict of interest: not reported |
|
| Risk of bias | ||
| Bias | Authors' judgement | Support for judgement |
| Random sequence generation (selection bias) | Unclear risk |
Quote from publication: “Participants … were randomly assigned to …" (page 203) Comment: insufficient information |
| Allocation concealment (selection bias) | Unclear risk |
Quote from publication: “Participants … were randomly assigned to …" (page 203) Comment: insufficient information |
| Blinding of participants and personnel (performance bias) adverse events | Low risk | Quote from publication: "The study was conducted in double blind fashion" (page 203) |
| Blinding of participants and personnel (performance bias) weight loss | Low risk | Quote from publication: "The study was conducted in double blind fashion" (page 203) |
| Blinding of outcome assessment (detection bias) adverse events | Unclear risk | Comment: not reported |
| Blinding of outcome assessment (detection bias) weight loss | Unclear risk | Comment: not reported |
| Incomplete outcome data (attrition bias) adverse events | High risk |
Quote from publication: "64 individuals completed the study …" (page 204) Comment: data for primary outcome available for 73.5% of the randomised sample, with balanced reasons for withdrawals or losses to follow‐up |
| Incomplete outcome data (attrition bias) weight loss | High risk |
Quote from publication: "64 individuals completed the study …" (page 204) Comment: data for primary outcome available for 73.5% of the randomised sample, with balanced reasons for withdrawals or losses to follow‐up |
| Selective reporting (reporting bias) | Low risk | Comment: all the outcomes listed in the method section described in results |
| Other bias | Low risk | Comment: no other potential source of bias |
Note: where the judgement is 'Unclear' and the description is blank, the study did not report that particular outcome.
— denotes not reported
BMI: body mass index; BP: blood pressure; DSM III‐R: Diagnostic and Statistical Manual of Mental Disorders; RCT: randomised controlled trial.
Characteristics of excluded studies [ordered by study ID]
| Study | Reason for exclusion |
|---|---|
| Afkhami 2005 | Quasi‐experimental trial, all participants received fluoxetine |
| Beyazyüz 2013 | Included individuals with BMI < 25 kg/m² |
| Blondal 1999 | Insufficient information about the weight of the participants |
| Borrelli 1999 | Included obese and non‐obese participants |
| Bremner 1984 | Insufficient information about the weight of the participants |
| Burns 1995 | Included obese and non‐obese participants |
| Chojnacki 2015 | Fluoxetine was a co‐intervention with melatonin |
| Cook 2004 | Insufficient information about the weight of the participants |
| Dastjerdi 2007 | Included participants under 14 years old |
| De Ronchi 1998 | Included non‐obese participants |
| Falk 1989 | Insufficient information about the weight of the participants |
| Folgelson 1991 | Letter to the editor |
| Gendall 2000 | Letter to the editor |
| Gilbert 2010 | Not a clinical trial |
| Goldstein 1995 | Included participants with diabetes mellitus |
| Goldstein 1997 | Included obese and non‐obese participants |
| González 2017 | Fluoxetine as co‐intervention with metformin |
| Harto 1998 | Included obese and non‐obese participants |
| Keller 2007 | Insufficient information about the weight of the participants |
| Macías‐Cortés 2017 | Included obese and non‐obese participants |
| Maina 2004 | Not a clinical trial |
| Mendoza 1995 | Participants received fluoxetine or dexfenfluramine without distinction |
| Michelson 1999 | Included obese and non‐obese participants |
| Newhouse 2000 | Insufficient information about the weight of the participants |
| Niaura 2002 | Insufficient information about the weight of the participants |
| Orzack 1990 | Included adults who were overweight, underweight and of ideal weight |
| Papakostas 2005 | Not a clinical trial |
| Pedrinola 1996 | Compared fluoxetine alone versus dexfenfluramine plus fluoxetine for weight loss |
| Ravindran 2015 | Not a clinical trial |
| Saules 2004 | Insufficient information about the weight of the participants |
| Schweizer 1990 | Insufficient information about the weight of the participants |
| Weng 2004 | Insufficient information about the weight of the participants |
BMI: body mass index.
Characteristics of studies awaiting classification [ordered by study ID]
Krylov 1997.
| Methods | Design: parallel RCT (randomisation ratio 1:1) |
| Participants |
Inclusion criteria: obese women Exclusion criteria: not reported Diagnostic criteria: not reported |
| Interventions |
Intervention: fluoxetine 60 mg orally, once per day for 26 weeks Comparator: placebo orally, once per day for 26 weeks Cointervention: none Duration of intervention: 26 weeks Duration of follow‐up: 26 weeks Run‐in period: none Number of study centres: not reported Treatment before study: none Titration period: none Treatment duration: 26 weeks |
| Outcomes | Weight loss |
| Study details |
Trial identifier: not reported Trial terminated early: no |
| Publication details |
Language of publication: English Commercial funding: not reported Publication status: congress report |
| Stated aim of study | Quote from publication: "Assess the efficacy and safety of fluoxetine as compared with placebo in the treatment of obesity." |
| Notes | 1. A priori sample size estimation: not reported 2. Conflict of interest: not reported |
RCT: randomised controlled trial.
Differences between protocol and review
Due to change in author team and the long time between publication of the protocol (Melendez 2015) and the review, all parts of this review were adapted/changed according to the newest Cochrane Metabolic and Endocrine Disorders Group standards.
Parallel trials were analysed independently with respect to cross‐over trials, in order to reduce errors in the meta‐analysis.
Contributions of authors
All review authors read and approved the final review draft.
Aurora E Serralde‐Zuñiga (AS): protocol drafting, acquiring study reports, selecting studies for inclusion, data extraction, data interpretation, review of drafts, and future review updates.
Alejandro G Gonzalez‐Garay (AGG): protocol drafting, selecting studies for inclusion, data extraction, data analysis, data interpretation, review of drafts, and future review updates.
Yanelli Rodríguez‐Carmona (YR): protocol drafting, acquiring study reports, selecting studies for inclusion, data extraction, data interpretation, review of drafts, and future review updates.
Guillermo Melendez (GM): protocol drafting, acquiring study reports, selecting studies for inclusion, and review of drafts.
Sources of support
Internal sources
-
Library of the National Institute of Pediatrics, Mexico
The library will provide us with articles we require for review completion.
External sources
No sources of support provided
Declarations of interest
AS: none known.
AGG: none known.
YR: none known.
GM: has participated in an educational programme on Health Economics organised by Universidad Anahuac and only this programme was sponsored by Bayer, but did not receive any payment from the pharmaceutical company. Bayer company did not participate in the development of this systematic review, which was financed by the public budget of the institutions in which the authors work.
Edited (no change to conclusions)
References
References to studies included in this review
Al‐Helli 2015 {published data only}
- Al-Helli A, Al-Abbassi M, Jasim G, Al-Bayaty M. Effects of fluoxetine, omega 3, or their combination on serum leptin in Iraqi obese subjects. International Journal of Pharmaceutical Sciences Review and Research 2015;35(1):90-5. [Google Scholar]
Bagiella 1991 {published data only}
- Bagiella E, Cairella M, Del B, Godi R. Changes in attitude toward food by obese patients treated with placebo and serotoninergic agents. Current Therapeutic Research, Clinical and Experimental 1991;50(2):205-10. [Google Scholar]
Bondi 2000 {published data only}
- Bondi M, Menozzi R, Bertolini M, Venneri M, Rio G. Metabolic effects of fluoxetine in obese menopausal women. Journal of Endocrinological Investigation 2000;23(5):280-6. [DOI] [PubMed] [Google Scholar]
Bross 1995 {published data only}
- Bross R, Hoffer L. Fluoxetine increases resting energy expenditure and basal body temperature in humans. American Journal of Clinical Nutrition 1995;61(5):1020-5. [DOI] [PubMed] [Google Scholar]
Fernández‐Soto 1995 {published data only}
- Fernández-Soto M, González-Jiménez A, Barredo-Acedo F, Luna del Castillo J, Escobar-Jiménez F. Comparison of fluoxetine and placebo in the treatment of obesity. Annals of Nutrition & Metabolism 1995;39(3):159-63. [DOI] [PubMed] [Google Scholar]
Goldstein 1993 {published data only}
- Goldstein D, Rampey A, Dornseif B, Levine L, Potvin J, Fludzinski L. Fluoxetine: a randomized clinical trial in the maintenance of weight loss. Obesity Research 1993;1(2):92-8. [DOI] [PubMed] [Google Scholar]
Goldstein 1994 {published data only}
- Darga L, Carroll-Michals L, Botsford S, Lucas C. Fluoxetine's effect on weight loss in obese subjects. American Journal of Clinical Nutrition 1991;54(2):321-5. [DOI] [PubMed] [Google Scholar]
- Goldstein D, Rampey A, Enas G, Potvin J, Fludzinski L, Levine L. Fluoxetine: a randomized clinical trial in the treatment of obesity. International Journal of Obesity and Related Metabolic Disorders 1994;18(3):129-35. [PubMed] [Google Scholar]
Guimaraes 2006 {published data only}
- Guimarães C, Pereira L, Lucif Júnior N, Cesarino E, Almeida C, Carvalho D, et al. Tolerability and effectiveness of fluoxetine, metformin and sibutramine in reducing anthropometric and metabolic parameters in obese patients. Arquivos Brasileiros de Endocrinologia e Metabologia 2006;50(6):1020-5. [DOI] [PubMed] [Google Scholar]
Huang 1998 {published data only}
- Huang C, Chian C, Lin J. Short-term treatment of obesity with fluoxetine as a supplement to a low calorie diet. Changgeng Yi Xue za Zhi [Chang Gung Medical Journal] 1998;21(1):50-6. [PubMed] [Google Scholar]
Kopelman 1992 {published data only}
- Kopelman P, Elliott M, Simonds A, Cramer D, Ward S, Wedzicha J. Short-term use of fluoxetine in asymptomatic obese subjects with sleep-related hypoventilation. International Journal of Obesity and Related Metabolic Disorders 1992;16(10):825-30. [PubMed] [Google Scholar]
Lawton 1995 {published data only}
- Lawton C, Wales J, Hill A, Blundell J. Serotoninergic manipulation, meal-induced satiety and eating pattern: effect of fluoxetine in obese female subjects. Obesity Research 1995;3(4):345-56. [DOI] [PubMed] [Google Scholar]
Levine 1987 {published data only}
- Levine L, Rosenblatt S, Bosomworth J. Use of a serotonin re-uptake inhibitor, fluoxetine, in the treatment of obesity. International Journal of Obesity 1987;11(Suppl 3):185-90. [PubMed] [Google Scholar]
Levine 1989 {published data only}
- Levine L, Enas G, Thompson W, Byyny R, Dauer A, Kirby R, et al. Use of fluoxetine, a selective serotonin-uptake inhibitor, in the treatment of obesity: a dose-response study. International Journal of Obesity 1989;13(5):635-45. [PubMed] [Google Scholar]
Pedrinola 1993 {published and unpublished data}
- Pedrinola F, Risso W, Lima N, Medeiros G. Fluoxetine induced weight loss in overweight subjects: a double-blind placebo-controlled trial. Arquivos Brasileiros de Endocrinologia e Metabologia 1993;37:31-3. [Google Scholar]
Pijl 1991 {published data only}
- Pijl H, Koppeschaar H, Willekens F, Op de Kamp I, Veldhuis H, Meinders A. Effect of serotonin re-uptake inhibition by fluoxetine on body weight and spontaneous food choice in obesity. International Journal of Obesity 1991;15(3):237-42. [PubMed] [Google Scholar]
Stinson 1992 {published data only}
- Stinson J, Murphy C, Andrews J, Tomkin G. An assessment of the thermogenic effects of fluoxetine in obese subjects. International Journal of Obesity and Related Metabolic Disorders 1992;16(5):391-5. [PubMed] [Google Scholar]
Suplicy 2014 {published data only}
- Suplicy H, Boguszewski C, Dos Santos C, Do Desterro M, Cunha D, Radomiski R. A comparative study of five centrally acting drugs on the pharmacological treatment of obesity. International Journal of Obesity 2014;38(8):1097-103. [DOI] [PubMed] [Google Scholar]
Visser 1993 {published data only}
- Visser M, Seidell J, Koppeschaar H, Smits P. No specific effect of fluoxetine treatment on fasting glucose, insulin, lipid levels, and blood pressure in healthy men with abdominal obesity. Obesity Research 1994;2(2):152-9. [DOI] [PubMed] [Google Scholar]
- Visser M, Seidell J, Koppeschaar H, Smits P. The effect of fluoxetine on body weight, body composition and visceral fat accumulation. International Journal of Obesity and Related Metabolic Disorders 1993;17(5):247-53. [PubMed] [Google Scholar]
Wurtman 1993 {published data only}
- Wurtman J, Wurtman R, Berry E, Gleason R, Goldberg H, McDermott J, et al. Dexfenfluramine, fluoxetine, and weight loss among female carbohydrate cravers. Neuropsychopharmacology 1993;9(3):201-10. [DOI] [PubMed] [Google Scholar]
References to studies excluded from this review
Afkhami 2005 {published data only}
- Afkhami-Ardekani M, Sedghi H. Effect of fluoxetine on weight reduction in obese patients. Indian Journal of Clinical Biochemistry 2005;20(1):135-8. [DOI] [PMC free article] [PubMed] [Google Scholar]
Beyazyüz 2013 {published data only}
- Beyazyüz M, Albayrak Y, Egilmez O, Albayrak N, Beyazyüz E. Relationship between SSRIs and metabolic syndrome abnormalities in patients with generalized anxiety disorder: A prospective study. Psychiatry Investigation 2013;10(2):148-54. [DOI] [PMC free article] [PubMed] [Google Scholar]
Blondal 1999 {published data only}
- Blondal T, Gudmundsson L, Tomasson K, Jonsdottir D, Hilmarsdottir H, Kristjansson F, Nilsson F, Bjornsdottir U. The effects of fluoxetine combined with nicotine inhalers in smoking cessation--a randomized trial. Addiction (Abingdon, England) 1999;94(7):1007-15. [DOI] [PubMed] [Google Scholar]
Borrelli 1999 {published data only}
- Borrelli B, Spring B, Niaura R, Kristeller J, Ockene J, Keuthen N. Weight suppression and weight rebound in ex-smokers treated with fluoxetine. Journal of Consulting and Clinical Psychology 1999;67:124-31. [DOI] [PubMed] [Google Scholar]
Bremner 1984 {published data only}
- Bremner J. Fluoxetine in depressed patients: a comparison with imipramine. Journal of Clinical Psychiatry 1984;45(10):414-19. [PubMed] [Google Scholar]
Burns 1995 {published data only}
- Burns R, Lock T, Edwards D, Katona C, Harrison D, Robertson M, et al. Predictors of response to amine-specific antidepressants. Journal of Affective Disorders 1995;35:97-106. [DOI] [PubMed] [Google Scholar]
Chojnacki 2015 {published data only}
- Chojnacki C, Walecka-Kapica E, Klupinska G, Pawlowicz M, Blonska A, Chojacki J. Effects of fluoxetine and melatonin on mood, sleep quality and body mass index in postmenopausal women. Journal of Physiology and Pharmacology 2015;66(5):665-71. [PubMed] [Google Scholar]
Cook 2004 {published data only}
- Cook J, Spring B, McChargue D, Borrelli B, Hitsman B, Niaura R, Keuthen N, Kristeller J. Influence of fluoxetine on positive and negative affect in a clinic-based smoking cessation trial. Psychopharmacology 2004;173(1-2):153-9. [DOI: 10.1007/s00213-003-1711-8] [DOI] [PMC free article] [PubMed] [Google Scholar]
Dastjerdi 2007 {published data only}
- Dastjerdi M, Kazemi F, Najafian A, Mohammady M, Aminorroaya A, Amini M. An open-label pilot study of the combination therapy of metformin and fluoxetine for weight reduction. International Journal of Obesity (2005) 2007;31:713-7. [DOI] [PubMed] [Google Scholar]
De Ronchi 1998 {published data only}
- De Ronchi D, Rucci P, Lodi M, Ravaglia G, Forti P, Volterra V. Fluoxetine and amitriptyline in elderly depressed patients. A 10-week, double-blind study on course of neurocognitive adverse events and depressive symptoms. European Urology 1998;26(S1):125-40. [Google Scholar]
Falk 1989 {published data only}
- Falk W, Rosenbaum J, Otto M, Zusky P, Wilburg J, Nixon R. Fluoxetine versus trazodone in depressed geriatric patients. Journal of Geriatric Psychiatry and Neurology 1989;2(4):208-14. [DOI] [PubMed] [Google Scholar]
Folgelson 1991 {published data only}
- Folgelson D. Weight gain during fluoxetine treatment. Journal of Clinical Psychopharmacology 1991;11:220-1. [PubMed] [Google Scholar]
Gendall 2000 {published data only}
- Gendall K, Joyce P, Mulder R, Sullivan P. The effects of fluoxetine versus nortriptyline on body weight in depression. Journal of Clinical Psychopharmacology 2000;20:714-5. [DOI] [PubMed] [Google Scholar]
Gilbert 2010 {unpublished data only}
- Gilbert. Fluoxetine (Prozac) and other drugs for treatment of obesity. Medical Letter on Drugs and Therapeutics 1994;36:107-8. [PubMed] [Google Scholar]
Goldstein 1995 {published data only}
- Goldstein D, Rampey A, Roback P, Wilson M, Hamilton S, Sayler M. Efficacy and safety of long-term fluoxetine treatment of obesity--maximizing success. Obesity Research 1995;3(Suppl 4):481s-90s. [DOI] [PubMed] [Google Scholar]
Goldstein 1997 {published data only}
- Goldstein D, Hamilton S, Masica D, Beasley C. Fluoxetine in medically stable, depressed geriatric patients: effects on weight. Journal of Clinical Psychopharmacology 1997;17:365-9. [DOI] [PubMed] [Google Scholar]
González 2017 {published and unpublished data}
- González M. Fixed Dose Combination of Fluoxetin and Metformin in the Management of Overweight and Obesity (Metfluo) [Multicenter, Randomized, Double-blind, Placebo-controlled Trial to Determine the Efficacy of Two Fixed Dose Combination of Metformin/Fluoxetin 1000/40 mg vs. 1700/40 mg in the Management of Overweight and Obesity]. ClinicalTrials.gov 2017.
Harto 1998 {published data only}
- Harto N, Spera K, Branconnier R. Fluoxetine-induced reduction of body mass in patients with major depressive disorder. Psychopharmacology Bulletin 1988;24:220-3. [PubMed] [Google Scholar]
Keller 2007 {published data only}
- Keller M, Trivedi M, Thase M, Shelton R, Kornstein S, Nemeroff C, Fiedman E, Gelenberg A, Kocsis J, Dunner D, Hirschfeld R, Rothschild A, Ferguson J, Schatzberg A, Zajecka J, Pedersen R, Yan B, Ahmed S, Musgnung J, Ninan P. The Prevention of Recurrent Episodes of Depression with Venlafaxine for Two Years (PREVENT) Study: Outcomes from the 2-year and combined maintenance phases. Journal of Clinical Psychiatry 2007;68(8):1246-56. [DOI] [PubMed] [Google Scholar]
Macías‐Cortés 2017 {published data only}
- Macías-Cortés ED, Llanes-González L, Aguilar-Faisal L, Asbun-Bojalil J. Is metabolic dysregulation associated with antidepressant response in depressed women in climacteric treated with individualized homeopathic medicines of fluoxetine? The HOMDEP-MENOP Study. Homeopathy 2017;106(1):3-10. [DOI] [PubMed] [Google Scholar]
Maina 2004 {published data only}
- Maina G, Albert U, Salvi V, Bogetto F. Weight gain during long-term treatment of obsessive-compulsive disorder: a prospective comparison between serotonin reuptake inhibitors. Journal of Clinical Psychiatry 2004;65:1365-71. [DOI] [PubMed] [Google Scholar]
Mendoza 1995 {published data only}
- Mendoza R, Díaz J, Buitrago F. Effectiveness of serotonergic agonist in the treatment of obese patients. Atencion Primaria / Sociedad Espanola de Medicina de Familia y Comunitaria 1995;16:364-6. [PubMed] [Google Scholar]
Michelson 1999 {published data only}
- Amsterdam J, García-España F, Fawcett J, Quitrin F. Weight change during acute and chronic fluoxetine therapy in patients with major depression. In: XXIst Collegium Internationale Neuro-psychopharmacologicum, Glasgow, Scotland.12th-16th July, 1998. Glasgow: Collegium Internationale Neuro-psychopharmacologicum, 1998.
- Michelson D, Amsterdam J, Quitkin F, Reimherr F, Rosenbaum J, Zajecka J, et al. Changes in weight during a 1-year trial of fluoxetine. American Journal of Psychiatry 1999;156:1170-1176. [DOI: 10.1176/ajp.156.8.1170] [DOI] [PubMed] [Google Scholar]
- Reimherr F, Amsterdam J, Quitkin F, Rosenbaum J, Fava M, Zajecka J, et al. Optimal length of continuation therapy in depression: a prospective assessment during long-term fluoxetine treatment. American Journal of Psychiatry 1998;155:1247-53. [DOI: 10.1176/ajp.155.9.1247] [DOI] [PubMed] [Google Scholar]
Newhouse 2000 {published data only}
- Newhouse P, Krishnan K, Doraiswamy P, Richter E, Batzar E, Clary C. A double-blind comparison of sertraline and fluoxetine in depressed elderly outpatients. Journal of Clinical Psychiatry 2000;6(18):559-68. [DOI] [PubMed] [Google Scholar]
Niaura 2002 {published data only}
- Niaura R, Spring B, Borrelli B, Hedeker D, Goldstein M, Keuthen N, et al. Multicenter trial of fluoxetine as an adjunct to behavioral smoking cessation treatment. Journal of Consulting and Clinical Psychology 2002;70(4):887-96. [DOI] [PMC free article] [PubMed] [Google Scholar]
Orzack 1990 {published data only}
- Orzack M, Friedman L, Marby D. Weight changes on fluoxetine as a function of baseline weight in depressed outpatients. Psychopharmacology 1990;26:327-30. [PubMed] [Google Scholar]
Papakostas 2005 {published data only}
- Papakostas G, Petersen T, Losifescu D, Burns A, Nierenberg A, Alpert J, et al. Obesity among outpatients with major depressive disorder. International Journal of Neuropsychopharmacology 2005;8(1):59-63. [DOI] [PubMed] [Google Scholar]
Pedrinola 1996 {published data only}
- Pedrinola F, Sztejnsznajd C, Lima N, Halpern A, Medeiros-Neto G. The addition of dexfenfluramine to fluoxetine in the treatment of obesity: a randomized clinical trial. Obesity Research 1996;4:549-54. [DOI] [PubMed] [Google Scholar]
Ravindran 2015 {published data only}
- Ravindran P, Zang W, Renukunta S, Mansour R, Denduluri S. Effect of comedication of bupropion and other antidepressants on body mass index. Therapeutic Advances in Psychopharmacology 2015;5(3):158-65. [DOI] [PMC free article] [PubMed] [Google Scholar]
Saules 2004 {published data only}
- Saules K, Schuh L, Arfken C, Reed K, Kilbey M, Schuster C. Double-blind placebo-controlled trial of fluoxetine in smoking cessation treatment including nicotine patch and cognitive-behavioral group therapy. American Journal on Addictions / American Academy of Psychiatrists in Alcoholism and Addictions 2004;13(5):438-46. [DOI] [PubMed] [Google Scholar]
Schweizer 1990 {published data only}
- Schweizer E, Rickels K, Amsterdam J, Fox I, Puzzuoli G, Weise C. What constitutes an adequate antidepressant trial for fluoxetine? Journal of Clinical Psychiatry 1990;51:8-11. [PubMed] [Google Scholar]
Weng 2004 {published data only}
- Weng C, Hung Y, Shyu L, Chang Y. A study of electrical conductance of meridian in the obese during weight reduction. American Journal of Chinese Medicine 2004;32:417-25. [DOI] [PubMed] [Google Scholar]
References to studies awaiting assessment
Krylov 1997 {published and unpublished data}
- Krylov V. Efficacy and safety of fluoxetine treatment of obesity. In: 10th European College of Neuropsychopharmacology Congress. 13th - 17th September. Vienna, Austria: European College of Neuropsychopharmacology, 1997.
Additional references
Aigner 2011
- Aigner M, Treasure J, Kaye W, Kasper S, WFSBP Task Force on Eating Disorders. World Federation of Societies of Biological Psychiatry (WFSBP) guidelines for the pharmacological treatment of eating disorders. World Journal of Biological Psychiatry 2011;12(6):400-43. [DOI] [PubMed] [Google Scholar]
Altman 2003
- Altman DG, Bland JM. Interaction revisited: the difference between two estimates. BMJ 2003;326(7382):219. [PMID: ] [DOI] [PMC free article] [PubMed] [Google Scholar]
Anelli 1992
- Anelli M, Bizzi A, Caccia S, Cadegoni AM, Fracasso C, Garattini S. Anorectic activity of fluoxetine and norfluoxetine in mice, rats and guinea pigs. Journal of Pharmacy and Pharmacology 1992;44(8):696-8. [DOI] [PubMed] [Google Scholar]
Beasley 1990
- Beasley CM Jr, Bosomworth JC, Wernicke JF. Fluoxetine: relationships among dose, response, adverse events, and plasma concentrations in the treatment of depression. Psychopharmacology Bulletin 1990;26(1):18-24. [PubMed] [Google Scholar]
Bell 2013
- Bell ML, McKenzie JE. Designing psycho-oncology randomised trials and cluster randomised trials: variance components and intra-cluster correlation of commonly used psychosocial measures. Psychooncology 2013;22:1738-47. [DOI] [PubMed] [Google Scholar]
Boisvert 2011
- Boisvert JP, Boschuetz TJ, Resch JM, Mueller CR, Choi S. Serotonin mediated changes in corticotropin releasing factor mRNA expression and feeding behavior isolated to the hypothalamic paraventricular nuclei. Neuroscience Letters 2011;498(3):213-7. [PMID: ] [DOI] [PMC free article] [PubMed] [Google Scholar]
Borenstein 2017a
- Borenstein M, Higgins JP, Hedges LV, Rothstein HR. Basics of meta-analysis: I² is not an absolute measure of heterogeneity. Research Synthesis Methods 2017;8(1):5-18. [DOI] [PubMed] [Google Scholar]
Borenstein 2017b
- Borenstein M. Prediction intervals. www.meta-analysis.com/prediction (accessed 3 July 2017).
Boutron 2014
- Boutron I, Altman DG, Hopewell S, Vera-Badillo F, Tannock I, Ravaud P. Impact of spin in the abstracts of articles reporting results of randomized controlled trials in the field of cancer: the SPIIN randomized controlled trial. Journal of Clinical Oncology 2014;32(36):4120-6. [DOI] [PubMed] [Google Scholar]
Colman 2012
- Colman E, Golden J, Roberts M, Egan A, Weaver J, Rosebraugh C. The FDA's assessment of two drugs for chronic weight management. New England Journal of Medicine 2012;367(17):1577-9. [DOI] [PubMed] [Google Scholar]
CONSORT
- The CONSORT statement. www.consort-statement.org (last accessed 19 May 2016).
Corbett 2014
- Corbett M, Higgins JP, Woolacott N. Assessing baseline imbalance in randomised trials: implications for the Cochrane risk of bias tool. Research Synthesis Methods 2014;5:79-85. [DOI: 10.1002/jrsm.1090] [DOI] [PubMed] [Google Scholar]
Deeks 2017
- Deeks JJ, Higgins JP, Altman DG (editors), on behalf of the Cochrane Statistical Methods Group. Chapter 9: Analysing data and undertaking meta-analyses. In: Higgins JP, Churchill R, Chandler J, Cumpston MS (editors). Cochrane Handbook for Systematic Reviews of Interventions version 5.2.0 (updated June 2017), Cochrane, 2017. Available from www.training.cochrane.org/handbook.
Domecq 2015
- Domecq JP, Prutsky G, Leppin A, Sonbol MB, Altayar O, Undavalli C, et al. Clinical review: drugs commonly associated with weight change: a systematic review and meta-analysis. Journal of Clinical Endocrinology and Metabolism 2015;100(2):363-70. [DOI: 10.1210/jc.2014-3421] [DOI] [PMC free article] [PubMed] [Google Scholar]
Dryden 1996
- Dryden S, Frankish HM, Wang Q, Pickavance L, Williams G. The serotonergic agent fluoxetine reduces neuropeptide Y levels and neuropeptide Y secretion in the hypothalamus of lean and obese rats. Neuroscience 1996;72(2):557-66. [DOI] [PubMed] [Google Scholar]
Fuller 1991
- Fuller RW, Wong DT, Robertson DW. Fluoxetine, a selective inhibitor of serotonin uptake. Medicinal Research Reviews 1991;11(1):17-34. [DOI] [PubMed] [Google Scholar]
GRADEproGDT 2015 [Computer program]
- GRADEproGDT. Version accessed 24 October 2017. Hamilton (ON): McMaster University (developed by Evidence Prime), 2015. Available at gradepro.org.
Gutiérrez 2002
- Gutiérrez A, Saracíbar G, Casis L, Echevarría E, Rodríguez VM, Macarulla MT, et al. Effects of fluoxetine administration on neuropeptide Y and orexins in obese Zucker rat hypothalamus. Obesity Research 2002;10(6):532-40. [DOI] [PubMed] [Google Scholar]
Halford 2005
- Halford JC, Harrold JA, Lawton CL, Blundell JE. Serotonin (5-HT) drugs: effects on appetite expression and use for the treatment of obesity. Current Drug Targets 2005;6(2):201-13. [DOI] [PubMed] [Google Scholar]
Halford 2007
- Halford JC, Harrold JA, Boyland EJ, Lawton CL, Blundell JE. Serotonergic drugs: effects on appetite expression and use for the treatment of obesity. Drugs 2007;67(1):27-55. [DOI] [PubMed] [Google Scholar]
Halford 2008
- Halford JC, Harrold JA. Neuropharmacology of human appetite expression. Developmental Disabilities Research Reviews 2008;14(2):158-64. [DOI] [PubMed] [Google Scholar]
Halpern 2003
- Halpern A, Mancini MC. Treatment of obesity: an update on anti-obesity medications. Obesity Reviews 2003;4(1):25-42. [DOI] [PubMed] [Google Scholar]
Haslam 2005
- Haslam DW, James WP. Obesity. Lancet 2005;366(9492):1197-209. [DOI] [PubMed] [Google Scholar]
Higgins 2002
- Higgins JP, Thompson SG. Quantifying heterogeneity in a meta-analysis. Statistics in Medicine 2002;21(11):1539-58. [DOI] [PubMed] [Google Scholar]
Higgins 2003
- Higgins JP, Thompson SG, Deeks JJ, Altman DG. Measuring inconsistency in meta-analysis. BMJ 2003;327(7414):557-60. [DOI] [PMC free article] [PubMed] [Google Scholar]
Higgins 2009
- Higgins JP, Thompson SG, Spiegelhalter DJ. A re-evaluation of random-effects meta-analysis. Journal of the Royal Statistical Society: Series A (Statistics in Society) 2009;172(1):137-59. [DOI] [PMC free article] [PubMed] [Google Scholar]
Higgins 2011a
- Higgins JP, Altman DG, Gøtzsche PC, Jüni P, Moher D, Oxman AD, et al. The Cochrane Collaboration's tool for assessing risk of bias in randomised trials. BMJ 2011;343:d5928. [DOI] [PMC free article] [PubMed] [Google Scholar]
Higgins 2011b
- Higgins JP, Deeks JJ, Altman DG (editors), on behalf of the Cochrane Statistical Methods Group. Chapter 16: Special topics in statistics. In: Higgins JP, Green S (editors). Cochrane Handbook for Systematic Reviews of Interventions. Version 5.1.0 (updated March 2011). The Cochrane Collaboration, 2011. Available from handbook.cochrane.org.
Higgins 2017
- Higgins JP, Altman DG, Sterne JA (editors). Chapter 8: Assessing risk of bias in included studies. In: Higgins JP, Churchill R, Chandler J, Cumpston MS (editors), Cochrane Handbook for Systematic Reviews of Interventions Version 5.2.0 (updated June 2017). Cochrane, 2017. Available from www.training.cochrane.org/handbook.
Hozo 2005
- Hozo SP, Djulbegovic B, Hozo I. Estimating the mean and variance from the median, range, and the size of a sample. BMC Medical Research Methodology 2005;5:13. [DOI: 10.1186/1471-2288-5-13] [DOI] [PMC free article] [PubMed] [Google Scholar]
Hróbjartsson 2013
- Hróbjartsson A, Thomsen AS, Emanuelsson F, Tendal B, Hilden J, Boutron I, et al. Observer bias in randomized clinical trials with measurement scale outcomes: a systematic review of trials with both blinded and non blinded assessors. Canadian Medical Association Journal 2013;185(4):E201-11. [DOI] [PMC free article] [PubMed] [Google Scholar]
Ioannides‐Demos 2005
- Ioannides-Demos L, Proietto J, McNeil JJ. Pharmacotherapy for obesity. Drugs 2005;65(10):1391-418. [DOI] [PubMed] [Google Scholar]
Jones 2015
- Jones CW, Keil LG, Holland WC, Caughey MC, Platts-Mills TF. Comparison of registered and published outcomes in randomized controlled trials: a systematic review. BMC Medicine 2015;13:282. [DOI: 10.1186/s12916-015-0520-3] [DOI] [PMC free article] [PubMed] [Google Scholar]
Kelly 2008
- Kelly T, Yang W, Chen CS, Reynolds K, He J. Global burden of obesity in 2005 and projections to 2030. International Journal of Obesity (2005) 2008;32(9):1431-7. [DOI: 10.1038/ijo.2008.102] [DOI] [PubMed] [Google Scholar]
Kirkham 2010
- Kirkham JJ, Dwan KM, Altman DG, Gamble C, Dodd S, Smyth R, et al. The impact of outcome reporting bias in randomised controlled trials on a cohort of systematic reviews. BMJ 2010;340:c365. [DOI: 10.1136/bmj.c365] [DOI] [PubMed] [Google Scholar]
Leibowitz 1990
- Leibowitz SF, Weiss GF, Suh JS. Medium hypothalamic nuclei mediate serotonin's inhibitory effect on feeding behaviour. Pharmacology, Biochemistry, and Behavior 1990;37(4):735-42. [DOI] [PubMed] [Google Scholar]
Liberati 2009
- Liberati A, Altman DG, Tetzlaff J, Mulrow C, Gøtzsche PC, Ioannidis JP, et al. The PRISMA statement for reporting systematic and meta-analyses of studies that evaluate interventions: explanation and elaboration. PLoS Medicine 2009;6(7):e1000100. [DOI: 10.1371/journal.pmed.1000100] [DOI] [PMC free article] [PubMed] [Google Scholar]
Mathieu 2009
- Mathieu S, Boutron I, Moher D, Altman DG, Ravaud P. Comparison of registered and published primary outcomes in randomized controlled trials. JAMA 2009;302(9):977-84. [DOI] [PubMed] [Google Scholar]
McGuirk 1990
- McGuirk J, Silverstone T. The effect of the 5-HT re-uptake inhibitor fluoxetine on food intake and body weight in healthy male subjects. International Journal of Obesity 1990;14(4):361-72. [PMID: ] [PubMed] [Google Scholar]
Meader 2014
- Meader N, King K, Llewellyn A, Norman G, Brown J, Rodgers M, et al. A checklist designed to aid consistency and reproducibility of GRADE assessments: development and pilot validation. Systematic Reviews 2014;3(82):1-9. [DOI: 10.1186/2046-4053-3-82] [DOI] [PMC free article] [PubMed] [Google Scholar]
Melendez 2015
- Melendez G, Serralde-Zúñiga A, Gonzalez Garay A, Rodríguez-Carmona Y, Solis Galicia C. Fluoxetine for adult overweight or obese people. Cochrane Database of Systematic Reviews 2015, Issue 5. Art. No: CD011688. [DOI: 10.1002/14651858.CD011688] [DOI] [PMC free article] [PubMed] [Google Scholar]
Norris 2005
- Norris SL, Zhang X, Avenell A, Gregg E, Schmid CH, Lau J. Pharmacotherapy for weight loss in adults with type 2 diabetes mellitus. Cochrane Database of Systematic Reviews 2005, Issue 1. Art. No: CD004096. [DOI: 10.1002/14651858.CD004096.pub2] [DOI] [PMC free article] [PubMed] [Google Scholar]
NTF 2000
- National Task Force on the Prevention and Treatment of Obesity. Overweight, obesity, and health risk. Archives of Internal Medicine 2000;160(7):898-904. [DOI: 10.1001/archinte.160.7.898.] [DOI] [PubMed] [Google Scholar]
Peeters 2003
- Peeters A, Barendregt JJ, Willekens F, Mackenbach JP, Al Mamun A, Bonneux L. NEDCOM, the Netherlands epidemiology and demography compression of morbidity research group. Obesity in adulthood and its consequences for life expectancy: a life-table analysis. Annals of Internal Medicine 2003;138(1):24-32. [DOI] [PubMed] [Google Scholar]
Reimherr 1998
- Reimherr F, Amsterdam J, Quitkin F, Rosenbaum J, Fava M, Zajecka J, et al. Optimal length of continuation therapy in depression: a prospective assessment during long-term fluoxetine treatment. American Journal of Psychiatry 1998;155(9):1247-53. [DOI: 10.1176/ajp.155.9.1247] [DOI] [PubMed] [Google Scholar]
Review Manager 2014 [Computer program]
- Review Manager 5 (RevMan 5). Version 5.3. Copenhagen: Nordic Cochrane Centre, The Cochrane Collaboration, 2014.
Riley 2011
- Riley RD, Higgins JP, Deeks JJ. Interpretation of random effects meta-analyses. BMJ 2011;342:d549. [DOI] [PubMed] [Google Scholar]
Riley 2013
- Riley RD, Kauser I, Bland M, Thijs L, Staessen JA, Wang J, et al. Meta-analysis of randomised trials with a continuous outcome according to baseline imbalance and availability of individual participant data. Statistics in Medicine 2013;32(16):2747-66. [DOI] [PubMed] [Google Scholar]
Scherer 2007
- Scherer RW, Langenberg P, Elm E. Full publication of results initially presented in abstracts. Cochrane Database of Systematic Reviews 2007, Issue 2. Art. No: MR000005. [DOI: 10.1002/14651858.MR000005.pub3] [DOI] [PubMed] [Google Scholar]
Schünemann 2017
- Schünemann HJ, Oxman AD, Higgins JP, Vist GE, Glasziou P, Akl E, et al, on behalf of the Cochrane GRADEing Methods Group and the Cochrane Statistical Methods Group. Chapter 11: Completing ‘Summary of findings’ tables and grading the confidence in or quality of the evidence. In: Higgins JP, Churchill R, Chandler J, Cumpston MS (editors), Cochrane Handbook for Systematic Reviews of Interventions version 5.2.0 (updated June 2017). Cochrane, 2017. Available from www.training.cochrane.org/handbook.
Serretti 2010
- Serretti A, Mandelli L. Antidepressants and body weight: a comprehensive review and meta-analysis. Journal of Clinical Psychiatry 2010;71(10):1259-72. [DOI] [PubMed] [Google Scholar]
Sterne 2011
- Sterne JA, Sutton AJ, Ioannidis JP, Terrin N, Jones DR, Lau J, et al. Recommendations for examining and interpreting funnel plot asymmetry in meta-analyses of randomised controlled trials. BMJ 2011;343:d4002. [DOI] [PubMed] [Google Scholar]
Sterne 2017
- Sterne JA, Egger M, Moher D, Boutron I (editors). Chapter 10: Addressing reporting biases. In: Higgins JP, Churchill R, Chandler J, Cumpston MS (editors), Cochrane Handbook for Systematic Reviews of Interventions version 5.2.0 (updated June 2017), Cochrane, 2017. Available from www.training.cochrane.org/handbook.
Suplicy 2013
- Suplicy H, Boguszewski CL, dos Santos CM, do Desterro de Figueiredo M, Cunha DR, Radominski R. A comparative study of five centrally acting drugs on the pharmacological treatment of obesity. International Journal of Obesity 2013;38(8):1097-103. [DOI: 10.1038/ijo.2013.225] [DOI] [PubMed] [Google Scholar]
Wenthur 2014
- Wenthur CJ, Bennett MR, Lindsley CW. Classics in chemical neuroscience: fluoxetine (Prozac). ACS Chemical Neuroscience 2014;5(1):14-23. [Google Scholar]
WHO 2014
- World Health Organization. Obesity and overweight. www.who.int/mediacentre/factsheets/fs311/en (accessed 30 April 2015).
Wise 1992
- Wise S. Clinical studies with fluoxetine in obesity. American Journal of Clinical Nutrition 1992;55(1 Suppl):181S-4S. [PMID: ] [DOI] [PubMed] [Google Scholar]
Wood 2008
- Wood L, Egger M, Gluud LL, Schulz KF, Jüni P, Altman DG, et al. Empirical evidence of bias in treatment effect estimates in controlled trials with different interventions and outcomes: meta-epidemiological study. BMJ 2008;336(7644):601-5. [DOI] [PMC free article] [PubMed] [Google Scholar]
Ye 2011
- Ye Z, Chen L, Yang Z, Li Q, Huang Y, He M, et al. Metabolic effects of fluoxetine in adults with type 2 diabetes mellitus: a meta-analysis of randomised placebo-controlled trials. PloS One 2011;6(7):e21551. [DOI: 10.1371/journal.pone.0021551] [DOI] [PMC free article] [PubMed] [Google Scholar]
References to other published versions of this review
Serralde‐Zuñiga 2022
- Serralde-Zuñiga AE, González-Garay AG, Rodríguez-Carmona Y, Meléndez-Mier G. Use of fluoxetine to reduce weight in adults with overweight or obesity: Abridged republication of the Cochrane Systematic Review. Obesity Facts 2022;.:Epub ahead of print. [DOI: 10.1159/000524995] [PMID: ] [DOI] [PMC free article] [PubMed] [Google Scholar]