

Abstract
We have examined the basis for G-protein modulation of the neuronal voltage-dependent calcium channels (VDCCs) α1E and α1B. A novel PCR product of α1E was isolated from rat brain. This contained an extended 5′ DNA sequence and was subcloned onto the previously cloned isoform rbEII, giving rise to α1Elong whose N terminus was extended by 50 amino acids. VDCC α1 subunit constructs were co-expressed with the accessory α2-δ and β2a subunits inXenopus oocytes and mammalian (COS-7) cells. The α1Elong showed biophysical properties similar to those of rbEII; however, when G-protein modulation of expressed α1 subunits was induced by activation of co-expressed dopamine (D2) receptors with quinpirole (100 nm) in oocytes, or by co-transfection of Gβ1γ2 subunits in COS-7 cells, α1Elong, unlike α1E(rbEII), was found to be G-protein-modulated, in terms of both a slowing of activation kinetics and a reduction in current amplitude. However, α1Elong showed less modulation than α1B, and substitution of the α1E1–50 with the corresponding region of α1B1–55 produced a chimera α1bEEEE, with G-protein modulation intermediate between α1Elong and α1B. Furthermore, deletion of the N-terminal 1–55 sequence from α1B produced α1BΔN1–55, which could not be modulated, thus identifying the N-terminal domain as essential for G-protein modulation. Taken together with previous studies, these results indicate that the intracellular N terminus of α1E1–50 and α1B1–55 is likely to contribute to a multicomponent site, together with the intracellular I–II loop and/or the C-terminal tail, which are involved in Gβγ binding and/or in subsequent modulation of channel gating.
Keywords: calcium channel, neuronal, G-protein, α1 subunit, Gβγ subunit, modulation
G-protein inhibition of neuronal N (α1B) and P/Q type (α1A) calcium currents is mediated by Gβγ subunits (Herlitze et al., 1996; Ikeda, 1996). The extent of G-protein modulation for the other non-L-type voltage-dependent calcium channel (VDCC) subunit α1E is less well established (for review, see Dolphin, 1998). The human α1E subunit has recently been shown to be inhibited by overexpression of Gβγ subunits (Shekter et al., 1997) and by the activation of G-protein-coupled receptors (Mehrke et al., 1997; Qin et al., 1997). It is of interest that these effects are attenuated by the presence of accessory VDCC β subunits, suggesting functional competition, as previously hypothesized (Campbell et al., 1995b). In contrast, rat brain α1E(rbEII) (Soong et al., 1993) shows no G-protein modulation (Bourinet et al., 1996; Page et al., 1997).
A number of recent studies have investigated the site(s) at which Gβγ subunits bind to α1 subunits. Two such regions have been identified on the non-L-type VDCC subunits. First, the intracellular loop that links transmembrane domains I and II has two binding sites: one containing a QxxER amino acid consensus sequence common to many Gβγ binding proteins, and one nearer the end of the I–II loop (De Waard et al., 1997; Zamponi et al., 1997). Second, a C-terminal site has recently been identified and proposed to be the unique region responsible for G-protein inhibition of human α1E (Qin et al., 1997). A 38 amino acid sequence in the center of the α1E C terminus has been found to bind free Gβγ dimers (Qin et al., 1997).
Functionally, the site of G-protein action remains controversial. Mutations within the I–II loop have been shown either to abolish Gβγ binding and prevent the slowing of activation induced by GTPγS (De Waard et al., 1997) or to enhance modulation (Herlitze et al., 1997), whereas conversion of the entire α1A consensus sequence (QIEER) to that seen in α1C (QQLEE) did attenuate modulation (Herlitze et al., 1997). We observed that transfer of the IS6 and I–II loop from α1B to α1E(rbEII) conferred minor aspects of G-protein sensitivity to the resultant chimera, namely a slowing of activation kinetics in the presence of GTPγS, but did not result in modulation of the calcium current amplitude, as seen in α1B (Page et al., 1997). In contrast, the α1B subunit was reported to retain G-protein modulation when its entire I–II loop was replaced by the corresponding α1C sequence (Zhang et al., 1996), which does not bind Gβγ (De Waard et al., 1997). Their study implicated a role of domain I together with the C terminus in G-protein modulation. In partial agreement with this, the inhibition of human α1E by muscarinic agonists appears to be caused by Gβγ binding solely at the C-terminal site (Qin et al., 1997).
In the present study we have examined the major difference between rat α1E(rbEII) and the corresponding human clone, which is that the latter contains an extended N-terminal sequence. We have isolated a fragment of rat brain α1E containing an extended 5′ DNA sequence and have found that the α1Elong isoform so formed, unlike rbEII, is subject to G-protein modulation. Furthermore, an α1B construct in which the corresponding N-terminal region is deleted shows no G-protein regulation. The data indicate that the N terminus of the α1B and α1E subunits is crucial for their G-protein modulation.
MATERIALS AND METHODS
Materials
The following cDNAs were used: rat α1E (rbEII, GenBank accession number L15453), rabbit α1B (D14157), rat β2a (M80545), rat α2-δ (neuronal splice variant, M86621), rat D2longreceptor (X17458, N5→G), bovine Gβ1 (M13236), bovine Gγ2 (M37183), and mut-3 Green Fluorescent Protein (GFP, U73901). All cDNAs were subcloned into the expression vector pMT2 (Swick et al., 1992).
Production of VDCC α1 constructs
The constructs were produced by PCR methodology described previously (Page et al., 1997). Individual constructs were produced as follows.
α1Elong. A 5′ region of a longer isoform of α1E was isolated by RT-PCR from granule cells, prepared from rat cerebella as described previously (Huston et al., 1993). Total RNA was isolated using the RNeasy miniprep kit (Qiagen, Hilden, Germany). Reverse transcription was performed using M-MLV reverse transcriptase (Promega, Madison, WI) in the presence of RNasin (Promega) and random hexamer primers (Promega) at 37°C for 60 min. The forward primer (primer 1) (see Fig. 1) for PCR (ATA GGT ACC ATG GCT CGC TTC GGG GAG GC) is based on a region completely conserved at the N terminus of the reported human (L27745), mouse (L29346), and rabbit (X67855) α1E cDNA sequences, and also contains a 5′ KpnI extension (GGTACC). The reverse primer E899R (GCC GAT CCA GTC CTT ACA TTC A) is specific for α1E(rbEII). PCR was performed using BIO-X-ACT DNA Polymerase (Bioline), a high-fidelity enzyme mixture. The extended α1E 5′ region was subcloned between the KpnI site (pMT2 polylinker) and the NotI site (bp 158 of rbEII) of α1E(rbEII) pMT2. The DNA and protein sequences are shown in Figure 1. RT-PCR was also performed to determine whether the short isoform of α1E(rbEII) (Soong et al., 1993) could be detected in rat cerebellar granule neurons or whole rat brain. Two separate forward primers, CAT GGT ACC TTG CAG ACC CAG GAA (primer 2) (see Fig. 1) and AGC GGT ACC TGT TCT TCA TGG ATC (primer 3) (see Fig. 1), both containing mutated KpnI sites at the 5′ end, were used together with the reverse primer E899R.
Fig. 1.
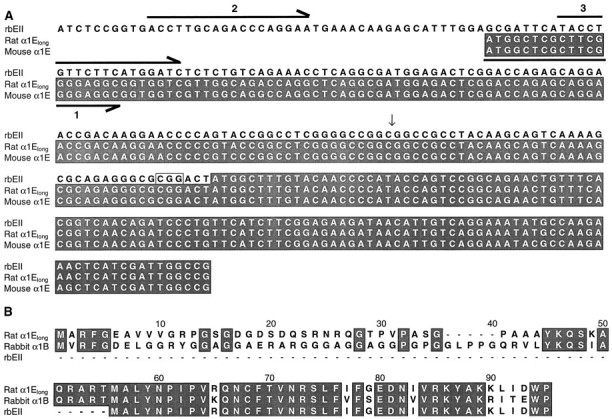
Sequence of α1Elong used in this study. A, DNA alignment of the 5′ sequences of α1E(rbEII) (L15453), rat α1Elong (AF057029), and mouse α1E (L29346). Shaded areas show translated sequences. The vertical arrow shows the position of the restriction site NotI, which was used to subclone the extended 5′ sequence onto α1E(rbEII). The boxed CGG nucleotides before the ATG start site in the α1E(rbEII) were found to be present in the rbEII clone but are absent from the L15453sequence in the database. This triplet is also present in the published mouse, human, and rabbit α1E sequences. The forward primers used (see Materials and Methods) are shown as horizontal arrows, below (primer 1) or above (primers 2 and3) the corresponding sequence. Note that the extended N-terminal sequence of α1Elong shows a high degree of homology with part of the reported 5′ untranslated sequence of the rbEII cDNA. B, Amino acid alignment for the N termini of rat α1Elong, rabbit α1B (published sequence), and rat α1E(rbEII, published sequence). Conserved residues areshaded. The rat α1Elong N-terminal amino acid sequence was also identical to that of the published mouse α1E sequence (L29346).
α1bEEEE. The first 55 amino acids of the N terminus of rabbit α1B was added onto the N terminus of rat α1E(rbEII) to give α1bEEEE. The forward primer (pMT2F) AGC TTG AGG TGT GGC AGG CTT and the reverse primer TGG GGT TGT ACA GCG CCA TGG T were used with the α1B-pMT2 template to give a product of ∼300 bp. This PCR product was used as a forward primer, along with the reverse primer E899R, and extended on α1E(rbEII) pMT2 to give a product of ∼1 kb. Digestion of the PCR product with KpnI and XbaI gave a fragment of ∼800 bp, and this was subcloned onto the 5′ end of α1E(rbEII) in the pMT2 vector.
α1B(ΔN1–55). The α1B was truncated at the 5′ end using the forward primer CGC ACT AGT ACC ATG GCG CTG TAC AA and the reverse primer GTC GCT TCT GCT CTT CTT GG. The PCR product was digested with the enzymes SpeI andKpnI and subcloned into α1B pMT2, which had also been digested with SpeI (polylinker cloning site) andKpnI (1285 bp position in α1B).
All PCR was performed using the proof-reading enzyme Pfu(Stratagene, La Jolla, CA), except for α1Elong as described above. The sequences of the subcloned PCR products were verified by cycle-sequencing using SequiTherm EXCEL II (Epicenter Technologies, Madison, WI). For α1Elong, a number of different RT-PCR reactions were performed, and the products were sequenced. The sequences were found to be the same for all PCR products tested, including the single clone selected for expression studies.
Expression of constructs and electrophysiological recording
Xenopus oocytes. Oocytes were surgically removed from adult Xenopus laevis females and defolliculated by treatment with 2 mg/ml collagenase type Ia in a Ca2+-free ND96 saline containing (in mm): NaCl 96, KCl 2, MgCl2 1, HEPES 5, pH adjusted to 7.4 with NaOH for 2 hr at 21°C. Plasmid cDNAs for the different α1 subunits, plus accessory β2a and α2-δ subunits and rat D2 receptors, were mixed in a ratio of 3:1:1:3 (except where stated), and ∼10 nl was injected into the nuclei of stage V or VI oocytes. Injected oocytes were incubated at 18°C for 3–7 d in ND96 saline (as above plus 1.8 mm CaCl2) supplemented with 100 μg/ml penicillin, 100 IU/ml streptomycin (Life Technologies, Gaithersburg, MD), and 2.5 mm sodium pyruvate. Whole-cell recordings from oocytes were made in the two-electrode voltage-clamp configuration with a chloride-free solution containing (in mm): Ba(OH)2 40, TEA-OH 50, KOH 2, niflumic acid 0.4, HEPES 5, pH 7.4 with methanesulfonic acid. In some experiments niflumic acid was omitted, and oocytes were injected with 30–40 nl of a 100 mm solution of K3-1,2-bis(aminophenoxy)ethane-N,N,N′,N′-tetra-acetic acid (BAPTA) to suppress endogenous Ca2+-activated Cl− currents. Electrodes contained 3 mKCl and had resistances of 0.3–2 MΩ. The holding potential (VH) was −100 mV, and the test potential (Vt) used for time course studies was 0 mV. All illustrated traces are at this potential, and the current amplitude was measured 100 msec after the start of the test pulse. Membrane currents were recorded every 15 sec, amplified and low-pass-filtered at 1 KHz using a Geneclamp 500 amplifier, and digitized through a Digidata 1200 interface (Axon Instruments, Foster City, CA). In all cases currents were leak-subtracted on-line by a P/4 protocol.
COS-7 cells. Cells were cultured and transfected using the electroporation technique, essentially as described previously (Campbell et al., 1995a). The α1, α2-δ, β2a, and GFP cDNAs were used at 15, 5, 5, and 1 μg, respectively. When used, Gβ1 and Gγ2 were included at 2.5 μg each. Blank pMT2 vector was included where necessary to maintain the total cDNA at 31 μg/transfection. Cells were replated using nonenzymatic cell dissociation medium (Sigma, St. Louis, MO) and then maintained at 25°C for between 1 and 16 hr before electrophysiological recording. Maximum GFP fluorescence and VDCC expression were observed between 2 and 4 d post-transfection (Brice et al., 1997). Ca2+ currents were recorded using the whole-cell patch technique. Borosilicate glass electrodes (2–4 MΩ) were used. The internal (electrode) and external solutions were similar to those described previously (Campbell et al., 1995b). The patch pipette solution contained (in mm): Cs aspartate 140, EGTA 5, MgCl2 2, CaCl2 0.1, K2ATP 2, HEPES 10, pH 7.2, 310 mOsm with sucrose. GDPβS (2 mm) was included where stated. The external solution contained (in mm): tetraethylammonium (TEA) bromide 160, KCl 3, NaHCO3 1.0, MgCl2 1.0, HEPES 10, glucose 4, BaCl2 1, pH 7.4, 320 mOsm with sucrose. Whole-cell currents were elicited from VH of −100 mV and recorded using an Axopatch 1D amplifier. Data were filtered at 2 kHz and digitized at 5–10 kHz. The junction potential between external and internal solutions was 6 mV; the values given in the figures and text have not been corrected for this. Current records are shown after leak and residual capacitance current subtraction (P/4 or P/8 protocol) and series resistance compensation up to 85%.
All experiments were performed at room temperature (20–24°C). Analysis was performed using Pclamp6 and Origin software. Data are expressed as mean ± SEM. Statistical analysis was performed using paired or unpaired Student’s t test as appropriate.
RESULTS
Isolation of a long N-terminal isoform of α1E
Amino acid alignment of the rat α1E(rbEII) and the rabbit α1B shows that a high degree of conservation exists within these sequences but that the α1E(rbEII) sequence is 55 amino acids shorter than that of α1B. Alignment of the α1E N termini for mouse (L29346), human (L27745), rabbit (X67855), and rat (L15453) shows that the mouse, human, and rabbit sequences also contain ∼50 additional amino acids at the extreme N terminus. This region is homologous in these species but is missing from the rat sequence. Furthermore, the proximal part of the reported 5′ untranslated region of rbEII shows extensive homology with the mouse, human, and rabbit α1E cDNAs. The initial 5′ DNA sequences in these species are completely conserved, allowing the design of a PCR primer (primer 1) (Fig.1) that could anneal to a longer isoform of α1E, including the ATG corresponding to the start codon in the human, rabbit, and mouse α1E clones. RT-PCR was performed on RNA isolated from rat cerebellar granule cells. The resulting product was of the expected length, compared with the reported sequences of α1E from mouse, human, and rabbit. This was subcloned onto the rat α1E(rbEII) construct to give α1Elong. DNA and protein sequences are shown in Figure 1. The predicted N-terminal amino acid sequence of the PCR-derived α1Elong clone was found to be identical to that of the reported mouse α1E sequence (Williams et al., 1994).
To determine whether we could detect the shorter isoform of α1E(rbEII) in rat brain, RT-PCR was performed using two different forward primers (labeled 2 and 3 in Fig. 1), located in the 5′ noncoding region of rbEII, whose sequence is given in the database, together with the same reverse primer as above. No products were found, using mRNA from either whole rat brain or cerebellar granule cells, with either forward primer, although we have no positive control for the efficacy of the forward primers used, because the rbEII clone that we have is truncated at theNotI site in the 5′-untranslated region (Fig. 1).
Biophysical properties of α1Elong
We have compared the properties of α1Elong with those of α1E(rbEII) and α1B. Current–voltage relationships show no major differences between α1Elongand α1E(rbEII), in terms of either expression levels or voltage dependence of activation (Fig. 2, Table1). Thus, the extended N terminus of α1Elong does not affect its ability to show functional expression.
Fig. 2.

Properties and G-protein modulation of α1Elong: comparison with α1E(rbEII). Ashows the lack of modulation of α1E(rbEII) in the absence of co-transfected VDCC β subunits. α1E(rbEII) was expressed with α2-δ but without β2a subunits in Xenopus oocytes (together with D2 dopamine receptors). Left panel, Example currents, control (1), plus quinpirole (2), and after a depolarizing prepulse to +100 mV in the presence of quinpirole (3). The voltage protocol is shown above the current traces. Middle panel, Time course of IBa amplitude during quinpirole application. Right panel,I–V plot before (○) and during (•) quinpirole application (n = 6). TheI–V data were fitted with a modified Boltzmann equation as described previously (Page et al., 1997).B shows the modulation of α1Elong in the presence of co-transfected VDCC β subunits. α1Elong was expressed with both α2-δ and β2a subunits inXenopus oocytes (together with D2 dopamine receptors). Activation of dopamine D2 receptors by quinpirole (100 nm) in oocytes caused a reversible inhibition ofIBa. Left panel, Example currents, control (1), plus quinpirole (2), and after a depolarizing prepulse in the presence of quinpirole (3). Middle panel, Time course of inhibition by quinpirole. Right panel, I–V plot before (○) and during (•) quinpirole application (n = 9). TheI–V data were fitted as described inA. The boxed inset shows the voltage-dependence of the inhibition by quinpirole from theI–V data of α1Elong(solid bars, n = 9). Data for α1B (open bars, n = 8) are plotted for comparison; * p < 0.01 (Student’st test).
Table 1.
Biophysical properties and G-protein modulation of calcium channel α1 subunits
| System | α1B | α1E(rbEII) | α1Elong | α1bEEEE | α1BΔN1–55 | |
|---|---|---|---|---|---|---|
| IBa slope conductance (μS) | Oocytes | 36.6 ± 3.3 (7) | 17.6 ± 3.4 (8) | 15.6 ± 3.9 (7) | 10.7 ± 1.1 (7) | 28.1 ± 3.1 (15) |
| V50 for control IBa activation (mV) | Oocytes | −8.5 ± 1.3 (7) | −1.2 ± 1.7 (8) | 0.2 ± 1.4 (7) | 2.8 ± 0.7 (7) | −5.3 ± 1.8 (7) |
| V50 forIBa activation plus quinpirole (mV) | Oocytes | −1.0 ± 1.7* (7) | −0.8 ± 1.5 (8) | 3.8 ± 1.3* (7) | 7.0 ± 0.9* (7) | −6.2 ± 1.8 (7) |
| % inhibition by quinpirole at 0 mV | Oocytes | 49.6 ± 3.0 (13) | −3.7 ± 1.5** (11) | 25.8 ± 1.5** (14) | 30.2 ± 3.6** (9) | −1.1 ± 0.9** (18) |
| Maximum controlIBa (+GDPβS) (pA.pF−1) | COS-7 | 24.4 ± 4.3 (5) | 26.1 ± 5.2 (5) | 17.9 ± 3.4 (7) | 22.3 ± 3.7 (7) | 26.5 ± 6.1 (15) |
| τact in control cells (+GDPβS) at −10 mV (msec) | COS-7 | 7.9 ± 1.9 (5) | 4.6 ± 0.6 (5) | 3.3 ± 0.4 (7) | 6.5 ± 1.2 (7) | 7.7 ± 1.3 (15) |
| τact with Gβ1γ2 at −10 mV (msec) | COS-7 | 33.6 ± 4.6 (9) | 7.0 ± 1.1** (6) | 16.7 ± 1.6** (10) | 18.4 ± 1.8** (10) | 6.3 ± 0.7** (5) |
| Facilitation by depolarizing prepulse (P2/P1 at −10 mV) | COS-7 | 5.3 ± 2.0 (8) | 1.0 ± 0.1** (8) | 1.8 ± 0.6** (7) | 1.9 ± 0.3** (8) | 1.1 ± 0.03** (5) |
The parameters determined for the different α1 constructs (co-transfected with β2a and α2-δ) were measured as described in Materials and Methods, and in the legends to Figures 2 and 3. The statistical significances of the differences between the V50 data for the I–V plots in the presence and absence of quinpirole were determined by paired t test, *p < 0.005. The data for quinpirole inhibition ofIBa were determined from time course studies at 0 mV. The statistical significance of the differences in % inhibition by quinpirole, τact in the presence of Gβ1γ2, and facilitation ratio in the presence of Gβ1γ2, for all the constructs compared with α1B, is indicated by **p < 0.01 (Student’s t test). There are no statistically significant differences between α1Elong and α1bEEEE for these parameters (p > 0.05). The differences between other parameters, not relating to G-protein modulation, were not examined.
G-protein modulation of rat brain α1Elong: comparison with α1B
The calcium channel β2a subunit was co-expressed with parental or chimeric α1 subunits because this auxiliary subunit markedly attenuates the voltage-dependent inactivation of all α1 subunits (Olcese et al., 1994). It therefore allows G-protein modulation of activation and current amplitudes to be compared in α1E and other constructs without the interference of differing intrinsic calcium channel inactivation rates. Receptor-mediated calcium current inhibition was reconstructed in Xenopus oocytes by co-expressing the dopamine D2 receptor. Modulation was examined by determining the effect of a saturating concentration of quinpirole (100 nm) on IBa and the reversibility of the inhibition by a depolarizing prepulse. In parallel studies in COS-7 cells, G-protein modulation was studied by co-expression of Gβ1γ2 subunits and examination of the effect of a depolarizing prepulse on activation kinetics and amplitude of IBa.
IBa resulting from α1B expression is strongly modulated both by endogenous G-protein activation and by co-expressed Gβ1γ2 in COS-7 cells (Page et al., 1997, 1998; Stephens et al., 1998a). The inhibition induced after dopamine D2 receptor activation by 100 nm quinpirole was ∼50%, associated with a 7.5 mV depolarizing shift in the voltage for 50% activation (V50) of the current–voltage (I–V) relationship (Table 1). The activation rate of α1B IBa was also significantly slowed by co-expression of Gβ1γ2 (Table 1). In contrast, we observed no modulation of α1E(rbEII), co-expressed with α2-δ and β2a, either by activation of dopamine D2 receptors inXenopus oocytes or by co-expressed Gβ1γ2 in COS-7 cells (Table 1). Because it has recently been observed that modulation of human α1E is only fully manifested in the absence of co-expressed β subunits and is prevented by co-expression of β2a (Yassin et al., 1996; Qin et al., 1997), we also examined whether there was any modulation of α1E(rbEII) in the absence of co-expressed β2a. However, no modulation of α1E(rbEII) was observed by quinpirole in the absence of exogenous β subunits (n = 6) (Fig.2A).
We next examined whether the longer α1E subunit (α1Elong) showed the ability to be G-protein-modulated. When α1Elong was expressed in oocytes (with α2-δ and β2a), quinpirole (100 nm) caused an inhibition of IBa amplitude of ∼26% at 0 mV (Fig. 2B, Table 1). This inhibition was associated with a significant depolarizing shift in theV50 for activation of IBaof 3.6 mV (Table 1) and was reversed by a depolarizing prepulse (Fig.2B). However, the inhibition was significantly less than the modulation observed for α1B (Fig. 2B,inset box; Table 1). We then examined whether the smaller quinpirole-induced inhibition of α1Elong, compared with α1B, was because of co-expression of β2a, but we observed 27.0 ± 2.6% (n = 7) inhibition by 100 nm quinpirole of α1Elong in the absence of co-expressed Ca2+ channel β subunits. Furthermore, inhibition by quinpirole was not abolished when three times the normal amount of β2a cDNA was injected but remained at 22.2 ± 1.9% (n = 7).
Modulation of α1Elong by co-expressed Gβγ subunits
When α1Elong was co-expressed with Gβ1γ2 in COS-7 cells, there was a clear slowing of activation kinetics, compared with IBa recorded in control cells in the presence of GDPβS (Fig. 3A, Table 1), although again this was less than for α1B. In Figure3B, the voltage-dependence of the activation kinetics of α1Elong are compared in the presence and absence of Gβ1γ2. Data for α1E(rbEII), showing the lack of effect of Gβγ co-expression, are also included for comparison. A depolarizing prepulse to +120 mV, applied 10 msec before the test pulse to activate the calcium channel current, is able to provide an estimate of the amount of tonic G-protein modulation attributable to co-expressed Gβγ (Ikeda, 1996). In the presence of co-expressed Gβ1γ2, there was marked prepulse facilitation of the amplitude of α1Elong (Fig. 3C, Table 1), whereas this was not seen in the absence of co-expressed Gβ1γ2 or for α1E(rbEII) (Table 1). However, facilitation of α1Elong in the presence of Gβγ was significantly less than that observed for α1B (Table 1).
Fig. 3.

G-protein modulation of α1Elongexpressed in COS-7 cells. α1Elong was expressed with accessory VDCC α2-δ and β2a subunits in the presence or absence of co-expressed Gβ1γ2. A, Examples of current density–voltage profiles for α1Elong in a control cell in the presence of GDPβS to limit any tonic G-protein modulation (left), and a cell co-expressing Gβ1γ2 (right) (Vt = −40 to −10 mV, in 10 mV steps). B, Voltage-dependence of τact for α1Elong with co-expressed Gβ1γ2 (•, n = 10), α1Elong in the presence of GDPβS (□, n = 7), and α1E(rbEII) with co-expressed Gβ1γ2 (○, n = 5), * p < 0.01 compared with respective control. C, Example of facilitation of α1ElongIBa in the presence of co-expressed Gβ1γ2 by a depolarizing prepulse to +120 mV, 10 msec before and immediately after equivalent test pulses P1 and P2, to test potentials (Vt) between −40 and −10 mV in 10 mV intervals. The voltage protocol is shown above the current traces. Facilitation was then determined as the P2/P1 ratio of the current amplitudes in P1 and P2 (Table 1).
Role of the N terminus of the VDCC α1B subunit in G-protein-mediated inhibition
The inhibition of α1B was significantly more extensive than that of α1Elong, for all parameters measured relating to the extent of modulation both by receptor activation and by Gβ1γ2 co-expression (Table 1). Therefore, we next examined whether substitution of the corresponding N-terminal sequence from α1B would confer further G-protein modulation on α1E. There is a marked divergence of sequence when α1B1–55 is compared with the N-terminal sequence of α1Elong identified here, although the remaining 40 amino acids of the N-terminal tail, proximal to the first transmembrane domain, are highly conserved (Fig. 1). For this reason, a cDNA sequence corresponding to the first 55 amino acids from α1B was added to α1E(rbEII) to give the α1bEEEE chimera (Fig.4A). This construct exhibited a degree of G-protein modulation in oocytes that was similar, although somewhat greater throughout the potential range, to that of α1Elong (Table 1; and compare boxed insets in Figs. 2B, 4A). The extent of inhibition by quinpirole (100 nm) was ∼30% (Table 1), and there was a 4.2 mV depolarizing shift in theV50 for activation of IBacompared with control (Fig. 4B, Table 1). Similarly, in COS-7 cells, the slowing of activation kinetics with Gβ1γ2 was less than that seen with α1B (Fig. 4C, Table 1), and the facilitation of α1bEEEE IBa in the presence of Gβ1γ2, by a depolarizing prepulse, was also less than that shown by α1B (Table 1).
Fig. 4.

G-protein modulation of an α1E construct containing the N terminus of α1B. A, The α1 subunit construct in which the α1B1–55 sequence was added to α1E(rbEII) to form α1bEEEE was expressed with accessory VDCC α2-δ and β2a subunits in Xenopus oocytes (together with D2 receptors) or in COS-7 cells (together with Gβ1γ2 subunits). B, α1bEEEE currents expressed in oocytes.Left panel, Example currents, control (1), plus quinpirole (2), and after a depolarizing prepulse in the presence of quinpirole (3). The voltage protocol is the same as shown in Figure 2A. Middle panel, Time course of inhibition by quinpirole. Right panel,I–V plot before (○) and during (•) quinpirole application (n = 9). TheI–V data were fitted according to the legend to Figure 2. The boxed inset shows the voltage-dependence of the inhibition by quinpirole from theI–V data (open bars,n = 9). Data for α1Elong(solid bars, n = 9) are plotted for comparison; * p < 0.05 (Student’st test). C, α1bEEEE currents expressed in COS-7 cells. Left panel, Example current density–voltage profiles for control α1bEEEEIBa in the presence of 2 mmGDPβS. Middle panel, α1bEEEEIBa in the presence of Gβ1γ2 (Vt = −40 to −10 mV in 10 mV steps).Right panel, Voltage-dependence of τactfor α1bEEEE in the presence (•, n = 5) or absence (○, n = 3) of co-expressed Gβ1γ2; *p < 0.01 compared with respective control.
Examination of the role of α1B1–55 in G-protein modulation of α1B
Because G-protein modulation was observed only in α1Elong and α1bEEEE and not in the N-terminal truncated isoform α1E(rbEII), although the expression levels and biophysical properties of the currents were very similar (Table 1), we next examined whether α1B1–55 also played an essential role in the G-protein modulation of α1B. We therefore created an α1B construct in which this N-terminal sequence was deleted (α1BΔN1–55) (Fig.5A). The expression level of α1BΔN1–55 was similar to that of α1B in both COS-7 cells and Xenopus oocytes (Table 1). However, this construct was no longer subject to modulation by 100 nm quinpirole in oocytes co-expressing the dopamine D2 receptor, either in the presence of co-injected β2a cDNA (Fig. 5B, Table 1) or in its absence (−0.6 ± 1.6% inhibition; n = 7). Similarly, there was no effect of Gβ1γ2 on the activation kinetics of IBa in COS-7 cells, compared with controls recorded in the presence of GDPβS (Fig. 5C, Table 1). Furthermore, there was no facilitation by a depolarizing prepulse of the amplitude of IBa in the presence of Gβ1γ2 (Table 1). These findings highlight the essential role of the α1B1–55 sequence in G-protein inhibition, in terms of both slowed activation kinetics and inhibition of current amplitude.
Fig. 5.

Lack of G-protein modulation of an N-terminally truncated α1B construct. A, The α1 construct in which the α1B1–55 sequence was deleted from α1B to form α1BΔN1–55 was expressed with accessory VDCC α2-δ and β2a subunits in Xenopus oocytes (together with D2 receptors) or in COS-7 cells (together with Gβ1γ2 subunits). B, α1BΔN1–55 currents expressed in oocytes. Left panel, Example currents, control (1), plus quinpirole (2), and after a depolarizing prepulse in the presence of quinpirole (3). The voltage protocol is the same as shown in Figure 2A. Middle panel, Time course of IBa amplitude during quinpirole application. Right panel,I–V plot before (○) and during (•) quinpirole application (n = 7). TheI–V data were fitted according to the legend to Figure 2. C, α1BΔN1–55currents expressed in COS-7 cells. Left panel, Example current density–voltage profiles in the absence or presence of Gβ1γ2 (Vt = −40 to −10 mV in 10 mV steps). Right panel, Voltage-dependence of τact in the presence (•, n = 10) or absence (○, n = 7) of co-expressed Gβ1γ2.
Comparison of the reinhibition kinetics of α1E(long) and α1B
A characteristic feature of voltage-dependent G-protein modulation is that after a large depolarizing prepulse to remove modulation, the G-protein effect may be reinstated in a time- and voltage-dependent manner. The time constant of this reinhibition (τreinhibition) can be determined from the exponential increase of current amplitude, when the duration of the interpulse interval (Δt) between the depolarizing prepulse and test pulse is increased (Fig. 6). When this analysis was performed for the quinpirole-induced inhibition of α1B and α1Elong in oocytes, there was no difference in their reinhibition rates (measured at −100 mV, after a 50 msec depolarizing prepulse to +100 mV). The τreinhibition was 96.6 ± 5.9 msec (n = 9) for α1B and 93.5 ± 5.4 msec (n = 9) for α1Elong. This result suggests that the binding site for Gβγ shows a similar affinity in these two α1 subunits.
Fig. 6.

Reinhibition kinetics of α1Elong and α1B. Prepulses of 50 msec duration to +100 mV were applied, and the time between prepulse and test pulse to 0 mV (interpulse interval Δt at −100 mV) was increased, in 10 msec steps, up to 220 msec. There was no difference between the τreinhibition for α1Elong (○,n = 9) and α1B (•, n = 9)IBa.
DISCUSSION
The molecular determinants for the inhibition of neuronal VDCC α1 subunits by Gβγ have been the subject of intense investigation. However, there remains no consensus of opinion concerning the functional importance of biochemically identified Gβγ-binding sites on the I–II loop and C terminus (De Waard et al., 1997; Page et al., 1997; Qin et al., 1997; Zamponi et al., 1997; for review, see Dolphin, 1998). Furthermore, there has been little agreement on the extent of modulation of the E-type VDCCs (Bourinet et al., 1996; Toth et al., 1996; Yassin et al., 1996; Mehrke et al., 1997;Page et al., 1997; Qin et al., 1997).
Existence of an extended N-terminal isoform of rat brain α1E
We have demonstrated the presence of a longer isoform of rat brain α1E (α1Elong) in rat cerebellar granule cells. This has an N-terminal sequence extended by 50 amino acids compared with rbEII and shows extensive homology with the mouse, rabbit, and human α1E sequences. The α1Elong was the only isoform detected in rat brain, although we have no positive control for the two different forward primers in the reported 5′ untranslated sequence of rbEII that were used (Fig. 1).
The rat α1Elong isoform is G-protein-modulated
Initially, both rat and human α1E were reported not to be modulated by G-proteins (Bourinet et al., 1996; Toth et al., 1996; Page et al., 1997). However, it then became clear that human α1E was capable of being G-protein-modulated (Mehrke et al., 1997; Qin et al., 1997) but showed high sensitivity to functional antagonism by VDCC β subunits (Shekter et al., 1997), and particularly to β2a, which occluded G-protein modulation (Qin et al., 1997). This would also be a possible explanation for the lack of inhibition of α1E(rbEII) by co-expressed Gβγ or by activation of dopamine D2 receptors. However, a number of points argue against this explanation. First, the novel rat α1Elong isoform identified here is clearly modulated despite the presence of β2a, and second, we also observed no receptor-mediated modulation of α1E(rbEII) expressed inXenopus oocytes in the absence of β2a. Thus, the presence of α1E1–50 in α1Elong confers G-protein sensitivity onto α1E(rbEII). The α1E clone has been suggested to be the molecular counterpart of the resistant R-type calcium current in cerebellar granule neurons, which makes up ∼15–20% of the total calcium current in these cells (Randall and Tsien, 1995); however, it is not known whether R-type current shows G-protein modulation.
The α1B1–55 sequence contributes to G-protein inhibition of α1B
Our initial studies have shown that transfer of a sequence corresponding to α1B1–483 (representing the N terminus, domain I, and the I–II loop of the α1B subunit) into α1E(rbEII) conferred both slowing of activation kinetics and reduction in current amplitude in response to either Gβγ overexpression or activation of a G-protein-linked receptor (Stephens et al., 1998b), whereas a region corresponding to the IS6/I–II loop of α1B conferred only partial slowing of activation kinetics, with no modulation of current amplitude (Page et al., 1997). The α1E(rbEII) N-terminal tail is 55 amino acids shorter than that of α1B, although the 40 amino acids that form the α1E(rbEII) N-terminal tail do have a highly (82%) conserved counterpart in α1B56–95 (Fig. 1). The present study provides compelling evidence for the involvement of α1B1–55 in its G-protein modulation. Deletion of α1B1–55 (forming the α1BΔN1–55construct) renders the α1B subunit, which exhibits the strongest degree of G-protein sensitivity of all the α1 subunits, completely refractory to receptor-mediated inhibition and to the direct effect of Gβγ overexpression. For both α1E and α1B, the biophysical properties of the truncated and N-terminal extended forms are very similar, suggesting that the truncation does not produce global structural changes. When the α1B1–55 sequence was transferred to rbEII, the α1bEEEE construct showed slowed activation kinetics and prepulse-induced facilitation in the presence of Gβγ and receptor-mediated inhibition, but in these measures the G-protein modulation was less than that shown by α1B itself. This suggests that other elements of α1B are also important for its modulation. It is also relevant to compare α1bEEEE with α1Elong, which forms the backbone of the channel and was also less modulated than α1B. In fact, α1bEEEE was inhibited to a slightly greater extent than α1Elong in all parameters measured. Thus, part of the basis for the greater intrinsic G-protein modulation of α1B than α1E is likely to be located within the first 55 amino acids of the N terminus, and part is located elsewhere in the first domain/I–II loop sequence of α1, because we have shown that the α1B–α1E chimera containing α1B1–483 (to the end of the I–II loop) is modulated by a similar extent as α1B itself (Stephens et al., 1998b). Furthermore, α1Elong was not further inhibited by quinpirole in the absence of exogenously expressed β subunits, whereas the difference in the extent of modulation between α1A and α1B was attenuated in the absence of co-expressed β3 subunits (Roche and Treistman, 1998).
Having implicated the N-terminal domains of α1B and α1Elong in their G-protein modulation, it is of interest to compare our results with those of a previous study of the determinants of G-protein modulation that compared a series of chimeras between α1B and α1A or α1C (Zhang et al., 1996). However, in this paper, α1B and all the constructs containing the α1B first domain were composed of approximately the first 70 amino acids of α1A ligated onto a truncated α1B subunit, which was found to improve the expression of rat α1B (Ellinor et al., 1994). In our study we report receptor-mediated inhibition of α1B of ∼50%, in line with most other reported values (Bourinet et al., 1996; Currie and Fox, 1997), all of which are higher than the inhibition of α1B (∼20%) seen byZhang and co-workers (1996). Such an atypically small amount of receptor-mediated inhibition of α1B might be explained by the overexpression of Gβγ in their study, which will partially occlude agonist effects (Herlitze et al., 1996; Ikeda, 1996). However, given the role of α1B1–55, these differences may also be attributable to the exchange of the α1B N-terminal sequence for that of α1A, a subunit that has been widely reported to be more weakly G-protein-modulated than α1B (Bourinet et al., 1996). Nevertheless, a difference in modulation was still found between the α1B construct used in their study and α1A, indicating that other regions in domain I are of importance (Zhang et al., 1996).
Comparison of reinhibition kinetics of α1B and α1Elong
Zhang et al. (1996) proposed that the weaker modulation of the α1A subunit relative to α1B is attributable to an increased rate of dissociation of Gβγ from α1A than from α1B; however, differing results were obtained in another expression study (Roche and Treistman, 1998). Furthermore, when N and P/Q currents, which are their native counterparts, were compared in chromaffin cells, no difference in reinhibition kinetics was observed (Currie and Fox, 1997). In the present study, we found that although G-protein inhibition of α1Elong was significantly less than that of α1B, their reinhibition kinetics were very similar. Thus, our findings may be more consistent with intrinsic differences existing between these α1 subunits in terms of Gβγ efficacy. One important caveat is the competitive role of accessory β subunits, which have been shown to differentially affect G-protein–α1 subunit interactions (Roche and Treistman, 1998). However, even in the absence of exogenous β subunits, quinpirole inhibition of α1Elong remained significantly less than that of α1B, although differential effects of the endogenous oocyte β3 (Tareilus et al., 1997) cannot be discounted.
Molecular mechanism of G-protein inhibition
Our findings implicating the N terminus of α1B and α1E subunits in G-protein modulation prompt a reevaluation of the composition of the Gβγ binding site. An unanswered question is whether the N-terminal region comprises a Gβγ binding site or whether it contributes an element to a multifaceted site, in which high-affinity Gβγ binding occurs elsewhere, and the N-terminal region contributes to the functional consequences of binding. Some evidence against the former possibility comes from Qin et al. (1997), who found no high-affinity binding of purified Gβγ subunits to a fusion protein containing N-terminal amino acids 1–89 of human α1E, which has a high degree of homology with the corresponding sequence of rat brain α1Elong (Fig. 1). It is therefore unlikely, although not impossible, that Gβγ binding would differ significantly between such highly conserved sequences. Gβγ subunits are capable of binding to the I–II loop of α1A, α1B, and α1E and to the C terminus of α1E and possibly other α1 subunits; therefore, it is likely that one (or both) of these elements contributes to a multicomponent site. Recent evidence supports the hypothesis that different elements may also contribute to VDCC α1-β binding sites, with the demonstration that some β subunits (β2a and β4) may bind at two sites on the α1 subunit, one of high affinity (I–II loop) and the other of much lower affinity (C-terminal tail) (Walker et al., 1998). Any interaction between Gβγ or the VDCC β subunit and the α1 N-terminal tail may be of a secondary, low-affinity nature, or the N-terminal tail may be essential for subsequent inhibition of the channel gating.
Footnotes
This work was supported by The Wellcome Trust and the European Community (Marie Curie Fellowship to C.C.). We thank the following for generous gifts of cDNAs: T. Snutch (University of British Columbia, Vancouver, Canada), α1E(rbEII); H. Chin (National Institutes of Health, Bethesda, MD), α2-δ; Y. Mori (Seriken, Okazaki, Japan), α1B; E. Perez-Reyes (Loyola, New Orleans, LA), β2a; P. G. Strange (Reading, UK), rat D2 receptor; M. Simon (CalTech, CA), Gβ1 and Gγ2; T. Hughes (Yale, New Haven, CT), mut-3 GFP; and Genetics Institute (CA), pMT2. We thank I. Tedder, M. Li, and J. May for technical assistance, and J. Millar and A. G. Jones for the cerebellar granule cells. This work benefited from the use of the Seqnet facility (Daresbury, UK).
Correspondence should be addressed to Professor A. C. Dolphin, Department of Pharmacology (Medawar Building), University College London, Gower Street, London WC1E 6BT, UK.
REFERENCES
- 1.Bourinet E, Soong TW, Stea A, Snutch TP. Determinants of the G protein-dependent opioid modulation of neuronal calcium channels. Proc Natl Acad Sci USA. 1996;93:1486–1491. doi: 10.1073/pnas.93.4.1486. [DOI] [PMC free article] [PubMed] [Google Scholar]
- 2.Brice NL, Berrow NS, Campbell V, Page KM, Brickley K, Tedder I, Dolphin AC. Importance of the different β subunits in the membrane expression of the α1A and α2 calcium channel subunits: studies using a depolarisation-sensitive α1A antibody. Eur J Neurosci. 1997;9:749–759. doi: 10.1111/j.1460-9568.1997.tb01423.x. [DOI] [PubMed] [Google Scholar]
- 3.Campbell V, Berrow N, Brickley K, Page K, Wade R, Dolphin AC. Voltage-dependent calcium channel β-subunits in combination with α1 subunits have a GTPase activating effect to promote hydrolysis of GTP by Gαo in rat frontal cortex. FEBS Lett. 1995a;370:135–140. doi: 10.1016/0014-5793(95)00813-o. [DOI] [PubMed] [Google Scholar]
- 4.Campbell V, Berrow NS, Fitzgerald EM, Brickley K, Dolphin AC. Inhibition of the interaction of G protein Go with calcium channels by the calcium channel β-subunit in rat neurones. J Physiol (Lond) 1995b;485:365–372. doi: 10.1113/jphysiol.1995.sp020735. [DOI] [PMC free article] [PubMed] [Google Scholar]
- 5.Currie KPM, Fox AP. Comparison of N and P/Q type voltage-gated calcium channel current inhibition. J Neurosci. 1997;17:4570–4579. doi: 10.1523/JNEUROSCI.17-12-04570.1997. [DOI] [PMC free article] [PubMed] [Google Scholar]
- 6.De Waard M, Liu HY, Walker D, Scott VES, Gurnett CA, Campbell KP. Direct binding of G-protein βγ complex to voltage-dependent calcium channels. Nature. 1997;385:446–450. doi: 10.1038/385446a0. [DOI] [PubMed] [Google Scholar]
- 7.Dolphin AC. Mechanisms of modulation of voltage-dependent calcium channels by G proteins. J Physiol (Lond) 1998;506:3–11. doi: 10.1111/j.1469-7793.1998.003bx.x. [DOI] [PMC free article] [PubMed] [Google Scholar]
- 8.Ellinor PT, Zhang J-F, Horne WA, Tsien RW. Structural determinants of the blockade of N-type calcium channels by a peptide neurotoxin. Nature. 1994;372:272–275. doi: 10.1038/372272a0. [DOI] [PubMed] [Google Scholar]
- 9.Herlitze S, Garcia DE, Mackie K, Hille B, Scheuer T, Catterall WA. Modulation of Ca2+ channels by G-protein βγ subunits. Nature. 1996;380:258–262. doi: 10.1038/380258a0. [DOI] [PubMed] [Google Scholar]
- 10.Herlitze S, Hockerman GH, Scheuer T, Catterall WA. Molecular determinants of inactivation and G protein modulation in the intracellular loop connecting domains I and II of the calcium channel α1A subunit. Proc Natl Acad Sci USA. 1997;94:1512–1516. doi: 10.1073/pnas.94.4.1512. [DOI] [PMC free article] [PubMed] [Google Scholar]
- 11.Huston E, Cullen G, Sweeney MI, Pearson H, Fazeli MS, Dolphin AC. Pertussis toxin treatment increases glutamate release and dihydropyridine binding sites in cultured rat cerebellar granule neurons. Neuroscience. 1993;52:787–798. doi: 10.1016/0306-4522(93)90529-o. [DOI] [PubMed] [Google Scholar]
- 12.Ikeda SR. Voltage-dependent modulation of N-type calcium channels by G protein βγ subunits. Nature. 1996;380:255–258. doi: 10.1038/380255a0. [DOI] [PubMed] [Google Scholar]
- 13.Mehrke G, Pereverzev A, Grabsch H, Hescheler J, Schneider T. Receptor-mediated modulation of recombinant neuronal class E calcium channels. FEBS Lett. 1997;408:261–270. doi: 10.1016/s0014-5793(97)00437-7. [DOI] [PubMed] [Google Scholar]
- 14.Olcese R, Qin N, Schneider T, Neely A, Wei X, Stefani E, Birnbaumer L. The amino terminus of a calcium channel β subunit sets rates of channel inactivation independently of the subunit’s effect on activation. Neuron. 1994;13:1433–1438. doi: 10.1016/0896-6273(94)90428-6. [DOI] [PubMed] [Google Scholar]
- 15.Page KM, Stephens GJ, Berrow NS, Dolphin AC. The intracellular loop between domains I and II of the B-type calcium channel confers aspects of G-protein sensitivity to the E-type calcium channel. J Neurosci. 1997;17:1330–1338. doi: 10.1523/JNEUROSCI.17-04-01330.1997. [DOI] [PMC free article] [PubMed] [Google Scholar]
- 16.Page KM, Stephens GJ, Canti C, Berrow NS, Dolphin AC. Role of domain I of the α1B calcium channel subunit in G protein modulation. Biophys J. 1998;74:A105. [Google Scholar]
- 17.Qin N, Platano D, Olcese R, Stefani E, Birnbaumer L. Direct interaction of Gβγ with a C terminal Gβγ binding domain of the calcium channel α1 subunit is responsible for channel inhibition by G protein coupled receptors. Proc Natl Acad Sci USA. 1997;94:8866–8871. doi: 10.1073/pnas.94.16.8866. [DOI] [PMC free article] [PubMed] [Google Scholar]
- 18.Randall A, Tsien RW. Pharmacological dissection of multiple types of Ca2+ channel currents in rat cerebellar granule neurons. J Neurosci. 1995;15:2995–3012. doi: 10.1523/JNEUROSCI.15-04-02995.1995. [DOI] [PMC free article] [PubMed] [Google Scholar]
- 19.Roche JP, Treistman SN. The Ca2+ channel β3 subunit differentially modulates G-protein sensitivity of α1A and α1B Ca2+ channels. J Neurosci. 1998;18:878–886. doi: 10.1523/JNEUROSCI.18-03-00878.1998. [DOI] [PMC free article] [PubMed] [Google Scholar]
- 20.Shekter LR, Taussig R, Gillard SE, Miller RJ. Regulation of human neuronal calcium channels by G protein βγ subunits expressed in human embryonic kidney 293 cells. Mol Pharmacol. 1997;52:282–291. doi: 10.1124/mol.52.2.282. [DOI] [PubMed] [Google Scholar]
- 21.Soong TW, Stea A, Hodson CD, Dubel SJ, Vincent SR, Snutch TP. Structure and functional expression of a member of the low voltage-activated calcium channel family. Science. 1993;260:1133–1136. doi: 10.1126/science.8388125. [DOI] [PubMed] [Google Scholar]
- 22.Stephens GJ, Brice NL, Berrow NS, Dolphin AC. Facilitation of rabbit α1B calcium channels: involvement of endogenous Gβγ subunits. J Physiol (Lond) 1998a;509:15–27. doi: 10.1111/j.1469-7793.1998.015bo.x. [DOI] [PMC free article] [PubMed] [Google Scholar]
- 23.Stephens GJ, Canti C, Page KM, Dolphin AC. Role of domain I of neuronal Ca2+ channel α1 subunits in G protein modulation. J Physiol (Lond) 1998b;509:163–169. doi: 10.1111/j.1469-7793.1998.163bo.x. [DOI] [PMC free article] [PubMed] [Google Scholar]
- 24.Swick AG, Janicot M, Cheneval-Kastelic T, McLenithan JC, Lane DM. Promoter-cDNA-directed heterologous protein expression in Xenopus laevis oocytes. Proc Natl Acad Sci USA. 1992;89:1812–1816. doi: 10.1073/pnas.89.5.1812. [DOI] [PMC free article] [PubMed] [Google Scholar]
- 25.Tareilus E, Roux M, Qin N, Olcese R, Zhou JM, Stefani E, Birnbaumer L. A Xenopus oocyte β subunit: evidence for a role in the assembly/expression of voltage-gated calcium channels that is separate from its role as a regulatory subunit. Proc Natl Acad Sci USA. 1997;94:1703–1708. doi: 10.1073/pnas.94.5.1703. [DOI] [PMC free article] [PubMed] [Google Scholar]
- 26.Toth PT, Shekter LR, Ma GH, Philipson LH, Miller RJ. Selective G-protein regulation of neuronal calcium channels. J Neurosci. 1996;16:4617–4624. doi: 10.1523/JNEUROSCI.16-15-04617.1996. [DOI] [PMC free article] [PubMed] [Google Scholar]
- 27.Walker D, Bichet D, Campbell KP, De Waard M. A β4 isoform-specific interaction site in the carboxyl-terminal region of the voltage-dependent Ca2+ channel α1A subunit. J Biol Chem. 1998;273:2361–2367. doi: 10.1074/jbc.273.4.2361. [DOI] [PubMed] [Google Scholar]
- 28.Williams ME, Marubio LM, Deal CR, Hans M, Brust PF, Philipson LH, Miller RJ, Johnson EC, Harpold MM, Ellis SB. Structure and functional characterization of neuronal α1E calcium channel subtypes. J Biol Chem. 1994;269:22347–22357. [PubMed] [Google Scholar]
- 29.Yassin M, Zong SQ, Tanabe T. G-protein modulation of neuronal class E (α1E) calcium channel expressed in GH3 cells. Biochem Biophys Res Commun. 1996;220:453–458. doi: 10.1006/bbrc.1996.0426. [DOI] [PubMed] [Google Scholar]
- 30.Zamponi GW, Bourinet E, Nelson D, Nargeot J, Snutch TP. Crosstalk between G proteins and protein kinase C mediated by the calcium channel α1 subunit. Nature. 1997;385:442–446. doi: 10.1038/385442a0. [DOI] [PubMed] [Google Scholar]
- 31.Zhang JF, Ellinor PT, Aldrich RW, Tsien RW. Multiple structural elements in voltage-dependent Ca2+ channels support their inhibition by G proteins. Neuron. 1996;17:991–1003. doi: 10.1016/s0896-6273(00)80229-9. [DOI] [PubMed] [Google Scholar]