

Abstract
The Na+/Ca2+ exchanger is a major transporter of Ca2+ in neurons and glial cells. The Na+/Ca2+ exchanger gene NCX1 expresses tissue-specific isoforms of the Na+/Ca2+ exchanger, and the isoforms have been examined here quantitatively using primary cultures of astrocytes and neurons. We present a PCR-based quantitative method, quantitative end-labeled reverse transcription-PCR (QERT-PCR), to determine the relative amounts of the NCX1 isoforms present in these cells. Six exons (A, B, C, D, E, and F) are alternatively spliced to produce the known NCX1 isoforms. Three exon B-containing isoforms (BDEF, BDF, and BD) are the predominant transcripts in primary rat cortical astrocytes and in C6 glioma cells. In contrast, exon A-containing isoforms (ADF and AD) are the predominant transcripts in primary rat hippocampal neurons. Functional differences between full-length constructs of NCX1 containing either the astrocyte isoform BD or the neuron isoform AD were examined in a Xenopusoocyte expression system. Although both isoforms function normally, the activity of the AD isoform can be increased 39% by activation of protein kinase A (PKA), whereas that of the BD isoform is not affected. We conclude that specific NCX1 isoforms are expressed in distinct patterns in astrocytes and neurons. Furthermore, the activity of a neuronal (but not glial) isoform of the Na+/Ca2+ exchanger can be altered by the activation of the PKA pathway.
Keywords: membrane transporter, quantitative PCR, RNase protection, Xenopus oocyte expression, PKA, QERT-PCR
The Na+/Ca2+ exchanger plays a major role in regulating Ca2+ homeostasis in neurons and astrocytes (Reuter, 1991; Takuma et al., 1996). In neurons, the Na+/Ca2+ exchanger extrudes Ca2+ that enters after depolarization-activated or after glutamate-activated channel activity (White and Reynolds, 1995). Similarly, in astrocytes, the Na+/Ca2+ exchanger plays a central role in extruding Ca2+ from the cytosol after Ca2+ influx (e.g., activated by glutamate, noradrenaline, or ATP) (Golovina et al., 1996; Takuma et al., 1996). Regulation of [Ca2+]i in both cell types is important and depends in part on Na+/Ca2+ exchanger function influencing neurotransmission, memory encoding, gene expression, and neuroglial communication (Cornell-Bell et al., 1990; Finkbeiner, 1993;Nedergaard, 1994; Parpura et al., 1994; Porter and McCarthy, 1995). These processes are also modulated by multiple protein kinases and the dynamics of cellular and subcellular Ca2+ signaling (Berridge, 1997). Dipolo et al. (1997) provide strong evidence that a phosphorylation step can accelerate Na+/Ca2+ exchanger transport, but the specific kinase and its function have remained controversial. Although Collins et al. (1992) did not observe any effect by PKA or PKC on Na+/Ca2+ exchanger function,Smith and Smith (1995) report that PKC inhibits function. In contrast,Iwamoto (1996) found that PKC increases the activity of both the cloned and native Na+/Ca2+ exchanger. Our study investigates the multiple gene products of the Na+/Ca2+ exchanger gene (NCX1) present in astrocytes and neurons and examines the distribution of the Na+/Ca2+ exchanger isoforms. We also examine the action of PKA on specific isoforms of the Na+/Ca2+ exchanger using aXenopus oocyte expression system.
Three Na+/Ca2+ exchanger genes (NCX1, NCX2, and NCX3) have been found to be transcriptionally active in rat brain (Li et al., 1994; Nicoll et al., 1996). Our work focuses on the mammalian NCX1 gene products present in most tissues. Each functional Na+/Ca2+ exchanger isoform consists of 11 transmembrane domains and a large intracellular loop that regulates the Na+/Ca2+exchanger function. Although NCX1 isoforms have been shown to be generated by alternative splicing, no difference in the function of these isoforms has been demonstrated. Six exons (A, B, C, D, E, and F) were shown to exist in the gene and are responsible for producing the isoforms of NCX1 (Kofuji et al., 1994). It is clear that not all tissues express the same NCX1 isoforms and that some tissues express multiple isoforms (Kofuji et al., 1992, 1993; Nakasaki et al., 1993;Lee et al., 1994; Quednau et al., 1997). However, the relative contributions of different NCX1 isoforms and functional implications of different patterns of isoform expression in various cells have not been possible to examine until now.
In this study, we examine quantitatively the isoform expression in astrocytes and neurons using a PCR method, quantitative end-labeled reverse transcription-PCR or QERT-PCR. We show that astrocytes have a distinct and different pattern of isoform expression when compared with neurons. The astrocytes preferentially express exon B-containing isoforms, and neurons express exon A-containing isoforms. We also show that PKA activates the neuronal Na+/Ca2+ exchanger isoform AD but does not affect the astrocytic isoform BD. Parts of this paper have been published previously (He et al., 1997).
MATERIALS AND METHODS
Cell culture. For astrocyte cultures, cerebral cortices of neonatal Sprague Dawley rats (<1-d-old) were mechanically dissociated, and cells were cultured in medium containing equal amounts of DMEM and F12 with 10% fetal bovine serum (FBS), penicillin (50 units/ml), and streptomycin (50 μg/ml) at 37°C with 5% CO2 (Booher and Sensenbrenner, 1972). RNA was extracted from 8–10 d cultures. At this time immunocytochemistry was used to determine that >95% of the cells were positive for the astrocyte protein glial fibrillary acidic protein (GFAP). C6 glioma cells (American Type Culture Collection, Rockville, MD) were cultured in DMEM supplemented with 10% FBS, penicillin, and streptomycin and were used for RNA extraction.
For neuron cultures, hippocampi from the brains of 19-d-old rat fetuses were isolated as described (Bambrick et al., 1995). The cultures were maintained in MEM with B27 supplement. RNA was extracted after 4 d, at which time >90% of the cultured cells were stained by anti-neurofilament antibody (Sternberg Immunologicals).
RNA isolation and RT-PCR. Total RNA was isolated from primary astrocytes, C6 glioma cells, and neuron cultures using the CsCl method (Sambrook et al., 1989). To make cDNA, we used either oligo-dT or random hexamer primers (Boehringer Mannheim, Indianapolis, IN) with MMLV reverse transcriptase (Gibco BRL, Bethesda, MD). To amplify NCX1 cDNA, the 5′ primer was ACGGATCC TCTGCGATTGCTTGTCTCGG [underlined sequence is complementary to NCX1 cDNA, nucleotides (nt) 1600–1619], and the 3′ primer was GTCGGATCC AATGATCACTTCCAGCTTG (nt 2187–2205), based on the rat cardiac NCX1 cDNA sequence (Low et al., 1993). The amplification primers for NCX2 cDNA were 5′- CTGCGTGTGGGCGATGCTCAG (nt 1453–1473) and 3′- GACCTCGAGGCGACAGTTCTC (nt 1963–1983) (Li et al., 1994). The amplification was performed in a Biosycler PCR machine (Bios Corporation) as follows: initial denaturation at 94°C for 3 min, addition of Taq polymerase (Gibco BRL) followed by 30 cycles of 1 min at 65°C, 1 min at 72°C, and 45 sec at 94°C, and final elongation for 10 min at 72°C.
Ribonuclease protection assay. Total RNA was isolated from primary astrocytes. A multiprobe ribonuclease protection assay was used to study the relative amount of NCX1 and NCX2 mRNA in primary astrocytes. For the NCX1 probe, a pair of oligonucleotides (5′, nt 460–479, sense; and 3′, nt 747–765, antisense) (Low et al., 1993) was used in RT-PCR to obtain a 306 bp fragment of NCX1. This fragment was cloned into the TA vector (Invitrogen, San Diego, CA) and sequenced. For the NCX2 probe, the 531 bp fragment (nt 1453–1983) of NCX2 (Li et al., 1994) in the TA cloning vector was used. After the plasmid DNAs were linearized, antisense RNA probes for NCX1 and NCX2 were labeled with [γ-32P]UTP (Amersham, Arlington Heights, IL) using SP6 RNA polymerase. The RNA probes were purified by PAGE, and 2 × 10⁵ cpm of each probe was used to hybridize with 20 μg of total astrocyte RNA. After hybridization, RNase A/T1 (RPA-II; Ambion) was used to digest the unhybridized RNA probe. NCX1- and NCX2-protected fragments were resolved using 5% polyacrylamide denaturing gels, and the intensity of the protected fragments was analyzed using ImageQuant software version 3.3 (Molecular Dynamics, Sunnyvale, CA).
Cloning, oligonucleotide hybridization, and DNA sequencing.PCR products from astrocyte cDNA were separated, gel purified using GlassPac QuicKit (Marsh), and cloned into TA cloning vector following the manufacturer’s protocol (Invitrogen). For oligonucleotide hybridization, the inserts were excised with BamHI. After the DNA was separated by agarose gel electrophoresis, DNA was transferred to nylon membranes (MSI, Westboro, MA), and the samples were prehybridized in 6× SSC, 5× Denhardt’s solution, 0.05% sodium pyrophosphate, 0.5% SDS, and 1 mm EDTA, pH 8.0. [γ-32P]ATP- (Amersham) labeled oligonucleotides were used as hybridization probes at temperatures based on theTm of exon-specific oligonucleotide probes. The sequences used for the oligonucleotide hybridization were based on the exon organization described in rabbit genomic sequence (Kofuji et al., 1994) and on published cDNA sequences [A, C, D, and F in rat heart (Low et al., 1993) and B in rabbit kidney (Kofuji et al., 1994)]. The probe for exon E ( GAAAAAAGATGTATG) was derived from the published sequence for the rat cDNA (Nakasaki et al., 1993). Membranes were washed using 6× saline-sodium phosphate-EDTA buffer and were autoradiographed at −80°C with intensifying screens. Representative isoforms containing different exon combinations of NCX1 were also sequenced by the dideoxynucleotide termination method (Sanger et al., 1977) with the Sequenase 2.0 kit (USB). A similar cloning and sequencing strategy was used in characterizing a 531 bp fragment of NCX2.
QERT-PCR analysis. A pair of oligonucleotides, 5′- ACACCTGTGGAGAGCTGGAA (nt 1823–1842) and 3′- TGGTCAGTGGCTGCTTGTCA (nt 2105–2124) (Low et al., 1993), were designed for QERT-PCR. These oligonucleotides permit amplification of the alternatively spliced region for all NCX1 isoforms. The 3′ oligonucleotide was end labeled by [γ-32P]ATP. The radioactive QERT-PCR was performed under similar conditions as described above using an annealing temperature of 59°C. After specific cycle numbers (cycle 20 and 23), samples were removed, denatured for 5 min, and loaded on a 5% polyacrylamide sequencing gel. After electrophoresis, the dried gels were analyzed using the phosphoimager.
We demonstrated by mixing different ratios of amplifiable material that the size of the amplified product (from 191 to 275 bp) did not affect the amount of PCR products (data not shown). We also observed that the amount of PCR product routinely differed by <3% from that expected to be found in the admixing experiments.
Construction of rat full-length NCX1 isoforms. The full-length rat cardiac NCX1 cDNA was subcloned into pSD64TF (Krieg and Melton, 1984), a vector designed to increase the stability of RNA used in oocyte expression. To replace the alternatively spliced region of this cDNA, we subcloned PCR products containing the sequence of different isoforms into an NCX1 cassette. The unique restriction sitesAflII (nt 1051) and Bsp120L (nt 2872) that flank the alternatively spliced region present in the NCX1 cassette were used to engineer the full-length NCX1 into pSD64TF, containing different alternatively spliced regions.
PKA regulation of NCX1 isoforms expressed in Xenopusoocytes. Complementary RNA was prepared from the 2909 bp full-length rat NCX1 cDNA using the mMessage mMachine kit (Ambion) from clones containing either AD or BD isoforms of rat NCX1. Oocytes were harvested by surgery and isolated using collagenase (Goldin, 1992). The oocytes were maintained in modified L15 media at 16°C (Goldin, 1992). cRNA was injected into stage V and VI oocytes using a Drummond microinjector. Two days after injection, Na+-dependent 45Ca2+influx was measured at 32°C. The oocytes were preincubated for 30 min in 90 mm Na+ solution containing 0.5 mm ouabain (90 mm NaCl, 30 μmCaCl2, 250 μmMgCl2, and 5 mm HEPES, pH 7.5), and ouabain was present in all subsequent solutions. The solution was changed to either 0 Na+ (90 mm KCl replaces NaCl in 90 mm Na+ solution) or 90 mm Na+ solution, both containing 10 μCi/ml 45CaCl2. After a 20 min incubation, the oocytes were washed, and radioactivity was counted in individual oocytes. To block Na+/Ca2+exchanger activity, we added 5 mm Ni2+to the 0 Na+ solution. To activate PKA, we added a cAMP-dependent protein kinase-activating cocktail (10 μmforskolin, 100 μmN6,2′-O-dibutyryl cAMP, and 100 μm 1-methyl-3-isobutylxanthine; Sigma, St. Louis, MO) to the 90 mm Na+ preincubating solution (Kuzhikandathil and Molloy, 1994). For PKA inhibition, the oocytes were preincubated in 90 mm Na+ solution containing 1 μm KT5720 (LC Laboratories) (Kamei et al., 1992) for 2 hr before the oocytes were switched to PKA-activating cocktail. The results were calculated as mean ± SEM, and Student’s unpaired t test was used to analyze the significance of the difference between means.
Phosphorylation of glutathione transferase fusion proteins.The entire intracellular loop of NCX1 containing either the AD or the BD alternatively spliced region was engineered into pGEX-4T-1 vector (Pharmacia, Piscataway, NJ) using PCR. Bacteria expressing these fusion proteins were cultured, and protein was prepared as described by the manufacturer (Pharmacia). When cleavage of the protein from glutathione transferase (GST) was required, it was performed in PBS containing 0.2 μg/μl thrombin for 4 hr at room temperature. The cleaved protein preparation (15 μg) was incubated with 15 units of the catalytic subunit of protein kinase A (Sigma) and γ-32P-labeled ATP. Proteins were analyzed using an 8% SDS-PAGE gel. Proteins were stained with Coomassie blue, or the gel was exposed for autoradiography.
RESULTS
NCX1 and NCX2 in cultured rat primary astrocytes
It had been reported previously that both NCX1 and NCX2 could be found transcribed in rat brain tissues (Li et al., 1994); however we could amplify the NCX2 fragment only from primary astrocytes but not from neuronal cultures at 35 cycles of RT-PCR amplification (data not shown). We used RNase protection to determine the relative amounts of mRNA for NCX1 and NCX2 in primary astrocytes. The RNase protection probe used for NCX1 contained a 306 bp region that is present in all NCX1 mRNAs, and the NCX2 probe is a 531 bp fragment (Li et al., 1994). [γ-32P]UTP-labeled antisense RNA probes for both NCX1 and NCX2 were synthesized, and an equal number of counts for both probes was hybridized to total astrocyte RNA. Only the sequences from mRNA that were identical to the probe would be protected from RNase digestion. In Figure 1, lanes 1 and 3 contain the protected fragments for NCX2 and NCX1, respectively, showing that both NCX genes were transcribed in rat astrocytes. Lane 4 (Fig. 1) contains the protected fragments using a mixture of the two probes. Comparison of the intensity for the two protected fragments shows a >20-fold excess of NCX1 over NCX2 message in the rat astrocytes.
Fig. 1.

Quantitation of NCX1 and NCX2 in primary astrocytes by RNase protection. [α-32P]UTP-labeled NCX1 and NCX2 RNA probes were synthesized, and 2 × 10⁵ cpm of the probes was used to hybridize with 20 μg of total astrocyte RNA (lanes 1, 3,4). Twenty micrograms of yeast RNA were used as a negative control in lane 2. After hybridization, the unprotected RNA was digested by RNase A and T1. The protected fragments were denatured and separated in 5% polyacrylamide gels. The probes used were: lane 1, NCX2 probe;lane 3, NCX1 probe; and lanes 2,4, both NCX1 and NCX2 probes. Clearly, NCX1 message predominates in astrocyte cultures.
Fig. 3.

Analysis and quantitation of major NCX1 isoforms in primary astrocytes using QERT-PCR. A, Astrocyte cDNA was amplified by a pair of oligonucleotides flanking the 5′ and 3′ ends of the alternatively spliced region (one oligonucleotide was γ-32P-end-labeled). The same volumes of QERT-PCR products at different cycle numbers (cycle 20 and 23) were loaded on a 5% sequencing gel and separated (lanes 1, 2, respectively). Lane 3 is the PCR product from a 1:1:1:1 mixture of plasmid DNA of four representative astrocyte clones, as indicated on the right. B, Signal intensity of each band at cycle 23 of the QERT-PCR in Awas analyzed by area integration using the phosphoimager. Relative amounts of the three predominant NCX1 isoforms were plotted as a percentage of the total signal intensity. Two independent astrocyte cultures were studied (Prep 1, Prep 2). Values are mean ± SEM from duplicate experiments from the two independent preparations (n = 2). Three predominate isoforms of NCX1, each representing 23% of the exchanger transcripts, are seen in astrocyte cultures.
Na+/Ca2+ exchanger NCX1 isoforms in primary astrocytes
To determine which isoforms of the Na+/Ca2+ exchanger NCX1 are present in astrocyte cultures, we made cDNA from total RNA. Based on the published rat Na+/Ca2+exchanger sequence (Low et al., 1993), we synthesized oligonucleotides flanking the region that displays alternative splicing for PCR amplification (Kofuji et al., 1993, 1994). The PCR products consisted of multiple bands when visualized in an agarose gel (Fig.2, lane 2). These products were subcloned, and colonies that hybridized to an internal oligonucleotide from the conserved 5′ region of the amplified product were studied further. Plasmid DNA from these clones was separated on an agarose gel, transferred, and hybridized with a series of oligonucleotides that identified the rat exon regions. Figure 2,lanes 3–6, shows four different hybridization patterns that were observed from astrocytes (BD, BDE, BDF, and BDEF). All astrocyte clones contained the mutually exclusive exon B but not exon A, and all contained exon D. These clones were sequenced and found to be in agreement with the deduced exon pattern suggested by the hybridization presented in Figure 2. The sequence of rat exon B was found to be identical to the sequence published for the homologous exon in rabbit (Kofuji et al., 1994).
Fig. 2.
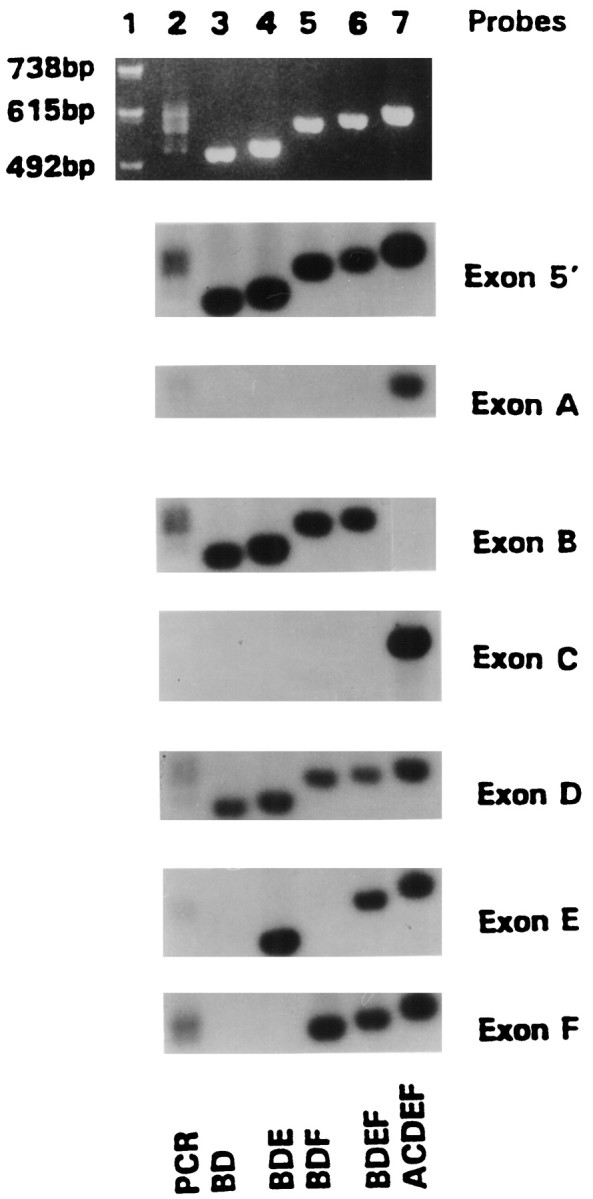
Representative NCX1 isoforms in primary astrocytes. cDNA transcribed from astrocyte RNA was amplified with oligonucleotides specific for 5′ and 3′ ends flanking the alternatively spliced region. The RT-PCR product was subcloned, and plasmid DNA of representative clones was isolated. Top panel, An ethidium bromide-stained agarose gel showing the amplified PCR products. Bottom panels, The PCR products and subclones hybridized with particular exon-specific γ-32P-labeled oligonucleotides; lane 1, 123 bp size marker;lane 2, astrocyte RT-PCR products; lanes 3–6, plasmid DNA of isoforms BD, BDE, BDF, and BDEF, respectively; and lane 7, cardiac isoform ACDEF of NCX1 used as a control. On the right are noted the labeled oligonucleotide probes used to determine exon composition of NCX1 isoforms. The four different astrocyte clones contain exons B and D.
Quantitation of NCX1 isoforms in astrocytes
We developed a PCR-based strategy to analyze the relative amounts of the different isoforms present in RNA rapidly. This quantitative end-labeled RT-PCR method called QERT-PCR uses an end-labeled oligonucleotide and standard reverse-transcribed PCR. This technique uses oligonucleotide primers from the conserved regions that are identical in all isoforms. To facilitate quantitation, we end label one of the primers with γ-32P. When the PCR products were separated on a sequencing gel, the size permits identification of the composition of exons in the isoform, and the band intensity reflects the relative amount of that isoform. This approach requires only a small amount of cDNA and a limited number of amplification cycles to identify products. Preliminary experiments that included mixing various ratios of plasmid DNA from different astrocyte clones (Fig. 1) had shown that the amounts of products correlated with the relative amounts of DNA used in the amplification and there was no bias in amplification based on the size of the products (191–275 bp; data not shown).
Figure 3A presents the results for different numbers of amplification cycles when astrocyte RNA was used to produce cDNA. Three predominant bands of near equal intensity (Fig. 3A, lanes 1, 2) were observed and corresponded with the size of BDEF, BDF, and BD isoforms. When the bands for 23 cycles of amplification (lane 2) were quantitated using the phosphoimager, three predominant isoforms, each representing 23% of the total labeled product, were noted (Fig.3B). Similar results were obtained when another group of neonatal rats was used to culture astrocytes and the amplification was repeated (Fig. 3B, Prep 1, Prep 2). These results demonstrated that three predominant isoforms of equal amounts constitute most of the NCX1 message in cultured primary astrocytes.
Quantitation of NCX1 isoforms in the C6 glioma cell line
The results presented in Figure 3 may reflect the expression of different NCX1 isoforms by the subtypes of astrocytes in the culture. We compared the NCX1 isoform analysis from cultured astrocytes with the C6 glioma cell line. The rat C6 glioma cells have many of the same characteristics that the primary astrocytes have and have been used as a model glial cell in a number of studies (Bissell et al., 1974; Kumar et al., 1986). To characterize the NCX1 isoforms in C6 cells, we prepared RNA from different passages of the cells and reverse transcribed this RNA for QERT-PCR analysis. Figure 4Ashows that different C6 cultures (P1, P10, and P20) display the same predominant isoforms observed for the primary astrocytes. When the intensity of the NCX1 isoforms in C6 cells was quantitated (Fig. 4B), the percentages for the predominant isoforms BDEF, BDF, and BD were 12.8 ± 0.1, 26.4 ± 0.3, and 48.2 ± 0.6%, respectively. These three predominant isoforms in C6 cells account for >87% of the total signal intensity in the lane. The percentages of the predominant isoforms in C6 cells differed in the amounts when compared with primary astrocytes but were constant across different passage numbers of the cell line. The expression of multiple isoforms in the C6cell cultures strongly suggests that individual cells can express more than one NCX1 isoform.
Fig. 4.

Analysis and quantitation of major NCX1 isoforms in the C6 glioma cell line. A, cDNA of C6 glioma cells was amplified by QERT-PCR for 23 cycles.P1, P10, and P20 refer to PCR products from passages 1, 10, and 20 of the C6 cells, respectively. PCR product from primary astrocytes was loaded on theright lane (AST). The positions of the predominant isoforms from C6 cells and primary astrocytes are indicated on the right. B, Signal intensity of each band from QERT-PCR in A was analyzed. Relative amounts of the three predominant NCX1 isoforms from C6 cells (dark bars) and astrocytes (cross-hatched bars) were plotted as the percentage of the total signal intensity. Values are mean ± SEM (n = 4). C6 glioma cells express the same three predominate isoforms of NCX1 that astrocytes express.
NCX1 isoforms in primary neuronal cultures
To investigate whether different brain cell types use specific NCX1 isoforms, we performed QERT-PCR on rat primary hippocampal neurons. Figure 5A shows the products of the QERT-PCR for the neuronal cells (lanes 2, 4). There were two predominant isoforms present in neurons, and they differed from those in the astrocytes (lanes 1, 3). The size and sequence analysis demonstrated that the two predominant isoforms present in neuronal cell cultures were ADF and AD, with 57.6 ± 0.5 and 37.5 ± 0.9%, respectively (Fig. 5B). Other minor bands accounted for <5% of the total signal intensity in the lane after 23 cycles. Therefore, the major isoforms for the astrocytes and neurons were different, with the astrocytes using exon B-containing isoforms and the neurons using exon A-containing isoforms.
Fig. 5.

Analysis and quantitation of major NCX1 isoforms in rat hippocampal neurons. A, cDNA of hippocampal neurons was amplified by QERT-PCR. The PCR products from primary neuronal cultures (lanes 2, 4) and from astrocyte cultures (lanes 1, 3) at different PCR cycle numbers (lanes 1, 2, cycle 20; lanes 3, 4, cycle 23) were separated using a 5% sequencing gel. B, Signal intensities of NCX1 isoforms from neuron cultures in Aat cycle 23 were analyzed, and relative amounts of the two predominant isoforms were plotted as the percentage of total signal intensity. Values are mean ± SEM from duplicate samples from two independent experiments (n = 2). Two predominate isoforms of NCX1, which differ from those observed in astrocytes, are seen in cultured neurons.
Functions of NCX1 isoforms of astrocyte and neuron are differently regulated by PKA
The differential expression of B exon-containing isoforms in astrocytes and A exon-containing isoforms in neurons suggests that specific isoforms may function differently. To determine whether there is any functional difference between the A and B exon-containing isoforms, we cloned the full-length rat Na+/Ca2+ exchanger isoforms for two predominant isoforms containing exons BD (astrocytes) and AD (neurons) into the pSD64TF vector. These two clones only differ in the exons in the alternatively spliced region and were used to produce cRNA for injection into Xenopus oocytes. After 2 d, the oocytes were studied using Na+-dependent45Ca2+ influx (Ruknudin et al., 1997). Figure 6A shows little Ca2+ influx with 90 mm[Na+]o. However, in the presence of 0 [Na+]o, the Ca2+ influx was high for the AD isoform (269.7 ± 16.2 pmole/20 min/oocyte). The Ca2+ entry by the Na+/Ca2+ exchanger was abolished when 5 mm NiCl2 was included in the 0 [Na+]o solution. When activators of protein kinase A (10 μm forskolin, 100 μmdb-cAMP, and 100 μm IBMX) were added during preincubation, Ca2+ influx mediated by the neuron AD isoform in the absence of Na+ increased to 372.9 ± 6.6 pmole/20 min/oocyte (a 39% increase). To ensure that the increase for AD isoform was a specific effect caused by activation of the PKA pathway, we preincubated 1 μm KT5720, a PKA inhibitor, with oocytes for 2 hr before PKA activation. Figure6A demonstrates that PKA activation no longer enhanced Ca2+ influx in the AD isoform after treatment with the PKA inhibitor (276.9 ± 7.9 pmole/20 min/oocyte). Water-injected oocytes did not display any significant Ca2+ influx (data not shown).
Fig. 6.

PKA activation increases Ca2+uptake in oocytes expressing the neuron NCX1 isoform but not an astrocyte isoform. A,45Ca2+ uptake was measured inXenopus oocytes injected with cRNA of neuronal isoform AD. Oocytes were exposed to 90 mm NaCl or 90 mmKCl (0 Na); 5 mm NiCl2 was used to block the exchanger. Ca2+ uptake in 0 Na+solution was significantly higher than that in 90 mmNa+ solution (p < 0.001) and was blocked by Ni2+. After PKA activation (described in Materials and Methods), Ca2+ uptake was significantly higher than that in 0 Na+ only (p < 0.001), and this upregulation was blocked by KT5720 (p < 0.001).B, 45Ca2+ uptake was measured in Xenopus oocytes injected with cRNA of astrocyte isoform BD. Ca2+ uptake in 0 Na+ was significantly higher than that in 90 mm Na+ (p < 0.001) and was blocked by Ni2+. But in contrast, activation by PKA did not increase the Ca2+ uptake in 0 Na+. Values are mean ± SEM (n = 10–25 oocytes). An A exon-containing isoform (AD) found in neurons is upregulated after activation of the PKA pathway, whereas isoform BD, found in astrocytes, is not.
Oocytes expressing the BD isoform displayed a Na+-dependent Ca2+ influx (289.6 ± 16.2 pmole/20 min/oocyte) in the presence of 0 [Na+]o (Fig. 6B). The Ca2+ influx observed for the BD isoform was inhibited when Ni2+ was applied. Interestingly, the Ca2+ influx did not increase above what was observed in 0 [Na]o (298.2 ± 4.4 pmole/20 min/oocyte) after pretreatment with activators of the PKA pathway. This is in contrast to what was observed for the AD isoform. Therefore, a neuronal NCX1 isoform AD could be upregulated by PKA activation, and the upregulation was specifically blocked by a PKA inhibitor, whereas the astrocyte isoform BD was not modulated by PKA. These experiments demonstrate that PKA regulation depends on the presence of a specific sequence in the alternatively spliced region of the NCX1 protein.
Phosphorylation of fusion proteins containing the intracellular loop of the NCX1-expressing isoform AD or BD
To determine whether the intracellular loop of the NCX1 protein is directly phosphorylated, we prepared GST fusion proteins containing the entire intracellular loop with either isoform AD or BD. Figure7A demonstrates the expression of these fusion proteins at their predicted molecular weights. Although the GST protein itself was not phosphorylated using the in vitro system, a GST fusion with Grb-2 (a gift of Dr. T. Gustafston) is easily detected after phosphorylation (Fig.7B). However, there is no detectable labeling of the GST fusion protein with either isoform of NCX1. This suggests that the intracellular loop does not contain a PKA phosphorylation site that can be identified by the active subunit of PKA.
Fig. 7.

Expression and phosphorylation of GST–NCX fusion proteins. A, The entire intracellular loop of an astrocyte and a neuron isoform of the Na+/Ca2+ exchanger was expressed as a GST fusion protein. Lane 1, GST–Grb2; lane 2, GST only; lane 3, GST–neuron isoform (containing exons AD); and lane 4, GST–astrocyte isoform (containing exons BD). The fusion proteins were purified by affinity chromatography and subjected to SDS-PAGE. Proteins were stained with Coomassie blue, and their apparent molecular sizes were calculated based on migration relative to standards shown inlane M. B, Autoradiogram of GST fusion proteins phosphorylated with the catalytic subunit of PKA using [γ-32P]ATP is shown. The labeled proteins were cleaved with thrombin and separated using SDS-PAGE, with the marker sizes represented on the right. Lanedesignation is the same as that described in A. Only the positive control fusion protein GST–Grb2 is phosphorylated.
DISCUSSION
Preferential distribution of NCX1 isoforms
Three exon B-containing isoforms (BDEF, BDF, and BD) are the major mRNA transcripts of the NCX1 gene both in primary astrocytes and in C6 glioma cells, whereas two exon A-containing isoforms (ADF and AD) are predominant in neurons. We have demonstrated previously that rabbit kidney and cardiac cells express different NCX1 isoforms (Kofuji et al., 1993) that are produced by alternative splicing of a single NCX1 gene (Kofuji et al., 1994). Six exons (A, B, C, D, E, and F) code for a small region in the C terminal of the large intracellular loop of the protein. Our proposal that the exon A and exon B are expressed in a mutually exclusive manner (Kofuji et al., 1994) is consistent with our results presented here. Although several laboratories have described the tissue-specific nature of the isoform pattern in various tissues (Kofuji et al., 1993, 1994; Nakasaki et al., 1993; Lee et al., 1994; Quednau et al., 1997), this is the first report to describe identification and quantitation of the NCX1 isoforms in different cells from brain.
In addition to the alternative splicing in the intracellular loop, others have reported splicing in other regions of the NCX1 gene. Although sequence variation in the 5′-untranslated region of NCX1 has been shown to be related to promotor specificity (Barnes et al., 1997), these differences are not reflected in the mature protein. Splicing variants of NCX1 that lack portions of the C-terminal transmembrane segments have been detected in frog. Although these truncated transcripts have been shown to be functional (Gabellini et al., 1996), the relative contribution of these transcripts in vivo is not known. In contrast, alternative splicing in the intracellular loop region is responsible for producing different mature NCX1 proteins whose function may be regulated differently as shown in this report.
QERT-PCR
Understanding the functional significance of different cell type-specific patterns of NCX1 isoform expression requires determining which isoforms are present and the relative contributions of each isoform. To quantitate the levels of various isoforms of NCX1 in cells, we developed QERT-PCR that has several advantages over cloning methods and other quantitative PCR methods (Wang et al., 1989). First, using an end-labeled oligonucleotide in QERT-PCR requires fewer PCR amplification cycles to identify PCR products and minimizes potential artifacts. Second, QERT-PCR products can easily be quantitated because they are labeled to the same extent. Third, separation of the QERT-PCR products on a sequencing gel increases resolution, and in our case, individual isoform type can be identified based on its size. Fourth, analysis of the band intensity of QERT-PCR products using the phosphoimager is rapid and reproducible. Thus, QERT-PCR analysis randomly samples large numbers of the cDNAs made from transcripts and is similar to random cloning procedures.
Quantitation of isoforms using QERT-PCR
In the analysis of primary astrocytes using QERT-PCR, only three bands (BDEF, BDF, and BD) could be visualized in the gel at low cycle numbers (Fig. 3A, lane 1), and these are the predominant bands. One interpretation is that there are subpopulations of astrocytes, each expressing one predominant isoform. However, the findings that two independent astrocyte cultures gave identical results, three predominant isoforms in equivalent amounts, and that a similar pattern of three predominant isoforms was observed in the C6 glioma cell line suggest that the NCX1 isoforms BDEF, BDF, and BD are coexpressed in individual astrocytes. In C6 glioma cells, the relative amount of the three isoforms did not change when different passages of the cultured cells were studied, eliminating experimental variability or the influence of passage in the culturing process. Although C6 cells expressed the same pattern of isoforms as did the primary astrocytes, they showed different percentages of these isoforms that may reflect the consequence of prolonged culturing and/or the transforming event. In analyzing neuronal NCX1 isoforms, we found that the exon A-containing isoforms ADF and AD are the major isoforms expressed, in agreement with cloning data from brain tissue (Lee et al., 1994). The results for the short-term neuronal cell culture show that different percentages of the predominant isoforms ADF and AD are present. Each neuronal cell may express both isoforms, or there might be subsets of hippocampal neurons containing different NCX1 isoforms.
In astrocytes, at 23 cycles of amplification (Fig. 3A,lane 2), additional bands could be detected. These less intense bands correspond to other minor NCX1 isoforms based on their size, and they are present at a 5–20-fold reduced level when compared with the predominant isoforms of NCX1. The minor bands observed in higher amplification cycles could come either from the very low levels of expression by the major cell type (astrocytes) or from contaminating cells present in the culture (oligodendrocytes or microglia). Reduced amounts of the minor isoforms were also observed at higher amplification cycles in the analysis of neurons (Fig.5A).
Role of phosphorylation on the Na+/Ca2+ exchanger
To study the functional significance of the different patterns of NCX1 isoform expression in astrocytes and neurons, previous work on the Na+/Ca2+ exchanger and other transport proteins has provided insight. For example, in class A brain Ca2+ channels, non-L-type channels present in brain cells, alternative splicing produces multiple isoforms of subunit α1A that are differently regulated by second messenger-activated protein kinases (Sakurai et al., 1995). The IP3 receptor is known to undergo alternative splicing to alter the preferred sites for PKA phosphorylation in a tissue-specific manner, and the PKA phosphorylation could result in differential regulation of the receptors (Schell et al., 1993). The PKA pathway is present in both astrocytes (Bender et al., 1994) and neurons (Pedarzani and Storm, 1995) and has been reported to increase Na+/Ca2+ exchanger activity in some systems (Caroni and Carafoli, 1983; DiPolo et al., 1997). Because the alternatively spliced A and B exons are in the intracellular loop and are possibly accessible for kinase action, we asked whether there was a functional difference in the effects of phosphorylation on A and B exon-expressing NCX1 isoforms. Because we have shown that multiple isoforms are present in individual cells, we expressed a single NCX1 isoform in the Xenopus oocyte expression system to study selectively the effects of single exon differences in PKA regulation of Na+/Ca2+ exchanger function. When full-length NCX1 isoforms containing exons AD or BD were expressed in oocytes, AD isoform activity was upregulated on PKA activation, but BD was not. Therefore expression of the A versus B exon may determine the PKA regulation of Na+/Ca2+exchanger function.
Protein phosphorylation by PKA is a common step in the signal transduction pathway of many neurotransmitters (e.g., norepinephrine, serotonin, histamine, and dopamine) (Haas, 1985; Madison and Nicoll, 1986; Pedarzani and Storm, 1993; Torres et al., 1995). In our present study, the activity of the Na+/Ca2+ exchanger containing exons AD, one of the predominant isoforms in hippocampal neurons, is enhanced by activation of the PKA pathway. The increase in cAMP in response to neurotransmitters may lead to phosphorylation of the Na+/Ca2+ exchanger that then reduces the [Ca2+]i and can then modulate Ca2+-dependent processes. The PKA insensitivity of the BD isoform may allow neurotransmitters to modulate selectively the activity of the Na+/Ca2+ exchanger in neurons by enhancing cAMP-dependent protein kinase pathways without affecting the function of the Na+/Ca2+exchanger in adjacent astrocytes. This is important because many of the receptors for these neurotransmitters are found both in astrocytes and neurons (White and Reynolds, 1995; Takuma et al., 1996). Changing the activity of the Na+/Ca2+exchanger will alter the magnitude and duration of subsequent Ca2+ transients and may be an important pathway for regulating responses. The present study shows that this regulation will be dependent on a cell-specific pattern of the Na+/Ca2+ exchanger isoform expression.
Our demonstration that different NCX1 isoforms have different responses to kinase may explain reports in which the effect of phosphorylation on the Na+/Ca2+ exchanger function seems to depend on cell type as well as on experimental conditions. The different responses to various kinases observed in diverse tissues could mainly be caused by the type of isoform of the Na+/Ca2+ exchanger being expressed. In cardiac myocytes that express an A-containing isoform of NCX1 (Kofuji et al., 1993; Li et al., 1994; Quednau et al., 1997; this report), both PKA and PKC increase the activity of the Na+/Ca2+ exchanger (Caroni and Carafoli, 1983; Iwamoto et al., 1996), whereas in neuronal cells, only PKA enhances the activity of the exchanger by phosphorylation (Dipolo et al., 1997). The smooth muscle cells and kidney epithelial cells have the exon B-containing isoform of NCX1, as opposed to the cardiac and neuronal cells with exon A-containing isoforms of NCX1. Interestingly, the PKC increased smooth muscle Na+/Ca2+ exchanger activity in the short-term, whereas long-time exposure to PKC reduced the activity of the exchanger (Smith and Smith, 1995; Iwamoto et al., 1996); in renal epithelial cells, the PKC downregulates the Na+/Ca2+ exchanger (Smith et al., 1995). Thus, the effect of phosphorylation may depend on the specific NCX1-specific isoform in each cell. The present report has demonstrated that one of the neuronal isoforms but not the astrocytic isoform of NCX1 was affected by PKA activation. We also demonstrate that the entire intracellular loop does not contain a site that can be identified by the active subunit of PKA using GST fusion constructs. These results do not eliminate the possibility that (1) another portion of the Na+/Ca2+ exchanger is phosphorylated, (2) other molecules that regulate Na+/Ca2+ exchanger function are affected by PKA activation, or (3) the assay system used was not sensitive enough to identify the phosphorylation site(s). Further studies of other isoforms with single exon differences, combined with measurement of the relative contribution of each isoform to the Na+/Ca2+ exchanger population in the cell, will enable us to build a picture of the phosphorylation regulating the Na+/Ca2+ exchanger in specific cells.
In conclusion we have demonstrated that the NCX1 message is present in a greater concentration than is the NCX2 message in both astrocytes and neurons using RNase protection and PCR methods. Different patterns of NCX1 isoform expression in astrocytes and neurons were identified by cloning and quantitated using our novel end-labeled RT-PCR technique QERT-PCR. Differential regulation of the Na+/Ca2+ exchanger isoforms from astrocytes and neurons by PKA activation has been demonstrated. Such a regulatory difference between NCX1 isoforms may permit cells to respond differentially to external factors like neurotransmitters.
Footnotes
This work was supported by grants-in-aid from the American Heart Association (D.H.S.) and Maryland Affiliate (A.R.), by National Institutes of Health Grants AG08191 (D.H.S.), HL25675 (W.J.L.), and HL36974 (W.J.L.), and by a grant from the University of Maryland Short-term Research Institute Fund (L.L.B.). We thank Dr. Martin K. Slodzinski for technical advice on neonatal rat cortical astrocyte preparation.
Correspondence should be addressed to Dr. Dan H. Schulze, Department of Microbiology and Immunology, 655 West Baltimore Street, University of Maryland at Baltimore, School of Medicine, Baltimore, MD 21201.
REFERENCES
- 1.Bambrick LL, Yarowsky PJ, Krueger BK. Glutamate as a hippocampal neuron survival factor: an inherited defect in the trisomy 16 mouse. Proc Natl Acad Sci USA. 1995;92:9692–9696. doi: 10.1073/pnas.92.21.9692. [DOI] [PMC free article] [PubMed] [Google Scholar]
- 2.Barnes KV, Cheng G, Dawson MM, Menick DR. Cloning of cardiac, kidney, and brain promoters of the feline NCX1 gene. J Biol Chem. 1997;272:11510–11517. [PubMed] [Google Scholar]
- 3.Bender AS, Mantelle LL, Norenberg MD. Stimulation of calcium uptake in cultured astrocytes by hypoosmotic stress-effect of cyclic AMP. Brain Res. 1994;645:27–35. doi: 10.1016/0006-8993(94)91634-9. [DOI] [PubMed] [Google Scholar]
- 4.Berridge MJ. The AM and FM of calcium signalling. Nature. 1997;386:855–858. doi: 10.1038/386759a0. [DOI] [PubMed] [Google Scholar]
- 5.Bissell MG, Rubinstein LJ, Bignami A, Herman MM. Characteristics of the rat C6 glioma maintained in organ culture systems. Production of glial fibrillary acidic protein in the absence of langliofibrillogenesis. Brain Res. 1974;82:77–89. doi: 10.1016/0006-8993(74)90894-4. [DOI] [PubMed] [Google Scholar]
- 6.Booher J, Sensenbrenner M. Growth and cultivation of dissociated neurons and glial cells from embryonic chick, rat and human brain in flask cultures. Neurobiology. 1972;2:97–105. [PubMed] [Google Scholar]
- 7.Caroni P, Carafoli E. The regulation of the Na/Ca exchanger of heart sarcolemma. Eur J Biochem. 1983;132:451–460. doi: 10.1111/j.1432-1033.1983.tb07383.x. [DOI] [PubMed] [Google Scholar]
- 8.Collins A, Somlyo AV, Hilgemann DW. The giant cardiac membrane patch method: stimulation of outward Na-Ca exchange current by MgATP. J Physiol (Lond) 1992;454:27–57. doi: 10.1113/jphysiol.1992.sp019253. [DOI] [PMC free article] [PubMed] [Google Scholar]
- 9.Cornell-Bell AH, Finkbeiner SM, Cooper MS, Smith SJ. Glutamate induces calcium waves in cultured astrocytes: long-range glial signaling. Science. 1990;247:470–473. doi: 10.1126/science.1967852. [DOI] [PubMed] [Google Scholar]
- 10.Dipolo R, Berberian G, Delgado D, Rojas H, Beauge L. A novel 13 kDa cytoplasmic soluble protein is required for the nucleotide (MgATP) modulation of the Na/Ca exchange in squid nerve fibers. FEBS Lett. 1997;401:6–10. doi: 10.1016/s0014-5793(96)01416-0. [DOI] [PubMed] [Google Scholar]
- 11.Finkbeiner SM. Glial calcium. Glia. 1993;9:83–104. doi: 10.1002/glia.440090202. [DOI] [PubMed] [Google Scholar]
- 12.Gabellini N, Iwata T, Carafoli E. An alternative splicing site modifies the carboxyl-terminal trans-membrane domains of the Na+/Ca2+ exchanger. J Biol Chem. 1995;270:6917–6924. doi: 10.1074/jbc.270.12.6917. [DOI] [PubMed] [Google Scholar]
- 13.Gabellini N, Zatti A, Rispoli G, Navangione A, Carafoli E. Expression of an active Na+/Ca+2 exchanger isoform lacking the 6 c-terminal transmembrane segments. Eur J Biochem. 1996;239:897–904. doi: 10.1111/j.1432-1033.1996.0897u.x. [DOI] [PubMed] [Google Scholar]
- 14.Goldin AL. Maintenance of Xenopus laevis and oocyte injection. Methods Enzymol. 1992;207:266–279. doi: 10.1016/0076-6879(92)07017-i. [DOI] [PubMed] [Google Scholar]
- 15.Golovina VA, Bambrick LL, Yarowsky PJ, Krueger BK, Blaustein MP. Modulation of two functionally distinct Ca2+ stores in astrocytes: role of the plasmalemmal Na/Ca exchanger. Glia. 1996;16:296–305. doi: 10.1002/(SICI)1098-1136(199604)16:4<296::AID-GLIA2>3.0.CO;2-Z. [DOI] [PubMed] [Google Scholar]
- 16.Haas HL. Histamine may act through cyclic AMP on hippocampal neurons. Agents Actions. 1985;16:234–235. doi: 10.1007/BF01983148. [DOI] [PubMed] [Google Scholar]
- 17.He S, Ruknudin A, Luo S, Schulze DH. PKA regulation of sodium-calcium exchanger activity on different NCX1 spliced isoforms. Biophys J. 1997;72:A64. [Google Scholar]
- 18.Iwamoto T, Pan Y, Wakabayashi S, Imagawa T, Yamanaka HI, Shigekawa M. Phosphorylation-dependent regulation of cardiac Na+/Ca2+ exchanger via protein kinase C. J Biol Chem. 1996;271:13609–13615. doi: 10.1074/jbc.271.23.13609. [DOI] [PubMed] [Google Scholar]
- 19.Kamei C, Mukai T, Tasaka K. Histamine-induced depolarization and the cyclic AMP-protein kinase A system in isolated guinea pig adipocytes. Jpn J Pharmacol. 1992;60:179–186. doi: 10.1254/jjp.60.179. [DOI] [PubMed] [Google Scholar]
- 20.Kofuji P, Hadley RW, Kieval RS, Lederer WJ, Schulze DH. Expression of the Na-Ca exchanger in diverse tissues: a study using the cloned human cardiac Na-Ca exchanger. Am J Physiol. 1992;263:C1241–C1249. doi: 10.1152/ajpcell.1992.263.6.C1241. [DOI] [PubMed] [Google Scholar]
- 21.Kofuji P, Lederer WJ, Schulze DH. Na+/Ca2+ exchanger isoforms expressed in kidney. Am J Physiol. 1993;265:F598–F603. doi: 10.1152/ajprenal.1993.265.4.F598. [DOI] [PubMed] [Google Scholar]
- 22.Kofuji P, Lederer WJ, Schulze DH. Mutually exclusive and cassette exons underlie alternatively spliced isoforms of the Na+/Ca2+ exchanger. J Biol Chem. 1994;269:5145–5149. [PubMed] [Google Scholar]
- 23.Krieg PA, Melton DA. Functional messenger RNAs are produced by SP6 in vitro transcription of cloned cDNAs. Nucleic Acids Res. 1984;12:7057–7070. doi: 10.1093/nar/12.18.7057. [DOI] [PMC free article] [PubMed] [Google Scholar]
- 24.Kumar S, Holmes E, Scully S, Birren BW, Wilson RH, de Vellis J. The hormonal regulation of gene expression of glial markers: glutamine synthetase and glycerol phosphate dehydrogenase in primary cultures of rat brain and in C6 cell line. J Neurosci Res. 1986;16:251–264. doi: 10.1002/jnr.490160122. [DOI] [PubMed] [Google Scholar]
- 25.Kuzhikandathil EV, Molloy GR. Transcription of the brain creatine kinase gene in glial cells is modulated by cyclic AMP-dependent protein kinase. J Neurosci Res. 1994;39:70–82. doi: 10.1002/jnr.490390110. [DOI] [PubMed] [Google Scholar]
- 26.Lee SL, Yu ASL, Lytton J. Tissue-specific expression of Na-Ca exchanger isoforms. J Biol Chem. 1994;269:14849–14852. [PubMed] [Google Scholar]
- 27.Li Z, Matsuoka S, Hryshko LV, Nicoll DA, Bersohn MM, Burke EP, Lifton RP, Philipson KD. Cloning of the NCX2 isoform of the plasma membrane Na+-Ca2+ exchanger. J Biol Chem. 1994;269:17434–17439. [PubMed] [Google Scholar]
- 28.Low W, Kasir J, Rahamimoff H. Cloning of the rat heart Na+-Ca2+ exchanger and its functional expression in HeLa cells. FEBS Lett. 1993;316:63–67. doi: 10.1016/0014-5793(93)81737-k. [DOI] [PubMed] [Google Scholar]
- 29.Madison DV, Nicoll RA. Cyclic adenosine 3′,5′-monophosphate mediates beta-receptor actions of noradrenaline in rat hippocampal pyramidal cells. J Physiol (Lond) 1986;372:245–259. doi: 10.1113/jphysiol.1986.sp016007. [DOI] [PMC free article] [PubMed] [Google Scholar]
- 30.Nakasaki Y, Iwamoto T, Hanada H, Imagawa T, Shigekawa M. Cloning of the rat aortic smooth muscle Na+/Ca2+ exchanger and tissue-specific expression of isoforms. J Biochem. 1993;114:528–534. doi: 10.1093/oxfordjournals.jbchem.a124211. [DOI] [PubMed] [Google Scholar]
- 31.Nedergaard M. Direct signaling from astrocytes to neurons in cultures of mammalian brain cells. Science. 1994;263:1768–1771. doi: 10.1126/science.8134839. [DOI] [PubMed] [Google Scholar]
- 32.Nicoll DA, Quednau BD, Qui ZY, Xia YR, Lusis AJ, Philipson KD. Cloning of a third mammalian Na+-Ca2+ exchanger, NCX3. J Biol Chem. 1996;271:24914–24921. doi: 10.1074/jbc.271.40.24914. [DOI] [PubMed] [Google Scholar]
- 33.Parpura V, Basarsky TA, Liu F, Jeftinija K, Haydon PG. Glutamate-mediated astrocyte-neuron signalling. Nature. 1994;369:707–708. doi: 10.1038/369744a0. [DOI] [PubMed] [Google Scholar]
- 34.Pedarzani P, Storm JF. PKA mediates the effects of monoamine transmitters on the K+ current underlying the slow spike frequency adaptation in hippocampal neurons. Neuron. 1993;11:1023–1035. doi: 10.1016/0896-6273(93)90216-e. [DOI] [PubMed] [Google Scholar]
- 35.Pedarzani P, Storm JF. Dopamine modulates the slow Ca2+-activated K+ current IAHP via cyclic AMP-dependent protein kinase in hippocampal neurons. J Neurophysiol. 1995;74:2749–2753. doi: 10.1152/jn.1995.74.6.2749. [DOI] [PubMed] [Google Scholar]
- 36.Porter JT, McCarthy KD. GFAP-positive hippocampal astrocytes in situ respond to glutamatergic neuroligands with increases in [Ca2+]i. Glia. 1995;13:101–112. doi: 10.1002/glia.440130204. [DOI] [PubMed] [Google Scholar]
- 37.Quednau BD, Nicoll DA, Philipson KD. Tissue-specificity and alternative splicing of the Na/Ca exchanger isoforms NCX1, NCX2 and NCX3 in rat. Am J Phyisol. 1997;272:C1250–C1261. doi: 10.1152/ajpcell.1997.272.4.C1250. [DOI] [PubMed] [Google Scholar]
- 38.Reuter H. Sodium–calcium exchange: ins and outs of Ca+2 transport. Nature. 1991;349:567–568. doi: 10.1038/349567a0. [DOI] [PubMed] [Google Scholar]
- 39.Ruknudin A, Valdivia C, Kofuji P, Lederer WJ, Schulze DH. Na+/Ca2+ exchanger in Drosophila: cloning, expression, and transport differences. Am J Physiol. 1997;273:C257–C265. doi: 10.1152/ajpcell.1997.273.1.C257. [DOI] [PubMed] [Google Scholar]
- 40.Sakurai T, Hell JW, Woppmann A, Miljanich GP, Catterall WA. Immunochemical identification and differential phosphorylation of alternatively spliced forms of the alpha 1A subunit of brain calcium channels. J Biol Chem. 1995;270:21234–21242. doi: 10.1074/jbc.270.36.21234. [DOI] [PubMed] [Google Scholar]
- 41.Sambrook J, Fritsch EF, Maniatis T. Molecular cloning: a laboratory manual, 2nd Edition. Cold Spring Harbor; Cold Spring Harbor, NY: 1989. [Google Scholar]
- 42.Sanger F, Nicklen S, Coulson AR. DNA sequencing with chain-terminating inhibitors. Proc Natl Acad Sci USA. 1977;74:5463–5467. doi: 10.1073/pnas.74.12.5463. [DOI] [PMC free article] [PubMed] [Google Scholar]
- 43.Schell MJ, Danoff SK, Ross CA. Inositol (1, 4, 5)-triphosphate receptor: characterization of neuron-specific alternative splicing in rat brain and peripheral tissues. Brain Res Mol Brain Res. 1993;17:212–216. doi: 10.1016/0169-328x(93)90004-9. [DOI] [PubMed] [Google Scholar]
- 44.Smith LH, Smith JB. Activation of adenylate cyclase down-regulates sodium-calcium exchanger of atrial myocytes. Am J Physiol. 1995;269:C1379–C1384. doi: 10.1152/ajpcell.1995.269.6.C1379. [DOI] [PubMed] [Google Scholar]
- 45.Smith LH, Porzig H, Lee H-W, Smith JB. Phorbol esters down-regulate expression of the sodium-calcium exchanger in renal epithelial cells. Am J Physiol. 1995;269:C457–C463. doi: 10.1152/ajpcell.1995.269.2.C457. [DOI] [PubMed] [Google Scholar]
- 46.Takuma K, Matsuda T, Hashimoto H, Kitanaka J, Asano S, Kishida Y, Baba A. Role of Na+-Ca2+ exchanger in agonist-induced Ca2+ signaling in cultured rat astrocytes. J Neurochem. 1996;67:1840–1845. doi: 10.1046/j.1471-4159.1996.67051840.x. [DOI] [PubMed] [Google Scholar]
- 47.Torres GE, Chaput Y, Andrade R. Cyclic AMP and protein kinase A mediate 5-hydroxytryptamine type 4 receptor regulation of calcium-activated potassium current in adult hippocampal neurons. Mol Pharmacol. 1995;47:191–197. [PubMed] [Google Scholar]
- 48.Wang M, Doyle MV, Mark DF. Quantitation of mRNA by the polymerase chain reaction. Proc Natl Acad Sci USA. 1989;86:9717–9721. doi: 10.1073/pnas.86.24.9717. [DOI] [PMC free article] [PubMed] [Google Scholar]
- 49.White RJ, Reynolds IJ. Mitochondria and Na+/Ca2+ exchange buffer glutamate-induced calcium loads in cultured cortical neurons. J Neurosci. 1995;15:1318–1328. doi: 10.1523/JNEUROSCI.15-02-01318.1995. [DOI] [PMC free article] [PubMed] [Google Scholar]