

Abstract
Sensitization to the psychostimulant effects of cocaine has received widespread attention because concomitant changes occur in neurochemical pathways that are part of the brain reward pathway. The current study was undertaken with the purpose of mapping genes determining sensitivity to the acute stimulant and sensitizing effects of cocaine. Sensitivity and sensitization to cocaine (5, 10, and 40 mg/kg) were measured in 25 BXD/Ty recombinant inbred (BXD RI) strains and the progenitor C57BL/6J (B6) and DBA/2J (D2) strains. Quantitative trait locus (QTL) mapping provisionally localized cocaine sensitivity genes to regions on all chromosomes except 6, 11, 17, and X; sensitization QTLs were localized to chromosomes 1–10, 13, 15, 18, 19, and X. Provisional QTLs for locomotion after saline injection in a novel setting were mapped to chromosomes 1, 3–6, 9, 12, 13, 18, and 19 and in a familiar setting to chromosomes 4–7, 9, 13, and 19. There were both common and unique QTL regions across the phenotypes. Evidence for a genetic association between magnitude of acute cocaine response and sensitization was obtained for only the 10 mg/kg dose. Some common QTL regions for cocaine, ethanol, and methamphetamine responses suggest the possibility that these drugs induce stimulant effects or sensitization through some common mechanisms. However, independent mechanisms were also indicated. Many candidate genes reside near the provisional QTLs mapped for cocaine responses, including genes coding a variety of neurotransmitter and hormone receptors. These data, once confirmed, should prove useful for directing investigations of acute and chronic cocaine effects down already suspected and novel avenues.
Keywords: cocaine, locomotor activity, behavioral sensitization, mice, BXD recombinant inbred strains, quantitative trait locus, QTL, C57BL/6, DBA/2
The phenomenon of cocaine-induced behavioral sensitization, known to exist for many years (Tatum and Seevers, 1929; Downs and Eddy, 1932), coexists with several neurochemical changes within components of the brain reward pathway. Increased glucose metabolism (Thomas et al., 1996), increased extracellular dopamine and serotonin levels (Kalivas and Duffy, 1990;Steketee et al., 1992; Parsons and Justice, 1993; Heidbreder et al., 1996) (however, see Segal and Kuczenski, 1992), increased dopamine release (Williams et al., 1995), altered dopamine transporter binding (Koff et al., 1994; Boulay et al., 1996), dopamine receptor upregulation (Goeders and Kuhar, 1987; Unterwald et al., 1994) (however, see Mayfield et al., 1992), alterations in cAMP systems (Miserendino and Nestler, 1995; Tolliver et al., 1996), changes in gene expression (Hope et al., 1994), G-protein changes (Striplin and Kalivas, 1993), changes in synaptic regulation of dopamine cells (Bonci and Williams, 1996), enhanced neural sensitivity to dopamine (Henry and White, 1995), augmentation of excitatory amino acid transmission (Pierce et al., 1996), and changes in phospholipase A2activity (Reid et al., 1996) have all been found in mesolimbic dopaminergic projection areas or in the dopamine neuron-rich ventral tegmental area after repeated cocaine administration. These associations suggest that the study of cocaine sensitization could be informative in the search for factors leading to cocaine abuse. The described study herein used a genetic mapping approach as an initial step in the ultimate identification of genes and biochemical factors determining cocaine sensitivity and sensitization.
Several approaches can be used for gene mapping of quantitative behavioral traits (Neumann and Seyfried, 1990; Gora-Maslak et al., 1991; Johnson et al., 1992; Melo et al., 1996; Belknap et al., 1997). Our use of the BXD/Ty recombinant inbred (RI) strains (Taylor, 1972) as a first step has certain advantages, most notably the library of >1500 polymorphic markers that have been typed in almost all of the strains (Silver and Nadeau, 1997). This obviates the need for further genotyping in the initial screen, because the map density provides assurance of adequate coverage of the entire genome. Furthermore, because the BXD RI strains have been used in numerous gene-mapping studies for a variety of drug responses (Crabbe et al., 1994a, 1996;Phillips et al., 1994a, 1995; Tolliver et al., 1994, 1996; Belknap et al., 1995; Cunningham, 1995; Miner and Marley, 1995a,b; Rodriguez et al., 1995; Alexander et al., 1996; Gallaher et al., 1996; Quock et al., 1996; Buck et al., 1997; Grisel et al., 1997), the current data can be included in a search for common genetic elements controlling different cocaine responses and controlling locomotor responses to different drugs of abuse.
The current study used 25 BXD RI strains, measured robust locomotor stimulation and sensitization in many of the strains, and included a group to detect sensitization caused by associative conditioning (Hinson and Poulos, 1981; Weiss et al., 1989; Hooks et al., 1993;Badiani et al., 1995; Elmer et al., 1996). The key goals were (1) to estimate genetic correlations among basal activity and initial cocaine and sensitized cocaine responses, (2) to map quantitative trait loci (QTLs) for these locomotor phenotypes, (3) to compare the provisional gene maps for the locomotor effects of cocaine with those for other drugs with locomotor stimulant effects including ethanol, and (4) to identify candidate genes near provisionally mapped QTLs.
MATERIALS AND METHODS
Subjects
The mice used in these studies were born and raised in the Portland Veterans Affairs animal research facility from breeding stock originally obtained from The Jackson Laboratory (Bar Harbor, ME), using routine breeding and weaning practices. They were offered water and rodent block chow ad libitum; fluorescent ceiling lights were on from 6:00 A.M. to 6:00 P.M.; and the ambient temperature in the colony and testing rooms was 21 ± 2°C. All procedures using animals were approved by our Institutional Animal Care and Use Committee and performed in accordance with National Institutes of Health guidelines for the care and use of laboratory animals.
Female mice from 25 of the BXD/Ty recombinant inbred (BXD RI) strains (Taylor, 1972) and their two progenitor strains, C57BL/6J (B6) and DBA/2J (D2), were tested. Differences in the locomotor responses of B6 and D2 mice to cocaine have been reported (Koff et al., 1994; Tolliver et al., 1994), as has no difference (Miner and Marley, 1995a); however, a difference between the progenitor strains of an RI panel is not a prerequisite for utility in QTL mapping (Gora-Maslak et al., 1991). Female mice were used because they were more abundantly available than males, we have performed our ethanol locomotor sensitization work with females (Phillips et al., 1995), and a greater tendency for female rodents to develop a sensitized response to stimulant drug effects has been reported (Glick and Hinds, 1984; Robinson and Becker, 1986;Robinson, 1988).
Five groups of mice per strain were tested in this study. Group size ranged from 7 to 13 per strain, with an average group size of 12. Mice were 52–131 d of age at the initiation of testing, with an average age of 87 ± 17 (SD) d. There were 1581 mice tested; 12 d were required to complete the testing of a given animal; and testing was completed in 30 separate replications of the experiment. Strains were randomized across experimental replications; however, not all strains could be tested in each pass. Progenitor B6 and D2 strain mice were included in 13 replications, distributed across replications 3–26, to permit some evaluation of changes in behavior across time.
Procedures
Locomotor activity testing. Locomotor activity testing followed a protocol recently described in a similar study of the effects of ethanol on locomotion (Phillips et al., 1995). Omnitech digiscan automated activity monitors (Columbus, OH), housed in custom-made sound-attenuating chambers, were used to record horizontal distance traveled (in centimeters). Each chamber was equipped with a white fluorescent light and a fan that provided ventilation and masking noise, and all testing was performed from 9:00 A.M. to 3:00 P.M. with the lights on in the chambers.
The five test groups were chronic saline (CS), chronic drug, 5 mg/kg (CD5), 10 mg/kg (CD10), and 40 mg/kg (CD40), and chronic drug control (CDC). The test protocol is detailed in Table1. All activity tests began immediately after an intraperitoneal injection, and data were collected every 5 min for 15 min. Our pilot data in several mouse strains identified significant stimulation during the first 5 min time block after cocaine injection that peaked during the second two 5 min blocks and then began to decline back toward baseline activity levels. Furthermore, in a careful evaluation of cocaine pharmacokinetics after intraperitoneal injection and locomotor stimulation in mice, stimulation was greatest at 12 and 22 min time points after injection and had declined significantly at 32 min after injection (Benuck et al., 1987). These data resulted in the choice of this test period.
Table 1.
Protocol for testing acute and chronic cocaine effects on the locomotor activity of mice
| Group | Day | |||||||||||
|---|---|---|---|---|---|---|---|---|---|---|---|---|
| 1 | 2 | 3 | 4 | 5 | 6 | 7 | 8 | 9 | 10 | 11 | 12 | |
| CS | ||||||||||||
| INJ | Sal | Sal | Sal | None | Sal | None | Sal | None | Sal | None | COC10 | Sal |
| Test | Yes | Yes | Yes | No | Yes | No | Yes | No | Yes | No | Yes | Yes |
| INJ | Sal | Sal | Sal | None | Sal | None | Sal | None | Sal | None | Sal | None |
| CD 5, 10 and 40 | ||||||||||||
| INJ | Sal | Sal | COC | None | COC | None | COC | None | COC | None | COC | Sal |
| Test | Yes | Yes | Yes | No | Yes | No | Yes | No | Yes | No | Yes | Yes |
| INJ | Sal | Sal | Sal | None | Sal | None | Sal | None | Sal | None | Sal | None |
| CDC | ||||||||||||
| INJ | Sal | Sal | Sal | None | Sal | None | Sal | None | COC10 | None | COC10 | Sal |
| Test | Yes | Yes | Yes | No | Yes | No | Yes | No | Yes | No | Yes | Yes |
| INJ | Sal | Sal | COC | None | COC | None | COC | None | Sal | None | Sal | None |
All mice received an intraperitoneal injection (INJ), followed by an activity test, and then a second intraperitoneal injection. CS, chronic saline; CD5, chronic drug 5 mg/kg; CD10, chronic drug 10 mg/kg; CD40, chronic drug 40 mg/kg; CDC, chronic drug control. CDC mice received equal cocaine (COC) exposure to CD10 group mice, but COC 10 mg/kg was administered to this group after their activity test on days 3, 5, and 7. All injections were intraperitoneal, and all activity tests began immediately after the first injection and lasted for 15 min, with data collected in 5 min epochs.
Day 1 provided a measure of locomotion in a novel environment; day 2 provided a measure of locomotion in a more familiar environment and was used as our estimate of baseline activity for all mice. CS group mice were tested after saline on all days except day 11, when their response to an acute 10 mg/kg cocaine challenge was measured. On day 3, the acute responses to cocaine of mice from the CD groups were measured, and the development of sensitization was assessed on days 5, 7, 9, and 11. CDC group mice were tested after saline on some test days and the moderate dose of cocaine (10 mg/kg) on others (Table 1). The purpose of this test group was to assess possible learning and conditioning factors under our test conditions that might contribute to the development of behavioral sensitization. Thus, CDC mice were treated identically to CD10 mice, with the exception that their initial three exposures to cocaine were unpaired with the test apparatus; they received cocaine after testing, just before placement back into their home cages. A difference between their responses to cocaine on day 9, which was the first day that they received drug exposure before rather than after their activity test, versus the response of CD10 group mice would provide evidence for conditioned sensitization in CD10 mice. Locomotion after saline injection was reassessed in all mice on day 12 as another means of detecting conditioned locomotor effects.
To control for injection effects, two injections were given to all mice, one before and one after testing. The second injections for all mice occurred in the test room immediately after their activity tests, and then mice were returned to their home cages and, shortly thereafter, to their colony room. The lowest cocaine dose used was expected to produce significant stimulation in those strains most sensitive to the stimulant effects of cocaine but less or none in insensitive strains. The 10 mg/kg dose was expected to produce stimulation in most strains, but with genetically determined differences in magnitude. The high dose was expected to produce acute stimulation of many strains, but impairment of locomotion with repeated administration was predicted to be more likely with this dose than with the lower doses because of the development of stereotypic behaviors (not measured in this study). Because of the necessity of limiting the number of animals to be tested from 27 different strains, only the moderate cocaine dose was chosen for testing in the CS and CDC group mice.
Data manipulation and analyses
Acute cocaine response. Data handling and analyses were consistent with our similar previous work with ethanol (Phillips et al., 1995). Three measures of acute activity response to cocaine were derived for each strain. (1) Acute response data were corrected for baseline variation between strains by subtracting scores of CD mice on day 2 (BASACT) from the scores of these mice on day 3. Day 2 data were used as the measure of baseline activity to exclude the day 1 novelty effect. The mean of these difference scores was obtained for each strain, providing a within-groups measure of acute responsiveness referred to as ACCD5, ACCD10, or ACCD40 (acute response of CD groups). We considered using day 3 scores corrected by the use of day 2 baseline data as a covariate. However, strain means derived from the difference and covariate corrected scores were correlated at 0.96, 0.93, and 0.99 for the 5, 10, and 40 mg/kg doses, respectively. Therefore, we made the decision to use the difference scores to maintain consistency with previously published work in the BXD RI strains (Phillips et al., 1995,1996). The advantage to the use of difference scores is that between- and within-group measures of the stimulant response could be compared (see ACBG below).
(2) The identical procedure was used to obtain acute response data from CS group mice, except that day 2 data were subtracted from day 11 data. This acute responsiveness variable is referred to as ACCS10 (acute response of CS group to 10 mg/kg cocaine).
(3) A between-groups measure of sensitivity was obtained by subtracting the strain means for saline-treated CS mice on day 3 from the strain means of cocaine-treated CD10 group mice on the same day. This measure of acute responsiveness is referred to as ACBG (acute response between groups).
One-way ANOVA was used for detection of strain differences for the difference scores, ACCD5, ACCD10, ACCD40, and ACCS10. To detect strain-dependent dose effects, a two-way ANOVA was also performed, grouped on strain and dose and including only ACCD5, ACCD10, and ACCD40 data. The generation of 10 mg/kg cocaine acute response data from two independent test groups (ACCD10 and ACCS10) permitted estimation of the reliability of this measure by performing a Pearson’s rstrain correlation. In addition, a two-way ANOVA, directly comparing the strain means obtained from the CD10 and CS groups, was performed. The acute sensitivity of the means of the between groups (ACBG) were also used for reliability estimation but could not be subjected to ANOVA, because they were based on strain means, and thus, no error estimate was available.
Response to repeated cocaine treatment. Two measures of the change in activity response after repeated exposures to cocaine were derived for each strain.
(1) Responses of CD group mice to cocaine on day 3 were subtracted from their scores on day 11 (final cocaine test day). Averages of these difference scores were obtained for each strain, providing a within-groups measure of change in cocaine response referred to asdeltaCD5, deltaCD10, or deltaCD40. (2) Strain means of CS group mice on day 11 were subtracted from strain means of CD10 group mice on the same test day. This provided a between-groups measure of change in cocaine response; however, because this strain sensitivity measure was based on strain means, no error variation estimate was possible. This variable is referred to asdeltaBG.
Data were analyzed as described for the acute responses using two-way and one-way ANOVAs. In some instances, further examination of two-way interactions used simple main effect analyses.
Genetic correlations. Genetic correlations among the activity variables were estimated from RI and progenitor strain means using Pearson’s r. At this exploratory stage of analysis, this estimate is being used as a hypothesis-generating device. Therefore, no correction was applied for multiple correlations. This analysis would lead to the detection of possible genetic relationships that might warrant further consideration using other or more stringent methods of analysis.
QTL analyses. QTL analyses were performed as described in previous work (Phillips et al., 1995, 1996). Briefly, known genetic variation among the RI strains, attributable to differential inheritance of DNA polymorphisms from the progenitor strains, was correlated with phenotypic variation. Because of arbitrary assignment of a value of 0 to B6 alleles and a value of 1 to D2 alleles, a significant positive correlation between a phenotype and a marker would indicate an association between the D2-like polymorphism at that locus and high levels of the phenotype; a significant negative correlation would indicate an association of high phenotypic values with the B6-like allele. Correlations were performed for each marker. Statistical issues with regard to performing the large number of correlations necessary for QTL analysis have been discussed elsewhere (Belknap, 1992; Neumann, 1992; Manly, 1993; Lander and Shork, 1994;Belknap et al., 1996). As long as the QTL regions proposed in work of this nature are considered provisional and the need for confirmation is recognized, we see these issues as important but do not believe that they invalidate this mapping procedure. Plans to follow up provisional QTLs are in place, with the goal of attaining stringent levels of statistical significance, such as those proposed by Lander and Kruglyak (1995), before concluding linkage.
RESULTS
Baseline activity
There were large strain differences in baseline activity after saline injection on days 1 and 2 (F(26,1550) = 39.7; p < 0.001; and F(26,1554)= 30.5; p < 0.001, respectively). To assess possible differential rates of habituation to the test environment and procedures, a repeated measures strain × day analysis was performed using only CS group data from days 1–3, 5, 7, and 9. There was a significant strain × day interaction (F(130,1435) = 2.7; p < 0.001), and simple effect analyses revealed incomplete habituation in 5 of the 27 strains. In those 5 strains (BXD 1, 2, 6, 8, and 25), baseline activity levels on day 3 did not differ significantly from those on any subsequent day. Thus, for most strains, day 2 represented a fully habituated baseline.
Activity response to acute cocaine
Examination of the change in activity after cocaine treatment, relative to the day 2 baseline, revealed dose-dependent strain variation (F(52,864) = 3.2; p < 0.001 for the strain × dose interaction) and strain differences in response to cocaine at all three cocaine doses (allF > 3; p < 0.001 for ACCD5, ACCD10, and ACCD40). The strain variation in response to the 10 mg/kg cocaine dose was verified in the acute response of CS group mice on day 11 (ACCS10; F(26,286) = 2.67; p < 0.001). Strain means for CS and CD10 group mice were significantly genetically correlated (r = 0.61; p < 0.001) for the acute cocaine response. Because a small number of strains exhibited incomplete habituation to the testing procedures by day 2, we assessed the effect of using the day 9 baseline to correct CS group stimulant scores. ACCS10 (day 11 − day 2) and means based on a day 11 − day 9 difference score were significantly genetically correlated at r = 0.91; p < 0.001, and the correlation between strain means for CS day 11 − day 9 and ACCD10 was 0.68; p < 0.001 (only slightly larger than the 0.61 correlation between ACCD10 and ACCS10). These data suggest that the day 2 baseline correction was adequate for describing the stimulant response of CS group mice.
Figure 1 shows strain means for day 2 baseline activity and acute cocaine responses. Strain means were arranged in ascending order for the ACCD10 variable, and this strain order was maintained for the remaining phenotypes. In almost every strain, the locomotor distance traveled increased with increasing dose. BXD 24 was the only strain that did not have a significant dose–response function when simple main effect analyses of the significant strain × dose interaction were performed. Significant increases in locomotor distance traveled after cocaine treatment, relative to day 2 saline baseline, were seen in 17 of 27 strains for the 5 mg/kg cocaine dose, in 25 of 27 strains for 10 mg/kg cocaine, and in all strains after 40 mg/kg cocaine.
Fig. 1.
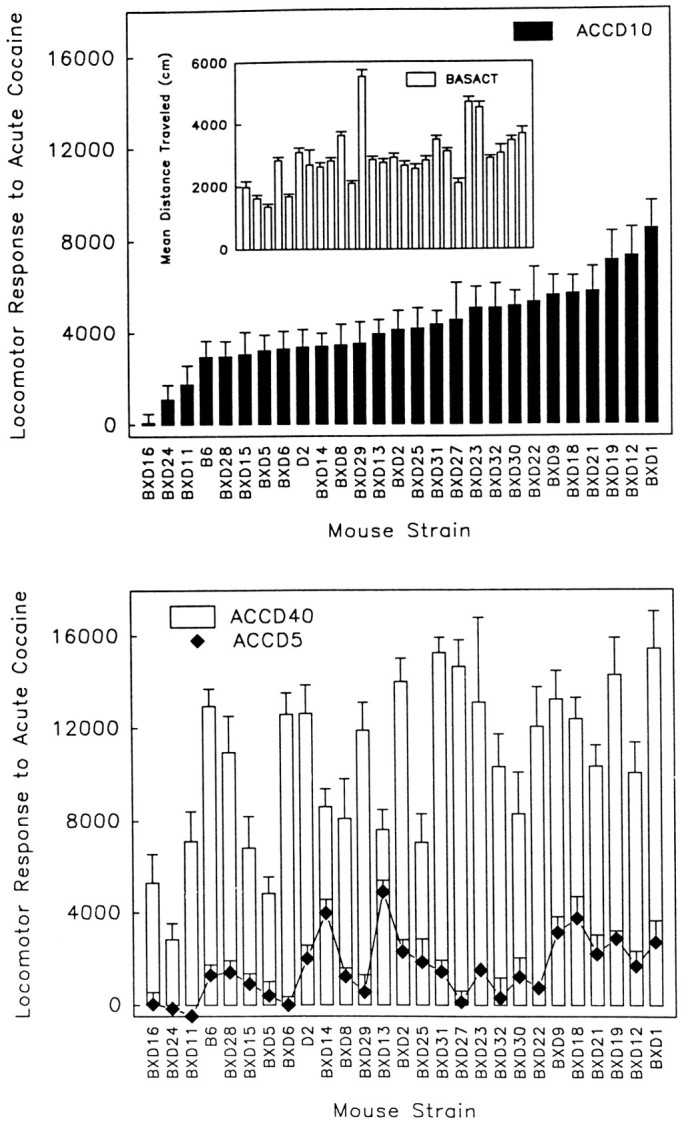
Locomotor activity responses of 25 BXD RI strains and the B6 and D2 progenitors to acute treatment with 5 (ACCD5), 10 (ACCD10), and 40 (ACCD40) mg/kg cocaine. Basal activity (BASACT) is also shown (inset). Strain means for locomotor activity after a saline injection on test day 2 were subtracted from strain means for activity of the chronic drug group after cocaine injection on day 3 to provide theACCD measures.
The B6 and D2 progenitor strains had similar acute responses to cocaine. A separate analysis including only these strains revealed a main effect of dose (F(2,73) = 108.2;p < 0.001) but no strain difference or interaction effect. To assess consistency of progenitor strain data across the course of the experiment, data from B6 and D2 mice were randomly split in half across the entire experimental period and analyzed for differences. No differences within strain between split halves were found for baseline activity or acute drug responses. We also compared mice tested earlier with those tested later by splitting them in half by date of test. In this case, we saw a difference for saline activity on day 1 in which D2 mice tested earlier were more active than those tested later; however, this difference disappeared on day 2 and on later testing. No other differences were found.
Estimates of coefficients of genetic determination were derived from one-way ANOVA of each phenotype, grouped on strain. The coefficient provides an estimate of total phenotypic variation that can be attributed to genetic differences. For baseline activity, 34% of the variation could be attributed to genetic differences. For 5, 10, and 40 mg/kg cocaine, 23, 28, and 37%, respectively, of the variation could be explained by genetic differences, respectively. Multiple regression analyses using a forward stepwise approach (Phillips et al., 1994a,1995) estimated that the identified QTLs accounted for 82% of the genetic variance in baseline activity, and 81, 71, and 90% of the genetic variance in acute response to 5, 10, and 40 mg/kg cocaine, respectively.
Change in cocaine response with repeated exposures
An ANOVA including data from all three cocaine dose groups (day 11 − day 3) revealed dose-dependent strain variation in the change in cocaine response after repeated treatment (F(52,856) = 1.7; p < 0.01). There were significant strain differences in the magnitude of sensitization for the 5 (F(26,281) = 1.6;p < 0.05), 10 (F(26,283) = 2.3;p < 0.001), and 40 (F(26,292) = 2.3; p < 0.001) mg/kg doses. For the two lower cocaine doses, 16 and 20 strains of 27 exhibited locomotor distance scores on day 11 that were significantly greater than those recorded after acute exposure on day 3. Only seven strains had larger locomotor distance scores on day 11, relative to day 3 for the 40 mg/kg cocaine dose.
Sensitization data are presented in Figure2, with strain order held constant according to the deltaCD10 phenotype. It is clear that the tendency toward sensitization development within strain changes across doses. Several strains traveled less distance after repeated 40 mg/kg cocaine exposure than after acute exposure to this dose. It is possible that the negative scores for this high dose reflect sensitization to the stereotypic effects of cocaine, which would be expected to reduce locomotion. This is purely speculation, because stereotypy was not assessed, and an automated stereotypy measure derived from the digiscan monitors may not be adequate to detect this (discussed by Phillips et al., 1994b). Estimated coefficients of genetic determination were considerably lower for the responses after repeated cocaine treatment than for initial response. Only 13, 17, and 17% of the strain variation could be attributed to genetic differences for the 5, 10, and 40 mg/kg doses, respectively. Multiple regression analyses using a forward stepwise approach estimated that the identified QTLs accounted for 65, 47, and 69% of the total genetic variance for sensitization to 5, 10, and 40 mg/kg cocaine, respectively.
Fig. 2.

Change in locomotor activity responses of 25 BXD RI strains and the B6 and D2 progenitors to repeated administration of 5 (deltaCD5), 10 (deltaCD10), and 40 (deltaCD40) mg/kg cocaine. Strain names are listed along the abscissa. Strain means of chronic drug group mice for locomotor activity after their first cocaine injection on test day 3 were subtracted from strain means for activity of the same group after their final cocaine injection on test day 11 to provide thedeltaCD measures.
As for acute response, the progenitor strain data were analyzed separately. An ANOVA revealed a main effect of dose with regard to the change in activity response between days 3 and 11 (F(2,72) = 5.5; p < 0.01) but no strain or interaction effects. The strains developed similar magnitudes of sensitization. We compared split-half data for the progenitor strains, as described for the acute drug response analysis. B6 mice tested earlier in the study showed significantly more sensitization to the 5 mg/kg cocaine dose than those tested later. This temporal difference was not seen for the other cocaine doses. Random splitting of the strains into halves generated a difference in sensitization within both strains only at the 5 mg/kg dose for sensitization. This suggests that the response characterized as sensitization to the 5 mg/kg cocaine dose may have been relatively more influenced by environmental factors.
Influence of learning and conditioning
To assess the potential influence of association of the test environment with cocaine exposure on the development of sensitization, responses of CD10 and CDC mice to cocaine on day 9 were compared. This is the first day that CDC mice received cocaine before placement in the activity monitor, rather than after their activity test. In strains that exhibited sensitization to cocaine, the influence of conditioning on the development of sensitization would be evidenced by a smaller response on day 9 in CDC group mice, relative to CD10 mice. An ANOVA on day 9 data corrected for day 2 baseline (day 9 − BASACT) indicated significant differences in the responses of these two groups among the strains (F(26,575) = 2.1;p < 0.002). In general, the average response of CDC group mice to cocaine on this test day was smaller than that of CD10 group mice. This difference was statistically significant in 11 of the 27 strains. There were no strains for which the CDC group response was larger than that of the CD10 group response. These results support a role for associative factors in sensitization to cocaine in some strains.
Another indication of a conditioned response would be greater activity of CD10 group mice relative to CS group mice on the final saline test day (day 12). By this day, CD10 mice would have received five pairings of the environment with cocaine, whereas CS group mice would have received only one pairing. An ANOVA comparing the day 12 data of these two groups indicated significantly greater levels of activity in the CD10 group mice (F(1,570) = 58.1;p < 0.001). CD10 group mice traveled an average distance of 3877 ± 166 cm, and CS mice traveled an average distance of 2931 ± 84 cm. The absence of a group × strain interaction precluded further statistical evaluation. These data support the influence of associative factors in determining locomotor activity response under our experimental conditions.
Response profiles across days
Figure 3 shows the response profiles over test days of several of the strains, including the B6 and D2 progenitors. Many different response profiles can be seen; however, the responses of the B6 and D2 strains were remarkably similar. Strains BXD 1 and BXD 16 were chosen for depiction because they represented the extremes for acute response to 10 mg/kg cocaine (Fig. 1). Strains BXD 19 and BXD 29 were chosen as the extremes for sensitization development to this cocaine dose. Strain 25 was a modestly stimulated and sensitizing strain that showed sensitization after a second cocaine treatment that did not increase thereafter. Also seen in this figure are clear examples of conditioning effects. For example, the response of CDC group mice to cocaine on day 9 was considerably reduced relative to CD10 group mice for strains 1, 25, and 19. On the other hand, modest differences or no difference was seen in other strains. Differences for some strains in response to saline can also be seen on day 12, indicative of conditioning.
Fig. 3.

Mean horizontal distance traveled (in centimeters) during a 15 min test after saline or 10 mg/kg cocaine treatment by chronic saline (CS), chronic drug (CD10), and chronic drug control (CDC) group mice of several BXD strains and the C57BL/6J and DBA/2Jprogenitors on 8 test days. See Table 1 for details of the treatment and test schedule.
Genetic correlations
Genetic relationships among basal activity and cocaine activity variables were estimated by Pearson’s r correlations of strain means and are shown in Table 2. Activity after saline treatment on day 2 was significantly correlated with acute stimulant response to 5 and 10 mg/kg cocaine; the correlation of BASACT with response to 40 mg/kg cocaine almost attained a conventional level of significance (p = 0.06). Those strains with higher basal activity levels exhibited larger stimulant responses to cocaine. Baseline activity was not associated with degree of sensitization to cocaine. There was a significant genetic correlation between acute cocaine response and degree of sensitization, but only for the 10 mg/kg cocaine dose. Thus, acute cocaine response, at least at some doses, could be of value in predicting extent of sensitization. However, the value may be limited by an estimated 19–46% of variance (R2) held in common for acute and sensitized responses to even this cocaine dose (Table 2).
Table 2.
Correlations among baseline activity, acute cocaine sensitivity, and degree of cocaine sensitization
| BASACT | ACCD5 | ACCD10 | ACCS10 | ACBG | ACCD40 | deltaCD5 | deltaCD10 | deltaCD40 | deltaBG | |
|---|---|---|---|---|---|---|---|---|---|---|
| BASACT | 1.00 | 0.51 | 0.49 | 0.29 | 0.53 | 0.36 | −0.03 | −0.12 | −0.02 | 0.13 |
| ACCD5 | 1.00 | 0.64 | 0.75 | 0.63 | 0.47 | 0.08 | 0.37 | 0.36 | 0.29 | |
| ACCD10 | 1.00 | 0.61 | 0.95 | 0.59 | 0.23 | 0.44 | 0.00 | 0.68 | ||
| ACCS10 | 1.00 | 0.60 | 0.54 | 0.12 | 0.43 | −0.08 | 0.14 | |||
| ACBG | 1.00 | 0.61 | 0.20 | 0.36 | −0.02 | 0.65 | ||||
| ACCD40 | 1.00 | 0.36 | 0.38 | −0.21 | 0.39 | |||||
| deltaCD5 | 1.00 | 0.36 | 0.15 | 0.34 | ||||||
| deltaCD10 | 1.00 | 0.26 | 0.76 | |||||||
| deltaCD40 | 1.00 | 0.24 |
Underlined correlations are significant at p < 0.05. BASACT, Baseline activity; ACCD5, acute response of chronic drug (CD) group to 5 mg/kg cocaine; ACCD10, acute response of CD group to 10 mg/kg cocaine; ACCS10, acute response of chronic saline (CS) group to 10 mg/kg cocaine; ACBG, between-groups assessment (CD10 vs CS) of acute response to 10 mg/kg cocaine; ACCD40, acute response of CD group to 40 mg/kg cocaine; deltaCD5, change in response to 5 mg/kg cocaine with repeated treatment; deltaCD10, change in response to 10 mg/kg cocaine with repeated treatment;deltaCD40, change in response to 40 mg/kg cocaine with repeated treatment; deltaBG, between-groups estimate of change in response to 10 mg/kg cocaine with repeated treatment (CD10 − CS group data on day 11).
This pattern of results is markedly dissimilar to those for ethanol, in which no association between baseline activity and ethanol stimulant response was seen, and acute response and response after repeated injections of ethanol were not associated (Phillips et al., 1995). Genetic correlations were also estimated among activity variables from the current cocaine study and those from the ethanol study. Strain levels of baseline activity were reliably estimated in the two studies; the correlation was 0.95 (p < 0.001). The only other significant correlations between variables drawn from the two studies were for baseline activity from the ethanol study with acute cocaine sensitivity at all three doses (r = 0.45–0.68;p < 0.05–0.001).
QTL analyses
Results of QTL analyses on basal activity, activity response to acute cocaine treatment, and activity response to repeated cocaine exposures are presented in Table 3. Although results are listed under eight variable headings, QTL analyses were performed on 11 activity variables, including the 10 discussed in previous sections and novel locomotion. Novel locomotion data were those collected on day 1 after saline exposure when animals were naive to the activity testing environment and were significantly correlated with BASACT (r = 0.90; p < 0.001). QTL results for the three measures of acute response to 10 mg/kg cocaine were largely similar. Therefore, only the strongest correlations from this group of three variables were listed under Acute cocaine 10. Likewise, results for the two measures of sensitization to 10 mg/kg cocaine were summarized under the single heading Repeated cocaine 10. Marker regions that were significantly correlated with a phenotype at the p ≤ 0.01 level are listed. When several markers in a given region were associated at the p ≤ 0.01 level, only the marker with the largest absolute correlation was listed, and the range of the area in centimorgans (cM) was listed as representative of the location.
Table 3.
Significant correlations between BXD RI markers and locomotor activity variables
| Marker | Chr | Location (cM) | Locomotion | Acute cocaine | Repeated cocaine | |||||
|---|---|---|---|---|---|---|---|---|---|---|
| Novel | BASACT | 5 | 10 | 40 | 5 | 10 | 40 | |||
| Gst2-rs | 1 | 5–13 | −0.52 | |||||||
| D1Ncvs45 | 1 | 48 | −0.581,2,3 | |||||||
| D1Rik96 | 1 | 63–74 | −0.63* | −0.561,2,3 | −0.50 | 0.51 | ||||
| Ly9 | 1 | 87–100 | −0.55 | −0.63 | −0.70*1,2 | 0.574,5 | ||||
| D2Rik73 | 2 | 9–21 | 0.52 | |||||||
| Pmv7 | 2 | 29–37 | 0.51 | 0.68* | ||||||
| Hoxd | 2 | 45 | 0.52 | |||||||
| D2Ncvs36 | 2 | 60–65 | −0.64 | −0.574,5 | ||||||
| D2Ncvs49 | 2 | 91–97 | 0.69*1,2,3 | 0.63* | 0.534,5 | |||||
| D3Ncvs26 | 3 | 19–24 | 0.50 | 0.63*1,2,3 | ||||||
| D3Byu4 | 3 | 41–55 | −0.49 | −0.60 | −0.54 | |||||
| Ms15-2 | 4 | 0–10 | −0.50 | −0.511,3 | ||||||
| Mtv14 | 4 | 11–17 | 0.514,5 | |||||||
| Adfp | 4 | 35–40 | −0.54 | 0.514,5 | ||||||
| Iapls3-10 | 4 | 50–59 | 0.59 | 0.52 | 0.66*1,2,3 | |||||
| D4Nds2 | 4 | 63 | −0.62 | −0.54 | ||||||
| D5Ncvs57 | 5 | 20–29 | −0.65 | −0.54 | ||||||
| Tsz1 | 5 | 54–59 | −0.49 | −0.62 | −0.644,5 | |||||
| Nfe2u | 5 | 68–82 | −0.55 | |||||||
| Iap1s2-2 | 6 | 7–13 | 0.57 | |||||||
| D6Mit93 | 6 | 26–36 | −0.59 | −0.58 | 0.504,5 | |||||
| D7Hms1 | 7 | 11–25 | −0.56 | |||||||
| D7Ncvs56 | 7 | 26–36 | 0.51 | −0.62 | ||||||
| D7Mit7 | 7 | 53 | 0.57 | |||||||
| D7Ncvs47 | 7 | 67–72 | 0.52 | 0.56 | ||||||
| D8Ncvs34 | 8 | 31–38 | 0.69* | |||||||
| Mpmv21 | 8 | 55–67 | −0.51 | −0.521,2 | ||||||
| D9Mit21 | 9 | 29–36 | 0.64 | 0.53 | ||||||
| Gst2-3 | 9 | 43–48 | 0.503 | −0.52 | ||||||
| Rbp2 | 9 | 57–61 | 0.551,3 | 0.51 | 0.575 | |||||
| D10Mit144 | 10 | 51–54 | −0.521,3 | −0.60 | ||||||
| asp1 | 12 | 18–25 | −0.54 | |||||||
| Cbg | 12 | 51–52 | −0.50 | −0.541,2,3 | ||||||
| Tcrg | 13 | 9–10 | 0.55 | 0.52 | ||||||
| D13Ncvs48 | 13 | 50–56 | −0.56 | 0.52 | ||||||
| Iapls1-8 | 13 | 68–72 | −0.56 | |||||||
| P1au | 14 | 3 | 0.51 | |||||||
| D14Ncvs46 | 14 | 43 | −0.501 | |||||||
| D15Ncvs26 | 15 | 34–48 | 0.532 | 0.594,5 | ||||||
| Nfe2 | 15 | 58 | 0.51 | |||||||
| D16Ncvs6 | 16 | 25–38 | −0.55 | −0.561,2 | −0.55 | |||||
| Iapls3-5 | 18 | 1 | −0.50 | −0.511,3 | ||||||
| D18Mit10 | 18 | 22–26 | −0.54 | |||||||
| Pomc2 | 19 | 1–14 | −0.50 | −0.49 | −0.51 | −0.62*1,2,3 | ||||
| Rbp4 | 19 | 38 | 0.544,5 | |||||||
| D19Ncvs21 | 19 | 53–55 | 0.57 | 0.51 | ||||||
| Oat-rsl | X | 28–29 | 0.50 | |||||||
Subscripts indicate phenotypes with marker associations in the indicated regions, when multiple similar phenotypes were measured: 1, ACCD10; 2, ACCS10; 3, ACBG; 4, deltaCD10; and 5,deltaBG. These are provisionally mapped QTLs that will require confirmation using other methods.
Chr, Chromosome.
All correlations p ≤ 0.01 except * p≤ 0.001.
QTL results for the novel and baseline activity variables were quite similar, consistent with the large genetic correlation. QTL regions identified for these measures of general locomotion provided confirming evidence for five regions located on chromosomes 5 (20–30 cM), 6 (26–36 cM), 9 (29–36 cM), 13 (9–10 cM), and 19 (1–14 cM), identified in an independent study of BXD RI mice using the identical test apparatus (Phillips et al., 1995), for one QTL region on chromosome 4 (50–59 cM) from a smaller BXD RI study (Miner and Marley, 1995a), and for two on chromosomes 5 (20–30 cM) and 13 (9–12 cM) from a conditioned place preference study that measured locomotion (Cunningham, 1995). There was potential confirmation of QTLs on chromosomes 1 (87–100 cM) and 19 (1–24 cM) identified from an F2 cross of A/J and C57BL/6J mouse strains (Gershenfeld et al., 1997). Some additional regions were also identified in the current study, perhaps attributable in part to the expansion of the BXD RI marker set.
Locomotor responses to acute cocaine treatment were mapped to both dose-unique regions and regions common to two or more of the doses. This is consistent with the significant, but moderate, genetic correlations found between locomotor responses to different cocaine doses. Furthermore, some QTL regions for acute cocaine response were held in common with QTLs for basal activity and for response to repeated cocaine. When compared with the results of two other QTL mapping studies performed for cocaine locomotor responses, common regions were found on chromosomes 9 (38–57 cM) and 10 (50–60 cM) (Tolliver et al., 1994; Miner and Marley, 1995a).
Our QTL mapping results from an ethanol activity study performed identically to this one identified no clear common QTL regions for cocaine and ethanol responses (Phillips et al., 1995). However, when compared with a QTL mapping study of methamphetamine locomotor response of BXD RI mice measured in the home cage (Grisel et al., 1997), there were common QTL regions on chromosomes 1 (48 cM), 3 (19–24 cM), 7 (67–72 cM), 9 (57–65 cM, but opposite in sign), 10 (51–54 cM), 12 (51–55 cM, but opposite in sign), 14 (40–43 cM), and 15 (48–58 cM). This represents an extraordinary amount of convergence, even excluding those regions with correlations opposite in sign. On the other hand, four QTL regions that appeared to be common for our cocaine response and for an amphetamine locomotor response analyzed in BXD RI strains byAlexander et al. (1996) were all opposite in sign, suggesting that the B6-like allele conferred greater sensitivity to cocaine but lesser sensitivity to amphetamine at a given locus, or vice versa, a seemingly unlikely outcome. It is possible that different genes in similar regions are being detected by the two analyses or that these are false-positive associations in one or both studies. There was a common QTL for our acute cocaine response and locomotor response to phencyclidine (Alexander et al., 1996) on chromosome 1 (100 cM).
QTL regions mapped for response to repeated cocaine administration were largely distinct. There was only one common QTL region identified for sensitization to 5 and 10 mg/kg cocaine and no common regions for the 40 mg/kg dose with the two lower doses. Locomotor sensitization was not evinced in the only other BXD RI study of repeated cocaine effects on locomotion; however, we compared our results with those for stereotypy sensitization (Tolliver et al., 1994). Common regions on chromosomes 1 (87–100 cM) and 6 (26–42 cM) were found for locomotor and stereotypy sensitization. Common QTL regions were found on chromosomes 1 (63–74 cM) and 8 (28–38 cM) for cocaine and ethanol sensitization (Phillips et al., 1995).
Given speculation that drug sensitization may be related to drug reward potential, we also compared our sensitization QTL results to the sparse literature on QTL mapping for drug reinforcement. To avoid a lengthy discussion, and because this issue is controversial, we chose not to list specific regions here but rather will await confirming evidence of our own and other QTL regions. However, there were potential common chromosomal regions identified for cocaine sensitization with QTLs for ethanol consumption (Phillips et al., 1994a; Rodriguez et al., 1995) and morphine consumption (Berrettini et al., 1994), but not ethanol-conditioned place preference. We know of no published studies mapping QTLs for cocaine reinforcement.
Candidate genes
The Mouse Genome Database [Mouse Genome Database (1997), Mouse Genome Informatics, The Jackson Laboratory, Bar Harbor, ME (World Wide Web URL: http://www.informatics. jax.org/)] was searched for candidate genes in the regions of the provisional QTLs. It was impossible to list all of the known genes located in these regions, but a long list of the more plausible candidates, in some cases based on published data (see Discussion), is given in Table4. The dopamine D1, D2, D4, and D5 receptor genes all mapped near QTLs for basal locomotion. In addition, there were mapped QTLs near several olfactory receptor genes, cholinergic receptors, GABAA receptor subunits, and serotonin receptor subtypes, among others. For sensitivity to acute cocaine treatment, there were QTLs mapped near genes for some different cholinergic receptor subtypes from those near QTLs for basal activity. In addition, there were QTLs near two adrenergic receptor kinase genes, near the δ1-opioid receptor gene and near the gene coding for the luteinizing hormone receptor. The κ1 opioid receptor gene mapped near a QTL for cocaine sensitization. Two different NMDA receptor subtypes also mapped near QTLs for cocaine sensitization; one of these was also near a QTL for basal activity. Other candidate genes of interest near QTLs for cocaine sensitization included both the mineralocorticoid and glucocorticoid receptor genes, the neuropeptide Y receptor gene, several GABAA receptor subunit genes, and genes for adrenergic receptors and for the androgen receptor.
Table 4.
Potential candidate genes located in regions indicated by provisionally mapped QTLs for basal activity, acute locomotor response to cocaine, and cocaine sensitization
| Phenotype | Potential candidate genes (chromosome, cM) |
|---|---|
| Basal activity | Acrb2 (3, 42),Gabt1 (3, 50), Gabrr1 & Gabrr2 (4, 11), Glyt1 (4, 52), Grik3 (4, 57),Oprd1 (4, 65), Htr1d, Htr1da &Htr1db (4, 66), Htr5a (5, 15), Adra2c(5, 20), Drd1b (5, 22), Drd5 (5, 23),Ghrhr (6, 26), Grin2d (7, 24), Gabra4(7, 27), Gabra5, Gabrb3 & Gabrg3 (7, 28), Acra7(7, 30), Olfr6 (7, 51), Drd4 (7, 70),Drd2 (9, 28), Acra5 (9, 32), Olfr11(13, 9), Adrbk1 (19, 3) |
| Acute cocaine response | Acrd & Acrg (1, 52), Htr5b (1, 63),Adra2b (2, 73), Acrb2 (3, 42), Gabt1(3, 50), Gabrr1 & Gabrr2 (4, 11), Glyt1 (4, 52), Grik3 (4, 57), Oprd1 (4, 65), Adrbk2(5, 60), Drd4 (7, 70), Htr1b (9, 46),Acra3 (9, 51), Olfr8 (10, 44), Crhbp(13, 51), Htr1a (13, 58), Lhr (14, 40),Drd3 (16, 23), Htr1f (16, 40), Adrbk1(19, 3) |
| Cocaine sensitization | Oprk1 (1, 6),Htr5b (1, 63), Grin1 (2, 12), Acra (2, 44), Chrm4 (2, 49), Adra2b (2, 73), Acrb2(3, 42), Gabt1 (3, 50), Gabrr1 & Gabrr2 (4, 11), Adrbk2 (5, 60), Ghrhr (6, 26), Grin2d(7, 24), Gabra4 (7, 27), Gabra5, Gabrb3 & Gabrg3(7, 28), Acra7 (7, 30), Nyp1r (8, 33),Mlr (8, 35), Htr1b (9, 46), Acra3 (9, 51), Olfr8 (10, 44), Crhbp (13, 51), Htr1a(13, 58), Grl1 (18, 20), Adrb2 (18, 34),Htr7 (19, 33), Adra2a (19, 50), Adrb1(19, 51), Gabra3 (X, 29), Avpr2 (X, 30),Ar (X, 36) |
Acra, α-Acetylcholine (ACh) receptor;Acra3, α3 ACh receptor; Acra5, α5 ACh receptor; Acra7, α7 ACh receptor; Acrb2, β2 ACh receptor; Acrd, δ ACh receptor; Acrg, γ ACh receptor; Adra2a, α2a adrenergic receptor;Adra2b, α2b adrenergic receptor; Adra2c, α2c adrenergic receptor; Adrb1, β1 adrenergic receptor;Adrb2, β2 adrenergic receptor; Adrbk1, β1 adrenergic receptor kinase; Adrbk2, β2 adrenergic receptor kinase; Ar, androgen receptor; Avpr2, arginine vasopressin receptor 2; Chrm4, muscarinic ACh receptor;Crhbp, corticotropin releasing hormone binding protein;Drd1b, dopamine (DA) D1b receptor; Drd2, DA D2 receptor; Drd3, DA D3 receptor; Drd4, DA D4 receptor; Drd5, DA D5 receptor; Gabra3, GABAA receptor, α3 subunit; Gabra4, GABAA receptor, α4 subunit; Gabra5, GABAA receptor, α5 subunit; Gabrb3, GABAA receptor, α3 subunit; Gabrg3, GABAA receptor, γ3 subunit; Gabrr1, GABAA receptor, rho 1 subunit; Gabrr2, GABAA receptor, rho 2 subunit; Gabt1, GABAA transporter 1; Ghrhr, growth hormone-releasing hormone receptor; Glyt1, glycine transporter 1; Grik3, kainate 3 glutamate receptor;Grl1, glucocorticoid receptor 1; Grin1, NMDA1 glutamate receptor; Grin2d, NMDA2D glutamate receptor;Htr1a, serotonin (5-HT) 1A receptor; Htr1b, 5-HT1B receptor; Htr1d, 5-HT1Dreceptor; Htr1da, 5-HT1Dα receptor;Htr1db, 5-HT1Dβ receptor; Htr1f, 5-HT1F receptor; Htr5a, 5-HT5Areceptor; Htr5b, 5-HT5B receptor;Htr7, 5-HT7 receptor; Lhr,luteinizing hormone receptor; Mlr, mineralocorticoid receptor; Npy1r, neuropeptide Y1 receptor; Olfr6, olfactory receptor 6; Olfr8, olfactory receptor 8;Olfr11, olfactory receptor 11; Oprd1, δ1 opioid receptor; Oprk1, opioid receptor, kappa 1.
DISCUSSION
This experiment in BXD RI strains provisionally localized QTLs to several chromosomes and chromosomal regions for basal locomotion, locomotor response to an acute cocaine challenge, and cocaine sensitization. For sensitization, the QTL regions were generally distinct across dose, whereas there was more genetic overlap for the acute responses to the three cocaine doses. This result is consistent with estimates of genetic correlation between doses, which indicated more similarity among acute responses than sensitized responses. The distinct nature of our findings for sensitization across doses may reflect a tendency toward enhanced locomotion at doses that have moderate stimulant effects versus a tendency toward the development of stereotypy at higher, extremely stimulating doses. The large number of identified QTL regions is a reflection of the polygenic nature of these phenotypes and likely of some rate of false-positive associations. In general, genetic determination of responses to acute cocaine treatment was greater than of responsiveness to repeated cocaine exposure. This may not be so surprising given the known environmental (associative) influences on the development of drug sensitization (e.g., Badiani et al., 1995).
In Table 3, we listed QTL associations specific to three measures of sensitivity to acute 10 mg/kg cocaine treatment and two measures of sensitization to this cocaine dose. For sensitization, all but one QTL region were associated with both measures. This result is consistent with the correlation of r = 0.76 found for these phenotypes. For acute sensitivity, there were more instances of QTLs specific to one or two, rather than all three, measures. The correlation between the within- and between-groups measures of sensitivity, using data from the same treatment group (CD10) was quite high (r = 0.95), and there were only 5 marker associations of 17 not held in common for these two sensitivity estimates. On the other hand, the correlation between the acute sensitivity measured in two different groups (CD10 and CS) at two considerably different times in the course of the study was lower (r = 0.61). Just the same, there were only 6 of 17 identified QTLs not held in common. This may indicate that limiting reported correlations to those significantly associated atp ≤ 0.01 may provide the rigor necessary to detect those that are most likely to be confirmed. The lower genetic correlation may indicate that repeated exposures to the test environment altered the cocaine response in CS group mice.
Some QTL regions identified were in agreement with other work examining cocaine sensitivity in BXD RI mice, and some were unique or did not replicate other work. There was also little overlap for sensitivity or sensitization to ethanol (Phillips et al., 1995) with cocaine. However, there were a large number of common QTLs found between our cocaine study and that of Grisel et al. (1997) for methamphetamine activity measured in the home cage. This was not true for another study of locomotor response to amphetamine (Alexander et al., 1996), at least if the direction of the correlation was taken into consideration. A comparison of the QTL results of Grisel et al. (1997) and Alexander et al. (1996) also indicates few common QTLs. Testing of phencyclidine response before testing of amphetamine response in the same animals in the study by Alexander et al. (1996) may have altered the results, accounting for this lack of convergence.
We did not attempt in the current work to evaluate or control possible pharmacokinetic factors that might contribute to strain differences in cocaine sensitivity or sensitization. Evidence exists for changes in brain disposition of cocaine with repeated exposure (Pan et al., 1991;Mizugaki et al., 1994; Tolliver et al., 1994). Most studies report increased brain levels in cocaine-preexposed animals, but at least one study has demonstrated behavioral sensitization in the absence of altered brain cocaine disposition (Orona et al., 1994). Such data suggest that changes in brain cocaine disposition are not likely to completely account for behavioral sensitization to cocaine. However, the possibility remains that strain differences in cocaine absorption, distribution, or metabolism could account for some variation in response (Reith et al., 1987).
A long list of potential candidate genes was amassed and will await further investigation after confirmation of the QTL locations using methods that have been described (Belknap et al., 1993, 1996; Crabbe et al., 1994b), and used for some ethanol phenotypes (Belknap et al., 1997; Buck et al., 1997; Markel et al., 1997). This work will be performed using a genetically segregating population (the F2 cross of the B6 and D2 progenitors), in which each individual animal will be tested and genotyped in the regions suggested to contain important QTLs by our BXD RI data. It is estimated that at least 50% of the QTLs suggested by the RI analyses will be confirmed (Belknap et al., 1996;Buck et al., 1997). However, there is already experimental evidence, in fact, too much to review, suggesting the particular involvement of some of these candidates. For example, the κ1 opioid receptor geneOprk1 mapped near a QTL for cocaine sensitization, and several studies have supported the involvement of κ opioid receptors in cocaine sensitization (Heidbreder et al., 1995; Spanagel, 1995;Shippenberg et al., 1996). Two different NMDA receptor subtypes also mapped near QTLs for cocaine sensitization, and NMDA receptor antagonism appears to play a role in cocaine sensitization (Wolf and Jeziorski, 1993; Ida et al., 1995; Morrow et al., 1995). The mineralocorticoid and glucocorticoid receptor genes Mlr andGrl1, near sensitization QTLs, are interesting candidates, because repeated stress exposure and chronic corticosterone treatment can produce sensitization to psychostimulant drugs and to ethanol (Ortiz et al., 1995; Roberts et al., 1995).
Several dopamine receptor subtype genes mapped near QTLs for basal locomotion. This is consistent with the known role of dopamine in general locomotor behavior (Phillips and Shen, 1996) and with recent work in single-gene knock-out mice showing specific effects of some receptor subtypes on locomotion (Baik et al., 1995; Rubinstein et al., 1997; Kelly et al., in press). In addition, provisional QTLs mapped near several olfactory receptor genes, an interesting finding given the likely importance of olfactory cues in rodent exploratory behavior.
For sensitivity to acute cocaine treatment, there were QTLs mapped near genes for several neurotransmitter or hormone receptors. Of particular interest is a QTL mapped near Drd4, the dopamine D4 receptor gene, in light of our recent findings that Drd4 knock-out mice display greater sensitivity to the acute stimulant effects of cocaine than do their wild-type counterparts (Rubinstein et al., 1997).
The current study reports a relationship between strain sensitivity to an acute 10 mg/kg cocaine challenge and degree of subsequent sensitization to that dose. No such relationship was found for the other cocaine doses. The initial cocaine running response of 13 mouse strains was not correlated with degree of sensitization (Shuster et al., 1977). However, in the present work there were some (albeit few) common QTL markers for acute stimulant and sensitization for all three doses. In other work, we found little relationship between acute ethanol response and response to repeated ethanol treatments (Phillips et al., 1995). The relationship for the moderate cocaine dose may suggest some ability to predict risk of cocaine sensitization development from acute cocaine response.
We saw a positive relationship between baseline activity and sensitivity to acute cocaine treatment. This is inconsistent with some other work in which animals with lower basal activity levels had larger drug stimulant responses (Wenger, 1989; Moore et al., 1993). Furthermore, no relationship was seen for ethanol (Phillips et al., 1995) or in another report when cocaine responses were corrected for differences in basal activity, as in our studies (Miner and Marley, 1995a).
Evidence for associative conditioning effects on cocaine sensitization was found. In the cocaine response comparison of groups that had received equal cocaine exposure, but differential cocaine and test environment exposure (day 9 CD10 vs CDC groups), no conditioned sensitization was seen in more than half of the strains. In the assessment of conditioned drug effects after saline exposure to largely cocaine- versus saline-experienced animals (day 12 CD10 vs CS groups), conditioned effects were found that did not interact with strain. Whereas the latter result might suggest that the conditioned response is not under genetic control, the former would not. It may be the case that the single cocaine and test environment exposure of the CS group 24 hr before the day 12 conditioning test influenced the results or that the test of conditioning under saline versus cocaine challenge resulted in different outcomes. We obtained no evidence of conditioned sensitization in our work with ethanol (Phillips et al., 1995). However, in another ethanol study, some evidence for a conditioned activity response to apparatus cues was obtained (Cunningham, 1995). We have seen evidence for conditioned sensitization to methamphetamine with the same procedure used for the current study (Phillips et al., 1994b).
The current study provides evidence for the influence of genetic differences on level of basal activity, sensitivity to the acute stimulant effects of cocaine, and magnitude of sensitization to repeated cocaine exposures. Our most critical future plans include confirmation of the QTL regions identified in the current work using an F2 population between the B6 and D2 progenitor strains. We hope that this work will eventually lead to identification of the actual genes located in QTL regions that confer differences in susceptibility to the stimulant and sensitizing effects of cocaine and that may possibly play a role in cocaine addiction.
Footnotes
This work was supported by a grant from the Department of Veterans Affairs and a contract from the National Institute on Drug Abuse. We appreciate the assistance of Courtney Gwiazdon and Dr. Steve Mitchell with QTL and other statistical analyses.
Correspondence should be addressed to Dr. Tamara J. Phillips, Veterans Affairs Medical Center, Research 151W, 3710 Southwest US Veterans Hospital Road, Portland, OR 97201.
REFERENCES
- 1.Alexander RC, Wright R, Freed W (1996) Quantitative trait loci contributing to phencyclidine-induced and amphetamine-induced locomotor behavior in inbred mice. Neuropsychopharmacology [Erratum (1996) 15:609] 15:484–490. [DOI] [PubMed]
- 2.Badiani A, Browman KE, Robinson TE. Influence of novel versus home environments on sensitization to the psychomotor stimulant effects of cocaine and amphetamine. Brain Res. 1995;674:291–298. doi: 10.1016/0006-8993(95)00028-o. [DOI] [PubMed] [Google Scholar]
- 3.Baik J-H, Picetti R, Saiardi A, Thiriet G, Dierich A, Depaulis A, Le Meur M, Borrelli E. Parkinsonian-like locomotor impairment in mice lacking dopamine D2 receptors. Nature. 1995;377:424–428. doi: 10.1038/377424a0. [DOI] [PubMed] [Google Scholar]
- 4.Belknap JK. Empirical estimates of Bonferroni corrections for use in chromosome mapping studies with the BXD recombinant inbred strains. Behav Genet. 1992;22:677–684. doi: 10.1007/BF01066638. [DOI] [PubMed] [Google Scholar]
- 5.Belknap JK, Metten P, Helms ML, O’Toole LA, Angeli-Gade S, Crabbe JC, Phillips TJ. Quantitative trait loci (QTL) applications to substances of abuse: physical dependence studies with nitrous oxide and ethanol in BXD mice. Behav Genet. 1993;23:213–222. doi: 10.1007/BF01067426. [DOI] [PubMed] [Google Scholar]
- 6.Belknap JK, Mogil JS, Helms ML, Richards SP, O’Toole LA, Bergeson SE, Buck KJ. Localization to chromosome 10 of a locus influencing morphine analgesia in crosses derived from C57BL/6 and DBA/2 strains. Life Sci. 1995;57:PL117–124. doi: 10.1016/0024-3205(95)02040-p. [DOI] [PubMed] [Google Scholar]
- 7.Belknap JK, Mitchell SR, O’Toole LA, Helms ML, Crabbe JC. Type I and type II error rates for quantitative trait loci (QTL) mapping studies using recombinant inbred mouse strains. Behav Genet. 1996;26:149–159. doi: 10.1007/BF02359892. [DOI] [PubMed] [Google Scholar]
- 8.Belknap JK, Richards SP, O’Toole LA, Helms ML, Phillips TJ. Short-term selective breeding as a tool for QTL mapping: ethanol preference drinking in mice. Behav Genet. 1997;27:55–66. doi: 10.1023/a:1025615409383. [DOI] [PubMed] [Google Scholar]
- 9.Benuck M, Lajtha A, Reith MEA. Pharmacokinetics of systemically administered cocaine and locomotor stimulation in mice. J Pharmacol Exp Ther. 1987;243:144–149. [PubMed] [Google Scholar]
- 10.Berrettini WH, Ferraro TN, Alexander RC, Buchberg AM, Vogel WH. Quantitative trait loci mapping of three loci controlling morphine preference using inbred mouse strains. Nat Genet. 1994;7:54–58. doi: 10.1038/ng0594-54. [DOI] [PubMed] [Google Scholar]
- 11.Bonci A, Williams JT. A common mechanism mediates long-term changes in synaptic transmission after chronic cocaine and morphine. Neuron. 1996;16:631–639. doi: 10.1016/s0896-6273(00)80082-3. [DOI] [PubMed] [Google Scholar]
- 12.Boulay D, Duterte-Boucher D, Leroux-Nicollet I, Naudon L, Costentin J. Locomotor sensitization and decrease in [3H]mazindol binding to the dopamine transporter in the nucleus accumbens are delayed after chronic treatments by GBR 12783 or cocaine. J Pharmacol Exp Ther. 1996;278:330–337. [PubMed] [Google Scholar]
- 13.Buck KJ, Metten P, Belknap JK, Crabbe JC. Quantitative trait loci involved in genetic predisposition to acute alcohol withdrawal in mice. J Neurosci. 1997;17:3946–3955. doi: 10.1523/JNEUROSCI.17-10-03946.1997. [DOI] [PMC free article] [PubMed] [Google Scholar]
- 14.Crabbe JC, Belknap JK, Mitchell SR, Crawshaw LI. Quantitative trait loci mapping of genes that influence the sensitivity and tolerance to ethanol-induced hypothermia in BXD recombinant inbred mice. J Pharmacol Exp Ther. 1994a;269:184–192. [PubMed] [Google Scholar]
- 15.Crabbe JC, Belknap JK, Buck KJ. Genetic animal models of alcohol and drug abuse. Science. 1994b;264:1715–1723. doi: 10.1126/science.8209252. [DOI] [PubMed] [Google Scholar]
- 16.Crabbe JC, Phillips TJ, Gallaher EJ, Crawshaw LI, Mitchell SR. Common genetic determinants of the ataxic and hypothermic effects of ethanol in BXD RI mice: genetic correlations and quantitative trait loci. J Pharmacol Exp Ther. 1996;277:624–632. [PubMed] [Google Scholar]
- 17.Cunningham CL. Localization of genes influencing ethanol-induced conditioned place preference and locomotor activity in BXD recombinant inbred mice. Psychopharmacology. 1995;120:28–41. doi: 10.1007/BF02246142. [DOI] [PubMed] [Google Scholar]
- 18.Downs AW, Eddy NB. The effect of repeated doses of cocaine on the rat. J Pharmacol Exp Ther. 1932;46:199–200. [Google Scholar]
- 19.Elmer GI, Gorelick DA, Goldberg SR, Rothman RB. Acute sensitivity vs. context-specific sensitization to cocaine as a function of genotype. Pharmacol Biochem Behav. 1996;53:623–628. doi: 10.1016/0091-3057(95)02062-4. [DOI] [PubMed] [Google Scholar]
- 20.Gallaher EJ, Jones GE, Belknap JK, Crabbe JC. Identification of genetic markers for initial sensitivity and rapid tolerance to ethanol-induced ataxia using quantitative trait locus analysis in BXD recombinant inbred mice. J Pharmacol Exp Ther. 1996;277:604–612. [PubMed] [Google Scholar]
- 21.Gershenfeld HK, Neumann PE, Mathis C, Crawley JN, Li X, Paul SM. Mapping quantitative trait loci for open-field behavior in mice. Behav Genet. 1997;27:201–210. doi: 10.1023/a:1025653812535. [DOI] [PubMed] [Google Scholar]
- 22.Glick SD, Hinds PA. Sex differences in sensitization to cocaine-induced rotation. Eur J Pharmacol. 1984;99:119–121. doi: 10.1016/0014-2999(84)90442-4. [DOI] [PubMed] [Google Scholar]
- 23.Goeders NE, Kuhar MJ. Chronic cocaine administration induces opposite changes in dopamine receptors in the striatum and nucleus accumbens. Alcohol Drug Res. 1987;7:207–216. [PubMed] [Google Scholar]
- 24.Gora-Maslak G, McClearn GE, Crabbe JC, Phillips TJ, Belknap JK, Plomin R. Use of recombinant inbred strains to identify quantitative trait loci in psychopharmacology. Psychopharmacology. 1991;104:413–424. doi: 10.1007/BF02245643. [DOI] [PubMed] [Google Scholar]
- 25.Grisel JE, Belknap JK, O’Toole LA, Helms ML, Wenger CD, Crabbe JC. Quantitative trait loci affecting methamphetamine responses in BXD recombinant inbred mouse strains. J Neurosci. 1997;17:745–754. doi: 10.1523/JNEUROSCI.17-02-00745.1997. [DOI] [PMC free article] [PubMed] [Google Scholar]
- 26.Heidbreder CA, Babovic-Vuksanovic D, Shoaib M, Shippenberg TS. Development of behavioral sensitization to cocaine: influence of kappa opioid receptor agonists. J Pharmacol Exp Ther. 1995;275:150–163. [PubMed] [Google Scholar]
- 27.Heidbreder CA, Thompson AC, Shippenberg TS. Role of extracellular dopamine in the initiation and long-term expression of behavioral sensitization to cocaine. J Pharmacol Exp Ther. 1996;278:490–502. [PubMed] [Google Scholar]
- 28.Henry DJ, White FJ. The persistence of behavioral sensitization to cocaine parallels enhanced inhibition of nucleus accumbens neurons. J Neurosci. 1995;15:6287–6299. doi: 10.1523/JNEUROSCI.15-09-06287.1995. [DOI] [PMC free article] [PubMed] [Google Scholar]
- 29.Hinson RE, Poulos CX. Sensitization to the behavioral effects of cocaine: modification by Pavlovian conditioning. Pharmacol Biochem Behav. 1981;15:559–562. doi: 10.1016/0091-3057(81)90208-2. [DOI] [PubMed] [Google Scholar]
- 30.Hooks MS, Jones GH, Hemby SE, Justice JB., Jr Environmental and pharmacological sensitization: effects of repeated administration of systemic or intra-nucleus accumbens cocaine. Psychopharmacology. 1993;111:109–116. doi: 10.1007/BF02257416. [DOI] [PubMed] [Google Scholar]
- 31.Hope BT, Nye HE, Kelz MB, Self DW, Iadarola MJ, Nakabeppu Y, Duman RS, Nestler EJ. Induction of a long-lasting AP-1 complex composed of altered fos-like proteins in brain by chronic cocaine and other chronic treatments. Neuron. 1994;13:1235–1244. doi: 10.1016/0896-6273(94)90061-2. [DOI] [PubMed] [Google Scholar]
- 32.Ida I, Asami T, Kuribara H. Inhibition of cocaine sensitization by MK-801, a noncompetitive N-methyl-d-aspartate (NMDA) receptor antagonist: evaluation by ambulatory activity in mice. Jpn J Pharmacol. 1995;69:83–90. doi: 10.1254/jjp.69.83. [DOI] [PubMed] [Google Scholar]
- 33.Johnson TE, DeFries JC, Markel PD. Mapping quantitative trait loci for behavioral traits in the mouse. Behav Genet. 1992;22:635–653. doi: 10.1007/BF01066635. [DOI] [PubMed] [Google Scholar]
- 34.Kalivas PW, Duffy P. Effect of acute and daily cocaine treatment on extracellular dopamine in the nucleus accumbens. Synapse. 1990;6:48–58. doi: 10.1002/syn.890050104. [DOI] [PubMed] [Google Scholar]
- 35.Kelly MA, Rubinstein M, Phillips TJ, Lessov CN, Burkhart-Kasch S, Zhang G, Bunzow JR, Fang Y, Gerhardt GA, Grandy DK, Low MJ (1998) Locomotor activity in D2 dopamine receptor-deficient mice is determined by gene dosage, genetic background and developmental adaptations. J Neurosci, in press. [DOI] [PMC free article] [PubMed]
- 36.Koff JM, Shuster L, Miller LG. Chronic cocaine administration is associated with behavioral sensitization and time-dependent changes in striatal dopamine transporter binding. J Pharmacol Exp Ther. 1994;268:277–282. [PubMed] [Google Scholar]
- 37.Lander ES, Shork NJ. Genetic dissection of complex traits. Science. 1994;265:2037–2048. doi: 10.1126/science.8091226. [DOI] [PubMed] [Google Scholar]
- 38.Lander E, Kruglyak L. Genetic dissection of complex traits: guidelines for interpreting and reporting linkage results. Nat Genet. 1995;11:241–247. doi: 10.1038/ng1195-241. [DOI] [PubMed] [Google Scholar]
- 39.Manly KE. A Macintosh program for storage and analysis of experimental genetic mapping data. Mamm Genome. 1993;4:303–313. doi: 10.1007/BF00357089. [DOI] [PubMed] [Google Scholar]
- 40.Markel PD, Bennett B, Beeson M, Gordon L, Johnson TE. Confirmation of quantitative trait loci for ethanol sensitivity in long-sleep and short-sleep mice. Genome Res. 1997;7:92–99. doi: 10.1101/gr.7.2.92. [DOI] [PubMed] [Google Scholar]
- 41.Mayfield RD, Larson G, Zahniser NR. Cocaine-induced behavioral sensitization and D1 dopamine receptor function in rat nucleus accumbens and striatum. Brain Res. 1992;573:331–335. doi: 10.1016/0006-8993(92)90783-6. [DOI] [PubMed] [Google Scholar]
- 42.Melo JA, Shendure J, Pociask K, Silver LM. Identification of sex-specific quantitative trait loci controlling alcohol preference in C57BL/6 mice. Nat Genet. 1996;13:147–153. doi: 10.1038/ng0696-147. [DOI] [PubMed] [Google Scholar]
- 43.Miner LL, Marley RJ. Chromosomal mapping of the psychomotor stimulant effects of cocaine in BXD recombinant inbred mice. Psychopharmacology. 1995a;122:209–214. doi: 10.1007/BF02246541. [DOI] [PubMed] [Google Scholar]
- 44.Miner LL, Marley RJ. Chromosomal mapping of loci influencing sensitivity to cocaine-induced seizures in BXD recombinant inbred strains of mice. Psychopharmacology. 1995b;117:62–66. doi: 10.1007/BF02245099. [DOI] [PubMed] [Google Scholar]
- 45.Miserendino MJD, Nestler EJ. Behavioral sensitization to cocaine: modulation by the cyclic AMP system in the nucleus accumbens. Brain Res. 1995;674:299–306. doi: 10.1016/0006-8993(95)00030-t. [DOI] [PubMed] [Google Scholar]
- 46.Mizugaki M, Hishinuma T, Kimura K, Nakamura H, Aso H, Ishii F, Nishikawa M, Itoh K, Tomioka Y, Ishiwata S, Moritani H, Uyama T, Ido T. The distribution of [11C]cocaine in normal and cocaine-sensitization mice. Nucl Med Biol. 1994;21:793–799. doi: 10.1016/0969-8051(94)90158-9. [DOI] [PubMed] [Google Scholar]
- 47.Moore TO, June HL, Lewis MJ. Ethanol-induced stimulation and depression on measures of locomotor activity: effects of basal activity levels in rats. Alcohol. 1993;10:537–540. doi: 10.1016/0741-8329(93)90078-3. [DOI] [PubMed] [Google Scholar]
- 48.Morrow BA, Taylor JR, Roth RH. R-(+)-HA-966, an antagonist for the glycine/NMDA receptor, prevents locomotor sensitization to repeated cocaine exposures. Brain Res. 1995;673:165–169. doi: 10.1016/0006-8993(94)01456-r. [DOI] [PubMed] [Google Scholar]
- 49.Neumann PE. Inference in linkage analysis of multifactorial traits using recombinant inbred strains of mice. Behav Genet. 1992;22:665–676. doi: 10.1007/BF01066637. [DOI] [PubMed] [Google Scholar]
- 50.Neumann PE, Seyfried TN. Mapping of two genes that influence susceptibility to audiogenic seizures in crosses of C57BL/6J and DBA/2J mice. Behav Genet. 1990;20:307–323. doi: 10.1007/BF01067798. [DOI] [PubMed] [Google Scholar]
- 51.Orona RA, Mayfield RD, Cline EJ, Zahniser NR. Repeated intravenous cocaine administration to rats produces behavioral sensitization without changing brain cocaine levels. Neurosci Lett. 1994;167:121–124. doi: 10.1016/0304-3940(94)91042-1. [DOI] [PubMed] [Google Scholar]
- 52.Ortiz J, Decaprio JL, Kosten TA, Nestler EJ. Strain-selective effects of corticosterone on locomotor sensitization to cocaine and on levels of tyrosine hydroxylase and glucocorticoid receptor in the ventral tegmental area. Neuroscience. 1995;67:383–397. doi: 10.1016/0306-4522(95)00018-e. [DOI] [PubMed] [Google Scholar]
- 53.Pan H-T, Menacherry S, Justice JB., Jr Differences in the pharmacokinetics of cocaine in naive and cocaine-experienced rats. J Neurochem. 1991;56:1299–1306. doi: 10.1111/j.1471-4159.1991.tb11425.x. [DOI] [PubMed] [Google Scholar]
- 54.Parsons LH, Justice JB., Jr Serotonin and dopamine sensitization in the nucleus accumbens, ventral tegmental area, and dorsal raphe nucleus following repeated cocaine administration. J Neurochem. 1993;61:1611–1619. doi: 10.1111/j.1471-4159.1993.tb09794.x. [DOI] [PubMed] [Google Scholar]
- 55.Phillips TJ, Shen EH. Neurochemical bases of locomotion and ethanol stimulant effects. Int Rev Neurobiol. 1996;39:243–282. doi: 10.1016/s0074-7742(08)60669-8. [DOI] [PubMed] [Google Scholar]
- 56.Phillips TJ, Crabbe JC, Metten P, Belknap JK. Localization of genes affecting alcohol drinking in mice. Alcohol Clin Exp Res. 1994a;18:931–941. doi: 10.1111/j.1530-0277.1994.tb00062.x. [DOI] [PubMed] [Google Scholar]
- 57.Phillips TJ, Dickinson S, Burkhart-Kasch S. Behavioral sensitization to drug stimulant effects in C57BL/6J and DBA/2J inbred mice. Behav Neurosci. 1994b;108:789–803. doi: 10.1037//0735-7044.108.4.789. [DOI] [PubMed] [Google Scholar]
- 58.Phillips TJ, Huson M, Gwiazdon C, Burkhart-Kasch S, Shen EH. Effects of acute and repeated ethanol exposures on the locomotor activity of BXD recombinant inbred mice. Alcohol Clin Exp Res. 1995;19:1–10. doi: 10.1111/j.1530-0277.1995.tb01502.x. [DOI] [PubMed] [Google Scholar]
- 59.Phillips TJ, Lessov CN, Harland RD, Mitchell SR. Evaluation of potential genetic associations between ethanol tolerance and sensitization in BXD/Ty recombinant inbred mice. J Pharmacol Exp Ther. 1996;277:613–623. [PubMed] [Google Scholar]
- 60.Pierce RC, Bell K, Duffy P, Kalivas PW. Repeated cocaine augments excitatory amino acid transmission in the nucleus accumbens only in rats having developed behavioral sensitization. J Neurosci. 1996;16:1550–1560. doi: 10.1523/JNEUROSCI.16-04-01550.1996. [DOI] [PMC free article] [PubMed] [Google Scholar]
- 61.Quock RM, Mueller JL, Vaughn LK, Belknap JK. Nitrous oxide antinociception in BXD recombinant inbred mouse strains and identification of quantitative trait loci. Brain Res. 1996;725:23–29. doi: 10.1016/0006-8993(96)00211-9. [DOI] [PubMed] [Google Scholar]
- 62.Reid MS, Hsu K, Tolliver BK, Crawford CA, Berger SP. Evidence for the involvement of phospholipase A2 mechanisms in the development of stimulant sensitization. J Pharmacol Exp Ther. 1996;276:1244–1256. [PubMed] [Google Scholar]
- 63.Reith MEA, Benuck M, Lajtha A. Cocaine disposition in the brain after continuous or intermittent treatment and locomotor stimulation in mice. J Pharmacol Exp Ther. 1987;243:281–287. [PubMed] [Google Scholar]
- 64.Roberts AJ, Lessov CN, Phillips TJ. Critical role for glucocorticoid receptors in stress- and ethanol-induced locomotor sensitization. J Pharmacol Exp Ther. 1995;275:790–797. [PubMed] [Google Scholar]
- 65.Robinson TE. Stimulant drugs and stress: factors influencing individual differences in the susceptibility to sensitization. In: Kalivas PW, Barnes CD, editors. Sensitization in the Nervous System. Telford; Caldwell, NJ: 1988. pp. 145–173. [Google Scholar]
- 66.Robinson TE, Becker JB. Enduring changes in brain and behavior produced by chronic amphetamine administration: a review and evaluation of animal models of amphetamine psychosis. Brain Res Rev. 1986;11:157–198. doi: 10.1016/s0006-8993(86)80193-7. [DOI] [PubMed] [Google Scholar]
- 67.Rodriguez LA, Plomin R, Blizard DA, Jones BC, McClearn GE. Alcohol acceptance, preference and sensitivity in mice. II. Quantitative trait loci mapping analysis using BXD recombinant inbred strains. Alcohol Clin Exp Res. 1995;19:367–373. doi: 10.1111/j.1530-0277.1995.tb01517.x. [DOI] [PubMed] [Google Scholar]
- 68.Rubinstein M, Phillips TJ, Bunzow JR, Falsone T, Dziewczapolski G, Zhang G, Fang Y, Larson JL, McDougall JA, Chester JA, Saez C, Pugsley TA, Gershanik O, Low MJ, Grandy DK. Mice lacking dopamine D4 receptors are supersensitive to ethanol, cocaine and methamphetamine. Cell. 1997;90:991–1001. doi: 10.1016/s0092-8674(00)80365-7. [DOI] [PubMed] [Google Scholar]
- 69.Segal DS, Kuczenski R. Repeated cocaine administration induces behavioral sensitization and corresponding decreased extracellular dopamine responses in caudate and accumbens. Brain Res. 1992;577:351–355. doi: 10.1016/0006-8993(92)90297-m. [DOI] [PubMed] [Google Scholar]
- 70.Shippenberg TS, LeFevour A, Heidbreder Ch. Kappa-opioid receptor agonists prevent sensitization to the conditioned rewarding effects of cocaine. J Pharmacol Exp Ther. 1996;276:545–554. [PubMed] [Google Scholar]
- 71.Shuster L, Yu G, Bates A. Sensitization to cocaine stimulation in mice. Psychopharmacology. 1977;52:185–190. doi: 10.1007/BF00439108. [DOI] [PubMed] [Google Scholar]
- 72.Silver LM, Nadeau JH. Mammalian genome, Vol 7. Springer; New York: 1997. [Google Scholar]
- 73.Spanagel R. Modulation of drug-induced sensitization processes by endogenous opioid systems. Behav Brain Res. 1995;70:37–49. doi: 10.1016/0166-4328(94)00176-g. [DOI] [PubMed] [Google Scholar]
- 74.Steketee JD, Sorg BA, Kalivas PW. The role of the nucleus accumbens in sensitization to drugs of abuse. Prog Neuropsychopharmacol Biol Psychiatry. 1992;16:237–246. doi: 10.1016/0278-5846(92)90075-p. [DOI] [PubMed] [Google Scholar]
- 75.Striplin CD, Kalivas PW. Robustness of G-protein changes in cocaine sensitization shown with immunoblotting. Synapse. 1993;14:10–15. doi: 10.1002/syn.890140103. [DOI] [PubMed] [Google Scholar]
- 76.Tatum AL, Seevers MH. Experimental cocaine addiction. J Pharmacol Exp Ther. 1929;36:401–410. [Google Scholar]
- 77.Taylor BA. Genetic relationships between inbred strains of mice. J Hered. 1972;63:83–86. doi: 10.1093/oxfordjournals.jhered.a108235. [DOI] [PubMed] [Google Scholar]
- 78.Thomas WL, Jr, Cooke ES, Hammer RP., Jr Cocaine-induced sensitization of metabolic activity in extrapyramidal circuits involves prior dopamine D1-like receptor stimulation. J Pharmacol Exp Ther. 1996;278:347–353. [PubMed] [Google Scholar]
- 79.Tolliver BK, Belknap JK, Woods WE, Carney JM. Genetic analysis of sensitization and tolerance to cocaine. J Pharmacol Exp Ther. 1994;270:1230–1238. [PubMed] [Google Scholar]
- 80.Tolliver BK, Ho LB, Reid MS, Berger SP. Evidence for involvement of ventral tegmental area cyclic AMP systems in behavioral sensitization to psychostimulants. J Pharmacol Exp Ther. 1996;278:411–420. doi: 10.1163/2211730x96x00216. [DOI] [PubMed] [Google Scholar]
- 81.Unterwald EM, Ho A, Rubenfeld JM, Kreek MJ. Time course of the development of behavioral sensitization and dopamine receptor up-regulation during binge cocaine administration. J Pharmacol Exp Ther. 1994;270:1387–1396. [PubMed] [Google Scholar]
- 82.Weiss SRB, Post RM, Pert A, Woodward R, Murman D. Context-dependent cocaine sensitization: differential effect of haloperidol on development versus expression. Pharmacol Biochem Behav. 1989;34:655–661. [PubMed] [Google Scholar]
- 83.Wenger GR. The role of control activity levels in the reported strain differences to the behavioral effects of drugs in mice. Pharmacol Biochem Behav. 1989;32:241–247. doi: 10.1016/0091-3057(89)90240-2. [DOI] [PubMed] [Google Scholar]
- 84.Williams JEG, Wieczorek W, Willner P, Kruk ZL. Parametric analysis of the effects of cocaine and cocaine pretreatment on dopamine release in the nucleus accumbens measured by fast cyclic voltammetry. Brain Res. 1995;678:225–232. doi: 10.1016/0006-8993(95)00188-v. [DOI] [PubMed] [Google Scholar]
- 85.Wolf ME, Jeziorski M. Coadministration of MK-801 with amphetamine, cocaine or morphine prevents rather than transiently masks the development of behavioral sensitization. Brain Res. 1993;613:291–294. doi: 10.1016/0006-8993(93)90913-8. [DOI] [PubMed] [Google Scholar]