

Abstract
Miniature IPSCs (mIPSCs) recorded in the Mauthner (M)-cell of zebrafish larvae have a broad amplitude distribution that is attributable only partly to the functional heterogeneity of postsynaptic glycine receptors (GlyRs). The role of the kinetic properties of GlyRs in amplitude fluctuation was investigated using fast-flow application techniques on outside-out patches. Short applications of a saturating glycine concentration evoked outside-out currents with a biphasic deactivation phase as observed for mIPSCs, and they were consistent with a rapid clearance of glycine from the synaptic cleft. Patch currents declined slowly during continuous applications of 3 mm glycine, but the biphasic deactivation phase of mIPSCs cannot reflect a desensitization process because paired-pulse desensitization was not observed. The maximum open probability (Po) of GlyRs was close to 0.9 with 3 mm glycine. Analyses of the onset of outside-out currents evoked by 0.1 mm glycine are consistent with the presence of two equivalent binding sites with aKd of O.3-O.4 mm. Activation and deactivation properties of GlyRs were better described with a kinetic model, including two binding states, a doubly liganded open state, and a reluctant gating mode leading to another open state. The 20–80% rise time of mIPSCs was independent of their amplitude and is identical to that of outside-out currents evoked by the applications of a saturating concentration of glycine (>1 mm). These results support the hypothesis that GlyR kinetics determines the time course of synaptic events at M-cell inhibitory synapses and that large mIPSC amplitude fluctuations are mainly of postsynaptic origin.
Keywords: glycine receptors, reluctant gating mode, zebrafish larva, miniature inhibitory synaptic currents, Mauthner cell, glycinergic synapses, channel kinetics
At individual synapses, the duration of postsynaptic events and their amplitude fluctuations can depend on both post- and presynaptic factors, such as the number and the relative proportions of receptors subtypes per synaptic bouton, their gating properties, the neurotransmitter time course in the synaptic cleft, and variations in the numbers of molecule release (Frerking and Wilson, 1996).
Glycine receptors (GlyRs) mediate inhibitory synaptic transmission in the vertebrate spinal cord and brain stem (Curtis and Johnston, 1974). For the Mauthner cell (M-cell) in the hindbrain of the zebrafish (Danio rerio) larvae, the amplitude distribution of glycinergic miniature IPSCs (mIPSCs) cannot be resolved by a single Gaussian curve (Legendre and Korn, 1994). This distribution is skewed or even multi-modal, as often observed at central synapses (Bekkers et al., 1990; Edwards et al., 1990; Manabe et al., 1992; Silver et al., 1992; Tang et al., 1994). Two functionally different GlyRs have been detected on M-cells (Legendre, 1997), and it has been proposed that variations in their proportion from one synapse to another can partly account for the broad amplitude distribution of mIPSCs (Legendre, 1997). However, this receptor heterogeneity is unlikely to be the sole determinant of the variability of the mIPSCs amplitude (Legendre, 1997). Such a complex distribution can also reflect a variation in the amount of neurotransmitter released (Frerking et al., 1995), intrinsic kinetic properties of the postsynaptic receptor (Tang et al., 1994), and a variable number of postsynaptic receptors from one synapse to another (Hestrin, 1992). To resolve this issue, the kinetic properties of GlyRs controlling the efficacy of inhibitory synapses first need to be characterized.
The analysis of the activation time course of ion channels in outside-out patches using concentration-clamp techniques (Franke et al.. 1987; Lester et al., 1990) has revealed important features of intrinsic channel properties for the control of synaptic efficacy (Clements and Westbrook, 1991; Clements et al., 1992; Hestrin, 1992;Lester and Jahr, 1992; Jones and Westbrook, 1996). It has been demonstrated that central receptors can be saturated by a released vesicle (Clements, 1996), whereas the time course of postsynaptic events is determined by channel kinetics rather than by clearance of neurotransmitters from the synaptic cleft (Clements, 1996). The kinetics of glyRs has been studied previously using only steady-state analysis, which is limited by uncertainties, including receptor desensitization and possible cooperativity between binding sites (Colquhoun, 1973).
The goal of this study was to characterize the kinetic properties of GlyRs that control the time course of mIPSCs. The present report is based on the analysis of the time course of mIPSCs recorded in the zebrafish larva M-cell and during fast-flow application of glycine to outside-out patches. Patches containing GlyRs with a single conductance state of 40–46 pS were used because this GlyR subtype is dominant in the M-cell (Legendre and Korn, 1994). The properties of these glyRs were used to estimate the peak concentration of glycine at the synaptic cleft and to determine the pre- and postsynaptic origin of the amplitude fluctuations of mIPSCs.
MATERIALS AND METHODS
Isolated intact brain preparation. The isolated intact zebrafish brain was prepared as described before (Legendre and Korn, 1994). Briefly, the brains of newly hatched larvae were dissected out and glued to a coverslip using a plasma-thrombin embedding procedure (Gähwiler and Brown, 1985). Before the experiments were started, brain preparations were stored for 15 min in an oxygenated (95%O2, 5%CO2) bathing solution containing (in mm): NaCl 145, KCl 1.5, CaCl2 2, MgCl2 1, NaHCO3 26, NaH2PO4 1.25, glucose 10, with the osmolarity adjusted to 330 mOsm.
Whole-cell and outside-out recordings. Standard whole-cell and outside-out recordings (Hamill et al., 1981) were achieved under direct visualization (Nikon Optiphot microscope) on the M-cell and on a reticular neuron (MiM1) located in the fourth hindbrain rhombomere (Metcalfe et al., 1986). The isolated brain preparation was perfused continuously at room temperature (20°C) with the oxygenated bathing solution (2 ml/min) in the recording chamber (0.5 ml). Patch-clamp electrodes were pulled either from thin-wall (whole-cell recordings, 1–3 MΩ) or thick-wall (outside-out recordings, 10–15 MΩ) borosilicate glass. They were fire-polished and filled with (in mm): CsCl 135, MgCl2 2, Na3ATP 4, EGTA 10, HEPES 10, pH 7.2. The osmolarity was adjusted to 290 mOsm.
Currents were recorded using an Axopatch 1D amplifier (Axon instruments, Foster City, CA), filtered at 10 KHz, and stored using a digital tape recorder (DAT DTR 1201, Sony, Tokyo, Japan). During whole-cell recordings, the series-resistance (4–10 MΩ) was monitored by applying 2 mV hyperpolarizing pulses and compensated 50–70%. To ensure cell dialysis, measurements were made on data obtained at least 3–5 min after the whole-cell configuration was established.
Drug delivery. During whole-cell experiments, drugs were applied to the preparation via an array of four flowpipes of 400 μm diameter positioned above the brain. TTX (1 μm) was dissolved in a perfusate containing (in mm): NaCl 145, KCl 2, CaCl2 2, MgCl2 1, glucose 10, and HEPES 10, pH 7.2; osmolarity was 330 mOsm.
Outside-out single-channel currents were evoked using a fast-flow operating system (Franke et al., 1987; Lester et al., 1990). Drugs were dissolved in a control solution containing (in mm): NaCl 145, KCl 1.5, CaCl2 2, MgCl2 1, glucose 10, and HEPES 10, pH 7.2; osmolarity was 330 mOsm. Control and drug solutions were gravity-fed into the two channels of a thin-wall glass theta tube (2 mm outer diameter; Hilgenberg) pulled and broken to obtain a tip diameter of 200 μm. The outside-out patch was positioned (45° angle) 100 μm away from the theta tubing, to be close to the interface formed between the flowing control and drug solutions. One lumen of the theta tube was connected to a manifold with reservoirs filled with solutions containing different glycine concentrations. The solution exchange was performed by rapidly moving the solution interface across the tip of the patch pipette, using a piezo-electric translator (model P245.30, Physic Instrument) (Clements and Westbrook, 1991). Concentration steps of glycine lasting 1–1000 msec were applied every 5–10 sec. Exchange times of 20–80% (≤0.04 msec) (see Fig. 1) were determined after the seal was ruptured by monitoring the change in the liquid junction evoked by the application of a 10% diluted control solution on the open tip of the patch pipette (see Fig.1B). The absolute exchange on the patch, however, may result partially from an unstirred layer around the patch. The theoretical limit to the speed of solution change was estimated using the method published by Maconochie and Knight (1989). Assuming that the patch has a spherical geometry with a radius r, the velocity profile can be evaluated as:
with v being the flow velocity and h the distance to the patch. The time required for diffusion of the neurotransmitter at a distance h from the patch surface is:
where D is the diffusion coefficient of the neurotransmitter. Assuming a patch diameter of 0.5 μm (pipette resistance 10–15 MΩ) and a diffusion coefficient for glycine close to 10−5 cm2/sec (Faber et al., 1992), the estimated absolute exchange time was found to be almost identical to the experimental full exchange time (0.08 msec).
Fig. 1.

mIPSCs and glycine-evoked patch currents have a closely similar decay. A, Example of a chloride current evoked by a brief pulse (1.3 msec) of 3 mm glycine. Note that the channels open in bursts at the end of the deactivation phase (insert). B, Open tip current (top trace) recorded during a 1.3 mm step into a 10% diluted control NaCl solution. Bottom trace is rising phase of averaged patch currents (n = 15) evoked by 3 mm glycine application (1.3 msec;Vh = −50 mV). The onset of the open tip and the patch currents were aligned to compare their time courses (see Results). Note that the time to peak (ttp) of the open tip current (full exchange time = 0.08 msec) was shorter than the ttp of the patch current. C, The decay of the averaged patch currents (n = 15) evoked by a step into 3 mm glycine (1.3 msec) was accurately fitted by a biexponential curve [τfast = 5.5 msec (80.4%); τslow = 29.5 msec]. D, Example of averaged mIPSCs (50–150 pA; n = 25) with a biphasic decay with time constants of τfast = 5.3 msec (76.6%) and τslow = 42.6 msec.
Analysis of whole-cell currents. Spontaneous synaptic activity was digitized off-line with a Macintosh IICi computer at 24 kHz using MMII software (GW Instruments). The detection of synaptic events was automatically performed, as described previously (Ankri et al., 1994; Legendre and Korn, 1994). Two extreme classes of mIPSCs (50–100 pA and 250–400 pA, respectively) were selected according to their histogram amplitudes (Legendre and Korn, 1994). Their time courses were analyzed by averaging 25 isolated single events using Axograph 3.0 (Axon Instruments) (filter cutoff frequency, 10 kHz), and the first 100 msec of the decay phase was fitted with a sum of exponential curves using Axograph 3.0 software. The presence of one or two exponential components was tested by comparing the sum of squared errors (SSEs) of the fits (Clements and Westbrook, 1991). The equation with two exponential components always resulted in a significantly better fit (SSE 1 exp > SSE 2 exp; paired t test;p = 0.01; n = 10 cells).
Outside-out patch current analysis. Single-channel currents were filtered at 10 kHz using an eight-pole Bessel filter (Frequency Devices), sampled at 62.5 kHz (Tl-1 interface, Axon Instruments) and stored on an IBM AT compatible computer using Pclamp software 6.03 (Axon Instruments). Outside-out currents were analyzed off-line with Axograph 3.0 software (Axon Instruments).
The open tip current (recorded after the seal was ruptured) used to measure the exchange time duration usually preceded glycine-evoked currents (see Fig. 1A), as mentioned previously (Jones and Westbrook, 1995). This caused difficulties in determining the real initial onset of the outside-out current evoked by the application of low glycine concentration. I therefore determined the initial onset of slow responses evoked by intermediate glycine concentrations (0.003–1.0 mm) from the onset of the chloride currents evoked by the application of 3 mmglycine.
The activation time constants of glycine-evoked currents were estimated by fitting the onset of the responses with a sum of sigmoidal curves (see Results) using Axograph 3.0 software. Decay time constants were obtained as described above for the analysis of the mIPSCs decay phase. For single-channel analysis, open time and closed time durations were analyzed manually using Axograph 3.0. For display purposes, open time and closed time histograms show the distributions in log intervals with the ordinate on a square root scale (Sigworth and Sine, 1987). Single-channel conductance was determined by constructing point-by-point amplitude histograms of data segments.
To minimize incorrect assignments in the classification of openings as short and long events, the method described by Jackson et al. (1983)was used. A critical time duration t0 was defined by the relation:
where Nf andNs are the relative area of the fast and slow components, and τ0f and τ0s are the mean open times of short- and long-lived open states. An opening will be classified as a short event when its duration is <t0.
To determine whether the length of successive openings was independent (test of correlation), the runs test was used (Colquhoun and Sakmann, 1985). This test is calculated by converting the opening duration into a series consisting of the digits 0 (short openings) and 1 (long openings). The series consist of no 0 values andn1 1 values (no +n1 = n). A run is defined as a contiguous section of the series that consists entirely of one or more 0 values or 1 values, T being the number of the runs.
If the series is in random order then the mean of T will be:
and its variance will be:
The test statistic z is defined as:
A positive correlation between the lengths of events will give fewer observed runs than the predicted value meanT, the value of z being smaller than −2 (Colquhoun and Sakmann, 1985).
Kinetic modeling programs. To obtain a kinetic model for GlyR behavior, glycine-evoked currents were analyzed off-line using chemical kinetic modeling programs (Fastflow and Fitfastflow; gift from J. D. Clements, University of Canberra) on a Power Macintosh (7600/132). This program first calculated the evolution of the number of channels in each given state for given rate constants. This program then varied systematically the rate constants to give the minimum sum of squared errors between the experimental data and a given model transient (Clements and Westbrook, 1991).
Patch currents and mIPSCs represent the average of 10 or more trials as specified in the figure legends or the text. Results are presented as mean values ± SD throughout, unless noted otherwise.
RESULTS
Two types of M-cell synaptically activated glycine-gated channels were determined on the basis of their main conductance states and their pharmacological properties (Legendre, 1997). Nonstationary kinetic analysis was performed on the GlyR subtype characterized by a single conductance state of 40–46 pS (Legendre and Korn, 1994; Legendre, 1997). Patches containing channels with multiple subconductance levels in response to the application of low agonist concentrations were omitted.
mIPSCs and glycine-evoked chloride currents have similar time courses
Glycine receptor (GlyR) currents in outside-out patches of M-cell (Fig. 1B) were evoked by rapid switches between control solution and a glycine-containing solution (see Materials and Methods). A rundown of the response was not observed at the application frequency used (0.1–0.2 Hz). The absolute solution exchange time was ∼0.08 msec (see Materials and Methods) (Fig. 1B) in all experiments. A series of trials (10–15) separated by 5 sec or more were used to generate an ensemble average trace. The decay phase of the outside-out currents evoked by short steps (1–2 msec) into 3 mm glycine had two components (Fig. 1C), with time constants of τfast = 4.9 ± 1.3 msec (66.3 ± 6.1% of total amplitude; n = 10) and τslow = 39.4 ± 12.4 msec (n = 10), respectively. These responses were completely blocked by the application of 0.1 μmstrychnine (data not shown).
mIPSCs also had two decay phase components (Fig. 1D). In our previous studies (Legendre and Korn, 1994, 1995; Legendre, 1997), these two decay phase components for glycinergic mIPSCs were not detected because my analyses were limited by automatically fitting the first 10 msec of the deactivation phase. Although the amplitude of mIPSCs varied strongly (Legendre and Korn, 1994, 1995; Legendre, 1997) (Fig. 2A), their decay time constants were independent of the amplitude (Legendre and Korn, 1994, 1995; Legendre, 1997) (Fig. 2B,C). For mIPSCs having an amplitude ranging from 50 to 150 pA, τfast = 4.2 ± 0.9 msec (72.6 ± 8.99%) and τslow = 29.3 ± 6.6 msec (n = 10 cells), whereas 250–400 pA mIPSCs had a τfast and τslow of 4.5 ± 1.1 msec (74.9 ± 12.7%) and 26.4 ± 6.5 msec (n = 10 cells), respectively. The small and large mIPSCs decay time constants and the relative amplitudes of the two exponential curves were not significantly different (unpairedt test; p = 0.05; n = 10 cells). The mIPSC decay time constants and relative amplitudes of the two exponential components were also not significantly different from those obtained on outside-out current evoked by a brief pulse (1–2 msec) of 3 mm glycine (unpaired t test;p = 0.05). These results are consistent with the hypothesis that rebinding of glycine did not significantly account for glycinergic mIPSC duration. Accordingly, the rate of clearance of free neurotransmitter from the synaptic cleft is likely to be fast at central synapses (Faber et al., 1992; Clements, 1996).
Fig. 2.

Time course of mIPSCs is independent of their amplitude. A, Amplitude histogram of mIPSCs recorded on a Mauthner cell in the presence of 1 μm TTX (n = 808; bin width = 8 pA;Vh = −50 mV). B, Superimposed averaged mIPSCs of 50–150 and 250–400 pA, respectively (n = 25; Vh = −50 mV). Same cell as in A. C, Normalized averaged mIPSCs shown in B. These two miniature events have similar time courses. They were accurately fitted (not shown) with the sum of two exponential curves with τfast = 4.5 msec (56.5%) and τslow = 23 msec.
Steady-state concentration–response curve and maximum open probability
To understand how mIPSCs are generated after exocytosis, we first need to know the efficacy of glycine in activating its receptor channels. Figure 3Aillustrates chloride currents evoked by the application of glycine at different concentrations. The duration of the applications was adjusted to obtain steady-state responses. Three or four different glycine concentrations were usually tested with each patch, and the response amplitude was normalized to that obtained by the application of 3 mm glycine. Figure 3B shows the concentration–response curve obtained from 11 experiments. The normalized data were fitted using a single binding isotherm of the form:
where I/Imax are the normalized response amplitude, EC50 is the glycine concentration [glycine] producing 50% of the maximal response and h is the Hill coefficient. This fit produced an EC50 of 0.054 mm and a Hill coefficient of 1.56. This is closely similar to values obtained in other preparations using whole-cell recording techniques (Akaike and Kaneda, 1989; Zhang and Berg, 1995). A maximum response was obtained for [glycine] >1 mm, suggesting that applications of millimolar glycine would lead to a near saturation of GlyRs.
Fig. 3.

Concentration–response curve of glycine-evoked currents. A, Responses of a patch to step application of different concentrations of glycine. The duration of the application was adjusted to obtain a steady-state amplitude of the responses. Each trace represents the average of 10 responses. B, Concentration–response plot of data obtained in 11 patches. Response amplitudes were normalized to that obtained in the presence of 3 mm glycine. Each point is the average of 5–11 measurements. Data points were fitted with a single binding isotherm (see Results). C, Superimposed averaged traces of the first five and the last five responses from a set of 45 currents evoked by identical step application of 3 mm glycine (2 msec;Vh = −50 mV). D, Variance–amplitude plot computed for 45 current transients (same patch as in C). The amplitude and the variance were computed for a period of 150 msec starting at the peak of the averaged response. The curve represents the fitted model ς2 =iI − (I2/N) (see Results) with i = 1.72 pA and n= 49.
At this concentration a maximum number of the available receptors would be opened. To estimate the maximum open probability (Pomax), a series of responses (20–45) to identical 2 msec steps of 3 mm glycine were recorded (Fig. 3C,D). In each experiment the possibility of rundown of the response amplitude and time-dependent changes in the rate of deactivation were examined by comparing the averaged trace of the first five responses to the averaged trace of the last five. In the 10 patches used for this analysis, little or no rundown of the response amplitude or changes in the rate of deactivation was observed (Fig.3C). Nonstationary variance analysis (Sigworth, 1980) was used to estimate Pomax, assuming that the patch current is generated by superimposition of openings originating from independent GlyRs. The point-by-point relationship (bin interval = 0.016 msec; filter cutoff frequency = 2 kHz) between variance (Vart) and current (It) of the decay phase was fitted by:
where i is the elementary current,It the macroscopic current, and N is the total number of available receptor channels in the patch. The relation between Vart andIt is clearly parabolic, justifying the fit procedure (Fig. 3D). The number of estimated available glyRs strongly varied from one patch to another and ranged from 19 to 160 channels. In the 10 patches tested, the maximum current was 0.91 ± 0.06 of the predicted maximal current to obtainVart = 0 (100% of the available GlyRs being opened), indicating that Pomax of GlyR at saturation is high and would be >0.9.
Desensitization of glycine-gated channels does not control the duration of inhibitory synaptic response
Biphasic decay of GlyR responses after a brief application of agonist might result from desensitization, as demonstrated for AMPA and GABAA receptor channels (Hestrin, 1992; Jones and Westbrook, 1995). In this case, a short agonist pulse is sufficient to drive the channels into a desensitized state (Hestrin, 1992; Jones and Westbrook, 1995). It was proposed that multi-liganded receptors can enter rapidly equilibrating desensitized states, which predicts a biphasic deactivation phase near saturation of the receptors (Jones and Westbrook, 1995).
To test the role of desensitization during the decay phase, long pulses (1 sec) of glycine (3 mm) were first applied to evoke chloride currents. As shown in Figure4A, this current declined slowly. In the three patches tested, the extent of desensitization at steady state ranged from 66.7 to 70% (mean = 68.1%) of the maximum current. GlyR desensitized with two exponential components (Fig. 4A). τfast ranged from 22 to 66 msec (mean = 38.7 msec; n = 3), and τslow ranged from 514 to 630 msec (mean = 569 msec;n = 3). Although these two components had time constants closely similar to those for GABAA receptors (Jones and Westbrook, 1995), the proportion of the fast component is smaller. Effectively, τfast represented 5.3–9.0% of the total current (mean = 7.3%; n = 3) only (26% for GABA) (Jones and Westbrook, 1995), whereas relative amplitude of τslow ranged from 58.6 to 62.4% (mean = 60.8%;n = 3) of the total current. These results show that 33% of the glycine-evoked current does not desensitize. Slow desensitization kinetics was not further analyzed.
Fig. 4.

Desensitization of currents evoked by step applications of glycine. A, Averaged traces of five responses to long step applications of 3 mm glycine (0.63 and 1 sec). Desensitization to prolonged applications of glycine was described by the sum of two exponential curves and a constant term for steady-state current. Desensitization time constants were τfast = 67 msec and τslow = 564 msec. Fast desensitization was 7.6% of the total current amplitude; the slow component represented 62.4% of the total current. B, Superimposed averaged traces of responses (5 each) evoked by paired pulses of 3 mm glycine (2 msec). C, Interpulse intervals were 5, 15, 30, 50, 70, 100, 135, and 170 msec. Note that paired pulses of glycine did not produce desensitization (Vh = −50 mV).
These results are consistent with the hypothesis that a short glycine pulse, mimicking synaptic glycine release, could not significantly promote a rapidly entered and exited desensitized closed state. Accordingly, desensitization would not be apparent when chloride currents were evoked by short glycine pulses. Paired-pulse experiments confirmed this hypothesis (Fig. 4B,C). When paired glycine applications (3 mm; 2 msec) were given at variable intervals (Fig. 4B), the second application did not evoke a smaller peak current than the first application. Similar results were obtained on three other patches.
Kinetic analysis performed on one glycine-gated channel
The analysis of opening and closing behaviors of a single receptor channel activated by a saturating concentration of agonist gives important information on the channel kinetics that determine the time course of postsynaptic responses. In a patch pulled from a reticular neuron (MiM1) (Metcalfe et al., 1986) located in the same rhombomere as the M-cell, we successfully recorded one glycine-gated channel activated by short applications (2 msec) of 3 mm glycine (Fig. 5A). This channel had a single conductance state of 44 pS as observed for hetero-oligomeric-like GlyRs of M-cell (Legendre, 1997).
Fig. 5.

Patch with a single GlyR activated by short step applications of 3 mm glycine. A, Example of 10 responses evoked by successive 2 msec glycine pulses (cutoff filter frequency, 3 kHz; Vh = −50 mV). Note the opening failure in epoch 5. Bottom trace: the averaged current of 26 responses has a decay that is accurately fitted by a bi-exponential curve with time constants of τfast = 5.2 msec (65%) and τslow = 27 msec. Open time (B) and closed time (C) duration histograms are shown as a function of a log intervals with the ordinate on a square root scale.
As shown in Figure 5A, GlyR opens in bursts in response to a short-step concentration of 3 mm glycine, suggesting that this channel could reopen several times before the dissociation of the agonist occurs. Only one failure was observed in 26 trials. Clusters of short- and long-lived openings were also observed at the end of the deactivation phase of outside-out currents evoked by short applications of 3 mm glycine on patches containing several GlyRs (Fig.1A).
Averaged traces revealed a deactivation phase that could be fitted with the sum of two exponential curves, with time constants closely similar to those calculated from glycine-evoked currents obtained on patches pulled from the M-cell (Fig. 5A). Single openings and closures were detected using a filter cutoff frequency of 4 kHz (six-pole Bessel filter). The open time histograms could be fitted by the sum of two exponential curves (Fig. 5B). The two mean open times were τo1 = 0.5 msec and τo2 = 2.4 msec, which is similar to that observed for M-cell GlyR (Legendre and Korn, 1994; Legendre, 1997), and their relative areas were 0.58 and 0.42, respectively. A single closed time was detected with τc1 = 0.42 msec (Fig. 5C). Longer closures were also observed (4–5 msec), but they were too infrequent to be fitted.
To determine whether long and short openings occurred randomly after a concentration jump, each sweep was reexamined. Such analysis gives information about the channel-gating mode (Colquhoun and Hawkes, 1987). The first order of occurrence of a particular opening (long or short) in response to a short step to a saturating concentration of agonist was investigated first. To minimize the number of incorrect assignments of openings as short- and long-lived events, we calculated a critical time duration (t0 = 1.2 msec) as proposed byJackson et al. (1983) (see Materials and Methods). In 23 of the 25 sweeps analyzed, the first opening had a long duration (3.56 ± 1.73 msec). When a long opening occurred first, it could be followed by one or two other long openings. These long openings were followed by clusters of short openings (2–10 events) separated by rare long events. These results suggest that the opening rate constant of the long-lived open state is considerably faster than that of the short-lived open state, or that the short-lived open state is not directly linked to the fully liganded closed state. For example, these two openings can reflect mono-liganded and di-liganded closed states, as proposed previously (Bormann, 1990; Twyman and MacDonald, 1991;Legendre and Korn, 1994). If the latter is true, open times within a burst should be correlated (Colquhoun and Hawkes, 1987).
Only one closed time was detected, and therefore it was not possible to determine whether the clusters of short-lived openings are true individual bursts of short openings. This could be attributable to the limitation of the record resolution if different classes of closures have mean durations that are similar. In the absence of any evidence of different mean closed times, correlation analysis of openings was performed using the runs test (see Materials and Methods), considering that reopenings of GlyR after a pulse of glycine represent a single burst. The runs test with a critical time of 1.2 msec (see above) gave a standard Gaussian deviate of z = −2.04. This is the limit to affirm that runs of short and long openings exist.
Rise time of glycine-evoked currents
As shown in Figure6A, the rise time of glycine-evoked currents decreased when agonist concentration was increased to reach a minimum at a glycine concentration of 3 mm. An increase in the glycine concentration to 10 mm did not change the activation phase (data not shown), which suggests that the opening and closing rate constants became the limiting factors for GlyR activation kinetics (Colquhoun and Hawkes, 1995). Because the initial onset of the response evoked by a step into a glycine concentration >3 mm was likely to be distorted by the agonist solution exchange rate (Fig. 1), the first 5% of the onset was not used for the analysis. The 5–100% rise time of the 3 mm glycine-evoked responses was well fitted by a single exponential curve, with a time constant (τon) close to 0.1 msec (0.121 ± 0.03 msec; n = 11). An increase in the glycine concentration to 10 mm gave a τon value of 0.115 msec (n = 3).
Fig. 6.

Activation time course of glycine-evoked responses. A, Averaged traces of patch currents (n = 10) showing the activation phase of the responses evoked by the application of 0.03, 0.1, 0.3, 1.0, and 3.0 mm glycine. Traces were normalized to their maximum amplitude. B, Normalized averaged current of 15 responses evoked by step applications of 0.1 mm glycine. Note that the activation phase has two components (see Results) with time constants of τon1 = 1.9 msec (71%) and τon2 = 8.4 msec. Only every 25th data point is plotted for clarity. C, First 5 msec onset of an ensemble average (n = 15 traces) after a step application of 0.1 mm glycine (•) is plotted with logistic equations for one, two, and three binding sites (see Results). Only every fifth data point is plotted for clarity. D, The sum of squared errors between the ensemble average traces and each of the three equations was calculated over the first 5 msec of the onset. For eight patches, data were better fitted with a two binding sites equation.
The analysis of the onset of the current evoked by the application of a low concentration of agonist can give information concerning the number of binding sites (Clements and Westbrook, 1991). Steps into a concentration of agonist close to the EC50 (as determined in Fig. 3B) will evoke responses for which the rising phase reflects the rate of agonist binding. The number of glycine binding sites on GlyRs was therefore determined by analyzing the onset of the responses evoked by the application of 0.1 mm glycine. Because the exchange solution was delayed from the application artifact (see above), the origin of the onset was determined from that of the current induced by the application of 3 mm glycine. A step into 0.1 mm glycine evoked responses with a clear sigmoidal onset (Fig. 6B), which is consistent with the presence of more than one binding site per GlyR (Clements and Westbrook, 1991). Although at an intermediate concentration (0.1 mm) the activation was clearly biphasic, its slow component did not significantly disturb the initial onset (Fig.6B). To determine further the number of binding sites we analyzed the degree of sigmoidicity of the onset by fitting the first 5 msec of the rising phase (bin interval = 16 μsec; filter cutoff frequency = 10 kHz) using the following equation:
where a is the maximum amplitude of the response, τact its activation time constant, and b the degree of sigmoidicity. Three models were tested with a degree of sigmoidicity of 1, 2, or 3 (Fig. 6C) by comparing SSEs (Clements and Westbrook, 1991). A total of eight glycine responses obtained on each of eight different patches were analyzed. SSEs calculated over the first 5 msec based on the degree of sigmoidicity of the curves are shown in Figure 6D. The equation with a degree of sigmoidicity of 2 always resulted in a significantly better fit (SSEs 1 site or SSEs 3 sites > SSEs 2 sites; pairedt test; p = 0.01). These results provide evidence for the presence of two glycine binding sites per GlyR, as proposed previously on spinal cord neurons (Sakmann et al., 1983;Bormann, 1990; Takahashi and Momiyama, 1991; Walstrom and Hess, 1994). Although my experimental data were well fit by this model, it did not take into account a possible allosteric interaction between the two binding sites. This cannot be excluded completely, but such a mechanism would result in a deviation from the predicted sigmoidal onset of the responses (Clements and Westbrook, 1991), which was not observed in these experiments.
As mentioned above, the responses evoked by the application of intermediate concentrations of glycine had a biphasic rising phase, and it was better fitted (Fig. 6B) with a sum of two sigmoidal functions of the form:
where a and b are the relative amplitudes of the two components and τfast and τslow are the corresponding time constants. An increase in the degree of sigmoidicity of the second component to 3 did not increase the goodness of the fit. τfast and τslow were strongly dependent on the concentration (Fig.7A), suggesting that agonist binding is the rate-limiting step for [glycine] <3 mm. The relative areas of these two components were also dependent on the concentration that was applied (Fig.7B). Slow component appeared for [glycine] <3 mm, and its relative area increased as the concentration decreased. The responses evoked by a step into 0.01 mm[glycine] had a τfast = 12.5 ± 3.75 msec and a τslow = 116.4 ± 29.4 msec, with relative areas of 55 ± 10% and 45 ± 10%, respectively (n = 6).
Fig. 7.
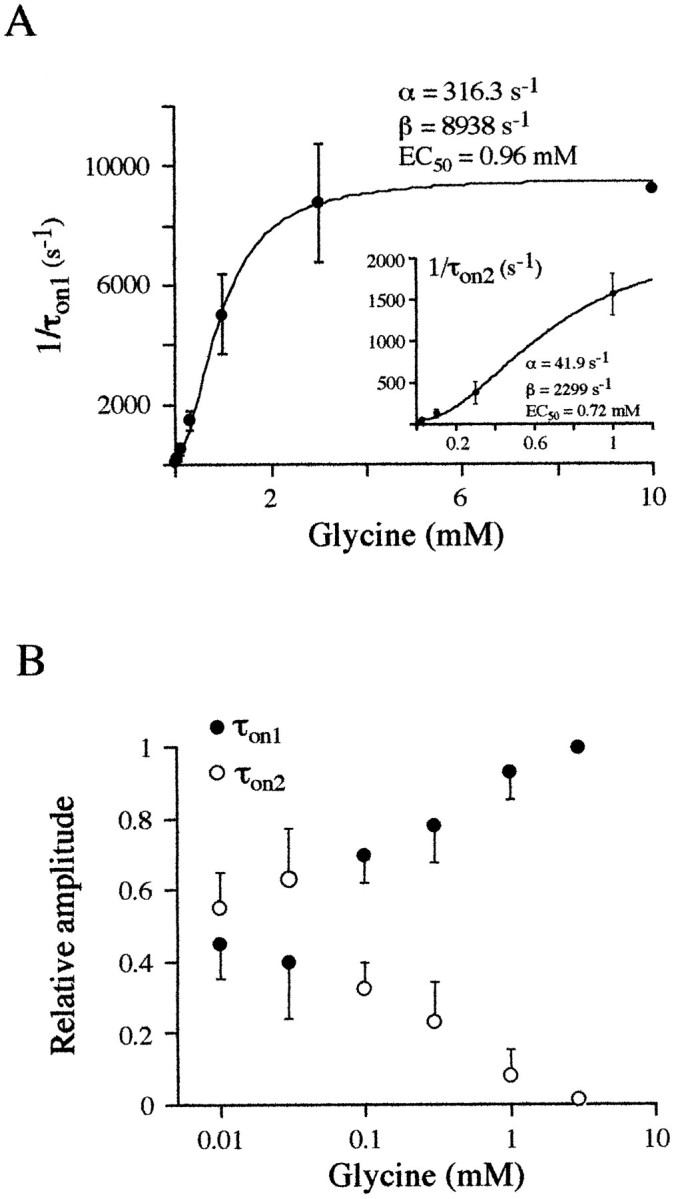
A, Plots of the current rising rates (1/τon) versus glycine concentration for the two rising phase components were fitted to the equation 1/τon = α + β([glycine]2/[glycine]2 + EC502) (see Results). Each point represents the averaged data of 3–11 experiments. α was 316.3 sec−1 and β was 8938 sec−1 for τon1, and they were 41.9 and 2299 sec−1 for τon2. Note that EC50of the two components has similar values: 0.96 and 0.72 mm, respectively. B, Plot of the relative proportions of the fast (•) and the slow (O) rising phase components versus concentration. The relative proportion of the slow component decreased when the concentration of glycine was increased. Each point is the average of 3–11 measurements.
The plot of patch-current rise rate for the fast (1/τfast) and slow component (1/τslow) versus concentration (Fig.7A) was fitted to the following equation:
where α is an approximation of the closing rate constant, β is an approximation of the opening rate constant, [glycine] is the glycine concentration, n is the number of binding sites (two, as described above), and EC50 is the concentration of glycine that gave 50% of the theoretical opening rate constant (Colquhoun and Hawkes, 1995). Plots of fast and slow rise rates gave a closing rate constant of 316 and 41.9 sec−1 and an opening rate constant of 8938 and 2299 sec−1, respectively. These two plots gave closely similar EC50 values (0.96 mm and 0.72 mm, respectively), which make it unlikely that these two activation phases resulted from the presence of binding sites with different affinities.
These results are inconsistent with the hypothesis that mono-liganded opening can participate significantly in the activation phase of GlyR responses. Mono-liganded openings should add a linear component to the onset of GlyR responses, which should begin to rise instantaneously (Clements and Westbrook, 1991), and its relative proportion should have increased when the glycine concentration applied was decreased. This was not apparent in my experiments, which confirms that at glycine concentration >0.003 mm, mono-liganded openings will not be frequently observed (Legendre and Korn, 1994).
A kinetic model for glycine-gated channels
To understand how a biphasic deactivation of patch current and mIPSCs can occur without accumulation of channels in a fast desensitized state, we tested two different models of GlyR channel gating by fitting experimental traces using chemical kinetic modeling programs (Clements and Westbrook, 1991) (also see Materials and Methods).
The better model must predict a biphasic deactivation, a biphasic rising phase of the responses evoked by the application of low glycine concentrations, and no paired-pulses desensitization. Finally it must be consistent with the fit of the amplitude versus concentration and the measured Pomax.
As a basic kinetic scheme, the model must possess two sequential binding steps (yielding A + AC and A2C) according to the shape of the rising phase of the outside-out currents (Fig. 6). The slow desensitization process was not taken into account because it is improbable that it affects the decay of responses evoked by short glycine applications. Two open states (O1 and O2) also need to be incorporated, because two mean open times were detected during single-channel recording (Fig. 5). These two mean open times are closely similar to those published previously for the postulated mono-liganded and doubly liganded open states (Legendre and Korn, 1994).
Although short openings appear to be grouped in clusters and occur mainly during the deactivation phase of outside-out currents, the runs test did not permit rejection of the hypothesis that successive openings are not correlated (see above). Two types of models can therefore be envisioned (Colquhoun and Hawkes, 1987) that can give outside-out current with a biphasic rising phase in response to the application of intermediate concentrations of glycine. The first model does not give correlation between openings within a burst, and the other one allows interconversion between the two opening modes (short and long openings).
The first model used is characterized by two open states linked independently to the doubly liganded closed state:
A model with two sequential opening states linked to the doubly liganded closed state (A2C—O1—O2) is unlikely because it will never give a response with two exponential decay components.
The second model is characterized by two open states linked to two closed states: the doubly liganded closed state (A2C) and a rapidly equilibrating closed state (A2C*) linked to A2C (Fig.8A). This model is very similar to the reluctant gating mode model proposed for the N-type calcium channel in bullfrog sympathetic neurons (Bean, 1989; Elmslie et al., 1990; Boland and Bean, 1993; Elmslie and Jones, 1994). A model with a mono-liganded opening state as proposed for the nicotinic acetylcholine receptors (Colquhoun and Sakmann, 1985) is unlikely for GlyRs because this mono-liganded opening needs to have a fast opening rate to allow long bursts of short openings during deactivation (with respect to the off rate: koff). Such an opening rate will give a linear component to the onset of GlyR responses below EC50 (Clements and Westbrook, 1991), which was not observed for [glycine] >0.003 mm.
Fig. 8.

A, A Markov model reproducing the gating properties of the glycine-activated channel of the zebrafish M-cell. This model possesses two sequential equivalent agonist binding steps, the doubly liganded closed state A2C providing access to a reluctant closed state (A2C*). These two closed states also provide access to two doubly liganded independent open states. B, C, Example of the activation and the decay phases of an averaged trace of 15 responses to 1.3 msec step applications of 3 mm glycine fitted by a kinetic model with two open states linked to the di-liganded closed state (model 1) and by the the kinetic model shown in A (model 2). Note that model 1 cannot properly fit experimental data (see Results). With model 2, a good fit was obtained with kon = 8 μm−1 · sec−1,koff = 2400 sec−1, α1 = 738 sec−1, β1 = 8938 sec−1, α 2 = 1300 sec−1, β2 = 2610 sec−1, d = 990 sec−1, and r = 180 sec−1.
The ability of the models to fit experimental data obtained by 1–2 msec steps into 3 mm glycine (including an absolute solution exchange time of 0.08 msec) was first tested. Because long openings occurred first after a concentration jump, it is likely that their opening rate constant (β1) determines the rising phase of the outside-out current. The opening rate constant (β1 = 8938 sec−1) was fixed based on the measurement obtained from the plot of the rising phase versus concentration (Fig. 7). The closing rates (α1 and α2) were determined from the measured open dwell time constants published previously for M-cell GlyRs (Legendre and Korn, 1994; Legendre, 1997). α2 was set to 1200–1400 sec−1. An opening rate of 8000–9000 sec−1predicts very short closures within a burst that cannot be clearly detected using a filter cutoff frequency of 2–4 kHz, as used for stationary single-channel analysis (Bormann, 1990; Twyman and MacDonald, 1991; Legendre and Korn, 1994) (Fig. 5). The long mean open time that occurs first after a jump in a high glycine concentration will therefore be overestimated (Colquhoun and Hawkes, 1995). As a first approximation, we first fixed the closing rate α1 to 500–700 sec−1. The dissociation rate (koff), the opening rate β2, the number of channels and in some cases α1, and for the second model, the rate (d) and the rate (r) between A2R and A2R* were free parameters. The association rate constant (kon) was first arbitrarily fixed to 5–10 106m−1 · sec−1, a value that is very similar to that described for NMDA and GABAA receptors (Clements and Westbrook, 1991; Jones and Westbrook, 1995). Whenkon was changed from 1 to 15 106m−1 · sec−1 it did not significantly modify the optimal calculated values of the free parameters for a glycine concentration of 3 mm. The fitting procedure systematically varied the free parameters until it reached the minimum SSEs between the simulated and the experimental responses over the 80 msec of the current transients (Clements and Westbrook, 1991).
The first model never gave a good fit of the experimental data (Fig.8C), even with β1 and β2 as free parameters. A significantly better fit was always obtained using the reluctant gating mode model (SSEs of model 1 > SSEs of model 2; paired t test; p = 0.001;n = 10), with averaged rate constants ofkoff = 1452.6 ± 252.7 sec−1, d = 536.5 ± 95.7 sec−1, r = 136.1 ± 65.3 sec−1, β2 = 2889 ± 595.7 sec−1 parameter (n = 10; mean ± SEM), and α1 = 680 ± 105.4 sec−1 when it was set as a free parameter (Fig. 8B,C). The association rate constant (kon) was then adjusted by fitting the reluctant gating mode model to current transients evoked by steps into 0.1 mm glycine concentration. The rate kon,koff, d, andr were set as free parameters. A good fit was obtained with averaged optimum rate constants of kon= 4.7 ± 0.5 106m−1 · sec−1,koff = 2005.2 ± 453.8 sec−1, d = 329.8 ± 124.9 sec−1, and r = 122.3 ± 37.9 sec−1 (n = 6; mean ± SEM). Calculation of the microscopic dissociation constant (Kd) gives values ranging from 0.3 to 0.4 mm, which is consistent with previously reported kinetic analysis of hetero-oligomeric-like GlyRs from spinal cord neurons (Walstrom and Hess, 1994). In this study, the microscopic Kd was found to be 0.380 mm (Walstrom and Hess, 1994).
As shown in Figure 8B,C, the reluctant gating mode model is able to account for the observed experimental data. It predicts a bi-exponential decay of current transients evoked by steps into 3 mm glycine, and it gives transients with two rising phase components when the responses were evoked by <1 mmglycine applications (Fig.9A). This model does not generate paired-pulse desensitization (Fig. 9B), but it predicts a fast desensitized component of low amplitude (Fig.9C) and gives responses with concentration-independent decay times (Fig. 9D). The theoretical response has a Pomax close to 0.9 (Fig.9E) and a concentration–response curve (Fig.9F) with an EC50 value of 0.089 mm and a Hill coefficient of 1.47, very similar to the experimental data (Fig. 3B).
Fig. 9.

A, This model predicts two components of the activation phase of responses evoked by step into <1 mm glycine. In this example the optimum fit of the averaged trace of 15 responses to long step application of 0.1 mmglycine was obtained with kon = 7 μm−1 · sec−1,koff = 3600 sec−1, α1 = 680 sec−1, β1 = 8938 sec−1, α 2 = 1300 sec−1, β2 = 3180 sec−1, d = 814 sec−1, and r = 270 sec−1. The experimental trace had two rising phase components with τon1 = 1.6 msec (64%) and τon2 = 7.5 msec (see Results for the fit procedure and the equations used). In this example, the model predicts rising time constants of τon1= 1.55 msec (62.5%) and τon2 = 7.2 msec.B, Simulated paired-pulse responses generated by the (Figure legend continued) kinetic model. Rate parameters used werekon = 5 μm−1 · sec−1,koff = 1500 sec−1, α1 = 680 sec−1, β1 = 8938 sec−1, α 2 = 1300 sec−1, β2 = 3180 sec−1, d = 540 sec−1, and r = 140 sec−1). Note that desensitization does not occur.C, This model predicts a small desensitization component during steady-state application of glycine. D, It also generates responses with a concentration-independent decay time.E, Maximum open probability of simulated responses ([glycine] = 3 mm; N = 44,ichannel = 2.2 pA). The variance–amplitude plot was computed for 15 generated transient currents. The fit of this plot gave a ichannel of 1.72 pA, anN of 49, and a Pomaxof 0.93. F, Concentration–response curve of simulated glycine-evoked currents. Fit of the theoretical data points using a single binding isotherm gave an EC50 value (0.089 mm) and a Hill coefficient (1.47) in good agreement with the experimental results.
Using simulated pulses of 1 msec (solution exchange time constant = 0.08 msec) of 3 mm glycine, I examined the consequences of varying the dissociation rate (koff) and the on (d) and off (r) rates linking the doubly liganded closed states (A2C and A2C*). The consequences of varying d and r rate constants, the d/r ratio being constant, was also analyzed.
Glycine current decay can be shaped by a precise balance between these rates. A reduction in the unbinding rate constant from 18,000 to 500 sec−1 increased both decay times and increased the relative amplitude of the slow component (Fig.10A). This is consistent with the idea that slowing the unbinding rate will promote reopening of the channel and will increase the probability of falling into the second opening mode via the closed state A2C*. Increasing the relaxation rate d from 140 to 2040 sec−1increases the probability for the channel to open into the second mode (A2C*—O2), which results in an increase of the slow time constant and an increase of its relative amplitude (Fig. 10B). In this case, the fast decay time constant decreases to a smaller extent, which reflects a decreased probability for the channel to reopen directly from the doubly liganded closed state.
Fig. 10.

The model parameters were used (see Fig.9B) to examine the effect of varying the unbinding ratekoff, the rate d and the rate r on the deactivation phase, and the amplitude of glycine-evoked responses. A, Reducingkoff dramatically decreased the response duration. B, C, Reducing the rate constant d or r primarily affects the slow decay phase component. D, Increasing rates constantd and r, thed/r ratio being constant, induces a progressive lost of the biphasic shape of the deactivation phase. Varying these binding rates, however, had little or no effect on the response amplitudes.
The reluctant gating mode model also predicts that increasing the dwell time (r) in A2C* will promote bursts of openings from O2 and prolong the slow decay component. As shown in Figure10C, varying the recovery rate r from 20 to 340 sec−1 gives little variation of the fast decay time, whereas the relative amplitude of the slow component is increased with its decay time being dramatically decreased. The decay phase becomes mono-exponential at r ≥ 340 sec−1 with a decay time constant oftoff = 7.9 msec. In this case, the burst of openings occurring from A2O and A2O* will have similar durations. Although rate constants d and r can vary from patch to patch (1- to 10-fold), their ratio remained relatively more constant and ranged from 1.5 to 5.5 (3.74 ± 1.35 SD;n = 16). An increase in d (from 135 to 2160 sec−1) and r (from 35 to 560 sec−1) with d/r constant decreases the two decay times and increases the relative area of the slow component (Fig. 10D). An increase in these rates to d = 2160 sec−1 andr = 560 sec−1 results in a mono-exponential decay with time constant of τoff = 11.3 msec. This is consistent with a decrease in the opening burst durations occurring from O1 and O2 caused by the increase of the reverse rate constants d and r from their respective closed states A2C and A2C*.
All of these rate constants will tightly control the shape and the duration of the glycine-evoked transient, but the reluctant gating mode model also predicts that variations of the rate constantsd and r will not strongly modify the amplitude of the response evoked by a saturating concentration of agonist (Fig. 10). If so, then fluctuation of d orr values (or both) will have little effect on mIPSCs amplitude if postsynaptic GlyRs are saturated after vesicle release.
Estimation of the peak concentration of glycine released at inhibitory synapses
A rough estimate of the peak concentration of synaptically released glycine can be obtained by comparing the rising phase of mIPSCs with that of patch currents evoked by the application of different agonist concentrations (Jones and Westbrook, 1995). Amplitude distributions of mIPSCs recorded on the M-cell are complex, being skewed or even multi-modal (Legendre and Korn, 1994). Although such an amplitude variation was found to be attributable partly to the presence of GlyR subtypes (Legendre, 1997), it could also reflect variations in the concentration of neurotransmitters that were released (Frerking et al., 1995). Inhibitory glycinergic synapses are densely located on the M-cell soma of the 52-hr-old zebrafish larva (Triller et al., 1997). At this age dendrites are not fully developed (Kimmel et al., 1981), and the time course of the mIPSCs is not affected by cable filtering (Legendre and Korn, 1994). To compare activation phases of mIPSCs and of glycine-evoked outside-out currents, we calculated the 20–80% rise time of 25 averaged synaptic responses (filter cutoff frequency = 10 kHz; bin width = 42 μsec) of small (50–100 pA) and large (250–400 pA) amplitudes (n = 10 cells). As shown in Figure 11A, 20–80% rise time of small and large mIPSCs was not significantly different (unpaired t test; p = 0.01); 20–80% rise time of small events had an average value of 0.305 ± 0.045 msec (n = 10), whereas it was close to 0.3 msec for larger mIPSCs (0.298 ± 0.047 msec; n = 10). These results suggest that activation kinetics of mIPSCs were independent from their amplitude variations.
Fig. 11.

Estimation of the peak concentration of glycine released at inhibitory synapses. A, Example of the rising phase of normalized averaged traces of 25 mIPSCs of small (50–150 pA) and large (250–450 pA) amplitudes. Same data as shown in Figure 2B,C. Note that the two rising phases are fast (20–80% rise time = 0.26 msec) and nearly identical, being consistent with the fact that mIPSCs amplitude variations are independent of the peak concentration of glycine released (filter cutoff frequency = 10 kHz). B, Theoretical normalized activation phases of transient currents evoked by 1 msec step applications of various concentrations of glycine (3, 1, 0.3, 0.1, and 0.03 mm). Each trace was obtained according to the averaged rise rates shown in Figure 8. C, The comparison of the 20–80% rise times of small and large mIPSCs (n = 10 cells) to the 20–80% rise times of patch responses evoked by a short application of 1 and 3 mmglycine (n = 10) suggests that the peak concentration of glycine released at M-cell inhibitory synapses is between 1 and 3 mm.
To determine the concentration of glycine released at the peak of the synaptic response, 20–80% rise time of outside-out currents evoked by 0.3–3.0 mm glycine applications was compared with the rise time of mIPSCs. Outside-out responses were normalized to the amplitude of the current measured 1 msec after the initial onset (Fig.11B), assuming that the time course of agonist in the synaptic cleft is close to 1 msec (Clements et al., 1992). In these conditions the 20–80% rise time of the outside-out currents increased when the concentration of applied glycine was decreased, and it remained constant for [glycine] <0.1 mm. Responses evoked by ≥1 mm glycine applications reached a steady-state current in <1 msec. The responses evoked by 3 mm glycine had a 20–80% rise time = 0.195 ± 0.024 msec (n = 10), whereas it was twice as long (0.392 ± 0.061 msec; n = 10) for responses evoked by the application of 1 mm glycine. This was in the range of the mIPSCs 20–80% rise time (Fig. 11C), indicating that the peak concentration of glycine released after an exocytosis is likely to be higher than 1 mm.
DISCUSSION
In the present study we have shown that mIPSCs recorded in the zebrafish M-cell are likely to be evoked by a brief (∼1 msec) glycine transient that can saturate postsynaptic receptors. Short step (1–2 msec) concentrations of glycine are sufficient to produce currents in outside-out patches with a deactivation phase nearly identical to mIPSC decay. This implies that the rate of clearance of neurotransmitters is fast at inhibitory synapses and that it cannot control the mIPSC time course. This is consistent with previous studies showing that clearance of neurotransmitters from the synaptic cleft lasts <2 msec at central synapses (for review, see Clements, 1996). This can be different, however, for evoked synaptic responses, as shown for some glutamatergic synapses (Diamond and Jahr, 1995). In these hippocampal cultured neurons, the time course of evoked AMPA receptor EPSCs was determined primarily by the asynchronous release of vesicles.
Although decay times of glycine-evoked responses are biphasic, this was attributable to neither the consequence of a fast desensitization process nor the presence of different postsynaptic GlyRs with low or high affinities. Result analysis performed in this study suggests another mechanism involving a reluctant gating mode, as first proposed for the calcium channels of bullfrog dorsal root ganglion neurons (Bean, 1989).
Outside-out current and mIPSCs have similar time course
The interpretation of my results was based on the hypothesis that synaptic GlyRs behave in the same way as GlyRs recorded in outside-out patches. This is the case, because both outside-out currents and mIPSCs had very similar deactivation phases. The analysis was focused on hetero-oligomeric-like GlyRs characterized by a single conductance state of 40–46 pS (Legendre, 1977); however, previous analysis had shown the presence of two types of GlyRs on the M-cell. These two GlyRs represent homo-oligomeric-like α1 and hetero-oligomeric-like α1/β subtypes according to their main conductance states and their pharmacological properties (Legendre, 1997). Both GlyR subtypes are synaptically activated, and large mIPSCs were proposed to be caused mainly by the synaptic activation of homo-oligomeric-like α1 GlyRs (Legendre, 1997). In my experiments, small and large synaptic events had clearly identical deactivation time courses. This is consistent with previous observations (Legendre and Korn, 1994, 1995). I did not perform a systematic kinetic analysis of homo-oligomeric-like GlyRs, mainly because of their rarity, but in two patches with GlyRs characterized by multiple conductance levels, a short step application of 3 mm glycine evoked outside-out responses with a biphasic decay with time constants of 3–5 msec and 25–40 msec, respectively (not shown). These results support the hypothesis that the two GlyR subtypes are kinetically similar in the zebrafish M-cell, which makes it unlikely that β subunits can control GlyR deactivation kinetics. This is consistent with previous work suggesting that a decrease in glycinergic mIPSC duration during brain maturation (Takahashi et al., 1992; Krupp et al., 1994) can result mainly from a switch between α2 and α1 subunits (Becker et al., 1988).
A Markov model with a reluctant gating mode
The experimental data described in this study support the hypothesis that desensitization has little or no effect on glycine inhibitory neurotransmission and that a reluctant gating mode can better explain the biphasic decay of mIPSCs. Desensitization of zebrafish GlyRs is mainly slow. Although we have not yet performed a full analysis of this desensitization process, M-cell GlyRs appeared to behave in the same manner as mammalian GlyRs. Homo-oligomeric or hetero-oligomeric GlyRs of mammals have a slow desensitization with a slow recovery (Akaike and Kaneda, 1989; Walstrom and Hess, 1994; Delon and Legendre, 1995), which suggests that the time course and the amplitude of glycinergic mIPSCs will be little affected by desensitization. The lack of paired-pulse desensitization confirms this point.
As a consequence, the inhibition evoked by glycinergic synapses will remain highly efficient during repetitive firing, provided that the frequency of presynaptic action potentials remains low enough that slow GlyR desensitization does not occur. Moreover, the prolonged deactivation phase of glycinergic events should act to reinforce the efficacy of inhibition. This contrast with other receptor-operated channels such as NMDA, AMPA, or GABAA receptors, which show fast desensitization processes (for review, see Jones and Westbrook, 1996). Fast desensitization can control both amplitude and duration of postsynaptic responses (Jones and Westbrook, 1996) depending on the firing pattern of the presynaptic neuron.
The kinetic model proposed here that best predicts the experimental data is similar to the Markov model proposed to explain the voltage-dependent removal of somatostatin, noradrenaline (Bean, 1989), and LHRH- or GTP-γ-S-evoked inhibition of bullfrog N-type calcium channel (Elmslie et al., 1990; Boland and Bean, 1993; Elmslie and Jones, 1994). This model assumed that these compounds shift or stabilize calcium channels from a willing gating mode into a reluctant gating mode, where openings require stronger depolarization. This explain the two components of the activation phase of the channel in the presence of LHRH. The slow component reflects the interconversion between the two gating modes (Elmslie et al., 1990), and this slow phase becomes progressively faster, with increasing depolarization (Boland and Bean, 1993). A biphasic activation phase with a slow component was also observed for outside-out currents evoked by the application of [glycine] ≤1 mm. Moreover, both the relative amplitude and the time constant decreased with decreasing glycine concentration (Fig. 7). This slow component can therefore reflect interconversion between the two opening modes of GlyR. This is predicted by the GlyR kinetic model proposed in my study.
Interconversion between the two gating modes is also voltage-dependent for the bullfrog N-type calcium channel (Boland and Bean, 1993). This might also be the case for GlyRs because the decay time of glycinergic mIPSCs is voltage dependent (Legendre and Korn, 1995). An increase in the rate constant from the doubly liganded closed state to the reluctant closed state can greatly increase mIPSCs duration with little effect on their maximum amplitude, but changes in the time course of the deactivation phase could also result from a change in the closed rate constant and the dissociation rate constant, because during outside-out recordings of hetero-oligomeric-like GlyRs, opening burst durations are also voltage dependent (Legendre and Korn, 1995). The possibility that interconversion can be modulated by voltage is under investigation.
Are postsynaptic receptors saturated by vesicle released at M-cell inhibitory synapses?
The large variation in mIPSC amplitude observed in the zebrafish M-cell appears to be independent of the peak concentration of agonist released at glycinergic synapses. However, the presence of several active zones per synaptic bouton can give a large mIPSC amplitude fluctuation attributable to multivesicular release, as proposed for the lateral M-cell dendrite of the goldfish (Korn et al., 1993; Sur et al., 1995; but see Frerking et al., 1997). This cannot be the case in the zebrafish hindbrain, because the inhibitory synaptic terminals apposed to the M-cell have a single restricted active zone (Triller et al., 1997).
Such a functional variability is therefore more likely to be attributable to postsynaptic factors. It was demonstrated previously that a functional heterogeneity of postsynaptic GlyRs can only partly account for the broad amplitude distribution of mIPSCs (Legendre, 1997). Other postsynaptic factors can be envisioned as a variation in the number of postsynaptic receptors from one synapse to another (Nusser et al., 1997). Variability of the matrix size of postsynaptic GlyRs was demonstrated previously on the adult teleost M-cell (Triller et al., 1990) and in the mammalian spinal cord motoneurons and Renshaw cells (Alvarez et al., 1997).
The estimated peak concentration of neurotransmitter at glycine synapse was estimated to be higher than 1 mm. This is consistent with previous studies performed on central GABAergic and glutamatergic synapses (for review, see Clements, 1996). This peak concentration would suggest that postsynaptic GlyRs at all inhibitory synapses are saturated by release of a single vesicle. However, we cannot exclude the possibility that for few synapses with a large receptor matrix, all GlyRs are not occupied after the release of a single vesicle, as shown recently for GABAergic synapses of cerebellar stellate cells (Nusser et al., 1997). According to the mIPSC amplitude fluctuation, the number of activated GlyRs per mIPSCs can range from 15 to 150 (Legendre, 1997), whereas the critical number of GABAA receptors below which all of these receptors are occupied is ∼80 on stellate cells (Nusser et al., 1997). Nevertheless, the major factor underlying amplitude fluctuations of GABAergic mIPSCs in these cells is the variation in the number of postsynaptic receptors between synapses (Nusser et al., 1997).
At M-cell glycinergic synapses, amplitude fluctuations of mIPSCs will therefore originate mainly in several postsynaptic characteristics, including the receptor matrix size, the proportion of different receptor subtypes at a synapse, and their gating properties. A somato-dendritic gradient of this postsynaptic heterogeneity can also be envisioned, because cluster size of GlyRs varies with somato-dendritic location on the M-cell (Triller et al., 1990). This is equally the case for mammalian spinal cord motoneurons and Renshaw cells (Alvarez et al., 1997). The efficacy of inhibitory inputs can therefore be different depending on the location of glycinergic synaptic boutons, which will allow a regional differential control in the integration of the information.
Footnotes
This work was supported by Institut National de la Santé et de la Recherche Médicale, Centre National de la Recherche Scientifique, and Fondation pour la Recherche Medicale. I thank Dr. Pierre Drapeau and Dr. Richard Miles for valuable help and discussions.
Correspondence should be addressed to Dr. P. Legendre, Institut des Neurosciences, Bat B. 6eme étage, boite 8, UniversitéPierre et Marie Curie, 7 Quai Saint Bernard, 75252 Paris Cedex 05, France.
REFERENCES
- 1.Akaike N, Kaneda M. Glycine-gated chloride current in acutely isolated rat hypothalamic neurons. J Neurophysiol. 1989;62:1400–1409. doi: 10.1152/jn.1989.62.6.1400. [DOI] [PubMed] [Google Scholar]
- 2.Alvarez FJ, Dewey DE, Harrington DA, Fyffe REW. Cell-type specific organization of glycine receptor clusters in the mammalian spinal cord. J Comp Neurol. 1997;379:150–170. [PubMed] [Google Scholar]
- 3.Ankri N, Legendre P, Faber DS, Korn H. Automatic detection of spontaneous synaptic responses in central neurons. J Neurosci Methods. 1994;52:87–100. doi: 10.1016/0165-0270(94)90060-4. [DOI] [PubMed] [Google Scholar]
- 4.Bean BP. Neurotransmitter inhibition of neuronal calcium currents by changes in channel voltage dependence. Nature. 1989;340:153–156. doi: 10.1038/340153a0. [DOI] [PubMed] [Google Scholar]
- 5.Becker CM, Hoch W, Betz H. Glycine receptor heterogeneity in rat spinal cord during postnatal development. EMBO J. 1988;7:3717–3726. doi: 10.1002/j.1460-2075.1988.tb03255.x. [DOI] [PMC free article] [PubMed] [Google Scholar]
- 6.Bekkers JM, Richerson GB, Stevens CF. Origin of variability in quantal size in cultured hippocampal neurons and hippocampal slices. Proc Natl Acad Sci USA. 1990;87:5359–5362. doi: 10.1073/pnas.87.14.5359. [DOI] [PMC free article] [PubMed] [Google Scholar]
- 7.Boland LM, Bean P. Modulation of N-type calcium channels in bullfrog sympathetic neurons by luteinizing hormone-releasing hormone: kinetics and voltage dependence. J Neurosci. 1993;13:516–533. doi: 10.1523/JNEUROSCI.13-02-00516.1993. [DOI] [PMC free article] [PubMed] [Google Scholar]
- 8.Bormann J. Patch clamp studies of glycine-gated chloride channels. In: Ottersen OP, Storm-Mathisen J, editors. Glycine neurotransmission. Wiley; New York: 1990. pp. 111–137. [Google Scholar]
- 9.Clements JD. Transmitter timecourse in the synaptic cleft: its role in central synaptic function. Trends Neurosci. 1996;19:163–171. doi: 10.1016/s0166-2236(96)10024-2. [DOI] [PubMed] [Google Scholar]
- 10.Clements JD, Westbrook GL. Activation kinetics reveal the number of glutamate and glycine binding sites on the N-methyl-d-aspartate receptor. Neuron. 1991;7:605–613. doi: 10.1016/0896-6273(91)90373-8. [DOI] [PubMed] [Google Scholar]
- 11.Clements JD, Lester RA, Tong G, Jahr CE, Westbrook GL. The time course of glutamate in the synaptic cleft. Science. 1992;258:1498–1501. doi: 10.1126/science.1359647. [DOI] [PubMed] [Google Scholar]
- 12.Colquhoun D. The relation between classical and cooperative models for drug action. In: Rang HP, editor. Drug receptors. MacMillan; London: 1973. pp. 149–182. [Google Scholar]
- 13.Colquhoun D, Hawkes AG. A note on correlations in single ion channels records. Proc R Soc Lond B Biol Sci. 1987;230:15–52. doi: 10.1098/rspb.1987.0008. [DOI] [PubMed] [Google Scholar]
- 14.Colquhoun D, Hawkes AG. The principles of the stochastic interpretation of ion-channel mechanisms. In: Sakmann B, Neher E, editors. Single-channel recording. Plenum; New York: 1995. pp. 397–482. [Google Scholar]
- 15.Colquhoun D, Sakmann B. Fast events in single-channel currents activated by acetylcholine and its analogues at the frog muscle end-plate. J Physiol (Lond) 1985;369:501–557. doi: 10.1113/jphysiol.1985.sp015912. [DOI] [PMC free article] [PubMed] [Google Scholar]
- 16.Curtis DR, Johnston GAR. Amino acid transmitters in the mammalian central nervous system. Ergeb Physiol Biol Chem Exp Pharmakol. 1974;69:97–188. doi: 10.1007/3-540-06498-2_3. [DOI] [PubMed] [Google Scholar]
- 17.Delon J, Legendre P. Effect of nocodazole and taxol on glycine evoked currents on rat spinal cord neurones in culture. NeuroReport. 1995;6:1932–1936. doi: 10.1097/00001756-199510020-00026. [DOI] [PubMed] [Google Scholar]
- 18.Diamond JS, John CE. Asynchronous release of synaptic vesicles determines the time course of the AMPA receptor-mediated EPSC. Neuron. 1995;15:1097–1107. doi: 10.1016/0896-6273(95)90098-5. [DOI] [PubMed] [Google Scholar]
- 19.Edwards FA, Konnerth A, Sakmann B. Quantal analysis of inhibitory synaptic transmission in the dentate gyrus of rat hippocampal slices: a patch clamp study. J Physiol (Lond) 1990;430:213–249. doi: 10.1113/jphysiol.1990.sp018289. [DOI] [PMC free article] [PubMed] [Google Scholar]
- 20.Elmslie KS, Jones S. Concentration dependence of neurotransmitter effects on calcium currents kinetics in frog sympathetic neurones. J Physiol (Lond) 1994;481:35–46. doi: 10.1113/jphysiol.1994.sp020417. [DOI] [PMC free article] [PubMed] [Google Scholar]
- 21.Elmslie KS, Zhou W, Jones S. LHRH and GTP-gamma-S modify calcium current activation in bullfrog sympathetic neurons. Neuron. 1990;5:75–80. doi: 10.1016/0896-6273(90)90035-e. [DOI] [PubMed] [Google Scholar]
- 22.Faber DS, Young WS, Legendre P, Korn H. Intrinsic quantal variability due to stochastic properties of receptor-transmitter interactions. Science. 1992;258:1494–1498. doi: 10.1126/science.1279813. [DOI] [PubMed] [Google Scholar]
- 23.Franke C, Hatt H, Dudel J. Liquid filament switch for ultra-fast exchanges of solutions at excised patches of synaptic membrane of crayfish muscle. Neurosci Lett. 1987;77:199–204. doi: 10.1016/0304-3940(87)90586-6. [DOI] [PubMed] [Google Scholar]
- 24.Frerking M, Wilson M. Saturation of postsynaptic receptors at central synapses? Curr Opin Neurobiol. 1996;6:395–403. doi: 10.1016/s0959-4388(96)80125-5. [DOI] [PubMed] [Google Scholar]
- 25.Frerking M, Borges S, Wilson M. Variation in GABA mini amplitude is the consequence of variation in transmitter concentration. Neuron. 1995;15:885–895. doi: 10.1016/0896-6273(95)90179-5. [DOI] [PubMed] [Google Scholar]
- 26.Frerking M, Borges S, Wilson M. Are some minis multiquantal? J Neurophysiol. 1997;78:1293–1304. doi: 10.1152/jn.1997.78.3.1293. [DOI] [PubMed] [Google Scholar]
- 27.Gähwiler BH, Brown DA. GABAB-receptor-activated K+ current in voltage-clamped CA3 pyramidal cells in hippocampal cultures. Proc Natl Acad Sci USA. 1985;82:1558–1562. doi: 10.1073/pnas.82.5.1558. [DOI] [PMC free article] [PubMed] [Google Scholar]
- 28.Hamill OP, Marty A, Neher E, Sakmann B, Sigworth FJ. Improved patch clamp techniques for high-resolution current recordings from cells and cell free patches. Pflügers Arch. 1981;391:85–100. doi: 10.1007/BF00656997. [DOI] [PubMed] [Google Scholar]
- 29.Hestrin S. Activation and desensitisation of glutamate-activated channels mediating fast excitatory synaptic currents in the visual cortex. Neuron. 1992;9:991–999. doi: 10.1016/0896-6273(92)90250-h. [DOI] [PubMed] [Google Scholar]
- 30.Jackson MB, Wong BS, Morris CE, Lecar H, Christian CN. Successive openings of the same acetylcholine receptor channel are correlated in open time. Biophys J. 1983;42:109–114. doi: 10.1016/S0006-3495(83)84375-6. [DOI] [PMC free article] [PubMed] [Google Scholar]
- 31.Jones MV, Westbrook GL. Desensitized states prolong GABAA channel responses to brief agonist pulses. Neuron. 1995;15:181–191. doi: 10.1016/0896-6273(95)90075-6. [DOI] [PubMed] [Google Scholar]
- 32.Jones MV, Westbrook GL. The impact of receptor desensitization on fast synaptic transmission. Trends Neurosci. 1996;19:96–101. doi: 10.1016/s0166-2236(96)80037-3. [DOI] [PubMed] [Google Scholar]
- 33.Korn H, Bausela F, Charpier S, Faber DS. Synaptic noise and multiquantal release at dendritic synapses. J Neurophysiol. 1993;70:1249–1254. doi: 10.1152/jn.1993.70.3.1249. [DOI] [PubMed] [Google Scholar]
- 34.Kimmel CB, Sessions SK, Kimmel RJ. Morphogenesis and synaptogenesis of the zebrafish Mauthner neuron. J Comp Neurol. 1981;198:101–120. doi: 10.1002/cne.901980110. [DOI] [PubMed] [Google Scholar]
- 35.Krupp J, Larmet Y, Feltz P. Postnatal change of glycinergic IPSC decay in sympathetic preganglionic neurons. NeuroReport. 1994;5:2437–2440. doi: 10.1097/00001756-199412000-00008. [DOI] [PubMed] [Google Scholar]
- 36.Legendre P. Pharmacological evidences for two types of postsynaptic glycinergic receptors on 52 hr old zebrafish larvae. J Neurophysiol. 1997;77:2400–2415. doi: 10.1152/jn.1997.77.5.2400. [DOI] [PubMed] [Google Scholar]
- 37.Legendre P, Korn H. Glycinergic inhibitory synaptic currents and related receptor-channel in the Zebrafish brain. Eur J Neurosci. 1994;6:1544–1557. doi: 10.1111/j.1460-9568.1994.tb00545.x. [DOI] [PubMed] [Google Scholar]
- 38.Legendre P, Korn H. Voltage-dependence of conductance changes evoked by glycine release in the zebrafish brain. J Neurophysiol. 1995;6:2404–2412. doi: 10.1152/jn.1995.73.6.2404. [DOI] [PubMed] [Google Scholar]
- 39.Lester RA, Jahr CE. NMDA channel behavior depends on agonist affinity. J Neurosci. 1992;12:635–643. doi: 10.1523/JNEUROSCI.12-02-00635.1992. [DOI] [PMC free article] [PubMed] [Google Scholar]
- 40.Lester RA, Clements JD, Westbrook GL, Jahr CE. Channel kinetics determine the time course of NMDA receptor-mediated synaptic currents. Nature. 1990;346:565–567. doi: 10.1038/346565a0. [DOI] [PubMed] [Google Scholar]
- 41.Maconochie DJ, Knight DE. A method for making solution changes in the submillisecond range at the tip of a patch pipette. Pflügers Arch. 1989;414:589–596. doi: 10.1007/BF00580996. [DOI] [PubMed] [Google Scholar]
- 42.Manabe T, Renner P, Nicoll RA. Postsynaptic contribution to long-term potentiation revealed by the analysis of miniature synaptic currents. Nature. 1992;355:50–55. doi: 10.1038/355050a0. [DOI] [PubMed] [Google Scholar]
- 43.Metcalfe WK, Mendelson B, Kimmel CB. Segmental homologies among reticulospinal neurons in the hindbrain of the zebrafish larva. J Comp Neurol. 1986;251:147–159. doi: 10.1002/cne.902510202. [DOI] [PubMed] [Google Scholar]
- 44.Nusser Z, Cull-Candy S, Farrant M. Differences in synaptic GABA(A) receptor number underlie variation in GABA mini amplitude. Neuron. 1997;19:697–709. doi: 10.1016/s0896-6273(00)80382-7. [DOI] [PubMed] [Google Scholar]
- 45.Sakmann B, Hamill OP, Bormann J. Patch-clamp measurements of elementary chloride currents activated by putative inhibitory transmitters GABA and glycine in mammalian spinal neurons. J Neural Trans [Suppl] 1983;18:83–95. [PubMed] [Google Scholar]
- 46.Sigworth FJ. The variance of sodium current fluctuations at the node of Ranvier. J Physiol (Lond) 1980;307:97–129. doi: 10.1113/jphysiol.1980.sp013426. [DOI] [PMC free article] [PubMed] [Google Scholar]
- 47.Sigworth FJ, Sine SM. Data transformations for improved display and fitting of single channel dwell time histograms. Biophys J. 1987;52:1047–1054. doi: 10.1016/S0006-3495(87)83298-8. [DOI] [PMC free article] [PubMed] [Google Scholar]
- 48.Silver RA, Traynelis SF, Cull-Candy SG. Rapid-time-course miniature and evoked excitatory currents at cerebellar synapses in situ. Nature. 1992;355:163–166. doi: 10.1038/355163a0. [DOI] [PubMed] [Google Scholar]
- 49.Sur C, Triller A, Korn H. Morphology of the release site of inhibitory synapses on the soma and dendrite of an identified neuron. J Comp Neurol. 1995;351:247–260. doi: 10.1002/cne.903510205. [DOI] [PubMed] [Google Scholar]
- 50.Takahashi T, Momiyama A. Single-channel currents underlying glycinergic glycinergic inhibitory postsynaptic responses in spinal neurons. Neuron. 1991;7:965–969. doi: 10.1016/0896-6273(91)90341-v. [DOI] [PubMed] [Google Scholar]
- 51.Takahashi T, Momiyama A, Hirai K, Hishinuma F, Akagi H. Functional correlation of fetal and adult forms of glycine receptors with developmental changes in inhibitory synaptic receptor channels. Neuron. 1992;9:1155–1161. doi: 10.1016/0896-6273(92)90073-m. [DOI] [PubMed] [Google Scholar]
- 52.Tang CH, Margulis M, Shi QI, Fielding A. Saturation of postsynaptic glutamate receptors after quantal release of transmitter. Neuron. 1994;13:1385–1393. doi: 10.1016/0896-6273(94)90423-5. [DOI] [PubMed] [Google Scholar]
- 53.Triller A, Seitanidou T, Frankson O, Korn H. Size and shape of glycine receptor clusters in a central neuron exhibit a somato-dendritic gradient. New Biol. 1990;2:637–641. [PubMed] [Google Scholar]
- 54.Triller A, Rostin P, Korn H, Legendre P. Morphological-functional evidence for mature synaptic contacts on the Mauthner cell of the 52 hr old zebrafish larvae. Neuroscience. 1997;80:133–145. doi: 10.1016/s0306-4522(97)00092-4. [DOI] [PubMed] [Google Scholar]
- 55.Twyman RE, MacDonald RL. Kinetic properties of the glycine receptor main- and sub-conductance states of mouse spinal cord neurones in culture. J Physiol (Lond) 1991;435:303–331. doi: 10.1113/jphysiol.1991.sp018512. [DOI] [PMC free article] [PubMed] [Google Scholar]
- 56.Walstrom KM, Hess GP. Mechanism for the channel-opening reaction of strychnine-sensitive glycine receptors on cultured embryonic mouse spinal cord cells. Biochemistry. 1994;33:7718–7730. doi: 10.1021/bi00190a027. [DOI] [PubMed] [Google Scholar]
- 57.Zhang ZW, Berg DK. Patch-clamp analysis of glycine-induced currents in chick ciliary ganglion neurons. J Physiol (Lond) 1995;487:395–40. doi: 10.1113/jphysiol.1995.sp020888. [DOI] [PMC free article] [PubMed] [Google Scholar]