

Abstract
Alzheimer’s disease (AD) is a major dementing illness characterized by regional concentrations of senile plaques, neurofibrillary tangles, and extensive neuronal cell death. Although cell and synaptic loss is most directly linked to the severity of symptoms, the mechanisms leading to the neuronal death remain unclear. Based on evidence linking neuronal death during development to unexpected reappearance of cell cycle events, we investigated the brains of 12 neuropathologically verified cases of Alzheimer’s disease and eight age-matched, disease-free controls for the presence of cell cycle proteins. Aberrant expression of cyclin D, cdk4, proliferating cell nuclear antigen, and cyclin B1 were identified in the hippocampus, subiculum, locus coeruleus, and dorsal raphe nuclei, but not inferotemporal cortex or cerebellum of AD cases. With only one exception, control subjects showed no significant expression of cell cycle markers in any of the six regions. We propose that disregulation of various components of the cell cycle is a significant contributor to regionally specific neuronal death in AD.
Keywords: Alzheimer’s disease, cell death, cyclin D, cyclin B1, PCNA, cdk4
Alzheimer’s disease (AD) is the major cause of dementia in older adults. The prevalence of the disease increases with age, from ∼1% at age 60 to nearly 50% by age 85 (Evans et al., 1989). Clinically, AD is characterized by a progressive decline in cognitive abilities accompanied by behavioral abnormalities. Average survival after disease onset is ∼8 years (Jost and Grossberg, 1995). In neuropathological examinations, the most common abnormalities are unusually high densities of senile plaques and neurofibrillary tangles predominantly in hippocampus and entorhinal cortex, with lower densities elsewhere (Alzheimer, 1907; Blessed et al., 1968). In addition to the plaques and tangles, there is evidence of significant neuronal cell death, also with distinct regional variability. In some regions, such as hippocampus, the cell loss occurs in conjunction with high densities of plaques and tangles. In other regions, neuronal death is found but the density of plaques and tangles is low. Examples of this latter situation are the basal forebrain (Whitehouse et al., 1982) and in nuclei of the brainstem such as the dorsal raphe and locus coeruleus (Bondareff et al., 1982; Zweig et al., 1988).
The biological causes of neuronal cell death have been the object of intense study in recent years. One intriguing finding has been evidence linking the loss of cell cycle control with the occurrence of programmed neuronal cell death during development. The first evidence for this linkage arose from studies in transgenic mice in which cell division was artificially induced in postmitotic neurons. (al-Ubaidi et al., 1992; Clarke et al., 1992; Feddersen et al., 1992; Jacks et al., 1992; Lee et al., 1992, 1994). Substantial neuronal loss was observed in each instance, and the interpretation of these findings, as articulated by Lee et al. (1992), is that once a neuron is born it has made a commitment to maturation that includes a permanent cessation of cell division. If for any reason it is forced to reenter the cell cycle after this commitment, it dies. More recently, our laboratory has extended this observation with evidence that naturally occurring (target-related) neuronal cell death involves a reexpression of several cell cycle markers, including DNA synthesis (Herrup and Busser, 1995). Other authors have reached similar conclusions based on both in vivo and in vitro studies (Heintz, 1993; Freeman et al., 1994). The current study is an exploration of whether a similar linkage between cell cycle events and cell death might exist in the adult brain as well as in developing systems. There are virtually no known CNS cancers that are neuronal in origin, a finding that is a direct prediction of the cell cycle–cell death hypothesis. Furthermore, there have been recent reports of the unexplained reappearance of mitotic cyclins and their associated kinases in neurons of the AD brain (Pope et al., 1994; Liu et al., 1995; Vincent et al., 1996, 1997). From their evidence, Vincent et al. (1997) conclude that the disregulation of cdc2 kinase activity leads to tau hyperphosphorylation and the neurofibrillary tangle pathology of AD.
We report here additional evidence that lends credence to the hypothesis that ectopic expression of cell cycle proteins is a central event in the neurodegeneration in AD. Specifically, we found an abnormal appearance of the cell cycle markers cyclin B1, proliferating cell nuclear antigen (PCNA), cdk4, and cyclin D in regions where cell death is extensive. In each region we examined, there was a good correlation between the presence of cell cycle markers and neuronal loss. In contrast, immunohistochemical evidence for neurofibrillary tangles was associated with neuronal death only in hippocampus and entorhinal cortex. Comparison of the relative density of cells that are positive for the various cell cycle markers suggests a model in which the normal cascade of cell cycle enzymes begins normally but then disregulates. The resulting disruptive effects are proposed to be the mechanism that ultimately leads to neuronal loss in the brains of AD patients.
MATERIALS AND METHODS
Tissue. Human autopsy brain tissue was obtained from the Alzheimer Disease Research Center at Case Western Reserve University. All 12 AD cases were confirmed pathologically. The tissue had a median postmortem interval (between death and autopsy) of 5 hr, ranging from 1 to 8 hr (Table 1, Alzheimer’s). Our eight age-matched controls were pathologically verified as disease-free and had postmortem intervals from 3 to 22 hr with a median time of 10.25 hr (Table 1, Normal). Brains were immersion-fixed for a minimum of 14 d in 20% formalin. A listing of the various cases used in this study can be found in Table 1. Tissue samples were embedded in Paraplast+ (Fisher Scientific, Pittsburgh, PA) and sectioned at 10 μm on a Leitz (Wetzlar, Germany) 1512 microtome. The sections were deparaffinized in xylene and rehydrated through graded ethanols to water.
Table 1.
Cases examined
| Case | Age | PMI | Sex | Area sampled |
|---|---|---|---|---|
| Normal | ||||
| 87–009 | 91 | 19 | F | H, T |
| 87–061 | 89 | 5 | F | H, T |
| 88–322 | 79 | 20 | M | H, T |
| 90–119 | 84 | 22 | F | H, T |
| 94–054 | 69 | 4 | M | BS, H, T |
| 94–101 | 69 | 5 | M | BS, H, T |
| 94–139 | 84 | 3 | F | BS, H, T |
| 95–361 | 76 | 4 | F | BS, H, T |
| Mean | 80.1 ± 6.9 | 10.25 ± 7.6 | ||
| (median = 5) | ||||
| Alzheimer’s | ||||
| 92–274 | 64 | 5 | M | BS, H, T |
| 92–447 | 71 | 5 | M | BS, H, T |
| 91–473 | 77 | 2 | M | BS |
| 93–010 | 77 | 4 | F | H, T |
| 93–221 | 65 | 6 | F | BS, H, T |
| 93–425 | 90 | 5 | F | H, T |
| 93–443 | 89 | 7 | M | H, T |
| 94–116 | 83 | 8 | M | H, T |
| 94–126 | 78 | 5 | M | H, T |
| 94–382 | 82 | 1 | M | BS |
| 95–147 | 74 | 8 | F | BS, H, T |
| 95–174 | 90 | 4 | M | BS, H, T |
| Mean | 78.3 ± 7.1 | 5 ± 1.5 | ||
| (median = 5) | ||||
PMI, Postmortem interval; Area sampled: BS, brainstem; H, hippocampus; T, temporal cortex.
Antibodies. The PCNA mouse monoclonal antibody (SC-56; Santa Cruz Biotechnology, Santa Cruz, CA) recognizes the PCNA p36 protein in a broad variety of species. The monoclonal cell line that produces it was described by Waseem and Lane (1990). Cyclin B1 mouse monoclonal antibody (SC-245; Santa Cruz) is a mouse IgG prepared from spleen cells of mice immunized with recombinant human cyclin B1. Cyclin B1 is a regulatory subunit of the cdc2 protein kinase that is believed to initiate mitosis (Doree, 1990). A rabbit polyclonal antibody to cyclin B1 (Santa Cruz) was also used on some material. The cyclin D (06-137) and cdk4 (06-139) were obtained from Upstate Biotechnology (Lake Placid, NY). Both are rabbit polyclonal antibodies prepared against C-terminal regions of the human proteins. The TG3 antibody recognizes phosphorylated epitopes of the paired helical filaments (PHFs) characteristic of Alzheimer’s disease (Vincent et al., 1996). The PHF-1 antibody was raised against gel-purified PHF protein from AD tissue (Greenberg et al., 1992). Both the TG3 and the PHF-1 antibodies were generous gifts from Dr. Peter Davies (Albert Einstein College of Medicine, Bronx, NY). Primary antibodies were visualized using the Vectastain ABC Elite kit that uses peroxidase to produce a brown diaminobenzidine reaction product. In cases in which double immunolabeling was required, the Vectastain ABC-AP kit was used in which alkaline phosphatase conjugated reagents to produce a red reaction product when treated with the Vector Red substrate kit. All kits were from Vector Laboratories (Burlingame, CA).
Immunohistochemistry. Deparaffinized sections were soaked in 3% hydrogen peroxide to remove endogenous peroxidase activity and then rinsed five times in PBS. All Santa Cruz and Upstate Biotechnology primary antibodies were used at a 10 μg/ml concentration in PBS containing 20% goat serum and 0.5% Tween 20 and applied to the sections overnight at room temperature in a humid chamber. The TG3 and PHF-1 antibodies were used at various concentrations (1:10–1:1000) with no effect on staining pattern. After overnight incubation, the sections were washed four times in 100 mm Tris-buffered saline (TBS) before application of the secondary antibody (diluted 1:400). Sections were incubated for 1 hr in a humid chamber at room temperature and then rinsed four times in TBS. For diaminobenzidine (DAB) localization, rinsed sections were incubated in Vectastain ABC Elite reagent for 1 hr at room temperature. After three successive washes, the sections were incubated in 0.05% DAB (Polysciences, Warrington, PA) and 0.005% H2O2 in TBS for 5 min. The sections were then rinsed three times in PBS.
If the sections were to be double-stained, they were subsequently incubated in 2N HCl for 20 min to strip the first primary antibody from the tissue. After 10 PBS rinses, the sections were incubated in the second primary antibody overnight as above. After four TBS rinses, the sections were incubated in secondary antibody from the ABC-AP kit for 1 hr as above. They were then rinsed four times in TBS and incubated in the ABC-AP reagent for 1 hr as above. After three successive rinses in TBS, the sections were incubated in Vector Red substrate for 5–30 min to visualize the second primary antibody.
All sections were counterstained in quarter-strength hematoxylin.
Morphometry. In the hippocampus, four AD and three normal cases were counted to yield the results reported in Table2. Cells were counted in three to five sections from each region. First, the total number of immunopositive cells was counted. A cell was scored only if it contained clear evidence of immunostaining (peroxidase–DAB or alkaline phosphatase–Vector Red) and a visible nucleus. To determine the percentage of positive cells, all neurons were counted in a single hematoxylin-stained section from a given region (e.g., hippocampal pyramidal cell layer or locus coeruleus). Again, for a neuron to be scored as positive, a visible nucleus had to be present. This total number was then used as a denominator to determine the fraction of positive cells in each of several nearby immunostained sections. The resulting percentage will contain small errors attributable to variations from section to section in the total number of cells. Counts of additional hematoxylin-stained sections suggest that this error is <10%.
Table 2.
Percentage of hippocampal neurons positive for cell cycle markers
| Cyclin D | cdk4 | PCNA | Cyclin B1 | |
|---|---|---|---|---|
| Normal | ||||
| % positive | 0 | 0.1 | 0.5 | 0.1 |
| %NFTs double-positive2-2001 | 0 | 0 | 98 | 40 |
| AD | ||||
| % positive | 0.6 | 3.9 | 9.0 | 8.8 |
| %NFTs double positive2-2001 | 0 | 0 | 97 | 64 |
The percentage of pyramidal cells in normal or AD hippocampus that stained for each cell cycle marker is given.
F2-2001: Percentage of NFT-positive cells that were also cyclin-positive.
RESULTS
Cell cycle markers in the hippocampus
Previous work on target-related cell death in mouse development (Herrup and Busser, 1995) led us to search for the expression of cell cycle proteins in at-risk populations of neurons in AD brains. We first examined the hippocampus, which is affected early in the disease and which has been extensively studied. We stained the tissue for the four cell cycle markers: cyclin D, cdk4, PCNA, and cyclin B1.
As shown in Figure 1, the hippocampus of affected individuals contains large pyramidal neurons with high levels of expression of cyclin D (Fig. 1C). The open circles in Figure 3 offer a sense of the distribution of these cells in the hippocampus of two representative AD cases. Antibody staining of cdk4 (Fig. 1D; see Fig. 3B,filled circles) was also found. Although we examined 72 sections of hippocampal tissue from nondemented control tissue, we found no cells labeled with the cyclin D antibody (Fig.1E). Within the AD brain, we detected a reproducible variation among the various CA fields (see Fig. 3); labeled cells were predominant in the CA1 and CA3/4 areas of the hippocampus (the same areas preferentially affected by cell loss in AD). Although labeled cells were easily found in our material, overall only a tiny minority of cells were cyclin D-positive in any one case. In the 10 AD cases we examined, an average of 0.6% of the hippocampal cells were cyclin D positive (see Fig. 3, open circles, Table 2).
Fig. 1.

Top. AD hippocampus stained for cell cycle markers PCNA (A), cyclin B1 (B), cyclin D (C), and cdk4 (D). E, Similar field in a nondemented, age-matched control brain stained for PCNA. The small arrowsindicate cells positive for the respective cell cycle marker. InD, the larger arrow points to a TG3-positive neuron that is cdk4-negative. Scale bars: 50 μm; C, inset, 20 μm.
Fig. 3.

Camera lucida drawing of the hippocampus from two AD cases. A, Case 92-447. The trianglesshow the location of cells that were positive for PCNA staining in three sections (combined on the outline of one). Likewise, thesquares show the results of staining for cyclin B1 from three sections, and the open circles show staining from five sections for cyclin D. B, Case 93-221. The symbols are the same with each, representing positive cells in three sections. This case was also stained for cdk4, represented by filled circles. The arrows point to the locations of the representative cells shown in Figure 1. In each figure, the variousCA fields are labeled as indicated. DG, Dentate gyrus. Scale bar, 50 μm.
The appearance of cyclin D (in complex with cdk4) is an early event in a normal cell cycle (for review, see Nurse, 1990; Maller, 1991; Pines, 1993, 1994, 1995). We also asked whether later cell cycle markers were present. Neurons known to be at risk in AD tissue consistently stained with antibodies to both PCNA (normally an S phase protein; Figs.1A,2A) and cyclin B1 (elevated from G2 into mitosis; Figs. 1B,2B). AD hippocampus stained well with both markers (∼9% positive cells; Table 2), yet when we examined control tissue, little staining was found (≤0.5% positive cells). As with cyclin D and cdk4, the majority of neurons that were positive for PCNA or cyclin B1 were in the CA1 and CA3/4 regions of the hippocampus (Fig.3, open triangles, open squares, respectively). We also examined the subiculum of the entorhinal cortex, which is a region of extensive cell loss in AD. We found many examples of cells stained for all four cell cycle markers tested either separately or in pairs (data not shown). Although cyclin D always appeared in cell nuclei in our material, the subcellular location of cyclin B1 and PCNA was most often cytoplasmic. For PCNA this may be attributable to the use of paraformaldehyde rather than organic fixatives in the brain fixation protocol. Nonetheless, the unusual location also hints that the regulation of these cell cycle proteins may be somewhat aberrant in the stained AD neurons.
Fig. 2.
Bottom. Dorsal raphe nucleus stained for cell cycle markers PCNA (A), cyclin B1 (B), cyclin D (C), and cdk4 (D). E, Representative field from a normal brain showing the lack of cyclin B1 staining. Other symbols as in Figure 1. Scale bar, 50 μm.
Cell cycle markers in the brainstem and other regions
Another area of cell death in AD is the dorsal raphe nucleus. The raphe lies just ventral to the locus coeruleus and loses nearly 50% of its neurons in Alzheimer’s disease (Zweig et al., 1988). When the dorsal raphe was stained for cell cycle markers, only a few cells stained positive for cyclin D (Fig. 2C), although somewhat more stained for cdk4 (Fig. 2D). Approximately 10% of the raphe neurons were positive for PCNA (Fig.2A), with an equal percentage positive for cyclin B1 (Fig. 2B). Table 3lists the percentage of positive cells in the raphe of AD and control brains. The percentage of cells labeled with cdk4 is relatively high compared with cyclin D. This might be attributable to the fact that the main regulation of cdk4 is via its phosphorylation state rather than the absolute levels of protein. We found little immunostaining of our control tissue. As in the other regions described above, there was a near total lack of staining in nondemented control brains (Fig.2E).
Table 3.
Percentage of dorsal raphe neurons positive for cell cycle markers
| Cyclin D | cdk4 | PCNA | Cyclin B1 | |
|---|---|---|---|---|
| Normal | 0 | 0 | 0 | 0.8 |
| AD | 0.4 | 8.9 | 11 | 11 |
The percentage of cells in normal or AD dorsal raphe nucleus that stained for each cell cycle marker is given.
The locus coeruleus (LC) is another area decimated by cell death in AD and is found in the rostral brainstem dorsal to the raphe. Zweig et al. (1988) report that nearly 60% of these large pigmented noradrenergic cells are lost in AD. When we looked for cell cycle markers in this area, we found staining of all four markers used above: PCNA (Fig.4A), cyclin B1 (Fig.4B), cyclin D (Fig. 4C), and cdk4 (Fig.4D). Although the melanin granules appear brownish black in our staining reactions, the melanin pigmentation is easily distinguished from the redder brown of the DAB reaction (Fig.4C). Furthermore, the presence of the melanin in the antigen-positive cells unequivocally identifies them as neurons. Consistent with our findings in the hippocampus and the raphe, few cells labeled with antibodies to cyclin D, whereas ∼10% of the cells labeled with the markers PCNA or cyclin B1 (Table4).
Fig. 4.
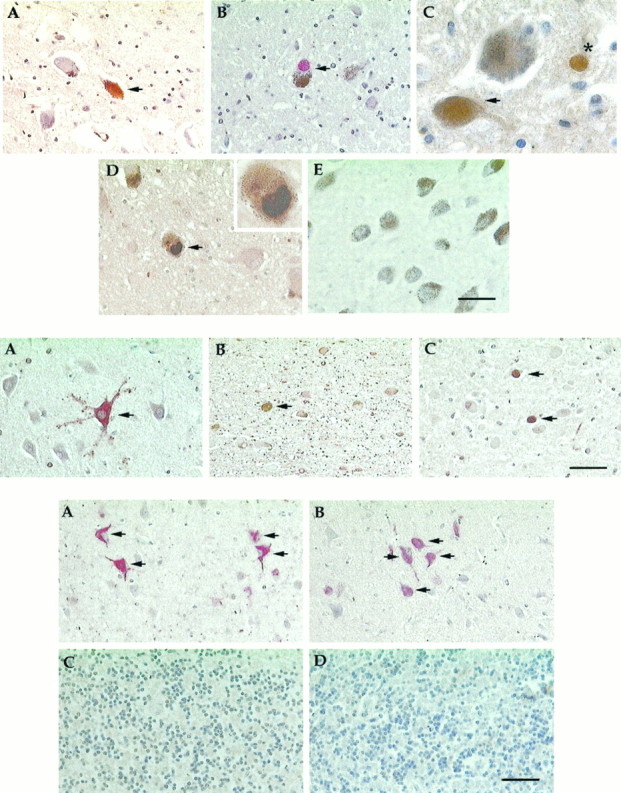
Top. AD locus coeruleus stained for cell cycle markers PCNA (A), cyclin B1 (B), cyclin D (C), and cdk4 (D). E, Representative field from a normal brain showing the greater number of cells as well as the lack of staining for PCNA. The arrows indicate cells positive for the respective cell cycle marker. All antigens, except cyclin B1, were revealed using the DAB reaction product (see Materials and Methods).B, The cyclin B1 antigen was revealed using the Vector Red reaction product (see above). C, The asteriskpoints to a labeled non-neuronal cell, most likely a microglial cell. Scale bars: A, B, D, E, 50 μm; C, D, inset, 20 μm.
Table 4.
Percentage of locus coeruleus neurons positive for cell cycle markers
| Cyclin D | cdk4 | PCNA | Cyclin B1 | |
|---|---|---|---|---|
| Normal | 0 | 0 | 0.2 | 1.2 |
| AD | 0.3 | 10.5 | 8.3 | 4.0 |
The percentage of cells in normal or AD locus coeruleus that stained for each cell cycle marker is given.
The cerebellum is reportedly spared from most of the pathological features of AD. Diffuse plaques were found but no neuritic plaques; no tangles and little or no neuronal death were observed. We found no cell cycle staining in any neuron in this region in either the AD cases or the controls (see Fig. 6C,D).
Fig. 6.
Bottom. A, B, Sections of inferotemporal cortex of AD (A) and normal (B) brains. The sections were double-stained for PHF-1 (revealed with an alkaline phosphatase antibody and red chromaphore) and the cell cycle marker PCNA (revealed with a peroxidase antibody and thebrown, DAB chromaphore). Although many inferotemporal neurons in both demented and control cases were PHF-1-positive, none were positive for the cell cycle marker, PCNA. C, D, Sections of cerebellum stained for PCNA. In both AD (C) and normal (D) brains, there is no evidence of staining for the cell cycle marker. Scale bar, 50 μm.
We stained tissue for neurofibrillary tangles (NFTs) using either PHF-1, an antibody raised against gel-purified PHFs from AD brain (Greenberg et al., 1992) or TG3, an antibody that recognizes phosphorylated epitopes of tau, the main protein believed to make up PHFs in AD (Vincent et al., 1996). Consistent with earlier reports, when either of these antibodies was used alone, we found immunopositive cells in CA1 and CA3/4 of the hippocampus, as well as in the subiculum of the entorhinal cortex. Control tissue showed only a few positive cells. To examine the expression of the cell cycle proteins in these cells, we double-stained sections for NFTs and a cell cycle marker (Table 2). Virtually 100% of PHF-1- or TG3-positive cells were stained for PCNA in tissue from AD cases (Fig.5A). Additionally, most NFT-containing cells were also stained for cyclin B1. Significantly, however, we found no examples of a cell double-labeled for a PHF marker plus either cyclin D or cdk4, both of which are early cell cycle proteins.
Fig. 5.
Middle. Double-stained sections for PHF-1 (red) and PCNA (brown) in the CA3/4 region of the hippocampus (A), locus coeruleus (B), and dorsal raphe nucleus (C). Note the double-labeling in the hippocampus (A), whereas there is none (no PHF1-positive cells) in representative fields of the LC or DR. Scale bar, 50 μm.
The inferotemporal cortex, anatomically close to the hippocampus and entorhinal cortex, is well known for its high density of NFTs (Braak and Braak, 1991, 1995) and neurons that are PHF-1-positive. When we stained our cases with either of the two NFT markers, a relatively high percentage of the neurons in this region were labeled (Fig.6A). We observed no apparent decrease in neuronal density, however, suggesting that despite the presence of hyperphosphorylated tau protein, there was no extensive neuronal loss. Consistent with this, we found no evidence of cell cycle markers in this cortical region. Figure 6A is a representative example of a group of cells in an AD brain that is positive for TG3 (revealed with a red alkaline phosphatase reaction product) but negative for cyclin B1 (which would have appeared brown). Figure 6B is a section from a control case stained with the same antibodies. Again, no cyclin B1 staining is apparent. In contrast, in the hippocampus we found many examples of cells double-labeled for a cell cycle marker and NFTs.
We also examined the expression of NFT markers in the brainstem. Staining for either PHF-1 or TG3 yielded few positive cells in the LC (Fig. 5B). This is consistent with earlier reports that show few NFTs or senile plaques (SP) in the AD brainstem despite massive cell loss (Zweig et al., 1988). Unlike the cells of the locus coeruleus, a few raphe neurons were positive for NFT markers (Fig.5C). This is also consistent with the findings of Zweig et al. (1988) who reported 10-fold more neurofibrillary tangles in the raphe than in the locus. PHF-1- or TG3-positive neurons were still rare, however, especially when compared with the numbers seen in the hippocampus.
One of the cases we included in our control group (case 94-139) deserves additional comment. Although confirmed by neuropathological examination to be free of AD, her clinical history is suggestive of a presymptomatic course of AD, including intermittent paranoid delusions and acute delirium associated with her immediate premortem illness. Extensive telephone interviews with her family, conducted 5 months after her death from cardiovascular disease, revealed no significant cognitive decline in the 5 years before her final illness. Despite not meeting the neuropathological criteria for AD, our quantitative evaluation revealed a significant (∼30%) cell loss in locus coeruleus (D. Geldmacher, J. Busser, and K. Herrup, unpublished observations), as well as increased densities of NFTs and SPs in hippocampus. Interestingly, we found increased cell cycle marker expression in this case relative to our other nondemented controls in all areas examined. Indeed, all of the cells positive for one of the cell cycle markers reported in our control group (Tables 2-4) stem from this one individual.
DISCUSSION
The results presented here represent a survey of proteins normally present only during the cell cycle in the brains of individuals who have died with Alzheimer’s disease. Six regions have been examined in detail: hippocampus, subiculum, locus coeruleus, dorsal raphe, inferotemporal cortex, and cerebellum. In clinically affected individuals, neurons in the first four of these locations were depleted, and in each of these areas we found significant numbers of cells that were immunopositive for one or more of the four cell cycle proteins we studied: cyclin D, cdk4, PCNA, and cyclin B1. In contrast, neurons in the same brain sites in nondemented, age-matched control brains showed little to no evidence of immunoreactivity; staining was not found in the regions of the Alzheimer’s disease brain where no exceptional cell death was identified. These findings argue for an association between these cell cycle-related proteins and the death of neurons in Alzheimer’s dementia. This conclusion is further strengthened by our observations in the larger neurons of Ammon’s horn and the subiculum where antibodies against hyperphosphorylated tau are found co-localized with the cell cycle components.
Our findings in hippocampus and subiculum confirm and extend the work of Vincent et al. (1997), who reported both biochemical and immunological evidence for the association of hyperphosphorylated tau and cdc2, complexed with its regulatory subunit, cyclin B1, in AD but not control brains. From the evidence it seems likely that in susceptible cell populations the abnormal presence of the active form of cdc2 is responsible, at least in part, for the hyperphosphorylation of neuronal proteins such as tau. Although cdc2 is not directly responsible for the PHF-1 epitope, our findings suggest that there must be more to the story than tau phosphorylation alone. Specifically, in cell groups such as the locus coeruleus and dorsal raphe, there is massive cell death in Alzheimer’s disease but little evidence of PHF-1 phospho-tau staining. In contrast, we have not identified any region of the CNS where there is evidence of large-scale neuronal death in AD without evidence of ectopic cell cycle components. These observations lead us to propose that it is the unscheduled expression of the mitotic proteins rather than the protein phosphorylation abnormalities per se that is a requisite antecedent to neuronal loss in AD. This is consistent with the results of experimental studies in developing mouse brain and extends to the adult the hypothesis that if mature (or maturing) neurons ectopically express the enzymes and regulatory proteins of the cell cycle, they will die rather than divide.
Our quantitative investigations suggest additional aspects of the cell death process. We find that the percentages of cyclin D-positive cells are much smaller than the percentages of PCNA- or cyclin B1-positive cells. In agreement with Vincent et al. (1997), we find no trace of mitotic figures. In the normal cell cycle, cyclin D is elevated only during late G1 phase; cdk4 levels rise during G1 but remain high; PCNA is present only during S and early G2 phases; and cyclin B1 is elevated only in G2phase. Superficially, therefore, the cells we have observed in the AD brain would appear to have begun a “cycle” in which they finish G1 normally, only to become blocked in the later stages. In truth, the term cycle is a misleading one here, because in a well regulated cell cycle, PCNA levels should go down as cyclin B1 levels rise. Furthermore, the localization of the PCNA and cyclin B1 proteins should be predominantly nuclear, although in our material they can be either nuclear or, more commonly, cytoplasmic. For PCNA this may result in part from the use of formaldehyde fixation (Bravo and MacDonald-Bravo, 1987), but overall it seems that whereas the AD neurons can begin a cascade of gene expression that includes various cell cycle components, the tight coordination that characterizes a normal cycle is soon lost. It would be of interest to learn whether DNA replication was a part of this abnormal response, but such data are unavailable at present.
The control case (94-139) in which early pathological signs of AD were found provides strong, albeit anecdotal, evidence that the association between the cell cycle markers and the presence of neuronal cell death in AD is not simply a fortuitous one. Behavioral abnormalities in this patient were exhibited only with provocation, and there was only modest cell loss in all areas examined. These features, coupled with the presence of an increased (if subcriterion) density of SP and NFT, would argue for the possible categorization of this individual as one in the early stages of the disease process. The correlated appearance of the cell cycle markers strongly supports the proposition that this evidence of ectopic reentrance into the cell cycle is not merely an epiphenomenon associated with the end stage of the disease, but rather an integral part of the entire disease process.
That 10% of the neurons in the hippocampus (or LC) of an AD patient are positive for PCNA and/or cyclin B1 means that the death of these cells must require considerable time after cyclin induction. This can be compared and contrasted with the target-related death of neurons during development. In an earlier study of two mouse models of cell death, we demonstrated that cerebellar granule cells that are fated to die reenter the cell cycle as a part of that process (Herrup and Busser, 1995). As in the current study, we found evidence of abnormal expression of cyclin D and PCNA in the neurons at risk. This suggests that regulatory events associated with attempted but unscheduled reentry into the cell cycle likely lead to neuronal cell death at different points in the life span. During development, however, neuron death is far more rapid. By administering the DNA precursor bromodeoxyuridine (BrdU) at various times before killing the mice and scoring the number of BrdU-labeled pyknotic cells, we were able to determine that the time between the beginning of S phase and cell death was ∼10 hr (about one-half of a normal granule cell cycle). In contrast, the observation of a 10% PCNA or cyclin B1 labeling frequency, coupled with a disease progression that takes several years, means that the human neurons must survive for several months before succumbing. This suggests that the young neurons of the developing CNS may be more vulnerable to cycling-induced death. It also implies that the mature neurons of the aging human brain not only must be blocked in their ability to divide, but they also seem to be more resistant to the effects of the cell cycle-induced degeneration.
Footnotes
This work was supported by National Institutes of Health Grant NS20591 to K.H. and Neuropathology Core of the Case Western Reserve/University Hospitals Alzheimer’s Disease Research Center Grant AG08012. We extend our gratitude to Dr. Peter Davies for his generosity in providing us with the antibodies to the PHF-1 and TG3 epitopes.
Correspondence should be addressed to Dr. Karl Herrup, Alzheimer Research Laboratory, Department of Neurology, Case Western Reserve University, School of Medicine E504, 10900 Euclid Avenue, Cleveland, OH 44106.
REFERENCES
- 1.al-Ubaidi MR, Hollyfield JG, Overbeek PA, Baehr W. Photoreceptor degeneration induced by the expression of simian virus 40 large tumor antigen in the retina of transgenic mice. Proc Natl Acad Sci USA. 1992;89:1194–1198. doi: 10.1073/pnas.89.4.1194. [DOI] [PMC free article] [PubMed] [Google Scholar]
- 2.Alzheimer A. Über eine eigenartige Erkangkung der Hirnrinde. Allg. Z Psychiatrie Psych-Gerichtliche Med. 1907;64:146–148. [Google Scholar]
- 3.Blessed G, Tomlinson B, Roth M. The association between quantitative measures of dementia and of senile dementia in the cerebral gray matter of elderly subjects. Br J Psychiatry. 1968;114:797–811. doi: 10.1192/bjp.114.512.797. [DOI] [PubMed] [Google Scholar]
- 4.Bondareff W, Mountjoy C, Roth M. Loss of neurons of origin in the adrenergic projection to cerebral cortex (nucleus locus coeruleus) in senile dementia. Neurology. 1982;32:164–168. doi: 10.1212/wnl.32.2.164. [DOI] [PubMed] [Google Scholar]
- 5.Braak H, Braak E. Neuropathological staging of Alzheimer-related changes. Acta Neuropathol (Berl) 1991;82:239–259. doi: 10.1007/BF00308809. [DOI] [PubMed] [Google Scholar]
- 6.Braak H, Braak E. Staging of Alzheimer’s disease-related neurofibrillary changes. Neurobiol Aging. 1995;16:271–284. doi: 10.1016/0197-4580(95)00021-6. [DOI] [PubMed] [Google Scholar]
- 7.Bravo R, MacDonald-Bravo H. Existence of two populations of cyclin/proliferating cell nuclear antigen during the cell cycle: association with DNA replication sites. J Cell Biol. 1987;105:1549–1554. doi: 10.1083/jcb.105.4.1549. [DOI] [PMC free article] [PubMed] [Google Scholar]
- 8.Clarke A, Maandag E, van Roon M, van der Lugt N, van der Valk M, Hooper M, Berns A, te Riele H. Requirement for a functional Rb-1 gene in murine development. Nature. 1992;359:328–330. doi: 10.1038/359328a0. [DOI] [PubMed] [Google Scholar]
- 9.Doree M. Control of M-phase by maturation promoting factor. Curr Opin Cell Biol. 1990;2:269–273. doi: 10.1016/0955-0674(90)90018-a. [DOI] [PubMed] [Google Scholar]
- 10.Evans D, Funkenstein H, Albert M, Scherr P, Cook N, Chown M, Hebert L, Hennekens C, Taylor J. Prevalence of Alzheimer’s disease in a community population of older persons: higher than previously reported. JAMA. 1989;262:2551–2556. [PubMed] [Google Scholar]
- 11.Feddersen RM, Ehlenfeldt R, Yunis WS, Clark HB, Orr HT. Disrupted cerebellar cortical development and progressive degeneration of Purkinje cells in SV40 T antigen transgenic mice. Neuron. 1992;9:955–966. doi: 10.1016/0896-6273(92)90247-b. [DOI] [PubMed] [Google Scholar]
- 12.Freeman R, Estus S, Johnson E. Analysis of cell cycle-related gene expression in postmitotic neurons: selective induction of cyclin D1 during programmed cell death. Neuron. 1994;12:343–355. doi: 10.1016/0896-6273(94)90276-3. [DOI] [PubMed] [Google Scholar]
- 13.Greenberg S, Davies P, Schein J, Binder L. Hydrofluoric acid-treated tPHF proteins display the same biochemical properties as normal tPHF. J Biol Chem. 1992;267:564–569. [PubMed] [Google Scholar]
- 14.Heintz N. Cell death and the cell cycle: a relationship between transformation and neurodegeneration? Trends Biochem Sci. 1993;18:157–159. doi: 10.1016/0968-0004(93)90103-t. [DOI] [PubMed] [Google Scholar]
- 15.Herrup K, Busser JC. The induction of multiple cell cycle events precedes target-related neuronal death. Development. 1995;121:2385–2395. doi: 10.1242/dev.121.8.2385. [DOI] [PubMed] [Google Scholar]
- 16.Jacks T, Fazeli A, Schmitt E, Bronson R, Goodell M, Weinberg R. Effects of an Rb mutation in the mouse. Nature. 1992;359:295–300. doi: 10.1038/359295a0. [DOI] [PubMed] [Google Scholar]
- 17.Jost B, Grossberg G. The natural history of Alzheimer’s disease: a brain bank study. J Am Geriatr Soc. 1995;43:1248–1255. doi: 10.1111/j.1532-5415.1995.tb07401.x. [DOI] [PubMed] [Google Scholar]
- 18.Lee EY-HP, Chang C-Y, Hu N, Wang Y-CJ, Lai C-C, Herrup K, Lee W-H, Bradley A. Mice deficient for Rb are nonviable and show defects in neurogenesis and haematopoiesis. Nature. 1992;359:288–294. doi: 10.1038/359288a0. [DOI] [PubMed] [Google Scholar]
- 19.Lee EY-HP, Hu N, Yuan S-SF, Cox LA, Bradley A, Lee W-H, Herrup K. Dual roles of the RB protein in cell cycle regulation and neuron differentiation. Genes Dev. 1994;8:2008–2021. doi: 10.1101/gad.8.17.2008. [DOI] [PubMed] [Google Scholar]
- 20.Liu W-K, Williams R, Hall F, Dickson D, Yen S-H. Detection of a cdc2-related kinase associated with Alzheimer paired helical filaments. Am J Pathol. 1995;146:228–238. [PMC free article] [PubMed] [Google Scholar]
- 21.Maller J. Mitotic control. Curr Opin Cell Biol. 1991;3:269–275. doi: 10.1016/0955-0674(91)90151-n. [DOI] [PubMed] [Google Scholar]
- 22.Nurse P. Universal control mechanism regulating onset of M-phase. Nature. 1990;344:503–508. doi: 10.1038/344503a0. [DOI] [PubMed] [Google Scholar]
- 23.Pines J. Cyclins and cyclin-dependent kinases: take your partners. Trends Biochem Sci. 1993;18:195–197. doi: 10.1016/0968-0004(93)90185-p. [DOI] [PubMed] [Google Scholar]
- 24.Pines J. The cell cycle kinases. Semin Cancer Biol. 1994;5:305–313. [PubMed] [Google Scholar]
- 25.Pines J. Cyclins and cyclin-dependent kinases: a biochemical view. Biochem J. 1995;308:697–711. doi: 10.1042/bj3080697. [DOI] [PMC free article] [PubMed] [Google Scholar]
- 26.Pope W, Lambert M, Leypole B, Seupaul R, Sletten L, Krafft G, Klein W. Microtubule-associated protein tau is hyperphosphorylated during mitosis in the human neuroblastoma cell line SH-SY5Y. Exp Neurol. 1994;126:185–194. doi: 10.1006/exnr.1994.1057. [DOI] [PubMed] [Google Scholar]
- 27.Vincent I, Rosado M, Davies P. Mitotic mechanisms in Alzheimer’s disease? J Cell Biol. 1996;132:413–425. doi: 10.1083/jcb.132.3.413. [DOI] [PMC free article] [PubMed] [Google Scholar]
- 28.Vincent I, Jicha G, Rosado M, Dickson D. Aberrant expression of mitotic cdc2/cyclin B1 kinase in degenerating neurons of Alzheimer’s disease brain. J Neurosci. 1997;17:3588–3598. doi: 10.1523/JNEUROSCI.17-10-03588.1997. [DOI] [PMC free article] [PubMed] [Google Scholar]
- 29.Waseem N, Lane D. Monoclonal antibody analysis of the proliferating cell nuclear antigen (PCNA): structural conservation and the detection of a nucleolar form. J Cell Sci. 1990;69:121–129. doi: 10.1242/jcs.96.1.121. [DOI] [PubMed] [Google Scholar]
- 30.Whitehouse P, Price D, Struble R, Clark A, Coyle J, DeLong M. Alzheimer’s disease and senile dementia: loss of neurons in the basal forebrain. Science. 1982;215:1237–1239. doi: 10.1126/science.7058341. [DOI] [PubMed] [Google Scholar]
- 31.Zweig R, Ross C, Hedreen J, Steele C, Cardillo J, Whitehouse P, Folstein M, Price D. The neuropathology of aminergic nuclei in Alzheimer’s disease. Ann Neurol. 1988;24:233–242. doi: 10.1002/ana.410240210. [DOI] [PubMed] [Google Scholar]