

Abstract
To compare neuronal activity within the mesocorticolimbic circuit during the self-administration of cocaine and heroin, multiple-channel single-unit recordings of spike activity within the rat medial prefrontal cortex (mPFC) and nucleus accumbens (NAc) were obtained during the consecutive self-administration of cocaine and heroin within the same session. The variety of neuronal responses observed before the lever press are termed anticipatory responses, and those observed after the lever press are called post-drug infusion responses. For the total of the 110 mPFC and 111 NAc neurons recorded, 30–50% of neurons, depending on the individual sessions, had no alteration in spike activity in relation to either cocaine or heroin self-administration. Among the neurons exhibiting significant neuronal responses during a self-administration session, only a small portion (16–25%) of neurons responded similarly under both reinforcement conditions; the majority of neurons (75–84%) responded differently to cocaine and heroin self-administration as revealed by variations in both anticipatory and/or post-drug infusion responses. A detailed video analysis of specific movements to obtain the self-administration of both drugs provided evidence against the possibility that locomotive differences contributed to the observed differences in anticipatory responses. The overall mean activity of neurons recorded in mPFC and NAc measured across the duration of the session segment for either cocaine or heroin self-administration also was different for some neurons under the two reinforcement conditions. This study provides direct evidence that, in mPFC and NAc, heterogeneous neuronal circuits mediate cocaine and heroin self-administration and that distinct, but overlapping, subpopulations of neurons in these areas become active during operant responding for different reinforcers.
Keywords: electrophysiology, cocaine, heroin, mesocorticolimbic system, medial prefrontal cortex, nucleus accumbens, reinforcement, reward, drug abuse, behavior
A consensus exists that the mesocorticolimbic circuit is involved in both cocaine and heroin self-administration (Zito et al., 1985; Wise and Rompre, 1989; Koob, 1992; Wise, 1996). However, the degree to which common versus independent neuronal circuits are used to mediate a similar behavior driven by a different reinforcer is not yet clear. Reciprocal interconnections are found among the mesocorticolimbic structures. The medial prefrontal cortex (mPFC) projects to the nucleus accumbens (NAc), amygdala, and ventral tegmental area (VTA) (Berendse et al., 1992, Naito and Kita, 1994). The NAc, in turn, sends a projection back to the frontal cortex via substantia nigra reticulata, ventral pallidum, and the medial dorsal thalamic nucleus (Zahm et al., 1987;Groenewegen, 1988; Groenewegen et al., 1990; Deniau et al., 1994). Dense dopamine and opioid receptors located within these areas provide for the anatomic basis that contributes to the multiple actions of cocaine and heroin on the mesocorticolimbic reward system (Mansour et al., 1987, 1994; Tempel and Zukin, 1987).
An emerging hypothesis is that cocaine and heroin to some extent share a common pathway within the mesocorticolimbic system, perhaps via subgroups of medium spiny neurons in the NAc, for the mediation of their rewarding actions (Wise and Bozarth, 1985). In this view, the NAc medium spiny neuron is necessary for drug-reinforced operant responding, independent of whether the primary receptor-mediated drug action is directly on these neurons, on neurons of other afferent regions (for example, the VTA), or both. Supporting this idea is the finding that the integrity of the NAc is required for both cocaine and heroin self-administration, as demonstrated by reductions in operant responding for either drug after cell body lesions of this region (Zito et al., 1985). In addition, microinjection of opioid and dopamine receptor antagonists into the NAc selectively impairs heroin and cocaine self-administration, respectively (Vaccarino et al., 1985;Corrigall and Vaccarino 1988; Caine et al., 1995).
A specific role of the mPFC in drug self-administration is less well defined, even though the direct self-administration of cocaine into the mPFC has been reported (Goeders and Smith, 1983, 1986), and lesions of mPFC have resulted in an increase in the rate of responding for intravenous morphine self-administration (Glick and Cox, 1978). Although 6-OHDA lesions of the dopaminergic input to the mPFC suggest that dopamine input to the mPFC is not required for intravenous cocaine self-administration (Martin-Inverson et al., 1986), the presence of substantial direct and indirect projections from the mPFC to the NAc indicates that these regions may function together to control drug self-administration. Indeed, recent electrophysiological studies found that neurons of the mPFC and NAc show phasic alterations in activity during operant responding for intravenous cocaine (Chang et al., 1990; 1994; 1997a) and heroin (Chang et al., 1997b), suggesting that the mPFC, along with interconnected regions, may contribute to behaviors related to drug selfadministration.
Evidence that dopamine levels within the NAc are altered during both opiate (Wise et al., 1995a) and stimulant (Petit and Justice, 1989, 1991; Wise et al., 1995b; Kiyatkin and Stein, 1996) self-administration suggests a common mechanism at the level of the NAc for the mediation of opiate and stimulant reward (Hemby et al., 1995). In contrast, studies of dopamine depletion (Petit et al., 1984; Gerrits and VanRee, 1996) or antagonism (Ettenberg et al., 1982) suggest that opiate self-administration is not largely dependent on dopamine input to the NAc.
The working hypothesis for the present study was that, if a common pathway within the mesocorticolimbic system is involved in cocaine and heroin self-administration, one would expect to see similar responses for both cocaine and heroin self-administration in the same neuron. An alternative hypothesis supported by the results of the current study is that different functional neuronal networks are wired up by cocaine and heroin self-administration and, therefore, different neuronal responses should emerge in the same neuron during cocaine and heroin self-administration, respectively. Preliminary results of this study were presented in abstract form (Chang and Woodward, 1996).
MATERIALS AND METHODS
Animals and surgery. Ten young adult male Sprague Dawley rats weighing 250–300 gm were used in these experiments. Animals were housed under a reverse light/dark cycle (lights off from 7:00 A.M. to 7:00 P.M.). Except during initial lever press response shaping, food and water was available ad libitum. Surgical procedures are described here briefly and in detail in Chang et al. (1994). In preparation for catheterization surgery, rats were anesthetized with ketamine (100 mg/kg) and xylazine (10 mg/kg, i.m.). Under sterile conditions, SILASTIC tubing [Dow Corning; 26 mm long, 0.3 mm inner diameter (i.d.) cannula tubing, connected to a 90-mm-long, 0.6 mm i.d. outlet tubing] was inserted in the right jugular vein for subsequent intravenous drug infusion. The infusion tubing was glued to a SILASTIC implant sheeting that was sutured to subdermal connective tissue. The exposed plugged end of the tubing emanated from the dorsal aspect of the neck.
Recording microwires were implanted after training for cocaine and heroin self-administration. Anesthesia was the same as in the catheterization surgery. Four splayed bundles of eight stainless steel Teflon-insulated microwires (45–62 μm diameter; NB Labs, Denison, TX), soldered to connecting pins on a head stage, were stereotaxically lowered bilaterally into the mPFC and NAc (eight wires per side) (Chang et al., 1994). Coordinates for the mPFC and NAc were obtained from the atlas of Paxinos and Watson (1986): for mPFC, 0.5 mm lateral to midline, 3.5–3.8 mm anterior to bregma, 3.5–4.0 mm ventral to the dorsal surface of the brain; for NAc, 1.4–1.5 mm lateral, 1.8–2.0 mm anterior and 6.5–7 mm ventral. In addition, ground wires were positioned ∼2 mm ventral to the cortical surface. The head stage was secured onto the cranium with dental cement using skull screws as anchors. The head stage and dental cement weighed ∼10 gm. The animal received ampicillin (60,000 U, i.m.) after surgery. Animals were housed individually after surgery and treated in accordance with the United States Public Health Service Guide for the Care and Use of Laboratory Animals.
Apparatus and behavioral training. Two to 3 d after intravenous catheterization, rats were placed in separate rectangular operant conditioning cages, each of which was enclosed in a sound-attenuating chamber. The base of the cage was 20 cm × 23 cm and was 20 cm in height. A lever was mounted on one wall 8 cm above the cage floor. Daily experimental sessions began ∼2 hr into the animal’s dark cycle and lasted ∼3 to 4 hr. Rats were trained initially to press the lever for a water reinforcer using a continuous reinforcement schedule; cocaine or heroin was substituted later for water. Drug self-administration training started with a continuous reinforcement schedule in which each lever press activated the pump for 4 sec thereby infusing ∼1.0 mg/kg cocaine or 30 μg/kg heroin in 0.1 ml of lactated Ringer’s solution into the jugular vein. The indwelling jugular cannula was connected to an infusion pump via a plastic tube. Twenty second time-out periods were imposed immediately after drug delivery, during which the lever was inactivated to prevent an overdose of drugs. Once stable rates of responding were achieved for cocaine or heroin, a different drug was introduced in the following sessions until responding stabilized. Rats were then self-administering cocaine and heroin on alternative days. Well trained rats pressed the lever for cocaine self-administration approximately every 3–4 min and heroin approximately every 10–15 min. To compare the effects of self-administered and passively administered cocaine and heroin on the neuronal activity, cocaine (1 mg/kg per infusion) and heroin (30 μg/kg per infusion) were passively infused into the jugular vein by a computer-controlled timer. Random intervals were used that were within the range of mean ± SE of the intertrial intervals obtained during self-administration sessions in the same animal.
Once the rats were trained, surgery was performed to implant microwires in the recording regions. After 5 d of recovery, extracellular recording of mPFC and NAc spike activities during self-administration sessions was accomplished by connecting a field effect transistor head stage plug and lightweight cabling onto the implanted microwire assembly. The cabling was in turn connected to a commutator located in the center of the ceiling of the chamber. The commutator was free to turn as necessary. In this manner, the animal was permitted unrestricted movement in the operant chamber.
Electrophysiological recording. Electrophysiological recording during self-administration sessions was started with a 200 sec control period during which the lever was not available. The neuronal firing rate during this period served as baseline predrug activity for comparison with activity during the period of cocaine and heroin self-administration. After the control period, the lever became available, and a lever press by subjects led to an intravenous infusion of either cocaine or heroin, depending on which drug was used as the first reinforcer. In the middle of the session (generally after more than eight lever presses were made), a change of drug was accomplished by switching the syringe and thoroughly flushing the connecting tubing. The assignment of the drug that served as the first reinforcer each day was counterbalanced among sessions. The recording sessions lasted ∼3–4 hr and consisted of a total of 20–30 lever presses for both cocaine and heroin reinforcement.
Neuroelectric signals were passed from the headset assemblies to programmable amplifiers, filters (0.5 and 5 kHz, 3 dB cutoffs), and a multichannel spike sorting device. As many as 31 mPFC and NAc neurons per rat were monitored concurrently. When spike activity was recorded from the same microwire across different self-administration sessions, the determination that the same neuron was recorded was made in view of (1) constancy of the shape and polarity of the extracellular spike waveform and (2) similarities in firing rate and pattern (e.g., interspike interval and autocorrelation histograms). Spike activity, lever pressing, and pump activation were monitored or controlled with data acquisition software operating on a computer with a time resolution of 1 msec. Neuronal spike activity was collected from the same rat on a daily basis for 2 weeks. Spike train activity was analyzed with a commercially available PC-based program (STRANGER; Biographics Inc., Winston-Salem, NC).
Video analysis of behavior. The animal’s behavior during self-administration was recorded on videotape with the experimental time superimposed on the display for off-line analysis. Frame-by-frame analysis of behavior, at 30 frames/sec, provided 33 msec temporal resolution. In practice, interframe times could be extrapolated into thirds, permitting ∼11 msec resolution. Evaluation of behavioral time epochs with respect to concurrent spike activity was performed off-line with special purpose computer software package included in STRANGER.
Drugs. Cocaine hydrochloride (3.33 mg/ml; Sigma, St. Louis, MO) and heroin (100 μg/ml; National Institute on Drug Abuse, Rockville, MD) was dissolved in Ringer’s solution with heparin (10 U/ml) and sterilized by passing the solution through a 0.22 μm Star filter (Corning Costar Inc.).
Histology. At the conclusion of the final experimental session, 10–20 sec of 10–20 μA of positive current was passed through selected microwires to deposit iron ions. The marking current was passed through no more than two microwires in a bundle of eight microwires, because it was not possible to distinguish more than two sites using different current parameters. It was often the case that more than two microwires in a bundle of eight yielded isolated single units; therefore, not every recording site was identified, although the relative position could be ascertained. Microwires, from which anticipatory responses (see Results) were recorded, were preferentially selected for marking. The animals were then killed and perfused with a 4% paraformaldehyde solution. Coronal sections were cut through the NAc and the mPFC and mounted on slides. Incubation of the mounted sections in a solution of 5% potassium ferricyanide and 10% HCl revealed iron deposits (recording sites) in the form of blue dots. If marked recording sites were localized to the NAc or the mPFC, it was assumed that unmarked microwires had also been positioned in the regions of interest, because the dispersion diameter of the implanted microwire bundles was no more than 0.5 mm (as verified in situ with x rays). Boundaries of the mPFC and NAc were assessed with reference to the rat brain atlas of Paxinos and Watson (1986).
Statistics. Two arbitrary criteria were used concurrently to indicate a change in firing rate of neurons before and after a lever press during a session. First, the mean rate changes (excitatory or inhibitory) by 20% during the time epochs measured. Baseline activity was measured 40–50 sec before the lever press as a control period. Anticipatory activity and postdrug activity were calculated 1–3 secs before and 40–50 sec after lever press, respectively. Second, t values were computed based on variation in counts per bin during the time epochs andp < 0.01 were required to indicate a difference. These measures accounted for slow- and fast-firing neurons to show both substantial (100%) and significant changes. Nonparametric χ2 goodness of fit and 2 × 2 contingency table tests were used to determine whether the distribution of numbers of neurons across response categories was the same for cocaine versus heroin. Regression analysis was performed with a commercial software program (STATISTICA; StatSoft, Tulsa, OK). A power analysis (β = 0.05) was used to verify the significance of the correlation coefficients from the regression analyses. Data are presented as mean ± SEM.
RESULTS
General neuronal responses in mPFC and NAc during cocaine and heroin self-administration
Neurons from mPFC and NAc were recorded from 10 rats during cocaine and heroin self-administration sessions. Because the same neuron was recorded in different sessions, each neuron recorded in one session was defined as a neuron session. According to this definition, a total of 422 neuron sessions, each lasting 3–4 hr, were included in this study, with at least 211 different neurons within the sessions (110 mPFC and 111 NAc). The mean firing rate was 3.99 ± 0.52 Hz for the mPFC and 4.73 ± 0.65 Hz for the NAc.
The neuronal responses in relation to the lever press behavior during cocaine and heroin self-administration can be classified into two gross categories, i.e., the responses before the lever press (anticipatory responses) and the responses after the lever press (post-drug infusion responses). Both categories could be further divided into excitatory and inhibitory responses. Some neurons exhibited both anticipatory and post-drug infusion responses. This was more frequently observed in the case of the coexistence of excitatory anticipatory and inhibitory post-cocaine responses. Figure 1demonstrates the typical neuronal responses for these different categories, which include excitatory anticipatory responses (Fig.1A,B), inhibitory anticipatory responses (Fig. 1C), inhibitory postdrug responses (Fig.1A), and excitatory postdrug responses (Fig.1D).
Fig. 1.

Different categories of neuronal responses in mPFC and NAc during cocaine and heroin self-administration.A, Raster and perievent histogram plots show excitatory anticipatory and post-cocaine inhibitory responses by a mPFC neuron. Each dot in the raster plot (top) represents a neuronal spike, and each row represents an individual trial. The perievent histogram (bottom) depicts the average neuronal activity of the individual trials within the raster around the lever press event (50 sec before and 100 sec after lever press in this case). The zero point corresponds to the behavioral event of the lever press for cocaine self-administration. An increase in spike activity was found a few seconds before the lever press (excitatory anticipatory response), and a decrease in neuronal activity was observed after cocaine self-infusion (post-cocaine inhibitory response). B, Example of an excitatory anticipatory response during a heroin self-administration session by a NAc neuron. C, Inhibitory anticipatory neuronal response recorded from the mPFC during cocaine self-administration. Note a decrease in firing rate before the lever press. D, Excitatory post-heroin response recorded from a mPFC neuron during a heroin self-administration session. An increase in spike activity after heroin infusion is evident.
Table 1 summarizes neuronal responses recorded from the mPFC and the NAc during cocaine and heroin dual-drug self-administration sessions. The data in this table are reported from sessions in which each drug was the first reinforcer tested to present the responses of neurons associated with the individual reinforcer under conditions in which an interaction with the earlier self-administered drug is avoided (see Materials and Methods). More than half of the neurons recorded in both the mPFC and the NAc had no response during cocaine or heroin self-administration either before or after the lever press. In comparison with the mPFC, the majority of anticipatory responses in the NAc were excitatory. Another noticeable difference is that more neurons exhibited post-drug infusion responses in the NAc than in the mPFC during both cocaine and heroin self-administration.
Table 1.
Classification of neuronal responses during cocaine and heroin self-administration
| AE | AI | PI | PE | NR | ||||||
|---|---|---|---|---|---|---|---|---|---|---|
| n | % of total | n | % of total | n | % of total | n | % of total | n | % of total | |
| Cocaine | ||||||||||
| mPFC | 11 | 10 | 9 | 8.2 | 20 | 18.2 | 4 | 3.6 | 80 | 72.7 |
| NAc | 27 | 24.3 | 6 | 5.4 | 30 | 27.0 | 8 | 7.2 | 61 | 54.9 |
| Heroin | ||||||||||
| mPFC | 20 | 18.2 | 9 | 8.2 | 14 | 12.7 | 3 | 2.7 | 69 | 62.7 |
| NAc | 18 | 16.2 | 6 | 5.4 | 20 | 18.0 | 6 | 5.4 | 68 | 61.3 |
Number and distribution of different types of neuronal responses in mPFC and NAc during separate cocaine and heroin self-administration sessions. Different categories of neuronal responses are displayed at the top of table (AE, anticipatory excitatory response; AI, anticipatory inhibitory response; PI, post-drug inhibitory response; PE, post-drug excitatory response; NR, no response). Number of neuron(n) and percentage of total are indicated in each category. A total of 110 mPFC and 111 NAc neurons were tested across cocaine and heroin sessions. A single neuron sometimes exhibited more than one type of response so it could be counted in multiple categories.
Comparison between the neuronal responses in mPFC and NAc during cocaine and heroin self-administration
Responses of the same neuron during cocaine and heroin self-administration were compared under three different conditions. We compared the neuronal responses within dual-drug self-administration sessions that either started with cocaine, followed by heroin, or started with heroin, followed by cocaine. The first reinforcers for each of these two sessions, 24 hr apart, were also compared. In all three comparison conditions, different responses were frequently observed in the same neuron during cocaine and heroin self-administration; in some cases, the opposite responses were found (excitatory vs inhibitory).
Figure 2 shows an NAc neuron during a heroin–cocaine self-administration session. An increase in firing rate was detected a few seconds before the lever press, resulting in heroin infusion; when the reinforcer was changed to cocaine, no significant alteration of spike activity was observed before the lever press, although an altered spike activity developed after cocaine infusion. Figure 3 illustrates another example for a different response in a mPFC neuron, recorded during a cocaine–heroin session. In this case, an inhibitory anticipatory response appeared during the cocaine self-administration trials (Fig.3B, arrow) but did not exist during the trials in which heroin was self-administered (Fig. 3C).
Fig. 2.

Comparison of NAc neuronal activity during a single heroin and cocaine self-administration session.A, This rate meter record shows the spike activity of a NAc neuron during a heroin-first, cocaine-second self-administration session. ♦, Lever press events. The initial eight lever presses were for heroin self-administration and were followed by 11 presses for cocaine self-administration. Cocaine self-administration resulted in an increase in neuronal activity. B, Raster and perievent histogram for the heroin self-administration trials. Note the increase in firing rate before the lever press (excitatory anticipatory response). C, Same neuron as inB during the cocaine self-administration period. In contrast to B, no significant alteration of neuronal activity was observed before the lever press for cocaine self-administration.
Fig. 3.

Comparison of mPFC neuronal activity during a cocaine-first, heroin-second self-administration session using the same plot as in Figure 2. A, This rate meter plot demonstrates the firing rate of a mPFC neuron during the entire cocaine–heroin self-administration session. In this case, heroin self-administration caused general inhibition. B, Raster and perievent histogram for cocaine self-administration trials. A decrease in firing rate occurred ∼2 sec before the lever press (inhibitory anticipatory response). C, Raster and perievent histogram for heroin self-administration trials. The inhibitory anticipatory response observed during cocaine self-administration trials (B) was absent during heroin selfadministration.
To examine the reliability of these reinforcer-specific responses, data obtained during single-drug self-administration sessions, in which heroin and cocaine alternated as the reinforcer of that day, were examined. Different neuronal anticipatory responses were observed also in these cases when cocaine and heroin self-administration was performed in different sessions. Figure 4depicts the spike activity of the same NAc neuron during four consecutive, alternating cocaine and heroin self-administration sessions. Inhibitory anticipatory responses were observed during cocaine self-administration sessions for days 1 and 3 (Fig.4A,C), whereas during the heroin self-administration sessions for days 2 and 4, no such responses could be detected (Fig.4B,D). This result showed that the same neuron could be recorded reliably across different sessions.
Fig. 4.
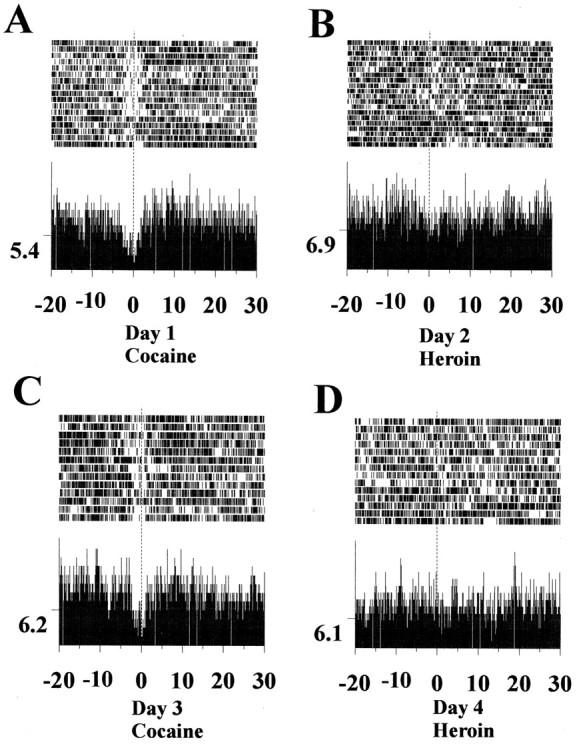
Different anticipatory neuronal responses across alternating daily cocaine and heroin sessions recorded from the same NAc neuron. A, NAc neuron exhibited inhibitory anticipatory responses before the lever press for cocaine self-administration in session 1. B, Same neuron depicted in A showed no response during the heroin self-administration session of the following day. C, An identical inhibitory anticipatory response was observed by the same neuron on the third day when cocaine self-administration was repeated.D, No alteration of neuronal activity of this same neuron was found when the subject was switched back to heroin self-administration for the session of the fourth day.
Cocaine and heroin also induced different neuronal responses after the lever press for drug self-injection (post-drug infusion response). Figure 5 shows activities of simultaneously recorded mPFC and NAc neurons during a cocaine–heroin self-administration session. Whereas an increase in firing rate was observed after heroin self-administration in the mPFC neuron (Fig.5A), no significant change was found during cocaine self-administration (Fig. 5B). In the NAc, a decrease in neuronal activity was observed after cocaine self-administration (Fig.5D), whereas heroin self-administration did not induce any changes in the same neuron (Fig. 5C).
Fig. 5.

Comparison of post-drug infusion responses in simultaneously recorded mPFC and NAc neurons. A, Raster and perievent histogram plots for a mPFC neuron during the heroin self-administration trials of a heroin–cocaine self-administration session. An increase in firing rate was observed after heroin self-administration that occurred at 0 sec. B, Same neuron depicted in A during the cocaine self-administration period of the same session. No significant change in firing rate was found during cocaine self-administration.C, This NAc neuron did not change its firing rate after the lever press during the heroin self-administration trials.D, Same NAc neuron as in Cdisplayed an inhibitory response after cocaine self-administration during the same session. This neuron also exhibited an excitatory anticipatory response immediately before the lever press at 0 sec.
To compare the neuronal responses between cocaine and heroin self-administration, we divided the neuronal response into anticipatory excitatory (AE), anticipatory inhibitory (AI), postdrug excitatory (PE), postdrug inhibitory (PI), and no response (NR) categories. Some neurons with both anticipatory and postdrug responses were classified into both categories, therefore the sum total percentage of neurons with different responses exceeds 100%. Each neuron that exhibited one response was defined as a neuron response case; one neuron, when having both anticipatory and postdrug responses, can be classified into more than one neuron response case. Data for three different conditions are summarized in
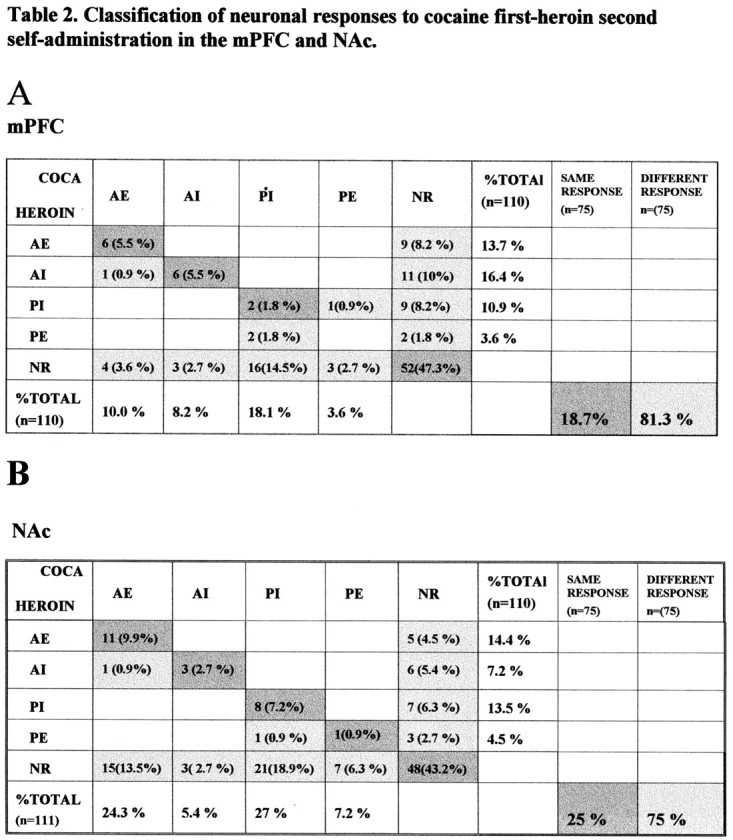
Distribution of neuronal responses during cocaine and heroin self-administration trials during cocaine-first, heroin-second sessions from 110 mPFC and 111 NAc neurons. A, Data from mPFC; the horizontal direction displays different types of responses for cocaine self-administration. Vertical direction shows the responses for heroin self-administration. Fifty-two (47.3% of 110) neurons exhibited no response to either the cocaine or heroin sessions. A single neuron may have more than one attribute by exhibiting more than one response in different categories. The 58 (of 110) neurons that did respond exhibited 75 neuron response cases across the different categories. Of these there were only 14 instances (18.7% of 75) when similar responses to both cocaine and heroin were observed. The dark shaded blocks in the diagonal show the neurons that share the same response during both cocaine and heroin self-administration segments. Light shaded blocks represent the neuron-response cases having different responses during cocaine and heroin self-administration. Sixty-one neuron response cases (81.3% of 75) responded differently during cocaine and heroin self-administration phases. B, Comparison of neuronal responses of the NAc during cocaine and heroin self-administration as in A. Only 25% of neurons exhibited the same response to both cocaine and heroin whereas 75% of neurons responded differently to cocaine and heroin self-administration.
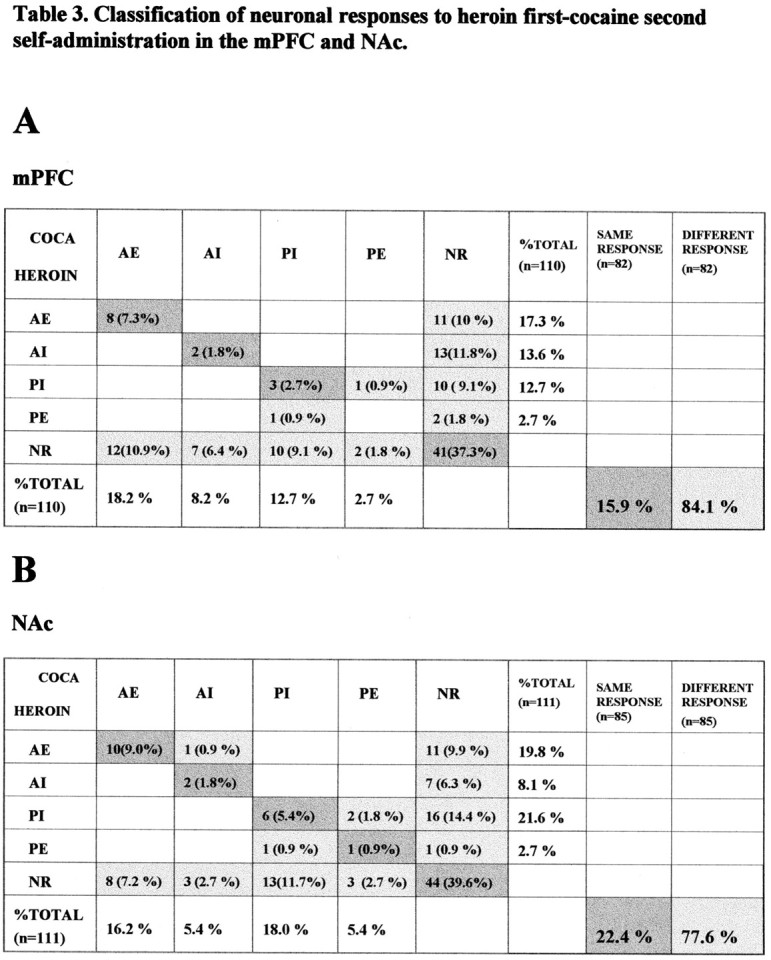
Comparison of neuronal activity during cocaine and heroin self-administration in the heroin-first, cocaine-second sessions. The format of the table is the same as Table 2. A, Comparison of mPFC neuronal activity during heroin and cocaine self-administration trials. Similar to what was observed in cocaine-first, heroin-second sessions in Table 2, most neuron-response cases responded to heroin and cocaine self-administration differently (84.1%), whereas only 15.9% of neuron-response cases shared the same response during heroin and cocaine self-administration trials. B, Comparison of the data obtained from NAc. Again, only 22.4% of neurons responded in the same way to both heroin and cocaine self-administration; the majority of neuron-response cases (77.6%) responded differently during heroin and cocaine self-administration trials.
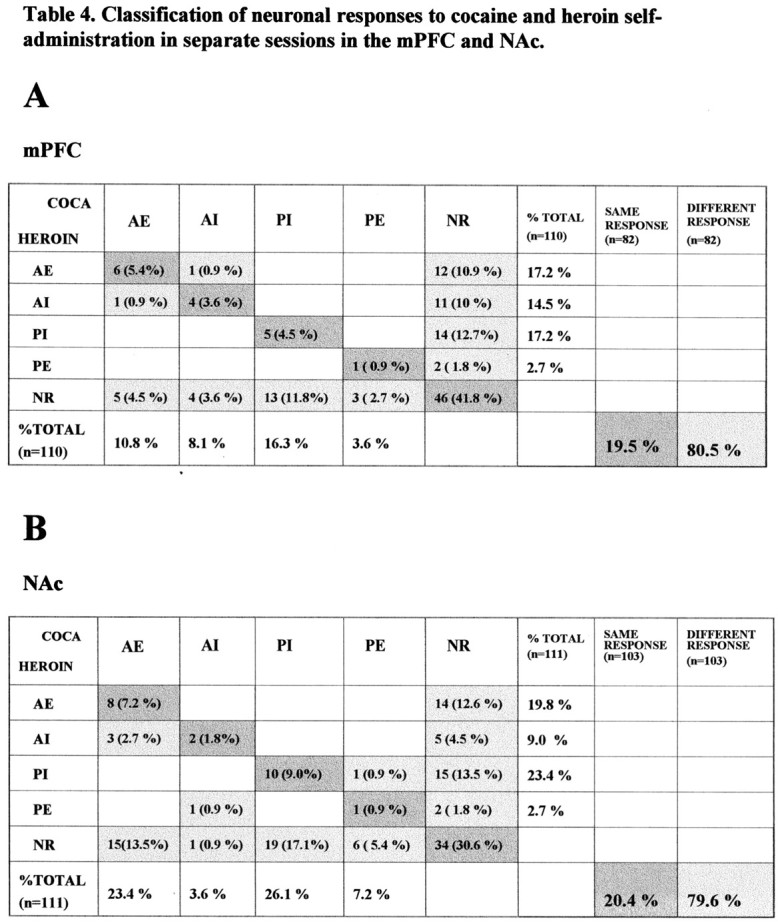
Comparison of mPFC and NAc neuronal responses to cocaine and heroin self-administration in separate sessions in which cocaine and heroin were self-administered first (same format as in Table 2). A, Data obtained from the mPFC; similar to the results obtained from cocaine and heroin self-administration in the same session (Tables 2, 3) the majority of neuron-response cases with a significant response responded to cocaine and heroin self-administration differently (80.5%); only 19.5% of neuron-response cases shared the same response to cocaine and heroin. B, Data obtained from NAc; only 20.4% of neuron-response cases responded in the same way to cocaine and heroin whereas 79.6% of neuron response cases responded differently to cocaine and heroin self-administration.
Tables 2–4. Table 2A summarizes data from the mPFC in cocaine-first, heroin-second sessions. The most evident finding was that the responding neurons were clearly not the same between cocaine and heroin. For example, in Table 2A, 47% of neurons did not change during any behavioral epoch during cocaine or heroin session. For the anticipatory excitatory response group, 15 of 110 (13.5%) were present during cocaine, and 11 of 110 (10%) were present during heroin self-administration. Only six (5.5%) neurons responded similarly with both cocaine and heroin. This is clearly above the number of co-responding neurons expected by chance (1.3%), but the two groups showed considerable difference, 14 of 20 of the anticipatory excitatory neurons were different in responding to cocaine and heroin. Also in other categories, most of the neurons with responses to cocaine or heroin self-administration responded differently to these two drugs. Overall, only 18.7% of these neuron response cases exhibited similar responses for both cocaine and heroin self-administration across all four response categories (Table 2A, dark shaded blocks in a diagonal line), whereas 81.3% of the neuron response cases responded differently during cocaine and heroin self-administration (light shaded blocks). As summarized by Table 2B, the response profile for the NAc was very similar to that observed in mPFC, with most neurons responding differently to cocaine and heroin self-administration.
Table 3 summarizes the data from heroin-first, cocaine-second sessions, in which the majority of neuronal responses recorded from both the mPFC and the NAc also differed during cocaine and heroin self-administration intervals.
Caution must be exercised when comparing neuronal activity within the dual-drug self-administration session because of a potential pharmacological interaction between the two self-administered drugs. Therefore, data from the first part of different sessions 24 hr apart were compared to eliminate the within-session interactions between cocaine and heroin. Table 4 shows the results of this comparison of neuronal responses during cocaine and heroin self-administration in different sessions. The results are similar to those obtained from the comparison of cocaine and heroin within the same session. In the mPFC, only 19.5% of neuron response cases exhibited similar responses for cocaine and heroin and 80.5% of neurons exhibited different responses. In the NAc, there were 19.2 and 79.6% for the same and different neuron response cases, respectively.
The independence of the neuronal responses observed during cocaine and heroin self-administration was revealed by a regression analysis performed with respect to two different conditions (cocaine first, heroin second and heroin first, cocaine second). Neurons with anticipatory and post-drug infusion responses in either the cocaine or heroin self-administration condition were selected and classified according to the type of response. Figure6A depicts the correlation between the cocaine and heroin self-administration conditions for anticipatory responses in the mPFC. The correlation coefficients for the responses to cocaine and heroin were 0.37 and 0.46 for cocaine-first and heroin-first sessions, respectively; both reached a significant level (p < 0.05). These weak correlations are what one expects when a few co-responding neurons are found within a predominantly independent population. Figure6B shows the regression analysis for anticipatory responses in the NAc for both drugs, with correlation coefficients of 0.27 and 0.14 for cocaine-first and heroin-first session, respectively; both failed to reach significance (p > 0.05). Correlations between cocaine and heroin post-drug infusion responses in the mPFC are plotted in Figure 6C. In this case, the slopes for the cocaine-first and heroin-first sessions were almost flat and parallel (r = 0.06 and 0.03 for cocaine-first and heroin-first sessions, respectively; p > 0.05). Figure6D plots data for the NAc, again revealing no significant correlations between cocaine and heroin responses (r = 0.05 and 0.12 for cocaine-first and heroin-first sessions, respectively; p > 0.05). Power analysis for type II error (β = 0.05) in which there would be a 5% chance of falsely identifying nonsignificant correlations revealed that the correlation coefficient would be at least >0.47.
Fig. 6.

Multiple regression analysis of the neuronal responses to cocaine and heroin self-administration from cocaine–heroin and heroin–cocaine sessions. A, Anticipatory responses recorded from the mPFC during the self-administration of cocaine and heroin in the same session. The responses were measured as a percentage change of neuronal activity. Two sessions were plotted in this figure: the cocaine-first, heroin-second session (n = 39, ○) and the heroin-first, cocaine-second session (n = 53, •). The correlation coefficient values (r) for cocaine-first and heroin-first sessions were 0.37 and 0.46, respectively. Both correlations were significant (p < 0.05). B, Same plot as in A for the NAc. The correlations between cocaine and heroin responses are not significant (p > 0.05) for either cocaine-first (r = 0.27;n = 43) or heroin-first sessions (r = 0.14; n = 40).C, Regression analysis for post-drug infusion responses recorded from the mPFC. The regression lines were nearly flat and parallel for cocaine and heroin self-administration in both cocaine-first (r = 0.06; n = 38) and heroin-first (r = 0.03;n = 29) conditions, and there were no significant correlations between cocaine and heroin responses. D, Same plot as in C for NAc. No significant correlations were observed between cocaine (r = 0.05;n = 48) and heroin (r = 0.12;n = 43) post-drug infusion responses.
Behavioral correlations of mPFC and NAc anticipatory neuronal responses during cocaine and heroin self-administration
A critical issue concerning the different anticipatory responses exhibited by the same neurons during cocaine and heroin self-administration is whether movement could have contributed to the different neuronal responses. It might be argued that the way in which a rat reaches for and then presses the lever differs when the subject is responding for cocaine or heroin. If this were the case, differences in neuronal activity generated before the lever press for cocaine or heroin reinforcement could be attributed to differences in locomotor behavior, rather than differences in motivational processes associated with cocaine and heroin reinforcement.
Off-line video analysis was conducted to determine whether locomotor activity before the lever press is a factor responsible for the different anticipatory neuronal activities before lever press. Although cocaine and heroin elicited different stereotypic behaviors after self-administration (cocaine self-administration most often caused head shaking and increased general locomotor activity, whereas heroin self-administration induced typical floor-licking behavior), of 10 rats analyzed for cocaine and heroin self-administration, only one showed a detectable difference in locomotor behavior, leading to the lever press for cocaine or heroin reinforcement. In this case, during heroin self-administration trials, the rat stayed away from the lever during heroin-stereotypical behavior and reached and pressed the lever for drug self-administration. In contrast, during cocaine self-administration trials, the rat stayed close beside the lever during the cocaine-stereotypical behavior and simply reared toward and pressed the lever for drug self-administration. Although each subject displayed a unique and characteristic behavioral sequence preceding and including the lever press, each of the remaining nine rats analyzed had no noticeable within-subject differences in locomotor behaviors leading to lever presses for cocaine or heroin.
Figure 7 illustrates the anticipatory neuronal activity in an NAc neuron in association with specific behavior episodes during cocaine and heroin self-administration. The same behavioral nodes of raising head and lever press are completed by the rat in a predictable sequence to accomplish cocaine and heroin self-administration. However, opposite neuronal responses were exhibited by this neuron during cocaine and heroin self-administration. Note that during cocaine self-administration trials, increased spike activity occurred during the raising head behavioral epoch, whereas during heroin self-administration trials, a decrease in spike activity was associated with the raising head behavior. Figure8 illustrates an example for an mPFC neuron during cocaine and heroin self-administration within the same session. The sequence leading to the lever press in this case is raising head → lever press → back to floor. During cocaine self-administration trials, a decrease in neuronal activity started with the raising head behavior and ended at the point when the paw of the rat returned back to the floor after completion of the lever press (Fig. 8A). No significant activity changes associated with the same behavior in the same neuron could be detected during heroin self-administration trials (Fig. 8B).
Fig. 7.

Behavioral correlations of an anticipatory neuronal response recorded from a NAc neuron. Behavioral nodes (raising head, lever press) were created by video analysis and used as reference points for the creation of the raster and perievent histogram plots. A, C, Plot of data during cocaine self-administration period. Note the increase in firing rate at the onset of the raising head behavioral episode as indicated by the arrow in A. The increased firing rate continued until the lever press.B, D, Same neuron during heroin self-administration within the same session. In contrast to cocaine self-administration, the identical raising head behavior during heroin self-administration was associated with a decrease in firing rate as indicated by the arrow inB. The decreased neuronal activity persisted until thelever press episode as depicted inD.
Fig. 8.
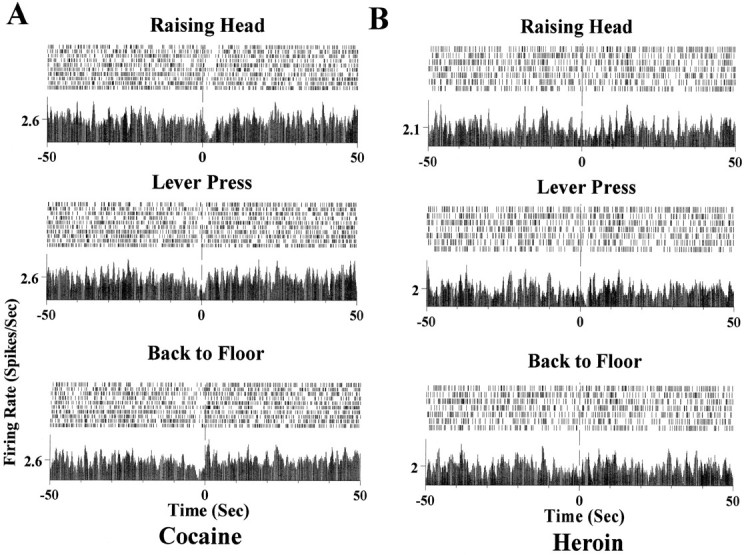
Behavioral correlations of the anticipatory neuronal activity recorded from a mPFC neuron. A, Fromtop to bottom, the panels demonstrate the behavioral sequence of raising head, lever press, andback to floor during cocaine self-administration trials. Note the onset of a decrease in spike activity at the raising head behavior episode (top panel). The decreased activity continued through the lever press episode (middle panel) and until the subject returned its paws back to the floor (bottom panel). B, The same neuron during heroin self-administration trials during the same session. No significant change in firing rate was detected during raising head, lever press, and return back to floor behavioral episodes.
Overall, the behavioral analysis indicates that different anticipatory responses observed before the lever presses for cocaine and heroin reinforcement are not primarily associated with different patterns of movement or locomotion.
Comparing overall neuronal firing rate during the period of cocaine and heroin self-administration
Self-administration of cocaine and heroin also produced long-lasting alterations of overall spike activity during the entire self-administration period. The mean firing rates of recorded neurons were compared during cocaine and heroin self-administration periods and also to the 200 sec control period at the beginning of the session (see Materials and Methods). Figure9 shows the result of this type of analysis for one heroin–cocaine session by depicting the firing rate of 19 neurons simultaneously recorded in mPFC and NAc from an individual subject. A long-lasting change in overall firing rate is apparent after the switch from heroin to cocaine. The asterisks denote the points where statistically significant firing rate changes occurred. A pattern of mean activity changes is also observed during a session of passive drug administration, as demonstrated in Figure10. Figure 10A shows the overall neuronal activity changes during a heroin–cocaine self-administration session. Asterisks on the right of individual strip charts indicate the neurons with significant alterations in firing rates when switched from heroin to cocaine self-administration. Figure10B depicts the same neurons recorded in the following session during which same dose of heroin (30 μg/kg per infusion) and cocaine (1 mg/kg per infusion) were administered by computer on a random interval schedule based on the average interinfusion interval during the previous self-administration session. Similar neuronal activity changes were observed as during the self-administration session when the two drugs were switched.
Fig. 9.
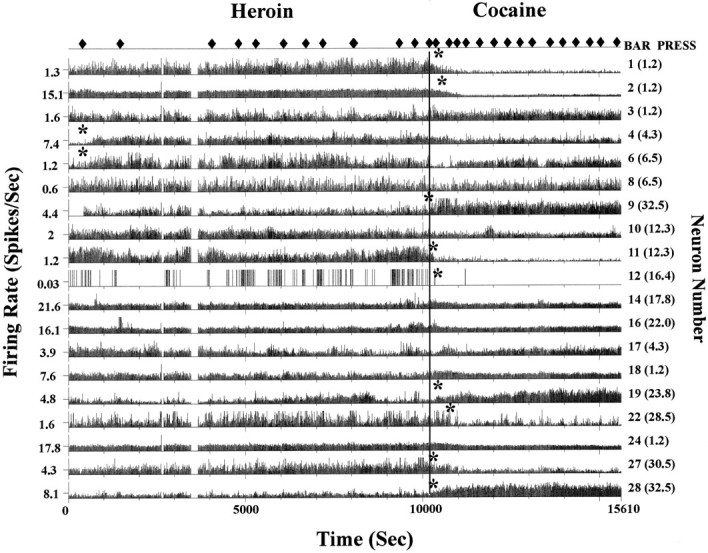
Baseline neuronal activity changes during a heroin–cocaine self-administration session. This rate meter record shows 19 neurons simultaneously recorded from the mPFC and from the NAc (mPFC neurons are indicated by 1–16 in theparentheses along the right y-axis; NAc neurons are indicated by 17–32). Neurons with changes in baseline neuronal activity are marked by an asterisk. Note that many of the changes after the switch to the cocaine reinforcer (vertical line) are inhibitory.
Fig. 10.
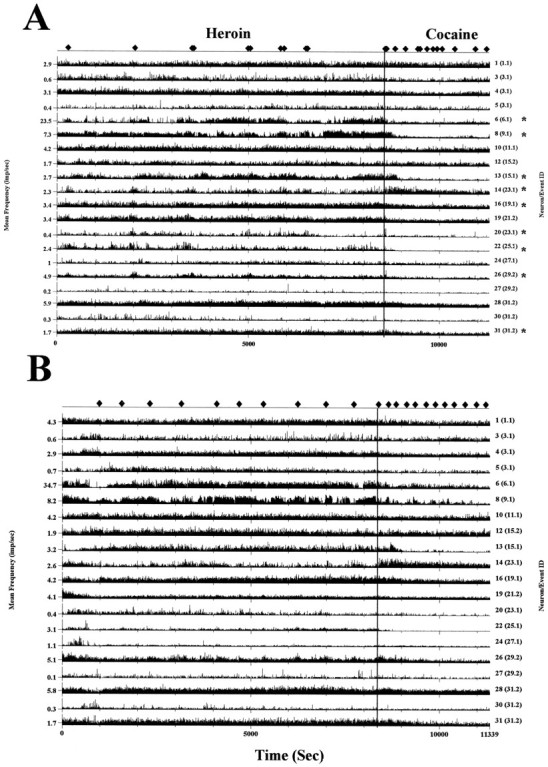
Comparison of baseline neuronal activities between self and passive administering heroin–cocaine.A, Twenty neurons recorded simultaneously in the mPFC and the NAc during heroin–cocaine self-administration session (see Fig. 9 for neuron identification). Alteration of neuronal activity induced by switching from heroin to cocaine, indicated by avertical line, was observed in several neurons (*).B, The next day, a computer-controlled, passive administration of heroin–cocaine was performed in the same animal with the same dose of cocaine (1 mg/kg per infusion) and heroin (30 μg/kg per infusion) used in self-administration sessions. The interinfusion interval was randomly selected by computer using the range of mean ± SE calculated from self-administration session in A. Note that the same pattern of neuronal activity changes occurred in comparison to the neurons marked in A. ♦, Bar press inA and passive drug infusion in B.
Table 5 compares the overall neuronal activity (firing rates) of mPFC and NAc neurons in different conditions, with the results expressed as percent change from the initial 200 sec baseline recordings taken just before the first trial of the self-administration session. In general, more neurons showed overall decreases in firing rates during cocaine self-administration phase than in the heroin self-administration phase. In both the mPFC and the NAc, 2 × 2 contingency table test revealed a significant difference between the number of neurons responding by increasing or decreasing their mean activity in response to cocaine and heroin in heroin-first, cocaine-second sessions (p < 0.05). When comparing the overall neuronal activity during cocaine self-administration with heroin self-administration (rather than with the baseline control period) more neurons were found to decrease than increase their firing rate in the cocaine phase. The χ2 goodness of fit test revealed a significant difference between the number of excitatory response neurons and inhibitory response neurons in heroin-first, cocaine-second sessions (p < 0.05 in mPFC; p < 0.01 in NAc; Table 5). Figure 11 is a scatter plot that illustrates the distribution of firing rate changes of individual neurons for the heroin-first, cocaine-second sessions in the mPFC and the NAc using the same data as in Table 5.
Table 5.
Comparing the average neuronal activity during cocaine and heroin self-administration in the same session
| Type of responses | Cocaine vs control | Heroin vs control | Cocaine vs heroin (n = 58) | |||||||
|---|---|---|---|---|---|---|---|---|---|---|
| % changes in firing rate | n | % of total | % Changes in firing rate | n | % of total | % Changes in firing rate | n | % of total | ||
| mPFC | ||||||||||
| Heroin first, cocaine second n = 49 | Excitatory | 115.2 ± 24.9 | 7* | 14.3 | 167.3 ± 47.0 | 14 | 28.6 | 92.3 ± 18.8 | 9a | 15.5 |
| Inhibitory | −62.6 ± 3.5 | 28* | 57.1 | −55.1 ± 3.7 | 17 | 35.3 | −56.2 ± 3.9 | 30 | 51.7 | |
| Cocaine first, heroin second n = 40 | Excitatory | 171.0 ± 63.4 | 7 | 17.5 | 187.5 ± 38.9 | 13 | 32.5 | 164.5 ± 101.6 | 10 | 25.0 |
| Inhibitory | −51.7 ± 3.7 | 21 | 52.5 | −50.3 ± 4.2 | 16 | 40.0 | −47.2 ± 5.6 | 19 | 47.5 | |
| NAc | ||||||||||
| Heroin first, cocaine secondn = 67 | Excitatory | 158.5 ± 24.3 | 15* | 22.4 | 103.9 ± 20.9 | 22 | 32.8 | 220.2 ± 54.6 | 17b | 25.4 |
| Inhibitory | −64.7 ± 3.1 | 42* | 62.7 | −49.5 ± 3.3 | 23 | 34.3 | −64.7 ± 3.1 | 42 | 62.7 | |
| Cocaine first, heroin second n = 52 | Excitatory | 414.1 ± 77.3 | 9 | 17.3 | 294.5 ± 88.6 | 17 | 32.6 | 265.9 ± 59.2 | 17 | 32.6 |
| Inhibitory | −62.0 ± 4.3 | 29 | 55.7 | −66.7 ± 3.6 | 26 | 50.0 | −58.3 ± 3.8 | 26 | 50.0 | |
Comparison of overall firing rates during cocaine and heroin self-administration within the same session. The neuronal activity during the entire period of either cocaine or heroin self-administration was compared with each other and with the control period (200 sec at the beginning of the session). The comparisons were made in heroin-first, cocaine-second and cocaine-first, heroin-second sessions for the mPFC (top panel) and the NAc (bottom panel). The comparison between cocaine and heroin self-administration trials is expressed as percentage change as follows: [(cocaine firing rate-heroin firing rate)/heroin firing rate] × 100. χ22 × 2 contingency table tests were used to test whether different numbers of neurons showed excitatory and inhibitory responses under conditions of cocaine and heroin self-administration. Significant differences were observed in heroin first, cocaine second sessions in both the mPFC and NAc (*significantly different number of neurons having excitatory and inhibitory responses as compared to heroin self-administration phase, p < 0.05). χ2goodness of fit test was used to determine whether significantly different numbers of neurons showed excitatory and inhibitory responses when compared between drug conditions. More neurons were inhibited than excited during cocaine self-administration in comparison with heroin self-administration phase (ap < 0.05, bp < 0.01).
Fig. 11.

Scatter plots of the overall firing rates of mPFC and NAc neurons during cocaine and heroin self-administration and the control period. All the plots are constructed from heroin-first, cocaine-second sessions. A, Comparison of the firing rates recorded from the mPFC during cocaine and heroin self-administration conditions with the control period of that session. The ordinate depicts the firing rate (spikes per second) during cocaine and heroin self-administration trials, and theabscissa depicts the firing rate (spikes per second) for the control condition. Inhibitory responses elicited by cocaine (○) and heroin (•) are under the line that represents the control responses (□), whereas excitatory responses induced by cocaine (▵) and heroin (▴) are above the controlline. B, Same plot as Afor NAc. C, Comparison of the firing rates recorded from the mPFC during cocaine and heroin self-administration periods. Firing rates (spikes per second) during the cocaine self-administration period are represented along the ordinate, and the firing rates during the heroin self-administration trials are represented along theabscissa. Inhibitory responses (•) are defined as a decrease in firing rate under the cocaine self-administration condition in comparison with the heroin self-administration condition. Excitatory responses (▵) are defined as an increase in firing rate under cocaine self-administration in comparison with the heroin self-administration condition. Note that more neurons exhibited inhibitory responses under the cocaine self-administration condition. D, Same plot as in C for the NAc.
Histological localization of recording sites
Recording sites were localized by a potassium ferrincyanide staining method to reveal the iron deposited at the tips of selected microwires. Figure 12 depicts the location of microwires in mPFC (Fig. 12A) and NAc (Fig. 12B). Because it is difficult to distinguish more than two locations with respect to distinct iron deposit sizes, priority was given to wires from which neurons with anticipatory responses were recorded. The remaining six wires from the same bundle are located in close proximity to the marked wires.
Fig. 12.

Histological location of recording sites in mPFC (A) and NAc (B) revealed by potassium ferricyanide staining of iron deposited by current applied to recording microwires. Cg1, Cingulate cortex area 1;Cg2, cingulate cortex area 2; Cg3, cingulate cortex area 3; IL, infralimbic cortex;mo, medial orbital cortex; vlo, ventrolateral orbital cortex; Fr1, frontal cortex area 1; Fr2, frontal cortex area 2; AcbC, nucleus accumbens core; AcbSh, nucleus accumbens shell.
DISCUSSION
The present experiment was designed to compare the neuronal responses during cocaine and heroin self-administration under three different conditions: (1) sessions started with cocaine and followed by heroin, (2) sessions started with heroin and followed by cocaine, and (3) a comparison of the first drugs tested from the sessions in 1 and 2 that were 24 hr apart. The experiment was designed in this manner so that data obtained from the same session control for nonstationarity in neural activity; that is, results formed in conditions 1 and 2 are independent of drug effects across different sessions. Furthermore, condition 3, which compares the data from different sessions in which cocaine or heroin was self-administered first, respectively, controls for potential pharmacological interactions between cocaine and heroin within the same session. The results indicated that most neurons responded differently in all three conditions during operant tasks to self-administer cocaine versus heroin, indicating that neither day-to-day neuronal variability nor within-session drug interactions can readily account for the distinctly different neuronal activity patterns observed during self-administration of the two drugs.
In our previous studies, we postulated that two separate neuronal mechanisms within the NAc and the mPFC underlie drug self-administration (Chang et al., 1990, 1994; Chang and Woodward, 1996). First, the anticipatory responses that are evident before the lever press for drug reinforcement are postulated to represent the neuronal basis of a motivational process, leading to movements to complete the task. This type of neuronal response was demonstrated to be dopamine-independent in the studies of cocaine self-administration (Chang et al., 1994). Second, the time of occurrence of the post-drug infusion responses suggests that they might reflect the direct reinforcing effects of the infused drug. These post-drug infusion responses, in the case of cocaine self-administration, are partially mediated by dopamine transmission (Chang et al., 1994), because they could be blocked by dopamine antagonists in some cases. In the present study, predominately different neuronal responses were recorded from the same neurons during cocaine and heroin self-administration, both before and after the lever press (both anticipatory and post-drug infusion responses) within both the mPFC and the NAc. Thus the neuronal responses provided little evidence for a common action of released endogenous dopamine. This conclusion was true for all three comparison conditions described above; in all three conditions, most of the neurons that did respond to cocaine and heroin self-administration did so differently. These results suggest that cocaine and heroin not only act on different receptors to exert reinforcing effects as determined by their different pharmacological properties but also may activate different neuronal circuits leading to drug self-administration.
The now routine but novel experimental observation of mean firing rates of neurons in ensembles during long behavior sessions will yield new insights into the information within neuron populations across states. Background firing rates appear to specify unique patterns corresponding to each new behavioral context. This introduces an apparent confound in that the presence of a phasic response to a lever press during cocaine or heroin self-administration either may be attributed to the different context in which a similar behavior occurs or may be a simple consequence of a background rate change. However, clear instances are readily found in which changes are different during cocaine versus heroin sessions when background rates are similar (Figs. 2-4). The assertion clearly can be made that a subset of neurons responds differently in the context of cocaine versus heroin self-administration. We have elected to use within-session firing rate criteria to control for background rate by searching for the presence of effects (a 20% absolute rate change and a significantp < 0.01) that are independent of rate. Our hypothesis is that the patterns of background activity in the mPFC and the NAc represent the expression of response contingencies specific to a context. This concept will require extended future study.
Anticipatory responses
Previous work suggested that anticipatory responses observed before lever presses for cocaine reinforcement are unlikely to be associated with locomotion per se, because a detailed video analysis revealed that locomotion not associated with the lever press for cocaine failed to alter spike activity (Chang et al., 1994). In this study, an important issue concerning the different anticipatory responses during cocaine and heroin self-administration is whether the anticipatory responses that are linked in time to a specific locomotor action existed only in one drug self-administration condition. If major differences in locomotor activity did occur just before the lever press for cocaine or heroin, it is possible that the different anticipatory neuronal responses simply represent activity time-locked to different locomotor behaviors and not to different motivational processes. Therefore, the video analysis of lever press behaviors for cocaine and heroin self-administration is crucial to resolving this issue. We found that in 9 of 10 rats, the behavioral context leading to the lever press was similar for both cocaine and heroin self-administration. Thus, different neuronal responses were present before the lever press during cocaine and heroin self-administration, even when associated with a specific, identical behavioral episode (Figs. 7, 8). This finding supports the idea that distinct anticipatory responses observed in the majority of neurons during cocaine and heroin self-administration reflect unique and specific neuronal circuits selectively involved in cocaine- or heroin-seeking behaviors.
Although a minority (less than one-third in any given condition), there are cases in which similar anticipatory responses are found for both cocaine and heroin self-administration in the same neurons within the mPFC and the NAc. Our interpretation is that the neurons exhibiting similar anticipatory response may represent an embedded mesocorticolimbic neuronal circuit that encodes a signal common to the task to obtain reinforcement. Most anticipatory neurons, on the other hand, may be specialized through learning to encode unique information only associated with either cocaine or heroin self-administration.
Postdrug responses
Post-drug infusion responses are likely to be associated with the reinforcing mechanism of drug self-administration. These responses span much of the intertrial interval and are found to be partially blocked by dopamine receptor antagonists in the case of cocaine self-administration (Chang et al., 1994). If cocaine and heroin exerted a common reinforcing effect, we would expect to see similar neuronal responses in the same mPFC and NAc neurons after cocaine and heroin self-administration. However, as observed for anticipatory responses, a majority of neurons in mPFC and NAc responded differently during the post-drug infusion period for the two drugs.
Mean firing rates
Similar differences were observed when the overall neuronal activity across the entire cocaine and heroin self-administration segments of the sessions was compared. More neurons were found to be inhibited (i.e., an overall decrease in firing rate) by cocaine than by heroin self-administration. These changes in neuronal activity may be attributable to the unique pharmacological effects of the drugs and/or the conditioned responses associated with operant behavior during self-administration. Importantly, the passive administration of intravenous cocaine and heroin to well trained subjects elicits very similar overall changes in mean spike activity, as observed during the dual-drug self-administration sessions. This suggests that a substantial part of neuronal activity changes during cocaine and heroin self-administration may be attributed to the pharmacological effects of the respective drugs on receptor targets, which then propagate widely to influence steady-state activity throughout the mesocorticolimbic system.
Cocaine and heroin reinforcement and the mesocorticolimbic system
Cell body lesions of the NAc after kainic acid injection attenuate both cocaine and heroin self-administration (Zito et al., 1985). Furthermore, microinjection of dopamine and opiate receptor antagonists into the NAc interrupts cocaine and heroin self-administration, respectively (Vaccarino et al., 1985; Corrigall and Vaccarino 1988;Caine et al., 1995). Thus the notion of a common neural circuit for obtaining reinforcement at the level of the NAc is well supported.
The specific role of VTA dopaminergic projections to the NAc in opiate self-administration has been debated. It has been reported that destruction of dopamine terminals in the NAc and systemic application of dopamine antagonist more strongly disrupted cocaine than heroin self-administration in the rat (Ettenberg et al., 1982; Pettit et al., 1984). However, extracellular dopamine levels are reported to fluctuate in relation to both cocaine-reinforced (Petit and Justice, 1989, 1991) and heroin-reinforced (Wise et al., 1995a) (but see Hemby et al., 1995) operant responding. Moreover, a number of neurochemical studies indicate that opiates stimulate dopamine release in mPFC and NAc, a net effect similar to that produced by cocaine but by different mechanisms (Di Chiara and Imperato, 1988; Spanagel et al., 1990, 1992;Leone et al., 1991; Yokoo et al., 1994; Wise et al., 1995b). Heroin has been proposed to increase dopamine release via opioid receptor-mediated suppression of GABA release from GABA interneurons that tonically suppress dopamine neuron firing (Johnson and North, 1992), whereas cocaine blocks reuptake from DA terminals. On the other hand, the effect of cocaine and heroin on the firing rate of VTA dopamine neurons appears to be opposite in in vitro and anesthetized preparations (Gysling and Wang, 1983; Matthews and German, 1984;Einhorn et al., 1988; Brodie and Dunwiddie, 1990; Lacey et al., 1990) as well as during self-administration and pharmacological passive administration (preliminary observation from this laboratory). Other studies report that naloxone alters the self-administration of low (0.1 mg/kg per infusion) doses of cocaine (Carroll et al., 1986; Corrigall and Coen, 1991; Ramsey and van Ree, 1991). In this study, we used 1 mg/kg per infusion for cocaine self-administration, which is 10 times higher than the dose influenced by naloxone. The doses of cocaine and heroin in this study were chosen to balance the maximum reinforcing effect with reasonable response rates. In addition, similar doses are widely used by other laboratories in the study of cocaine and heroin self-administration (Corrigall and Vaccarino 1988).
Functional concepts
Based on current and previous results, we hold to the concept that representation of memories and processing of sensory cues and other signals may be very different within the mesocorticolimbic system during the performance of operant tasks resulting in cocaine and heroin self-administration. As a result, two different, yet overlapping, neuronal networks may be used during the acquisition of cocaine and heroin self-administration behaviors. Neuronal activity in these coextensive networks may correspond to two different reinforcement contexts. The different neuronal responses observed in the mesocorticolimbic system during cocaine and heroin self-administration may represent a switch from one context of drug reinforcement to another, with the same neuron behaving differently depending on which neuronal circuit has become switched on. These may be similar to the different activity patterns reported in primate prefrontal cortex specific to the anticipation of different rewards (Watanabe, 1996).
Because both cocaine and heroin actions may evoke dopamine release, although by different mechanisms, the question arises of how different functional neuronal circuits of the NAc and mPFC may emerge. Within a session the self-infusion of the second reinforced drug may evoke interoceptive stimuli that trigger the activation of different appropriate circuits for initiating behavior. Midbrain dopamine systems may play a role in facilitating the learning required to make these rapid adjustments, because blocking DA receptor causes self-administration to cease. Other studies (Schultz et al., 1997) suggest that dopamine release yields reinforcement by acting as a learning or teaching signal that alters associated responses to cues that are predictive of future reward. In this way stable and different activity patterns may by created by different reinforcers.
In summary, predominantly different neuronal responses were detected when neural activity during cocaine and heroin self-administration was compared. Differences were observed in both anticipatory responses and postdrug responses. In light of the evidence that a majority of neurons exhibited different responses to cocaine and heroin self-administration, the results support the notion that specific, separate, but anatomically overlapping, central mechanisms are in part responsible for cocaine and heroin self-administration.
Footnotes
This study was supported by National Institute on Drug Abuse Grant DA 2338 to D.J.W. We thank Dr. David Reboussin for help with statistics and Lu Chen for technical assistance.
Correspondence should be addressed to Dr. Jing-Yu Chang, Department of Physiology and Pharmacology, Wake Forest University, School of Medicine, Winston-Salem, NC 27157.
REFERENCES
- 1.Berendse HW, Galis-de Graaf Y, Groenewegen HJ. Topographical organization and relationship with ventral striatal compartments of prefrontal corticostriatal projections in the rat. J Comp Neurol. 1992;316:314–347. doi: 10.1002/cne.903160305. [DOI] [PubMed] [Google Scholar]
- 2.Brodie MS, Dunwiddie TV. Cocaine effects in the ventral tegmental area: evidence for an indirect dopaminergic mechanism of action. Naunyn Schmiedebergs Arch Pharmacol. 1990;342:660–665. doi: 10.1007/BF00175709. [DOI] [PubMed] [Google Scholar]
- 3.Caine SB, Heinriches SC, Coffin VL, Koob GF. Effects of the dopamine D-1 antagonist SCH23390 microinjected into the accumbens, amygdala or striatum on cocaine self-administration in the rat. Brain Res. 1995;692:47–56. doi: 10.1016/0006-8993(95)00598-k. [DOI] [PubMed] [Google Scholar]
- 4.Carroll MA, Lac ST, Walker MJ, Kragh R, Newman T. Effects of naltrexone on intravenous cocaine self-administration in rats during food satiation and deprivation. J Pharmacol Exp Ther. 1986;238:1–7. [PubMed] [Google Scholar]
- 5.Chang J-Y, Woodward DJ. Single neuronal activity in mesolimbic system during cocaine and heroin self-administrations in freely moving rats. Soc Neurosci Abstr. 1996;22:927. [Google Scholar]
- 6.Chang J-Y, Sawyer SF, Lee R-S, Maddux BN, Woodward DJ. Activity of neurons in nucleus accumbens during cocaine self-administration in freely moving rats. Soc Neurosci Abstr. 1990;16:252. [Google Scholar]
- 7.Chang J-Y, Sawyer SF, Lee R-S, Woodward DJ. Electrophysiological and pharmacological evidence for the role of the nucleus accumbens in cocaine self-administration in freely moving rats. J Neurosci. 1994;14:1224–1244. doi: 10.1523/JNEUROSCI.14-03-01224.1994. [DOI] [PMC free article] [PubMed] [Google Scholar]
- 8.Chang J-Y, Sawyer SF, Paris JM, Kirillov AB, Woodward DJ. Single neuronal responses in medial prefrontal cortex during cocaine self-administration in freely moving rats. Synapse. 1997a;26:22–35. doi: 10.1002/(SICI)1098-2396(199705)26:1<22::AID-SYN3>3.0.CO;2-G. [DOI] [PubMed] [Google Scholar]
- 9.Chang J-Y, Zhang LL, Janak P, Woodward DJ. Neuronal responses in media frontal cortex and nucleus accumbens during heroin self-administration in freely moving rats. Brain Res. 1997b;754:12–20. doi: 10.1016/s0006-8993(97)00012-7. [DOI] [PubMed] [Google Scholar]
- 10.Corrigall WA, Coen KM. Opiate antagonists reduce cocaine but not nicotine self administration. Psychopharmacology. 1991;104:167–170. doi: 10.1007/BF02244173. [DOI] [PubMed] [Google Scholar]
- 11.Corrigall WA, Vaccarino FJ. Antagonist treatment in nucleus accumbens or periaqueductal gray affects heroin self-administration. Pharmacol Biochem Behav. 1988;30:443–450. doi: 10.1016/0091-3057(88)90478-9. [DOI] [PubMed] [Google Scholar]
- 12.Deniau JM, Menetrey A, Thierry AM. Indirect nucleus accumbens input to the prefrontal cortex via the substantia nigra pars reticulata: a combined anatomical and electrophysiological study in the rat. Neuroscience. 1994;61:533–545. doi: 10.1016/0306-4522(94)90432-4. [DOI] [PubMed] [Google Scholar]
- 13.Di Chiara G, Imperato A. Drugs abused by humans preferentially increase synaptic dopamine concentrations in the mesolimbic system of freely moving rats. Proc Natl Acad Sci USA. 1988;85:5274–5278. doi: 10.1073/pnas.85.14.5274. [DOI] [PMC free article] [PubMed] [Google Scholar]
- 14.Einhorn LC, Johansen PA, White FJ. Electrophysiological effects of cocaine in the mesoaccumbens dopamine system: studies in the ventral tegmental area. J Neurosci. 1988;8:100–112. doi: 10.1523/JNEUROSCI.08-01-00100.1988. [DOI] [PMC free article] [PubMed] [Google Scholar]
- 15.Ettenberg A, Pettit HO, Bloom FE, Koob GF. Heroin and cocaine intravenous self-administration in rats: mediated by separate neural systems. Psychopharmacology. 1982;78:204–209. doi: 10.1007/BF00428151. [DOI] [PubMed] [Google Scholar]
- 16.Gerrits MA, Van Ree JM. Effect of nucleus accumbens dopamine on motivational aspects involved in initiation of cocaine and heroin self-administration in rats. Brain Res. 1996;713:114–124. doi: 10.1016/0006-8993(95)01491-8. [DOI] [PubMed] [Google Scholar]
- 17.Glick S, Cox R. Changes in morphine self-administration after Tel-Diencephalic lesions in rats. Psychopharmacology. 1978;57:283–288. doi: 10.1007/BF00426752. [DOI] [PubMed] [Google Scholar]
- 18.Goeders NE, Smith JE. Cortical dopaminergic involvement in cocaine reinforcement. Science. 1983;221:773–775. doi: 10.1126/science.6879176. [DOI] [PubMed] [Google Scholar]
- 19.Goeders NE, Smith JE. Reinforcing properties of cocaine in the medial prefrontal cortex: primary action on presynaptic dopaminergic terminals. Pharmacol Biochem Behav. 1986;25:191–199. doi: 10.1016/0091-3057(86)90252-2. [DOI] [PubMed] [Google Scholar]
- 20.Groenewegen HJ. Organization of the afferent connections of the mediodorsal thalamic nucleus in the rat, related to the mediodorsal-prefrontal topography. Neuroscience. 1988;24:379–431. doi: 10.1016/0306-4522(88)90339-9. [DOI] [PubMed] [Google Scholar]
- 21.Groenewegen HJ, Berendse HW, Wolters JG, Lohman HM. The anatomical relationship of the prefrontal cortex with the striatopallidal system, the thalamus and the amygdala: evidence for a parallel organization. Prog Brain Res. 1990;85:95–118. doi: 10.1016/s0079-6123(08)62677-1. [DOI] [PubMed] [Google Scholar]
- 22.Gysling K, Wang RY. Morphine-induced activation of A10 dopamine neurons in the rat. Brain Res. 1983;277:119–127. doi: 10.1016/0006-8993(83)90913-7. [DOI] [PubMed] [Google Scholar]
- 23.Hemby SE, Martin TJ, Co C, Dworkin SI, Smith JE. The effects of intravenous heroin administration on extracellular nucleus accumbens dopamine concentrations as determined by in vivo microdialysis. J Pharmacol Exp Ther. 1995;273:591–598. [PubMed] [Google Scholar]
- 24.Johnson SW, North RA. Opioids excite dopamine neurons by hyperpolarization of local interneurons. J Neurosci. 1992;12:483–488. doi: 10.1523/JNEUROSCI.12-02-00483.1992. [DOI] [PMC free article] [PubMed] [Google Scholar]
- 25.Kiyatkin EA, Stein EA. Conditioned changes in nucleus accumbens dopamine signal established by intravenous cocaine in rats. Neurosci Lett. 1996;211:73–76. doi: 10.1016/0304-3940(96)12731-2. [DOI] [PubMed] [Google Scholar]
- 26.Koob G. Drugs of abuse: anatomy, pharmacology and function of reward pathways. Trends Pharmacol Sci. 1992;13:177–184. doi: 10.1016/0165-6147(92)90060-j. [DOI] [PubMed] [Google Scholar]
- 27.Lacey MG, Mercuri NB, North RA. Actions of cocaine on rat dopaminergic neurons in vitro. Br J Pharmacol. 1990;99:731–735. doi: 10.1111/j.1476-5381.1990.tb12998.x. [DOI] [PMC free article] [PubMed] [Google Scholar]
- 28.Leone P, Pocock D, Wise RA. Morphine-dopamine interaction: ventral tegmental morphine increases nucleus accumbens dopamine release. Pharmacol Biochem Behav. 1991;39:469–472. doi: 10.1016/0091-3057(91)90210-s. [DOI] [PubMed] [Google Scholar]
- 29.Mansour A, Khachaturian H, Lewis ME, Akil H, Watson SJ. Autoradiographic differentiation of mu, delta, and kappa opioid receptors in the rat forebrain and midbrain. J Neurosci. 1987;7:2445–2464. [PMC free article] [PubMed] [Google Scholar]
- 30.Mansour A, Fox CA, Burke S, Meng F, Thompson RC, Akil H, Watson SJ. Mu, delta, and kappa opioid receptor mRNA expression in the rat CNS: an in situ hybridization study. J Comp Neurol. 1994;350:412–438. doi: 10.1002/cne.903500307. [DOI] [PubMed] [Google Scholar]
- 31.Martin-Inverson MT, Szostak C, Fibiger HC. 6-hydroxydopamine lesions of the medial frontal cortex fail to influence intravenous self-administration of cocaine. Psychopharmacology. 1986;88:310–314. doi: 10.1007/BF00180830. [DOI] [PubMed] [Google Scholar]
- 32.Matthews R, German D. Electrophysiological evidence for excitation of rat ventral tegmental area dopamine neurons by morphine. Neuroscience. 1984;11:617–625. doi: 10.1016/0306-4522(84)90048-4. [DOI] [PubMed] [Google Scholar]
- 33.Naito A, Kita H. The cortico-nigral projection in the rat: an anterograde tracing study with biotinylated dextran amine. Brain Res. 1994;637:317–322. doi: 10.1016/0006-8993(94)91252-1. [DOI] [PubMed] [Google Scholar]
- 34.Paxinos G, Watson C. The rat brain in stereotaxic coordinates. Academic; San Diego: 1986. [DOI] [PubMed] [Google Scholar]
- 35.Pettit HO, Justice JB., Jr Dopamine in the nucleus accumbens during cocaine self-administration as studied by in vivo microdialysis. Pharmacol Biochem Behav. 1989;34:899–904. doi: 10.1016/0091-3057(89)90291-8. [DOI] [PubMed] [Google Scholar]
- 36.Pettit HO, Justice JB., Jr Effect of dose on cocaine self-administration behavior and dopamine levels in the nucleus accumbens. Brain Res. 1991;539:94–102. doi: 10.1016/0006-8993(91)90690-w. [DOI] [PubMed] [Google Scholar]
- 37.Pettit HO, Ettenberg A, Bloom FE, Koob GF. Destruction of dopamine in the nucleus accumbens selectively attenuates cocaine but not heroin self-administration in rats. Psychopharmacology. 1984;84:167–173. doi: 10.1007/BF00427441. [DOI] [PubMed] [Google Scholar]
- 38.Ramsey NF, van Ree JM. Intracerebroventricular naltrexone treatment attenuates acquisition of intravenous cocaine self-administration in rats. Pharmacol Biochem Behav. 1991;40:807–810. doi: 10.1016/0091-3057(91)90090-o. [DOI] [PubMed] [Google Scholar]
- 39.Schultz W, Dayan P, Montague PR. A neural substrate of prediction and reward. Science. 1997;275:1593–1599. doi: 10.1126/science.275.5306.1593. [DOI] [PubMed] [Google Scholar]
- 40.Spanagel R, Herz A, Shippenberg TS. The effects of opioid peptides on dopamine release in the nucleus accumbens: an in vivo microdialysis study. J Neurochem. 1990;55:1734–1740. doi: 10.1111/j.1471-4159.1990.tb04963.x. [DOI] [PubMed] [Google Scholar]
- 41.Spanagel R, Herz A, Shippenberg TS. Opposing tonically active endogenous opioid systems modulate the mesolimbic dopaminergic pathway. Proc Natl Acad Sci USA. 1992;89:2046–2050. doi: 10.1073/pnas.89.6.2046. [DOI] [PMC free article] [PubMed] [Google Scholar]
- 42.Tempel A, Zukin RS. Neuroanatomical patterns of the μ, ς and κ opioid receptors of rat brain as determined by quantitative in vitro autoradiography. Neurobiol. 1987;84:4038–4312. doi: 10.1073/pnas.84.12.4308. [DOI] [PMC free article] [PubMed] [Google Scholar]
- 43.Vaccarino FJ, Bloom FE, Koob GF. Blockade of nucleus accumbens opiate receptors attenuates intravenous heroin reward in the rat. Psychopharmacology. 1985;86:37–42. doi: 10.1007/BF00431681. [DOI] [PubMed] [Google Scholar]
- 44.Watanabe M. Reward expectancy in primate prefrontal neurons. Nature. 1996;382:629–632. doi: 10.1038/382629a0. [DOI] [PubMed] [Google Scholar]
- 45.Wise RA. Addictive drugs and brain stimulation reward. Ann Rev Neurosci. 1996;19:319–340. doi: 10.1146/annurev.ne.19.030196.001535. [DOI] [PubMed] [Google Scholar]
- 46.Wise RA, Bozarth MA. Brain mechanisms of drug reward and euphoria. Psychiatr Med. 1985;3:445–460. [PubMed] [Google Scholar]
- 47.Wise RA, Rompre PP. Brain dopamine and reward. Ann Rev Psychol. 1989;40:191–225. doi: 10.1146/annurev.ps.40.020189.001203. [DOI] [PubMed] [Google Scholar]
- 48.Wise RA, Leone P, Rivest R, Leeb K. Elevations of nucleus accumbens dopamine and DOPAC lever during intravenous heroin self-administration. Synapse. 1995a;21:140–148. doi: 10.1002/syn.890210207. [DOI] [PubMed] [Google Scholar]
- 49.Wise RA, Newton P, Leeb K, Burnette B, Pocock D, Justice JB. Fluctuations in nucleus accumbens dopamine concentration during intravenous cocaine self-administration in rats. Psychopharmacology. 1995b;120:10–20. doi: 10.1007/BF02246140. [DOI] [PubMed] [Google Scholar]
- 50.Yokoo H, Yamada S, Yoshida M, Takaka T, Mizoguchi K, Emoto H, Koga C, Ishii H, Ishidawa M, Kurasaki N, Matsui M, Tanaka M. Effect of opioid peptides on dopamine release from nucleus accumbens after repeated treatment with methamphetamine. Eur J Pharmacol. 1994;256:335–338. doi: 10.1016/0014-2999(94)90560-6. [DOI] [PubMed] [Google Scholar]
- 51.Zahm DS, Zaborszky L, Alheid GH, Heimer L. The ventral striatopallidothalamic projection: II. The ventral pallidothalamic link. J Comp Neurol. 1987;255:592–605. doi: 10.1002/cne.902550410. [DOI] [PubMed] [Google Scholar]
- 52.Zito KA, Vickers G, Roberts DCS. Disruption of cocaine and heroin self-administration following kainic acid lesions of the nucleus accumbens. Pharmacol Biochem Behav. 1985;23:1029–1036. doi: 10.1016/0091-3057(85)90110-8. [DOI] [PubMed] [Google Scholar]