Abstract
Visuospatial attention can be directed by voluntary or involuntary control independent of eye movement. The involvement of cortical and subcortical neural structures in this covert orienting mechanism has been studied using neuroimaging and electrophysiological techniques. This study was designed to investigate the role of the dopaminergic system in both voluntary and automatic orienting mechanisms of visuospatial attention. We recorded event-related evoked potentials (ERPs) and reaction time (RT) during a cued priming task in both patients with idiopathic Parkinson’s disease (PD) and control subjects. Voluntary and automatic shifts in attention were studied by using central and peripheral cues, respectively. In the experiment using a central cue, the RT data showed that when the cue–target interval was long, PD patients’ responses were delayed, and cue validity effects were reduced, whereas in the peripheral cue experiment the validity effects persisted across all trials. The ERPs demonstrated reduced sustained negativities preceding the imperative targets in both the central and peripheral cue experiments in PD patients. Furthermore, during the long cue–target interval in the central cue experiment, PD patients showed reduced attention shift-related negativities (ARNs) at the anterior scalp sites, whereas ARNs were generated widely in the peripheral cue experiment. The ERP findings were consistent with the RT data. These findings suggest that the dopaminergic system may contribute to voluntary and sustained control of visuospatial attention as well as to the neural system for response preparation, whereas automatic control of visuospatial attention is relatively independent of the dopamine system.
Keywords: visuospatial attention, voluntary shift, automatic shift, dopamine system, Parkinson’s disease, event-related evoked potential, cue, response preparation
Current progress in neuroimaging, electrical recording, and lesion study has facilitated study of the anatomical basis of visual attention (Posner et al., 1984; Corbetta et al., 1993; Robinson et al., 1995). The neurochemical basis of visual attention has been elucidated both by clinical and experimental studies (Clark et al., 1987). In rats, unilateral dopamine-depleting lesions of the striatum increase the response time required to shift visuospatial attention contralateral to the side of the lesion, but the response time does not vary with the need to maintain, disengage, or shift attention (Ward and Brown, 1996). The findings support the hypothesis that the deficit reflects a motor impairment rather than damage to the neural system underlying mechanisms for directing attention.
Most human studies have examined patients with Parkinson’s disease (PD), which is characterized by biochemical depletion of dopamine in the substantia nigra and striatum (Hornykiewicz, 1982). Studies of covert orienting of visual attention use a paradigm, in which a warning cue indicates the probable location of a subsequent target stimulus (Posner, 1980). Accelerated responses to correctly cued targets and slowed responses to falsely cued targets can be measured and reflect the action of the spatial-orienting mechanism (Posner and Cohen, 1984). The results with PD patients, however, are inconsistent (Rafal et al., 1984; Sharp, 1990; Wright et al., 1990; Yamada et al., 1990; Bennett et al., 1995).
There are several factors that might be responsible for these inconsistent results (Yamada et al., 1990). Most studies use a single cue–target interval, but it is well known that response time to targets varies with the cue–target interval. Variation in response time can help diagnose the underlying cause affecting performance, so data from experiments using different cue–target intervals may produce different conclusions. The type of cue used in studies also varies, and most studies use only a single type of cue, either an informative central cue or a noninformative peripheral cue. Evidence suggests that two distinct mechanisms cause attention shift, one reflexive, the other voluntary (Jonides, 1981; Rafal and Henik, 1994). Behavioral studies have demonstrated that attentional function in PD is normal when triggered by external cues but abnormal when triggered by internal cues (Brown and Marsden, 1988). We therefore investigated the role of the dopaminergic system in both voluntary and automatic orienting mechanisms by manipulating the cue–target interval.
Furthermore, we tried to elucidate the electrophysiological basis of attentional orienting by the concurrent measurement of event-related evoked potentials (ERPs). Several studies have reported ERP modulations produced by attention shifts and response preparation in a cued priming task (Harter et al., 1989; Mangun, 1994; Yamaguchi et al., 1994). OnlyWright et al. (1993) recorded ERPs in PD patients during a cued priming task, but the distribution of electrodes and the cue types used were limited. In this study ERPs were collected from sites distributed over the entire scalp, because each hemisphere plays a specific role in triggering orienting behavior to extrapersonal space.
MATERIALS AND METHODS
Subjects. We studied 13 patients diagnosed with idiopathic PD, aged 58–79 years (mean ± SD, 66.0 ± 6.8 years) and 13 age-matched control subjects, aged 56–74 years (65.4 ± 6.0 years). All subjects had normal or corrected-to-normal visual acuity and gave their informed consent to participate in this study. The clinical details of each patient with PD are shown in Table 1. All patients were right-handed and had at least two of the cardinal features of PD (akinesia, tremor, rigidity, and postual instability). Patients with Parkinsonism caused by ischemic brain lesions were excluded from the study. The duration of illness varied between patients (1–15 years; mean, 5.7 years), and the disabilities they suffered in their daily living ranged from mild to moderate (stages I–III on the scale ofHoehn and Yahr, 1967). The general cognitive state of all subjects was assessed using the Hasegawa dementia scale (the maximum score is 30, and the cut-off value for cognitive impairments is 20) (Katoh et al., 1991). The scores for the PD patients ranged from 23 to 30 (mean, 27.7 ± 2.3), and those of controls ranged from 26 to 30 (mean, 28.7 ± 1.1). There was no significant difference in the mean scores of the two groups. Two patients were medication-free. The rest of the patients were all taking dopaminergic medication (levodopa, 100–600 mg/d). In addition, five patients took anticholinergic agents (trihexyphenidyl, 4–6 mg/d), and six were taking bromocriptine (7.5–15 mg/d). Patients were tested when the signs and symptoms of their disease were minimal. Control subjects were chosen from volunteers, who were carefully screened to eliminate individuals with medical or neuropsychiatric disorders.
Table 1.
Clinical characteristics of PD patients
| Patient | Sex | Age | Duration of illness | H & Y1-a | Hasegawa score1-b | Medication | ||
|---|---|---|---|---|---|---|---|---|
| Levodopa (mg/d) | Trihexyphenidyl (mg/d) | Bromocriptine (mg/d) | ||||||
| 1 | F | 65 | 1 | 2 | 30 | – | ||
| 2 | F | 58 | 6 | 3 | 30 | 300 | 6 | |
| 3 | M | 73 | 2 | 2 | 25 | – | ||
| 4 | F | 64 | 1 | 1 | 24 | 100 | 4 | |
| 5 | F | 61 | 15 | 3 | 29 | 500 | 4 | |
| 6 | M | 61 | 2 | 3 | 23 | 400 | 15 | |
| 7 | M | 60 | 7 | 2 | 29 | 400 | 7.5 | |
| 8 | F | 71 | 9 | 3 | 29 | 600 | 7.5 | |
| 9 | F | 79 | 1 | 2 | 30 | 300 | ||
| 10 | F | 68 | 4 | 2 | 29 | 300 | 7.5 | |
| 11 | F | 62 | 3 | 2 | 27 | 150 | 6 | |
| 12 | M | 60 | 12 | 2 | 28 | 400 | 12.5 | |
| 13 | F | 76 | 12 | 3 | 28 | 300 | 4 | 7.5 |
H & Y, Hoehn and Yahr (1967) scale.
Maximum score = 30; non-dementia; ≥21; dementia; ≤20.
Stimuli and procedures. Subjects were seated in a comfortable chair with a neck support in an electrically shielded and sound-attenuated room with dim lighting. All stimuli were presented on a 20-inch cathode ray tube (CRT) placed 60 cm in front of the subject’s eyes. Subjects were asked to look at a small white dot (0.3 × 0.3° in diameter) in the center of the CRT and to try not to blink. Eye fixation was verified in a training session, and eye position was monitored continuously by electro-oculogram and a closed-circuit camera.
The central cue experiment consisted of 350 trials, with an interval of 1250 msec between each trial. Each trial comprised an arrow cue followed by an asterisk target. Both stimuli were white and covered ∼2° of the visual angle. The arrow cue was presented in the center of the CRT, just above the point of fixation. The arrow pointed to the left or the right randomly, with equal probability. The arrow then remained on the CRT until the asterisk appeared. The asterisk target flashed (100 msec duration) at a position 10° lateral to the center of the CRT. It was presented at random stimulus onset asynchronies (SOAs) of 200, 500, or 800 msec after the appearance of the cue. Sixty percent of trials had 800 msec SOAs to obtain a high signal-to-noise ratio in ERPs. Twenty percent of the remaining trials had SOAs of 200 msec, and 20% had SOAs of 500 msec. In 80% of the trials, the target was presented in the visual field indicated by the arrow (valid cue). In the remaining 20%, it appeared in the opposite field (invalid cue). Thus, the cue was four times as likely to predict the target position correctly as not. The arrow direction was random in both valid and invalid trials. Within each block of trials, both types of cue validity and the latency of the SOA occurred randomly.
In the peripheral cue experiment, a small box (an open square covering 2° of the visual angle) was presented randomly on either side, 10° lateral to the central point of fixation, with equal probability. The cue remained in the same position until the asterisk target appeared. The target also appeared 10° lateral to the point of fixation. In 80% of the trials it appeared in the same location as the cue (valid cue), and in the other 20% it appeared in the opposite visual field (invalid cue). The number of trials, the SOAs, and the interval between trials were the same as in the central cue experiment.
In both experiments, subjects were required to signal detection of an asterisk by pressing a button as quickly as possible with the right index finger. Before the experiment, subjects were briefed on the types of target presentation. All subjects participated in both experiments. Half of the subjects took part in the peripheral cue experiment first; the other half started with the central cue experiment. There was a 2 min rest between each experiment. There were three short rest periods of 30 sec each during each experiment. Twenty trials were run before beginning each experiment to familiarize subjects with the experimental procedure.
Electroencephalograph recording and averaging. EEGs were recorded using Ag/AgCl electrodes at 14 scalp sites (Fpz, F3, Fz, F4, C3, Cz, C4, T5, P3, Pz, P4, T6, O1, and O2). Vertical and horizontal eye movements were monitored by electrodes placed below and lateral to the left eye. All electrodes were referred to linked ear lobes. Electrode impedance was kept at <2 kΩ.
The EEG was amplified (bandpass, 0.05–100 Hz), digitized (250 Hz/channel), and stored on an 8 mm tape for off-line analyses. EEGs were averaged separately for each SOA over 1024 msec and time-locked to the cue stimuli, including 100 msec of prestimulus baseline. Individual trials with excessive muscle activity (>75 μV peak-to-peak amplitude) or eye movement (>75 μV peak-to-peak amplitude) were excluded from the averages. Only the ERP data from correctly performed trials were included (i.e., RTs between 150 and 900 msec after target appearance).
Statistical analysis. In both the central and peripheral cue experiments, three distinct ERP waveforms were generated as a function of SOA in both the PD and control groups. The analyses reported here are of the ERPs for the 800 msec SOA in both groups, because the ERP waveforms recorded between cue and target for the 200 and 500 msec SOAs were essentially identical to those recorded during the corresponding time frame for the 800 msec SOA. For the analysis of the ERPs recorded between the appearance of the cue and the appearance of the target, mean amplitudes were obtained at 10 msec intervals, referenced to the 100 msec prestimulus baseline. To quantify the ERP changes associated with the visuospatial attention shift that occurred during the cue–target interval, we analyzed the interaction between cue direction and recording hemisphere at 10 msec intervals. As seen in actual ERPs, significant interaction indicates that the ERPs become more negative over the hemisphere contralateral to the cue direction and more positive over the ipsilateral hemisphere. We tentatively defined the contralateral potential shift with a significant interaction as an attention shift-related negativity (ARN), although we could not rule out the possibility that the interactions were attributable to ipsilateral positivity.
In addition, we analyzed the ERPs to target stimuli. Because the analyses of ERPs between cue and target were performed for the 800 msec SOA trials and the number of trials with 200 and 500 msec SOAs were relatively small, only the ERPs to targets with an 800 msec SOA were analyzed. Three different components [first positive component (P1), first negative component (N1), and late sustained positivity (LSP)] were observed in the ERPs for target stimuli. The peak amplitude of P1 was obtained in the latency window of 70–150 msec, and that of N1 was obtained during the 150–230 msec time frame. The mean amplitude of LSP was measured at 50 msec intervals from 250 to 600 msec.
We also compared the data from patients having anticholinergics with those from patients without anticholinergics, because cholinergic neurons have been reported to affect cortical activities in animals (Pirch et al., 1992).
ANOVA was used to evaluate the ERP results for within-subject variation in electrode site (frontal, central, parietal, posterior-temporal, and occipital), cue direction (right vs left), and recording hemisphere (right vs left) and between-subject variation in the experimental groups (PD vs control). Post hoc comparisons were made with the Newman–Keuls procedure. Reaction time (RT) data were also subjected to repeated ANOVA measurement. In these analyses, cue validity (correctly vs incorrectly cued target) and SOA (200, 500, and 800 msec) were the within-subject variables, and group membership (PD vs control) was the between-subject variable. The effect of repeated measurements was evaluated using a multivariate ANOVA (Rao’sR) to counteract any bias introduced by violation of the assumption of sphericity (Vasey and Thayer, 1987). Statistical significance was defined as p < 0.05.
RESULTS
Behavior
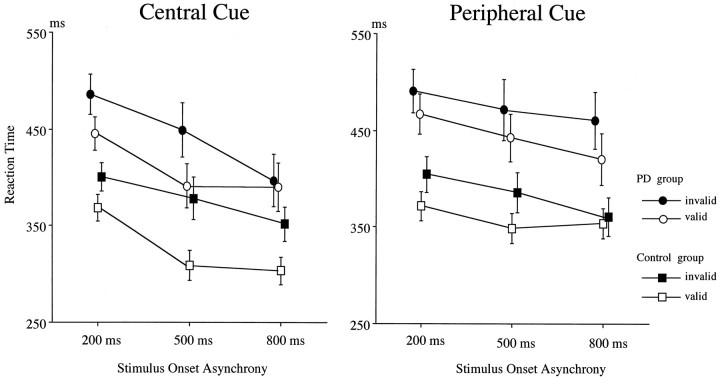
The RT data for the central and peripheral cues as a function of SOA in the control and PD groups are shown in Figure1. The mean RT was significantly slower in the PD group for the central cue experiment (main group effect,F(1,24) = 7.74; p < 0.02). Cue validity effects were observed in both the PD and control groups (F(1,12) = 11.2; p < 0.01 for the PD group; F(1,12) = 62.0, p< 0.0001 for the control group). Targets with a longer SOA were detected more quickly than those with a shorter SOA (SOA effects,R(2,23) = 40.5; p < 0.0001). There was no group difference either in SOA effect or cue validity effect, but the three-way interaction of group × cue validity × SOA was significant (R(2,23) = 3.86; p < 0.05). This effect suggests that the cue validity effect was smaller for the 200 msec SOA than for the longer SOA trials for the control group, whereas the smallest validity effect for the PD group was for the 800 msec SOA.
Fig. 1.
Reaction times to targets as a function of cue validity, SOA between cue and target, and subject group in the central (left) and peripheral (right) cue experiments. Values are mean ± SE.
The PD group showed a lower rate of correct hits on targets for the 500 and 800 msec SOAs than the control group (94.7 vs 98.8%;F(1,12) = 4.33; p < 0.05 for the 500 msec SOA trials; 94.0 versus 99.0%;F(1,12) = 5.48; p < 0.05 for the 800 msec SOA trials), whereas there was no difference in correct hit rates to targets with a 200 msec SOA.
In the peripheral cue experiment (Fig. 1, right), the RT for the PD group was also longer than that of the control group (F(1,24) = 9.14; p < 0.01). The main effect of cue validity was significant for both groups (F(1,12) = 18.3; p < 0.005 for the PD group; F(1,12) = 11.0; p< 0.01 for the control group), but the interaction between group and cue validity was not significant. The SOA effect was also significant for both groups (R(2,11) = 6.64;p < 0.02 for the PD group;R(2,11) = 7.88; p < 0.01 for the control group). There was a three-way interaction of group × cue validity × SOA (R(2,23) = 11.1;p < 0.001). This interaction occurred because the smallest difference in RT between valid and invalid targets was found to be for the 800 msec SOA for the control group, whereas the RT differences between valid and invalid targets were almost equal across all three SOAs for the PD group. The correct response rate of the PD group was similar to that of the control group (97.0 vs 98.8%).
There were no significant differences in RTs and validity effects between patients with and without anticholinergic agents in both the central and peripheral cue experiments.
ERP for the central cue
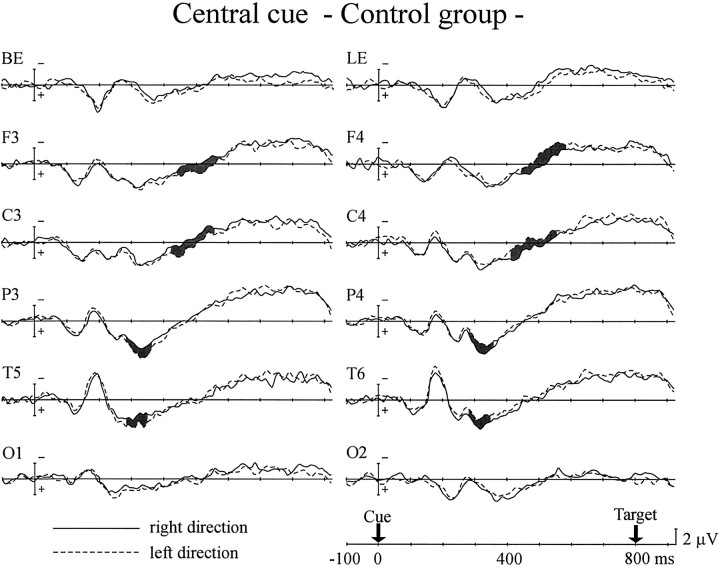
Figure 2 shows the ERPs of the control group for central arrow cues directed to the right and left visual fields with an 800 msec SOA. The ERPs for the first 280 msec after the appearance of the cue showed no significant interaction between cue direction and hemisphere. The interaction started at 280 msec in the parietal and posterior temporal sites. This attention shift-related negativity (cARN; c refers to the central cue) continued until 340 msec after the cue at the posterior temporal site (interaction between cue direction and hemisphere,F(1,12) = 6.18–8.35; p < 0.05 for 280–340 msec time window) and until 360 msec after the cue at the parietal site (F(1,12) = 5.58–7.26;p < 0.05 for 280–360 msec). After the appearance of the cARN over the posterior scalp sites, another interaction showed up 420 msec after the cue at the central site and 440 msec after the cue at the frontal site. The anterior cARNs continued until 560 msec after the cue at the central site (F(1,12) = 7.03–9.80; p < 0.05) and until 580 msec at the frontal site (F(1,12) = 5.23–8.61;p < 0.05). No cARN was observed at the occipital site.
Fig. 2.
Grand average ERPs of the control group to the appearance of central arrow cues directed to the right (solid line) and left (dashed line) visual fields for the 800 msec SOA. Event-related evoked potentials were recorded at frontal (F3, F4), central (C3, C4), parietal (P3, P4), posterior-temporal (T5, T6), and occipital (O1, O2) scalp sites in both hemispheres. Recordings from the electrodes placed below (BE) and lateral (LE) to the left eye are also shown. Shaded areas represent potentials in which significant interaction between cue direction and hemisphere was observed.
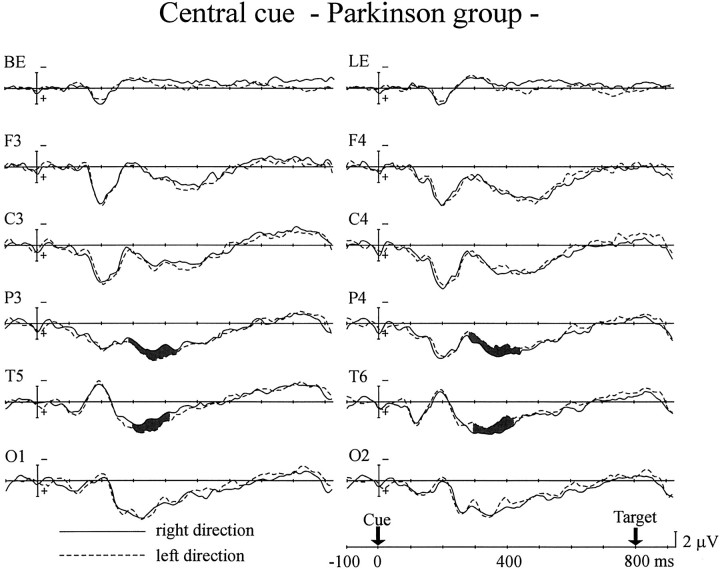
The PD group generated a different pattern of cARNs in ERPs in the central cue experiment (Fig. 3). The cARNs were observed only at the posterior scalp sites (F(1,12) = 8.47–9.68; p < 0.05, 280–440 msec for the parietal site;F(1,12) = 8.09–9.95; p < 0.05, 300–420 msec for the posterior temporal site). Although the onset latencies of the parietal cARNs were comparable for the control and the PD groups, the offset latency was delayed by ∼80 msec in the PD group. The posterior temporal cARN in the PD group showed delays in onset and offset compared with the control group of ∼20 and 80 msec, respectively. The mean amplitudes of the posterior cARNs were comparable in the two groups. However, the anterior scalp regions (frontal and central sites) failed to show cARNs in the PD group.
Fig. 3.
Grand average ERPs of the PD group to the central arrow cues. Same format as in Figure 2.
The behavioral data showed decreased cue validity effects for the 800 msec SOA trials in the PD group. It is of interest whether disappearance of the anterior cARN contributes to alterations in the RT data. To investigate the relationship between cue validity effects in the RT data and anterior cARNs in ERPs for the PD group, their correlation was measured from individual data. The mean amplitude of the anterior cARN was averaged across both hemispheres. The latency windows for the measurements were 500–640 msec for the central site and 520–660 msec for the frontal site. These values were determined based on the latency range of anterior cARNs in the control group and the delay of onset latency of posterior cARNs in the PD group. The mean amplitude of the cARN at the central site was significantly correlated with the validity effects for the 800 msec SOA trials (r = −0.68; p < 0.01). The frontal site also showed a significant correlation between the cARN and validity effects (r = −0.61, p < 0.05).
There was another difference between the ERPs of the PD group and the control group. Late negative deflection (LND), which developed gradually before the target appeared, was observed over both hemispheres in the control group (Fig. 2), but in the PD group the LNDs observed over the left hemisphere were small, and those over the right hemisphere were negligible (Fig. 3). The mean amplitude of the LND was measured over the left hemisphere 700–800 msec after the cue, at which LND latency showed negative values in both groups. LND was significantly smaller in the PD group than in the control group for all scalp sites (F(1,24) = 5.24–17.1;p < 0.05) except the occipital scalp site. The onset latency of the LND (i.e., the time at which the mean LND amplitude changed from a positive value) of the two groups was compared for the left hemisphere. The combined values for the two types of cue (right and left arrows) were averaged, because there was no significant difference between them. Comparing the PD group with the control group, the latency was delayed by 89 msec at the frontal site (F(1,24) = 10.8; p < 0.005), 92 msec at the central site (F(1,24) = 12.0;p < 0.005), 180 msec at the parietal site (F(1,24) = 47.6; p < 0.001), 71 msec at the posterior temporal site (F(1,24) = 8.88; p < 0.01), and 135 msec at the occipital site (F(1,24) = 31.1; p < 0.001).
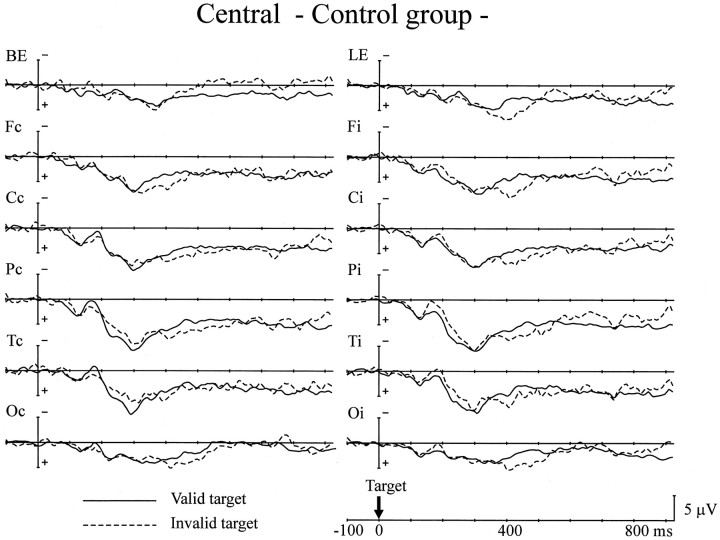
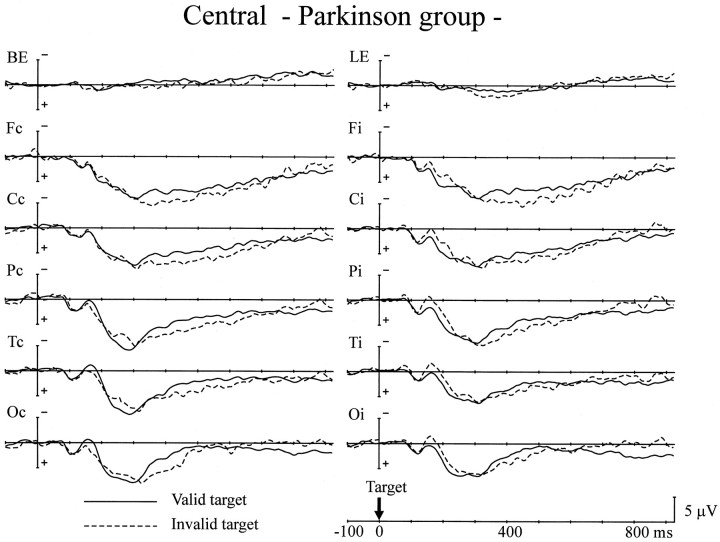
The next analysis was of the ERPs to target stimuli for trials with an 800 msec SOA (Figs. 4,5). The peak amplitude of P1 was comparable for the two groups. Validity effects (enhanced P1 amplitude in response to valid targets) were not observed in either group. The peak amplitude of the N1 component also showed no group differences for all scalp sites. There was a significant interaction between recorded hemisphere and the validity effect at the parietal, posterior-temporal, and occipital sites (F(1,24) = 11.7–19.7;p < 0.005) in both groups. This interaction indicates that valid targets elicited a larger N1 component over the hemisphere contralateral to the stimuli, whereas the N1 component for invalid targets was larger over the ipsilateral hemisphere. There were no group differences in either the validity effect on the N1 or in the peak latency of the P1 and N1 components.
Fig. 4.
Grand average ERPs of the control group to targets presented at the cued location (Valid target) and the uncued location (Invalid target) for the central cue experiment. ERPs to right and left targets have been combined, with electrodes transposed so that the ERPs on the left were contralateral to the visual field of target presentation. Thus, the data are presented as a function of scalp sites contralateral (Fc, Cc, Pc, Tc, Oc) or ipsilateral (Fi, Ci, Pi, Ti, Oi) to the side of target presentation.
Fig. 5.
Grand average ERPs of the PD group to the targets. Same format as in Figure 4.
Because no hemispheric difference was apparent in the amplitude of LSP, the data for both hemispheres was pooled for the following analyses. The PD group showed a significantly greater amplitude for LSP at the occipital site in the 200–350 msec latency period than the control group (F(1,24) = 5.71; p < 0.05). Both groups showed reversed validity effects on LSP in the latency range of 300–500 msec at the frontal site (F(1,24) = 4.77–5.12; p < 0.05) and 400–500 msec at the central (F(1,24)= 4.27; p < 0.05), parietal (F(1,24) = 6.20; p < 0.05), and occipital (F(1,24) = 4.81; p < 0.05) sites. There was no interaction between group and validity effect, indicating that both groups showed comparable reversed validity effects on LSP for these latency ranges. There was no difference in the peak latency of LSP between the control and PD groups at Pz. There were no significant differences in cARNs and LND between patients with and without anticholinergic medication. The ERPs to target stimuli were not affected by the medication, either.
ERP to the peripheral cue
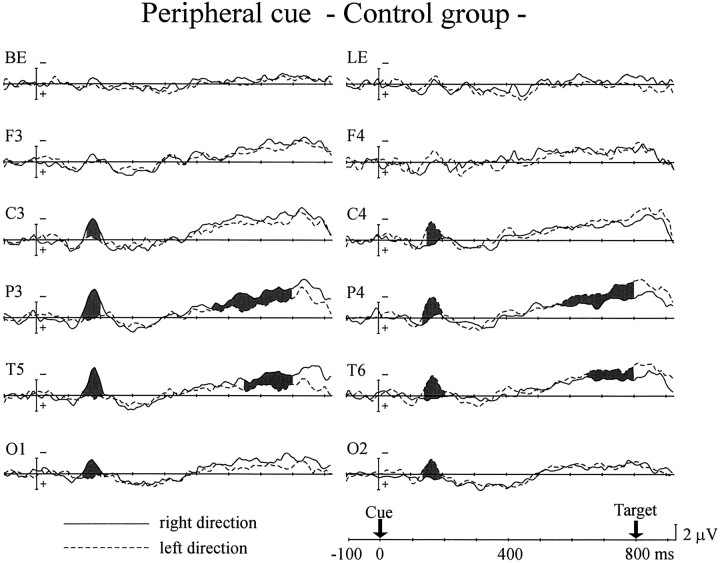
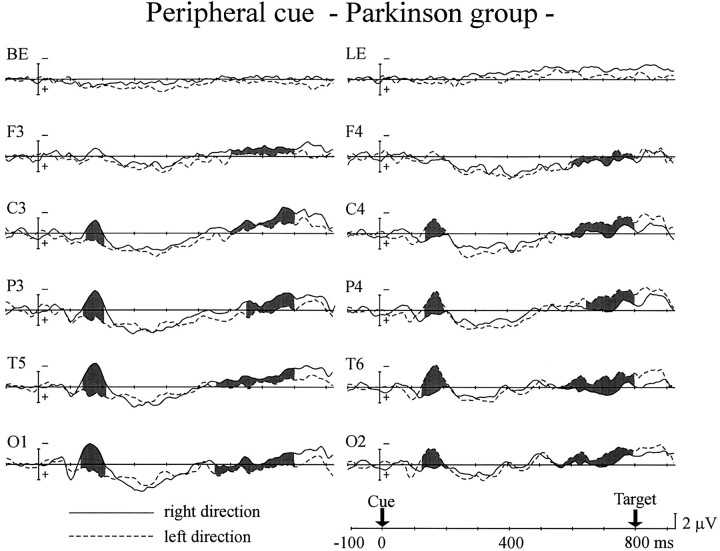
Peripheral cues elicited different patterns of ERPs to the central cues, as shown in Figures 6 and7. In the control group, significant interaction between cue side and hemisphere started 140 msec after cue onset at the parietal, posterior-temporal, and occipital sites and 150 msec after the cue at the central site (Fig. 6). It continued until 200 msec after the cue at the central, parietal, and occipital sites and 210 msec after the cue at the posterior temporal site (interaction between cue side and hemisphere, F(1,12) = 8.11–24.5; p < 0.02). The frontal site failed to show such an interaction. This contralateral negativity (i.e., N1 component) was also observed in the PD group (Fig. 7). The interactions began 130 msec after the cue at the posterior-temporal and occipital sites and 140 msec after the cue at the central and parietal sites and lasted until 210 msec (F(1,12) = 10.3–27.9;p < 0.01). There was no significant difference between the two groups in peak amplitude or duration of the N1 for all scalp sites.
Fig. 6.
Grand average ERPs of the control group to peripheral cues presented in the right (solid line) and left (dashed line) visual fields at 800 msec SOA.Shaded areas represent potentials in which significant interaction between cue side and hemisphere was observed. The recording sites are the same as in Figure 2.
Fig. 7.
Grand average ERPs of the PD group to the peripheral cues. Same format as in Figure 6.
There was another interaction between cue side and hemisphere, the attention shift-related negativity for the peripheral cue (pARN; p refers to the peripheral cue), which occurred over the hemisphere contralateral to the cue side, relatively long after cue presentation. In the control group pARN was observed at the parietal (F(1,12) = 4.65–26.5; p < 0.05 for 540–800 msec) and posterior-temporal sites (F(1,12) = 6.59–15.8; p < 0.05 for 620–800 msec), whereas it appeared at all scalp sites for the PD group (F(1,12) = 4.95–11.7; p< 0.05 for 580–800 msec at the frontal site;F(1,12) = 5.35–14.5; p < 0.05 for 560–800 msec at the central site; F(1,12) = 4.80–16.2; p < 0.05 for 600–800 msec at the parietal site; F(1,12) = 4.66–23.4; p < 0.05 for 540–800 msec at the posterior temporal site;F(1,12) = 6.62–22.5; p < 0.05 for 540–800 msec at the occipital site). At those scalp sites where both groups did show pARNs, there was no significant difference in the pARN amplitude between the two groups.
As was observed in the central cue experiment, the mean amplitudes of LND in the PD group were significantly smaller for all scalp sites than for the control group, except at the occipital site (F(1,24) = 4.72–11.6; p < 0.05 for the time window of 700–800 msec). The onset latencies of LND were also delayed significantly in the PD group (50 msec at the frontal site, F(1,24) = 5.62; p < 0.05; 130 msec at the central site, F(1,24) = 25.4;p < 0.001; 180 msec at the parietal site,F(1,24) = 47.6; p < 0.001; 130 msec at the posterior temporal site, F(1,24) = 26.6; p < 0.001; 140 msec at the occipital site,F(1,24) = 22.4; p < 0.001).
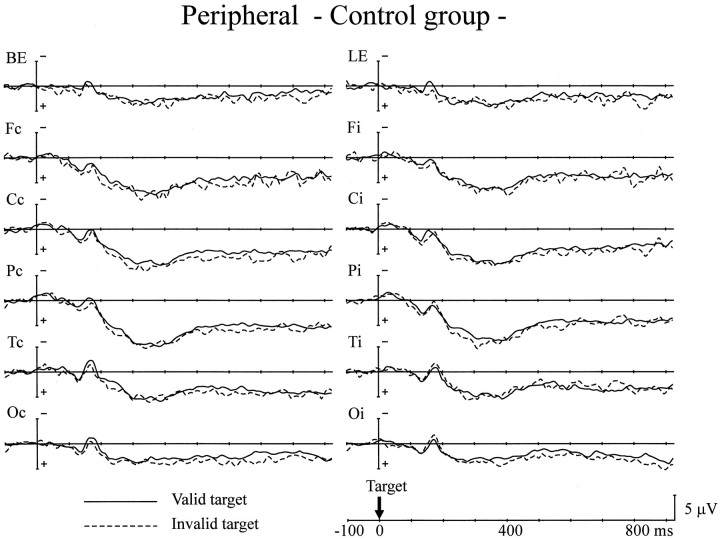
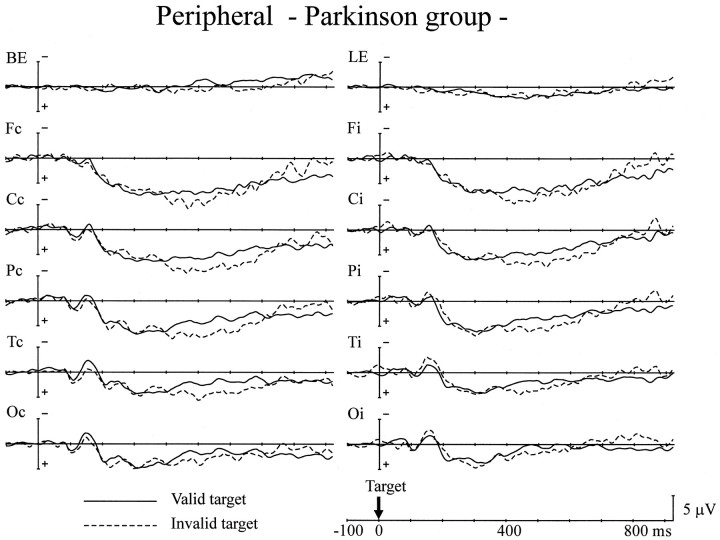
As in the central experiment, we then analyzed the ERPs to the target stimuli for the 800 msec SOA trials (Figs.8, 9). The P1 amplitude was comparable for both groups. Cue validity did not affect P1 amplitude over both hemispheres in either group. The peak amplitude of the N1 component for all scalp sites also showed no group differences. As seen in the central cue experiment, there was a significant interaction between hemisphere and the validity effect at the posterior temporal site in both groups (F(1,24) = 5.13–6.24; p < 0.05), indicating that valid targets elicited a larger N1 component over the hemisphere contralateral to the stimuli, whereas the N1 response to invalid targets was larger over the ipsilateral hemisphere. There were no group differences in either the validity effect on N1 or the peak latency of the P1 and N1 components.
Fig. 8.
Grand average ERPs of the control group to targets presented at the cued location (Valid target) and the uncued location (Invalid target) for the peripheral cue experiment. The recording sites are the same as in Figure 4.
Fig. 9.
Grand average ERPs of the PD group to the targets. Same format as in Figure 8.
There was no difference in LSP amplitude between the two groups in the latency range of 250–400 msec after target presentation. Although the mean amplitude of LSP in the 400–600 msec range was also comparable for both groups, significant interactions between group and validity effect were observed at all scalp sites except at the occipital site; i.e., invalid targets elicited a larger LSP only for the PD group (F(1,24) = 5.52–6.33; p < 0.05 at the frontal site; F(1,24) = 5.86–9.30;p < 0.05 at the central site;F(1,24) = 4.66–9.11; p < 0.05 at the parietal site; F(1,24) = 5.33–8.13;p < 0.05 at the posterior-temporal site). The peak latency of LSP was not different for the two groups (355 msec for the control group and 337 msec for the PD group at Pz). Anticholinergic medication in PD patients did not affect the changes in ERPs either to cue stimuli or target stimuli.
DISCUSSION
This study showed altered behavior in PD patients compared with controls. First, in the central cue experiment, cue validity almost disappeared for the 800 msec SOA in the PD group. This indicates that PD patients have some difficulty in the late phase of voluntary attention shift, when the cue and imperative stimulus occur at different times, suggesting that PD patients may have an impaired ability to sustain spatial attention. A recent study using the central arrows (SOA = 600 msec) showed normal orienting toward an expected source of stimulation in PD patients (Bennett et al., 1995), but on the other hand, Wright et al. (1990) reported that PD patients showed no cost for an invalid cue in an 1100 msec SOA trial. This discrepancy may be the result of subject differences [severity and duration of illness, age of onset, or patient age (Yamada et al., 1990)] or the difference in SOA. Our patients were older, and their illness was more severe than in those in Bennett’s patient group.
In the peripheral cue experiment, a different interaction was observed between cue validity and SOA. The validity effects observed were consistent across all SOAs in the PD patients, whereas they were smallest for the 800 msec SOA in the controls. The attention shift may not be entirely automatic in the long SOA trials, because there is a bias in terms of the probability of target location for the peripheral cue (Müller and Rabbitt, 1989). This study suggests that the automatic shift of spatial attention in PD patients is preserved for the 200 and 500 msec SOA trials. This result is consistent with the work of Rafal et al. (1984), who found no apparent deficits in automatic orienting. This is also consistent with a recent animal study using peripheral cues (Ward and Brown, 1996). The decreased validity effect for the long SOA in normal subjects may be explained by “inhibition of return” (Posner and Cohen, 1984). When attention is summoned by a peripheral cue, the initial facilitation of detection at the cued location is then followed by a delay in detection at the same location. Thus, the presence of a validity effect in the 800 msec SOA may be interpreted in PD patients as impairment of inhibition of return (Henik et al., 1990).
Another difference in the PD patients was the slowing in the RT to target stimuli. This is consistent with all previous reports. Because the attention shift of PD patients is as efficient as that of the controls in all of the trials except those with a long SOA in the central cue experiment, the delay in RT is ascribed to a delay in processing response preparation or motor response. However, from behavioral data alone it is difficult to delineate the critical process responsible for response impairment in the motor hierarchy.
Electrophysiological data from the central cue experiment showed that PD patients generated cARNs over the posterior brain regions similar to those of control subjects, but that anterior cARNs were reduced in PD patients. This study suggests that the early phase of voluntary shift is not compromised by dopamine deficiency. In controls, on the other hand, the anterior cARNs were elicited at ∼400–500 msec after the cue, and the behavioral consequence of attenuated anterior cARNs should thus be observed in longer SOA trials. Conceivably, the behavioral effects would be expected to appear as a decreased validity effect for the 800 msec SOA in PD patients, as is the case in our behavioral data. The close association of ERP effects with behavioral data were also demonstrated by the significant correlation between reduced anterior cARN and decreased validity effect in PD patients.
A general model for understanding the visual attention system is that the frontal lobe is involved in the process of detecting targets and preparing an appropriate response, and the parietal lobe is responsible for covert orienting to the visual location (Posner and Petersen, 1990). A positron emission tomographic (PET) study demonstrated separate activation of frontal and parietal cortices during attention shift tasks (Corbetta et al., 1993). That study suggested that the posterior cortices are activated first and control the selection of the target location based on cognitive or sensory cues, whereas the anterior cortices are activated later and are linked to the response selection mechanism. Another recent PET study using cuing paradigms also demonstrated neural activation in the anterior cortices and in the posterior parietal cortex (Nobre et al., 1997). Our ERP study supports the functional segregation of anterior and posterior cortices in orienting behaviors by demonstrating the differential effects of dopamine deficiency on anterior and posterior cARNs.
The peripheral cue elicited the N1 component, which is often reported to be modulated by visuospatial attention (Harter et al., 1982; Mangun and Hillyard, 1987). Peripheral cues occurred in eccentric visual fields, and the ERPs for those stimuli are expected to be larger over the hemisphere contralateral to the stimulus. In addition, the N1 component may reflect the neural processes of attentional allocation in visual space (Hillyard et al., 1985; Mangun et al., 1993). The comparable N1 component in both the PD and the control groups suggests that the capacity for automatic attention shift is preserved in PD patients.
The peripheral cue generated another lateralized negativity in the late stage after cue presentation, the pARN. The pARN was observed more widely over the scalp in PD patients than in controls. As mentioned previously, the RT data from the long SOA trial in the peripheral cue experiment may be confounded by the inhibition of return phenomenon in normal subjects. If this mechanism suppresses neural activity for orienting to the cued location in normal subjects and is impaired in PD patients, then this may explain why pARN is generated more widely over the scalp in the PD group.
Another prominent ERP change in the PD group was decreased amplitude and delayed onset of the LND. The sustained negative potential preceding an imperative stimulus is thought to include a late wave of the contingent negative variation (CNV), which reflects at least two different processes: anticipation of an imperative stimulus and preparation for a movement, although these processes are difficult to analyze separately in the current paradigm (Brunia and Damen, 1988;Brunia, 1993). There are several reports of PD patients showing attenuation of CNV or readiness potential (Amabile et al., 1986; Dick et al., 1989; Singh et al., 1990). Wright et al. (1993) also reported diminished CNV amplitude between the cue and the target presentation. The delayed RT in PD patients may be related to the impairment of response-related processes.
We looked at the ERPs in response to the target stimuli to see how target information processing is affected by an antecedent attention shift in PD and in controls. Although the early components (P1 and N1) of the visual evoked potential are known to be modulated by previous attentional allocation (Mangun et al., 1993), P1 is less sensitive to attentional effects in a simple detection task (Eimer, 1993). In contrast, N1 showed a validity effect that was observed equally in both groups over the contralateral posterior scalp sites. The discrepancy in the way of attentional modulations of P1 and N1 between the present study and the study of Mangun et al. (1993) may be ascribed to differences in stimulus parameters (i.e., duration of cue presentation and visual angle of target stimuli from the fixation point) and the age of subjects (Mangun and Hillyard, 1991; Mangun, 1995). Mangun (1995)suggested that the posterior N1 component has two generator sources: the parietal and occipital-temporal visual association areas. Although the validity effect on N1 indicates that the visual association cortex in PD patients is primed by allocated attention, the behavioral data show the opposite result, because the validity effect was much smaller in PD patients for the 800 msec SOA. This suggests that the enhanced activity of the visual association cortex is not sufficient to produce validity effects in RT data. The dissociation between post-target ERP and RT data were also observed in LSP. LSP latency in the PD group was the same as that in the controls, whereas the RT was delayed in the PD group. The discrepancy between P3 latency and overt response time has been reported often (Verleger, 1997). The behavioral data seem to be related to ERP changes in the precue interval rather than to changes in the postcue ERPs.
Another notable finding for LSP is that invalid targets generated a larger LSP in the late phase (400–600 msec). Hugdahl and Nordby (1994)have suggested that this reflects neural processes related to the interruption of information processing and disengagement from the attended location in the invalid trials. Only the PD group showed LSP enhancement by invalid targets in the peripheral cue experiment. This suggests that the PD patients needed to switch their attention from the cued location to a new location when an invalid target appeared. In contrast, the controls did not need to reorient, probably because of their inhibition of return mechanism being intact.
In summary, this study showed that voluntary orienting of spatial attention is impaired in PD patients when sustained attention is required, but that the automatic shift of spatial attention is preserved. Brown and Marsden (1990) have proposed an extended hypothesis applicable to different forms of cognitive impairment in PD patients. According to their hypothesis, PD patients are impaired in internal, active, effort-demanding tasks but normal in passive, automatic tasks in which external cues are provided or in which the stimuli are organized at input. Other electrophysiological studies support this dissociation: PD patients had a normal P3a, which reflects automatic processes, whereas the controlled processes generating P3b were impaired (Tachibana et al., 1992). The deficit of controlled attention shifts in PD patients seems to be caused by dysfunction in the dopaminergic neural system, involving the basal ganglia and frontal lobe. This network is also critical for motor programming and response execution, both of which were shown by our behavioral and electrophysiological studies to be impaired substantially in PD patients.
Footnotes
We thank Avishai Henik for helpful comments on this manuscript.
Correspondence should be addressed to Dr. Shuhei Yamaguchi, Department of Internal Medicine III, Shimane Medical University, Izumo 693, Japan.
REFERENCES
- 1.Amabile G, Fattapposta F, Pozzessere G, Albani G, Sanarelli L, Risso PA, Morocutti C. Parkinson’s disease: electrophysiological (CNV) analysis related to pharmacological treatment. Electroencephalogr Clin Neurophysiol. 1986;64:521–524. doi: 10.1016/0013-4694(86)90189-6. [DOI] [PubMed] [Google Scholar]
- 2.Bennett KM, Waterman C, Scarpa M, Castiello U. Covert visuospatial attentional mechanisms in Parkinson’s disease. Brain. 1995;118:153–166. doi: 10.1093/brain/118.1.153. [DOI] [PubMed] [Google Scholar]
- 3.Brown RG, Marsden CD. Internal versus external cues and the control of attention in Parkinson’s disease. Brain. 1988;111:323–345. doi: 10.1093/brain/111.2.323. [DOI] [PubMed] [Google Scholar]
- 4.Brown RG, Marsden CD. Cognitive function in Parkinson’s disease: from description to theory. Trends Neurosci. 1990;13:21–29. doi: 10.1016/0166-2236(90)90058-i. [DOI] [PubMed] [Google Scholar]
- 5.Brunia CHM. Stimulus preceding negativity: arguments in favour of non motoric slow waves. In: McCallum WC, Curry SH, editors. Slow potential changes in the human brain. Plenum; New York: 1993. pp. 147–161. [Google Scholar]
- 6.Brunia CHM, Damen EJP. Distribution of slow brain potentials related to motor preparation and stimulus anticipation in a time estimation task. Electroencephalogr Clin Neurophysiol. 1988;69:234–243. doi: 10.1016/0013-4694(88)90132-0. [DOI] [PubMed] [Google Scholar]
- 7.Clark CR, Geffen GM, Geffen LB (1987) Catecholamines and attention. In: Animal and clinical studies. Neurosci Biobehav Rev 11:341–352. [DOI] [PubMed]
- 8.Corbetta M, Miezin FM, Shulman GL, Petersen SE. A PET study of visuospatial attention. J Neurosci. 1993;13:1202–1226. doi: 10.1523/JNEUROSCI.13-03-01202.1993. [DOI] [PMC free article] [PubMed] [Google Scholar]
- 9.Dick JPR, Rothwell JC, Day BL, Cantello R, Buruma O, Gioux M, Benecke R, Berardelli A, Thompson PD, Marsden CD. The Bereitschafts potential is abnormal in Parkinson’s disease. Brain. 1989;112:233–244. doi: 10.1093/brain/112.1.233. [DOI] [PubMed] [Google Scholar]
- 10.Eimer M. Spatial cueing, sensory gating and selective response preparation: an ERP study on visuo-spatial orienting. Electroencephalogr Clin Neurophysiol. 1993;88:408–420. doi: 10.1016/0168-5597(93)90017-j. [DOI] [PubMed] [Google Scholar]
- 11.Harter MR, Aine C, Schroeder C. Hemispheric differences in the neural processing of stimulus location and type: effects of selective attention on visual evoked potentials. Neuropsychologia. 1982;20:421–438. doi: 10.1016/0028-3932(82)90041-0. [DOI] [PubMed] [Google Scholar]
- 12.Harter MR, Miller SL, Price NJ, LaLonde ME, Keyes AL. Neural processes involved in directing attention. J Cognit Neurosci. 1989;1:223–237. doi: 10.1162/jocn.1989.1.3.223. [DOI] [PubMed] [Google Scholar]
- 13.Henik A, Rafal RD, Knight RT. Inhibitory spatial tagging and visual attention: contribution of prefrontal and basal ganglia. Soc Neurosci Abstr. 1990;16:579. [Google Scholar]
- 14.Hillyard SA, Münte TF, Neville HJ. Visual-spatial attention, orientation and brain physiology. In: Posner MI, Marin OSM, editors. Attention and performance, XI. Erlbaum; Hillsdale, NJ: 1985. pp. 63–84. [Google Scholar]
- 15.Hoehn MM, Yahr MD. Parkinsonism: onset, progression and mortality. Neurology. 1967;17:427–442. doi: 10.1212/wnl.17.5.427. [DOI] [PubMed] [Google Scholar]
- 16.Hornykiewicz O. Brain neurotransmitter changes in Parkinson’s disease. In: Marsden CD, Fahn S, editors. Movement disorders. Butterworths; London: 1982. pp. 41–58. [Google Scholar]
- 17.Hugdahl K, Nordby H. Electrophysiological correlates to cued attentional shifts in the visual and auditory modalities. Behav Neural Biol. 1994;62:21–32. doi: 10.1016/s0163-1047(05)80055-x. [DOI] [PubMed] [Google Scholar]
- 18.Jonides J. Voluntary versus automatic control over the mind’s eye’s movement. In: Long JB, Baddleley AD, editors. Attention and performance IX. Erlbaum; Hillsdale, NJ: 1981. pp. 187–203. [Google Scholar]
- 19.Katoh S, Shimogaki H, Onodera A, Ueda H, Oikawa K, Ikeda K, Kosaka A, Imai Y, Hasegawa K. Development of the revised version of Hasegawa’s Dementia Scale (HDS-R) (in Japanese). Jpn J Geriatr Psychiatry. 1991;2:1339–1347. [Google Scholar]
- 20.Mangun GR. Orienting attention in the visual fields: an electrophysiological analysis. In: Heinze HJ, Münte TF, Mangun GR, editors. Cognitive electrophysiology. Birkhäuser; Boston: 1994. pp. 81–101. [Google Scholar]
- 21.Mangun GR. Neural mechanisms of visual selective attention. Psychophysiology. 1995;32:4–18. doi: 10.1111/j.1469-8986.1995.tb03400.x. [DOI] [PubMed] [Google Scholar]
- 22.Mangun GR, Hillyard SA. The spatial allocation of visual attention as indexed by event-related potentials. Hum Factors. 1987;29:195–211. doi: 10.1177/001872088702900207. [DOI] [PubMed] [Google Scholar]
- 23.Mangun GR, Hillyard SA. Modulations of sensory-evoked brain potentials indicate changes in perceptual processing during visual-spatial priming. J Exp Psychol Hum Percept Perform. 1991;17:1057–1074. doi: 10.1037//0096-1523.17.4.1057. [DOI] [PubMed] [Google Scholar]
- 24.Mangun GR, Hillyard SA, Luck SJ. Electrocortical substrates of visual selective attention. In: Meyer DE, Kornblum S, editors. Attention and performance, XIV. MIT; Cambridge, MA: 1993. pp. 219–243. [Google Scholar]
- 25.Müller HJ, Rabbitt PM. Reflexive and voluntary orienting of visual attention: time course of activation and resistance to interruption. J Exp Psychol Hum Percept Perform. 1989;15:315–330. doi: 10.1037//0096-1523.15.2.315. [DOI] [PubMed] [Google Scholar]
- 26.Nobre AC, Sebestyen GN, Gitelman DR, Mesulam MM, Frankowiak RSJ, Frith CD. Functional localization of the system for visuospatial attention using positron emission tomography. Brain. 1997;120:515–533. doi: 10.1093/brain/120.3.515. [DOI] [PubMed] [Google Scholar]
- 27.Pirch JH, Turco K, Rucker HK. A role for acetylcholine in conditioning-related responses of rat frontal cortex neurons: microiontophoretic evidence. Brain Res. 1992;586:19–26. doi: 10.1016/0006-8993(92)91366-m. [DOI] [PubMed] [Google Scholar]
- 28.Posner MI. Orienting of attention. Q J Exp Psychol. 1980;32:3–25. doi: 10.1080/00335558008248231. [DOI] [PubMed] [Google Scholar]
- 29.Posner MI, Cohen YPC. Components of visual orienting. In: Bouma H, Bouwhuis D, editors. Attention and performance X. Erlbaum; London: 1984. pp. 531–556. [Google Scholar]
- 30.Posner MI, Petersen S. The attention system of the human brain. Annu Rev Neurosci. 1990;13:25–42. doi: 10.1146/annurev.ne.13.030190.000325. [DOI] [PubMed] [Google Scholar]
- 31.Posner MI, Walker JA, Friedrich FJ, Rafal RD. Effects of parietal injury on covert orienting of visual attention. J Neurosci. 1984;4:1863–1874. doi: 10.1523/JNEUROSCI.04-07-01863.1984. [DOI] [PMC free article] [PubMed] [Google Scholar]
- 32.Rafal R, Henik A. The neurology of inhibition: integrating controlled and automatic processes. In: Dagenbach D, Carr TH, editors. Inhibitory processes in attention, memory, and language. Academic; San Diego: 1994. pp. 1–51. [Google Scholar]
- 33.Rafal RD, Posner MI, Walker JA, Friedrich FJ. Cognition and the basal ganglia: separating mental and motor components of performance in Parkinson’s disease. Brain. 1984;107:1083–1094. doi: 10.1093/brain/107.4.1083. [DOI] [PubMed] [Google Scholar]
- 34.Robinson DL, Bowman EM, Kertzman C. Covert orienting of attention in macaques. II. Contributions of parietal cortex. J Neurophysiol. 1995;74:698–712. doi: 10.1152/jn.1995.74.2.698. [DOI] [PubMed] [Google Scholar]
- 35.Sharp M. Patients with early Parkinson’s disease are not impaired on spatial orienting of attention. Cortex. 1990;26:515–524. doi: 10.1016/s0010-9452(13)80301-2. [DOI] [PubMed] [Google Scholar]
- 36.Singh J, Bloem BR, Knight RT, Jagust W, Woods DL, Beckley DJ, Tetrud T, Langston JW. Movement-related potentials in patients with 1-methyl-4-phenyl-1,2,3,6-tetrahydropyridine-induced parkinsonism and early- and late-onset Parkinson’s disease. Ann Neurol. 1990;28:235–236. [Google Scholar]
- 37.Tachibana H, Toda K, Sugita M. Actively and passively evoked P3 latency of event-related potentials in Parkinson’s disease. J Neurol Sci. 1992;111:134–142. doi: 10.1016/0022-510x(92)90061-o. [DOI] [PubMed] [Google Scholar]
- 38.Vasey MW, Thayer JF. The continuing problem of false positives in repeated measures ANOVA in psychophysiology: a multivariate solution. Psychophysiology. 1987;24:479–486. doi: 10.1111/j.1469-8986.1987.tb00324.x. [DOI] [PubMed] [Google Scholar]
- 39.Verleger R. On the utility of P3 latency as an index of mental chronometry. Psychophysiology. 1997;34:131–156. doi: 10.1111/j.1469-8986.1997.tb02125.x. [DOI] [PubMed] [Google Scholar]
- 40.Ward NM, Brown VJ. Covert orienting of attention in the rat and the role of striatal dopamine. J Neurosci. 1996;16:3082–3088. doi: 10.1523/JNEUROSCI.16-09-03082.1996. [DOI] [PMC free article] [PubMed] [Google Scholar]
- 41.Wright MJ, Burns RJ, Geffen GM, Geffen LB. Covert orientation of visual attention in Parkinson’s disease. Neuropsychologia. 1990;28:151–159. doi: 10.1016/0028-3932(90)90097-8. [DOI] [PubMed] [Google Scholar]
- 42.Wright MJ, Geffen GM, Geffen LB. Event-related potentials associated with covert orientation of visual attention in Parkinson’s disease. Neuropsychologia. 1993;31:1283–1297. doi: 10.1016/0028-3932(93)90098-k. [DOI] [PubMed] [Google Scholar]
- 43.Yamada T, Izyuuinn M, Schulzer M, Hirayama K. Covert orienting attention in Parkinson’s disease. J Neurol Neurosurg Psychiatry. 1990;53:593–596. doi: 10.1136/jnnp.53.7.593. [DOI] [PMC free article] [PubMed] [Google Scholar]
- 44.Yamaguchi S, Tsuchiya H, Kobayashi S. Electroencephalographic activity associated with shifts of visuospatial attention. Brain. 1994;117:553–562. doi: 10.1093/brain/117.3.553. [DOI] [PubMed] [Google Scholar]


