

Abstract
We studied the neural correlates of visuomotor sequence learning using functional magnetic resonance imaging (fMRI). In the test condition, subjects learned, by trial and error, the correct order of pressing two buttons consecutively for 10 pairs of buttons (2 × 10 task); in the control condition, they pressed buttons in any order. Comparison between the test condition and the control condition revealed four brain areas specifically related to learning: the dorsolateral prefrontal cortex (DLPFC), the presupplementary motor area (pre-SMA), the precuneus, and the intraparietal sulcus (IPS). We found that the time course of activation during learning was different between these areas. To normalize the individual differences in the speed of learning, we classified the performance of each subject into three learning stages: early, intermediate, and advanced stages. Both the relative increase of signal intensity and the number of activated pixels within the four areas showed significant changes across the learning stages, with different time courses. The two frontal areas, DLPFC and pre-SMA, were activated in the earlier stages of learning, whereas the two parietal areas, precuneus and IPS, were activated in the later stages. Specifically, DLPFC, pre-SMA, precuneus, and IPS were most highly activated in the early stage, in both the early and intermediate stages, in the intermediate stage, and in both the intermediate and advanced stages, respectively. The results suggest that the acquisition of visuomotor sequences requires frontal activation, whereas the retrieval of visuomotor sequences requires parietal activation, which might reflect the transition from the declarative stage to the procedural stage.
Keywords: visuomotor sequence, learning, functional magnetic resonance imaging, procedure, prefrontal cortex, presupplementary motor area, precuneus, intraparietal sulcus
The pattern of human brain activation in motor learning has been extensively studied using various paradigms, including pursuit rotor task (Grafton et al., 1992, 1994), complex sequential finger movements (Seitz et al., 1990; Schlaug et al., 1994; Karni et al., 1995), sequential eye movements (Petit et al., 1996), and serial reaction time task (Grafton et al., 1995; Rauch et al., 1995), as well as motor learning with trial and error (Jenkins et al., 1994; Jueptner et al., 1997a,b). These studies have shown activation of several areas in the association cortices and subcortical structures. Specifically, the prefrontal and posterior parietal cortices were activated when the subject was explicitly learning a new motor behavior (Jenkins et al., 1994; Schlaug et al., 1994; Grafton et al., 1995; Jueptner et al., 1997a), and the activation decreased when the subjects had learned the behavior (Seitz et al., 1990; Grafton et al., 1994; Jenkins et al., 1994). However, there have been few studies until recently that asked whether the time course of activation was different between the prefrontal and posterior parietal areas (Shadmehr and Holcomb, 1997).
We have been studying the neural mechanism of learning using a behavioral paradigm called 2 × 10 task (2 × 5 task for monkeys) (Hikosaka et al., 1995, 1996). In this task, 10 pairs of targets are presented consecutively in a fixed order, and subjects have to press the corresponding buttons in the correct order that they have to find by trial and error. After repeating the same sequence sufficiently often, the performance of the subject becomes nearly automatic. This task was first applied to experiments using monkeys (Hikosaka et al., 1995). Miyashita et al. (1995) showed that the neurons in the presupplementary motor area (pre-SMA) were activated preferentially for new sequences and that the activity decreased over time as the monkey acquired the sequence. However, it was difficult to compare the activities between different areas simultaneously. Imaging studies should be advantageous in this respect. We thus decided to apply the same task to human subjects using the functional magnetic resonance imaging (fMRI) technique. In the preceding paper, we reported that the anterior portion of the medial premotor cortex, which was presumed to be the pre-SMA, was activated during learning (Hikosaka et al., 1996). In the present study, we found that two frontal areas (including the pre-SMA) and two parietal areas showed learning-related activation. Our main interest was to compare the time course of activation among the four cortical areas.
MATERIALS AND METHODS
Subjects
Seven normal subjects participated in the study (six males and one female; ages 29–50; all right-handed). Informed consents were obtained from all of the subjects before the study. Four of the seven subjects were studied repeatedly.
Stimuli and apparatus
Four white rectangles arranged in a two × two matrix were shown on a screen in which two circles appeared simultaneously (called “set”). A total of 10 sets (called “hyperset”) was sequentially presented in a fixed order. Presentation of the stimuli and generation of the sequence were controlled by a computer (PC9801FA or PC9821Ap2; NEC). The subjects lay supine in the MRI scanner and saw the visual stimuli through a mirror. They held a plate on which four button switches were arranged in a two × two matrix, corresponding to the four rectangles on the screen. During the fMRI experiments, an auditory cue was presented at a constant rate of 1 Hz through headphones.
Behavioral task
True learning: test condition. The test paradigm, “true learning,” required the subjects to learn the correct order of button presses by trial and error (Hikosaka et al., 1996) and was modified from the 2 × 5 task originally devised for monkeys (Hikosaka et al., 1995). The subject was asked to press sequentially the two buttons corresponding to the circles presented on the screen with the index and the middle fingers of both hands. Instruction was given to use only one finger per button. The positions and the order of the circles were fixed in each set, as was the order of the 10 sets within one hyperset (an example is shown in Fig.1). The subject had to find the correct order of button presses by trial and error for the consecutive 10 sets. If a button was pressed in the wrong order in any set, the two circles disappeared simultaneously, and after a pause of 0.5 sec, the subject had to start over again from the first set of the sequence. If the buttons were pressed in the correct order, the circles disappeared after each button press, and after a pause of 0.1 sec, the next set started. After successful completion of 10 sets, the same hyperset was repeated from the beginning. Because there was no general rule to find out the correct order, the subject had to learn the whole hyperset as a single unique sequence.
Fig. 1.

Diagram of 2 × 10 position sequence task. The subjects had to press sequentially the two buttons corresponding to the positions of the displayed circles (set). The correct order of the button presses was predetermined by the computer, and the subjects had to find it by trial and error. Ten consecutive sets (Hyperset) were presented in a fixed order. If the subjects pressed a button in the wrong order in any set or completed the hyperset, they started the same sequence from the first set.
Pseudo learning: control condition. The aim of the present study was to analyze the learning-related brain activation. However, the test paradigm required the subjects to look at the visual stimuli and to move their fingers. To subtract these sensorimotor activities, we devised a control paradigm that we call “pseudo learning,” in which the subject experienced the same sensorimotor processes but in which no learning was involved. In this task, two circles appeared simultaneously within a two × two matrix, and the subject had to press the corresponding buttons, similarly to the true-learning task. However, the correct order of button presses was randomized for each trial. Therefore, it was no use for the subject to try to learn the correct order, and the subject was instructed to press the buttons in any order. To mimic the true-learning process, we decreased gradually the probability of error for a given set from the chance level (50%) to 0% each time the set was completed successfully. Thus, the number of completed sets in each trial gradually increased up to 10 sets, similarly to the true-learning process.
Using pseudo learning as the control task and true learning as the test task, we performed fMRI experiments. Comparison of the magnetic resonance signals between the two conditions would reveal selectively the learning-related activation. Additionally, on a separate session, we measured the reaction time of button pressing to see the change in the speed of information processing during learning.
Procedures for fMRI experiment
Before the fMRI experiments, the subjects were instructed about the task and practiced both the true-learning and pseudo-learning tasks on a training hyperset. After the subjects practiced for ∼0.5 hr, the following fMRI experiments were conducted using a new hyperset.
Subjects were scanned using the head coil of a 1.5 tesla whole-body scanner (Siemens, Erlangen, Germany). Head motion was reduced by using a bite bar, straps around the forehead, and ear fixation blocks. First, we obtained a high resolution series of T1-weighted anatomical images of the whole brain (FLASH; TR/TE/TI/FA/matrix/FOV, 2800/4/300/15/256 × 256/256 × 256; slice thickness, 1 mm) in contiguous sagittal sections, which served as the data set for the determination of anatomical landmarks and coordinates.
Then, a time series of 128 scans were performed with interscan intervals of 4.0 sec (five subjects) or 6.0 sec (two subjects), while the subjects performed eight alternating epochs of the test and control tasks. In each scan, 10 axial slices of T2-weighted gradient-echo echo-planar images (TR/TE/TI/FA, 122/66/300/90) were collected parallel to the line connecting the anterior and posterior commissure (AC–PC line), and the bottom slice was adjusted to include the AC–PC line. Images of 5 mm thickness were obtained with a 128 × 128 matrix and 1.72 × 1.72 mm in-plane resolution.
The subject performed true learning for the test epochs and pseudo learning for the control epochs. The same hyperset was used throughout the eight test epochs. Hypersets for the test and control conditions were different, so that the subject could not practice (or rehearse) the test sequence. The pseudo-learning task was complex enough to prevent the mental rehearsal of the hyperset that the subject was learning in the test condition. In the control epochs, unlike in the test epochs, the order of sets was randomized so that the subject could not learn a particular sequence spontaneously. The rate of button presses was controlled for both the test and control conditions; the subject was asked to pace two button presses (i.e., one set) with an auditory cue presented at a constant rate of 1 Hz. “Learn” or “pseudo” were presented on the screen before each epoch to indicate the next condition. During that time, one dummy scan was acquired that was not included in the functional analysis, followed by seven scans for the test or control epoch. The times between stimulus presentation and button presses as well as the judgment of the button presses (correct or wrong) were recorded and stored in the computer.
Analysis of behavioral data
fMRI experiments. The number of completed sets in each trial of the subjects was recorded. Because each epoch lasted 28 (4 × 7) sec or 42 (6 × 7) sec and a successful performance of the whole hyperset took 10 sec, the subjects could complete the whole hyperset from two to four times within an epoch (if they made no error). The number of trials within an epoch could be larger if the subject made errors (see Fig. 2).
Fig. 2.
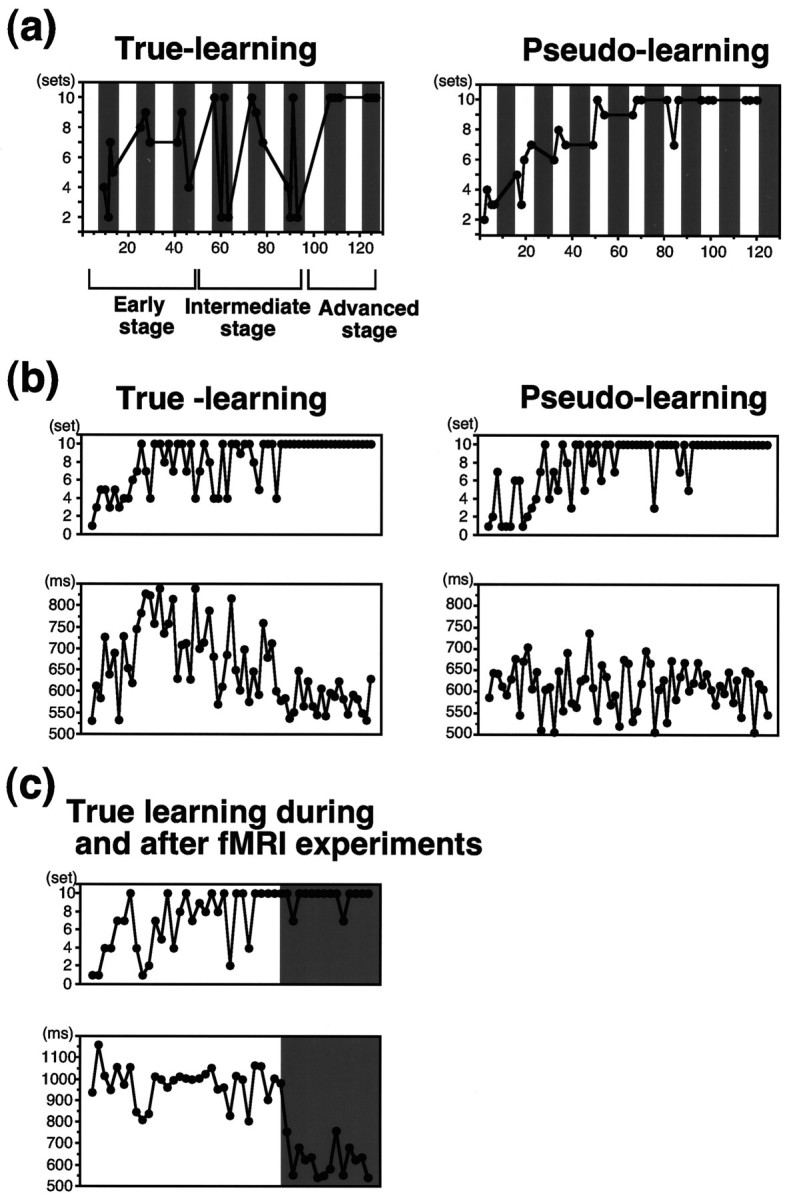
a, Performance of one subject (see Table 1, subject 2-1) during a session of the fMRI experiment. The number of completed sets in each trial is plotted against the serial scan number separately for the test condition (true learning, left) and for the control condition (pseudo learning, right). The increase in the number of completed sets was observed both for the true-learning and for the pseudo-learning conditions. For true learning, the eight test epochs (shaded areas) were classified into three learning stages (see Materials and Methods). b, Performance of one subject during a session for reaction time measurements. The number of completed sets (top) and the set completion time (the mean time to complete a set;bottom) in each trial are plotted against the serial trial number separately for the true-learning (left) and for the pseudo-learning (right) conditions.c, Performance of one subject for true learning during (clear area) and after (shaded area) a session of an fMRI experiment. The number of completed sets (top) and the set completion time (bottom) are shown. During the fMRI experiment, the set completion time remained ∼1.0 sec, because the movement (two presses) was paced by an auditory cue at 1 Hz. After the fMRI experiment, the subject was asked to perform the same hyperset as quickly as possible. The accuracy of the performance was maintained, whereas the set completion time became as short as that for the advanced stage in the session for reaction time measurements (see b).
To correlate the brain activation with the grade of learning, we classified the eight test epochs into one of the three learning stages based on the performance of individual subjects (which showed considerable variation) using the following criteria: early stage, epochs in which the subject could not complete the hyperset; intermediate stage, epochs in which the subject could complete the hyperset but also made errors in other trials; and advanced stage, epochs in which the subject made no error.
The experiments in which the subjects could not reach the advanced stage or reached it only in the last test epoch were not included for further analysis. These subjects were tested again using a new hyperset until they showed sufficient learning.
Reaction time measurements. In the fMRI experiments, the button presses were paced. We thought, however, that it was important to know the speed of information processing during learning. We thus performed an experiment for reaction time measurements as a separate session. The subjects, seated in front of the computer, were asked to learn a new hyperset by pressing buttons as quickly as possible and at the same time to minimize the number of errors while learning a hyperset. In each trial, the number of completed sets as well as the performance time for each trial was recorded. “Set completion time” was calculated for each trial by dividing the performance time by the number of completed sets; it corresponded to the mean time to complete a set (to press two buttons in a set).
An additional experiment was performed for four subjects to estimate the grade of learning after a learning session of the fMRI experiment. The subjects were asked to learn a hyperset in the same way they did in the fMRI experiments with their movement rate paced at 1 Hz, after which they were asked to perform the same hyperset as quickly as possible. The set completion time was calculated to see whether the improvement of performance occurred during the fMRI experiment similarly to that in the reaction time measurement session.
Eye movement recording. Eye movements were recorded in one subject by using an infrared eye tracker (Ober 2–12 bit parallel system; Permobil Meditech, Woburn, MA), while the subject performed the same task procedure used in the fMRI experiment. This session was conducted within the MRI scanner, but no scan was performed because it would cause severe artifacts on the eye movement recordings. The saccades with an amplitude exceeding 2° were counted every 30 sec for both the test and control conditions. This amplitude corresponded to the angular distance between two adjacent circles on the screen.
Analysis of fMRI data
Motion correction. First, we applied a motion correction program, AIR 3.0, to the obtained images (Woods et al., 1992, 1993). The first image of the sequence was designated as the reference, and each subsequent image volume was aligned with the reference in a pairwise manner. After a ratio-variance minimization process for each pair, a new time sequence of image sets was created by reslicing each of the original image sets. This program would produce images with residual motion under 0.5 mm and would remove significant motion-induced artifacts while restoring true regions of activation (Jiang et al., 1995).
Overview of the time course analysis. Based on these functional image data sets, we identified learning-related areas and analyzed the time course of activation for these areas. To account for the difference in the learning performance between subjects, we compared the pattern of brain activation between the three learning stages described above using two methods, one method based on the change in the relative signal intensity (SI) increase and the other based on the change in the number of activated pixels.
For the SI method, we first created activation maps from the entire time series of SI data and identified learning-related areas. We then calculated the time course of activation for each learning-related area. The disadvantage of this method is that the brain area that was activated only for a short period during the learning process would not have been detected.
Such errors would be minimized by the activated-pixel method. We divided the entire learning period into the three learning stages based on the performance of the subject and created an activation map for each learning stage. However, the data obtained with this method would not reflect the change in the magnitude of activation.
Therefore, we used these two methods so that each method would compensate for the shortcomings of the other. The details of these methods are described in the following sections.
Time course analysis 1: change in SI. In the first method, we analyzed the time course of SI changes for representative brain areas that showed significant activation based on the data for the entire learning period. After eliminating the SI data during the instruction period (16 data points), the time series of SI data (112 data points, seven scans in each of the eight epochs for the test and the control conditions) was cross-correlated with an idealized reference function derived from task alternation (Bandettini et al., 1992, 1993; Friston et al., 1994). The reference function was represented by a boxcar waveform shifted by one data point to account for the hemodynamic latencies and rise times. If the correlation coefficient (CC) calculated for a pixel was >0.3, the pixel was determined to show learning-related activation. This threshold of 112 data points corresponds to a statistical significance of p< 0.001 for the Student’s t test. Pixels activated in isolation were excluded from the activation maps. For graphical presentation, we assigned colors from red to dark blue for CCs of 1.0 to −1.0. These activation foci were superimposed onto the corresponding coplanar anatomical echo-planar images. The locations of the activation foci were determined further on the basis of the high resolution T1-weighted FLASH images by using a multiplanar reconstruction method. Although the functional images obtained by the echo-planar sequence were distorted compared with the anatomical images obtained by the FLASH sequence, we could determine the location of each activation focus by identifying the major sulci and gyri (Ono et al., 1990; Duvernoy, 1991; Naidich et al., 1995).
In addition, the high resolution anatomical images for each subject were individually registered onto the Talairach atlas (Talairach and Tournoux, 1988) with a polynomial transformation using MEDx 2.0 (Sensor Systems), and the coordinates of the learning-related areas were obtained. This procedure was taken only to confirm the consistency of the location of learning-related areas across the subjects, and we used the untransformed data for the subsequent time course analysis. Also no attempt was made to average the activation maps for different subjects, which would likely have resulted in artifactually diminished magnitudes of activation. Thus, the learning-related areas were identified individually for each subject.
To analyze the time course of brain activation, we calculated ΔSI, the SI change (test − control), for each of the eight test epochs individually for each activation focus. Before averaging the SIs within each activation focus, the relative SI change between the test and control conditions was analyzed individually for each pixel. Pixels with abnormally high SI increases (>10%) would be suspect for underlying vasculatures. Close inspection of the T2-weighted echo-planar anatomical images usually revealed underlying vasculatures in the corresponding areas that showed up as dark spots. These data containing vasculatures were excluded from the analysis. Then the average of the SIs of all the pixels within each activation focus was calculated for each of the 112 functional image data sets. Then, the average of the SIs for the before and after control epochs (seven data points for each) was subtracted from the average SI at the given test epoch (seven data points) and was expressed as the percent of the averaged SI for the control condition: ΔSI(n) = 100 × ([mean SI_T(n)] − [mean SI_C(n,n + 1)]) / [mean SI_C(n, n + 1)], where ΔSI(n) is the ΔSI for the nth test epoch, mean SI_T(n) is the mean SI of the nth test epoch, and mean SI_C(n, n + 1) is the mean SI of the nth and (n + 1)th control epochs. An exception was that ΔSI for the last test epoch, ΔSI(8), was calculated by subtracting only the mean SI for the eighth control epoch.
ΔSI thus calculated should reflect the degree of learning-related activation for the given test epoch, and the change in ΔSI across the eight learning epochs would reflect the time course of activation at the selected brain area. We then calculated the mean of ΔSIs during each learning stage to correlate the individual learning performance to the time course of brain activation. Thus, the ΔSIs across the learning stages obtained for individual subjects were compared using Wilcoxon’s signed rank test.
Time course analysis 2: change in the number of activated pixels. In the second method, we created activation maps individually for each of the three learning stages. The time series of SI data for each learning stage was separately cross-correlated with the boxcar reference function, and significant activation was determined as pixels above the threshold CC. Pixels activated in isolation were eliminated from the analysis, and the activation foci observed in more than four subjects were analyzed. For each learning stage, the threshold CC was determined so as to correspond to thep value of 0.01. The corresponding CC was calculated by the following equation (B. Pütz et al., unpublished observations): CC = [t2 / (t2 + n − 2)]1/2, where t represents the Student’st test value for n − 2 degrees of freedom (n denotes the number of data points included in the CC calculation). For example, when the subjects completed the hyperset in the fourth test epoch, the SI data from the first to the third test and control epochs were included in the data set for the early stage. The number of data points was 42 (2 conditions × 7 scans × 3 epochs), resulting in the 40 degrees of freedom. Because thet value corresponding to a p value of 0.01 is 2.423, the corresponding CC was calculated to be 0.3578. The activation map for the early stage was created by using this value of CC.
In this way, three activation maps were created for each subject, each map corresponding to one learning stage. We counted the number of activated pixels for each activation focus and then compared them between the three learning stages using Wilcoxon’s signed rank test.
RESULTS
Behavioral data
fMRI experiments
The subjects, lying supine in the MRI scanner, learned a single sequence (hyperset) during a session of the fMRI experiment. The learning was divided into eight epochs (test condition), which were alternated with eight epochs of pseudo learning (control condition).
Four of the seven subjects did not show sufficient learning within the period of the fMRI experiment and were tested again using a new sequence. Only the data with sufficient learning were analyzed. As the subjects learned a hyperset in the test condition, the number of completed sets for each trial gradually increased (Fig.2a, left). The whole hyperset (i.e., 10 sets) has been completed usually by the third to the sixth test epoch (e.g., fourth test epoch for the subject shown in Fig. 2a). However, the learning was incomplete, and the subjects still made errors before completing the hyperset (e.g., fourth to the sixth epochs in Fig. 2a). By the sixth to the eighth epoch, the subjects were able to complete the hyperset without an error (e.g., seventh test epoch in Fig. 2a).
In the control condition (pseudo learning), the subjects were allowed to press the two buttons in any order, but the correct order was randomized for each trial, with the probability of error gradually decreasing from the chance level. In consequence, the number of completed sets increased similarly to the process in true learning, and the subject “completed” the whole hyperset usually by the fourth to the sixth control epoch (Fig. 2a, right).
Reaction time measurements
We performed an experiment for reaction time measurements as a separate session. The subjects were asked to press buttons as quickly as possible. The main parameter used here was set completion time, which was the mean time required to complete a single set (i.e., time for pressing two buttons in a set). The learning process, measured as the number of completed sets, was similar to that observed in the fMRI experiment (compare Fig. 2b, left, with 2a, left).
The set completion time was relatively short in the early stage of learning (average of the first five trials for all subjects, 657 ± 83 msec) and showed a gradual increase usually until the subjects completed the hyperset (i.e., 10 sets) for the first time (839 ± 132 msec for the average of five trials after the first completion of the hyperset). In the intermediate stage, the set completion time decreased gradually. In the advanced stage (when the subjects made no errors), the set completion time remained short (662 ± 75 msec for the first five consecutive completions of the hyperset). The results suggested that different modes of information processing occurred for the three learning stages. We therefore classified the eight epochs of fMRI experiments into the three learning stages as described in the Materials and Methods.
In pseudo learning, the subjects were allowed to press buttons in any order (Fig. 2b, right). Although the number of completed sets increased, the set completion time remained short (571 ± 68 msec for the average of 20 trials), suggesting that cognitive processes were unchanged during pseudo learning.
We considered the possibility that the characteristics of learning may be different between the fMRI and the reaction time experiments, depending on whether or not movements were paced. We thus asked the subjects to perform a hyperset as quickly as possible after they had learned the hyperset in the same way as in the fMRI experiment. We found that they could perform the task nearly completely and quickly (Fig. 2c). The set completion time was 626 ± 67 msec for the average of five trials after the fMRI task procedure, which was shorter than that for the advanced stage in the reaction time experiment (Fig. 2b). The finding suggests that the subjects acquired a sequential procedure during the fMRI experiment even though they had to keep the movement rate constant.
Eye movement recording
The number of saccades exceeding 2° for every 30 sec period was 33 ± 4.9 for the true-learning and 35 ± 6.0 for the pseudo-learning conditions. For true learning, the number was relatively constant throughout the learning process (35 for the early stage, 31 for the intermediate stage, and 34 for the advanced stage). Therefore, the eye movement itself would have little effect on the brain activation observed in the present study.
fMRI data
Identification of learning-related areas
We first identified learning-related areas by cross-correlating all of the SI data with the reference function (Fig.3). Among them, four areas were consistently active across the seven subjects, as indicated bypink circles in Figure 3. These areas were located in the medial premotor and lateral prefrontal cortex and in the medial and lateral parietal cortex.
Fig. 3.

Activation maps for a single representative subject (see Table 1, subject 2-1) based on the entire learning process. Magnetic resonance images for eight axial slices are shown (top left to bottom right for slices 1–8, respectively). The other two slices, top and bottom slices, had been discarded after a motion correction. Theleft in each image represents the right hemisphere. Pixels with correlation coefficients >0.3 (corresponding top < 0.001) are shown inyellow–red colors, which are indicated by the color bar at the bottom. Areas with prominent activation are indicated by pink circlesand include the medial premotor cortex (slice 2), the lateral prefrontal cortex (slice 4), the medial parietal cortex (slices 4 and 5), and the lateral parietal cortex (slices 3 and 4). Additional activation sites are found in the anterior portion of the cingulate gyrus (slice 3) and the posterior end of the middle frontal gyrus (slice 1).
The activation focus in the lateral prefrontal cortex was located in the middle frontal gyrus, which corresponded to Brodmann’s area (BA) 46 and was designated as the DLPFC (Petrides and Pandya, 1994) (Fig. 4). The left side was activated in all of the seven subjects, whereas the right side was activated in five (Table 1).
Fig. 4.
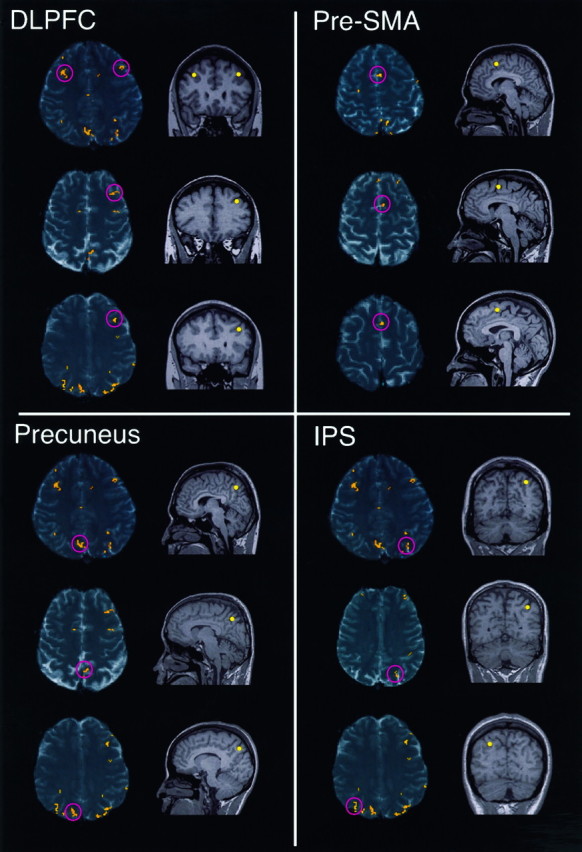
Four cortical areas related to learning. The locations of activated areas are shown on the T1-weighted coronal (left, pink circles) or sagittal (right, yellow dots) structure images. Images from three subjects (see Table 1, subjects 2-1, 3-1, and 4-1) are shown for each of the following four areas: DLPFC, pre-SMA, precuneus, and IPS. The right hemisphere is shown on theleft in each image.
Table 1.
Coordinates of learning-related areas
| Subject | DLPFC | Pre-SMA | Precuneus | IPS | ||||||||||||
|---|---|---|---|---|---|---|---|---|---|---|---|---|---|---|---|---|
| Left | Right | Left | Right | Left | Right | Left | Right | |||||||||
| x y z | z score | x y z | z score | x y z | zscore | x y z | z score | x y z | z score | x y z | zscore | x y z | z score | x y z | z score | |
| 1-11-159 | (−40, 24, 36) | 5.26 | (−6, 8, 48) | 7.65 | (−8, −58, 38) | 7.21 | (−28, −74, 32) | 5.79 | (22, −78, 32) | 5.66 | ||||||
| 1-2* | (−42, 28, 34) | 5.62 | (38, 28, 34) | 5.20 | (−8, 10, 46) | 7.56 | (−12, −62, 40) | 8.75 | (2, −66, 34) | 10.4 | (−26, −68, 34) | 8.53 | (24, −72, 40) | 8.13 | ||
| 1-3 | (−44, 24, 32) | 5.61 | (−6, 10, 46) | 4.21 | (−10, −64, 40) | 7.64 | (4, −66, 40) | 6.17 | (−30, −72, 40) | 7.51 | (24, −76, 40) | 5.56 | ||||
| 2-1* | (−34, 30, 34) | 4.29 | (38, 36, 40) | 4.80 | (−2, 6, 54) | 4.97 | (−4, −68, 36) | 5.26 | (4, −58, 40) | 5.47 | (−26, −66, 36) | 4.74 | (28, −64, 36) | 4.77 | ||
| 2-21-159 | (−30, 30, 34) | 4.39 | (30, 26, 34) | 5.70 | (6, 8, 48) | 3.46 | (−4, −62, 40) | 4.07 | (6, −66, 40) | 5.81 | (−22, −64, 40) | 6.20 | (30, −64, 40) | 5.46 | ||
| 2-3 | (−36, 26, 38) | 7.64 | (28, 26, 38) | 6.49 | (4, 6, 52) | 6.53 | (−6, −60, 38) | 5.46 | (6, −64, 38) | 7.30 | (−28, −68, 38) | 4.44 | (30, −66, 38) | 4.31 | ||
| 3-1* | (−34, 32, 34) | 4.91 | (34, 36, 34) | 3.14 | (−8, 8, 54) | 3.34 | (−10, −66, 42) | 6.17 | (4, −68, 42) | 6.35 | (−30, −64, 42) | 6.25 | (34, −64, 42) | 5.09 | ||
| 3-21-159 | (−38, 30, 38) | 5.84 | (−8, −66, 38) | 3.58 | (8, −64, 38) | 3.67 | (−34, −68, 38) | 5.15 | (28, −62, 38) | 4.34 | ||||||
| 4-1* | (−42, 26, 32) | 4.04 | (40, 20, 38) | 4.23 | (−4, 12, 48) | 4.02 | (−2, −62, 38) | 5.74 | (2, −66, 44) | 6.28 | (−22, −72, 36) | 4.51 | (28, −66, 40) | 4.55 | ||
| 4-21-159 | (−38, 38, 38) | 4.08 | (−4, 12, 52) | 3.40 | (−2, −58, 38) | 4.08 | (6, −60, 38) | 9.41 | (−26, −78, 38) | 4.88 | (24, −62, 38) | 3.75 | ||||
| 5* | (−34, 28, 38) | 4.99 | (38, 36, 32) | 4.38 | (−4, 8, 46) | 7.74 | (−2, −64, 36) | 3.60 | (2, −68, 36) | 3.44 | (−24, −66, 32) | 4.31 | (32, −66, 26) | 5.08 | ||
| 6* | (−38, 24, 38) | 4.29 | (4, 4, 54) | 4.60 | (−6, −70, 38) | 6.77 | (4, −68, 38) | 6.02 | (−26, −78, 38) | 5.88 | (28, −76, 38) | 5.57 | ||||
| 7* | (−42, 24, 34) | 4.56 | (−6, 6, 54) | 4.28 | (−2, −70, 42) | 4.91 | (4, −70, 42) | 4.27 | (−32, −64, 42) | 4.63 | (38, −68, 42) | 5.02 | ||||
Coordinates of the most significantly activated pixels for the four cortical areas related to learning. The coordinates are obtained after transformation of the brain images of individual studies onto the Talairach atlas and are shown in millimeters. x, Distance to right (+) or left (−) of midsagittal line; y, distance anterior (+) or posterior (−) to vertical plane through anterior commissure; and z, distance above (+) or below (−) AC–PC line. Subjects 1 and 2 were tested three times, and subjects 3 and 4 were tested twice. The studies with asterisks served as the dataset for the subsequent time course analysis. The subjects did not show sufficient learning in the studies with
F1-159: .
The medial premotor cortex activation was located above the cingulate sulcus, slightly anterior to the AC with respect to the AC–PC line (Fig. 4) (see Table 1). In the preceding paper, we have determined this area to be the pre-SMA (Hikosaka et al., 1996), which was originally described in monkeys (Tanji, 1994). Consistent with our previous observation, activation of the pre-SMA was observed unilaterally, six subjects in the left hemisphere and one in the right (Table 1).
The activation focus within the medial parietal cortex was located in the precuneus, the medial aspect of BA 7 (Fig. 4). Bilateral activation was observed in all subjects. Although unilateral activation of precuneus is shown in Figure 4, activation on the other side was found in different slices (see Fig. 3). The number of activated pixels was significantly larger for the right hemisphere than for the left (average for all subjects, 17 pixels for the right and 10 for the left;p < 0.01, Student’s paired t test).
The lateral parietal activation was found within the posterior portion of the IPS (Fig. 4). Bilateral activation was observed in all subjects. The number of activated pixels was not significantly different between hemispheres (average for all subjects, 16 pixels for the right and 15 for the left).
The coordinates of these four areas are shown in Table 1. They were similar across the seven subjects and were consistent across repeated experiments for individual subjects.
Other activation foci were found within the cingulate cortex, well anterior to the AC (observed in four subjects; slice 3 in Fig. 3), which corresponds to the rostral cingulate area in BA 32 (Picard and Strick, 1996), and within the anterior wall of the middle part of the precentral sulcus (observed in three subjects; slice 1 in Fig. 3), which corresponds to the frontal eye field (Paus, 1996). Although an activation focus was observed within the anterior part of the insular cortex, most of the activated pixels included the underlying vasculatures. Therefore, the insular activation focus was not analyzed.
Learning-related changes in signal intensity
For all of the foci described above, the mean SI was generally higher in the test epochs than in the control epochs (Fig.5). However, the difference in SI between the test and the control epochs, ΔSI, changed across the eight alternations differently for these areas. Namely, the ΔSI for the left DLPFC (Lt DLPFC) and the pre-SMA was large at the beginning and decreased toward the end, whereas that for the precuneus and the IPS was initially small and then increased in the middle part of the experiment.
Fig. 5.
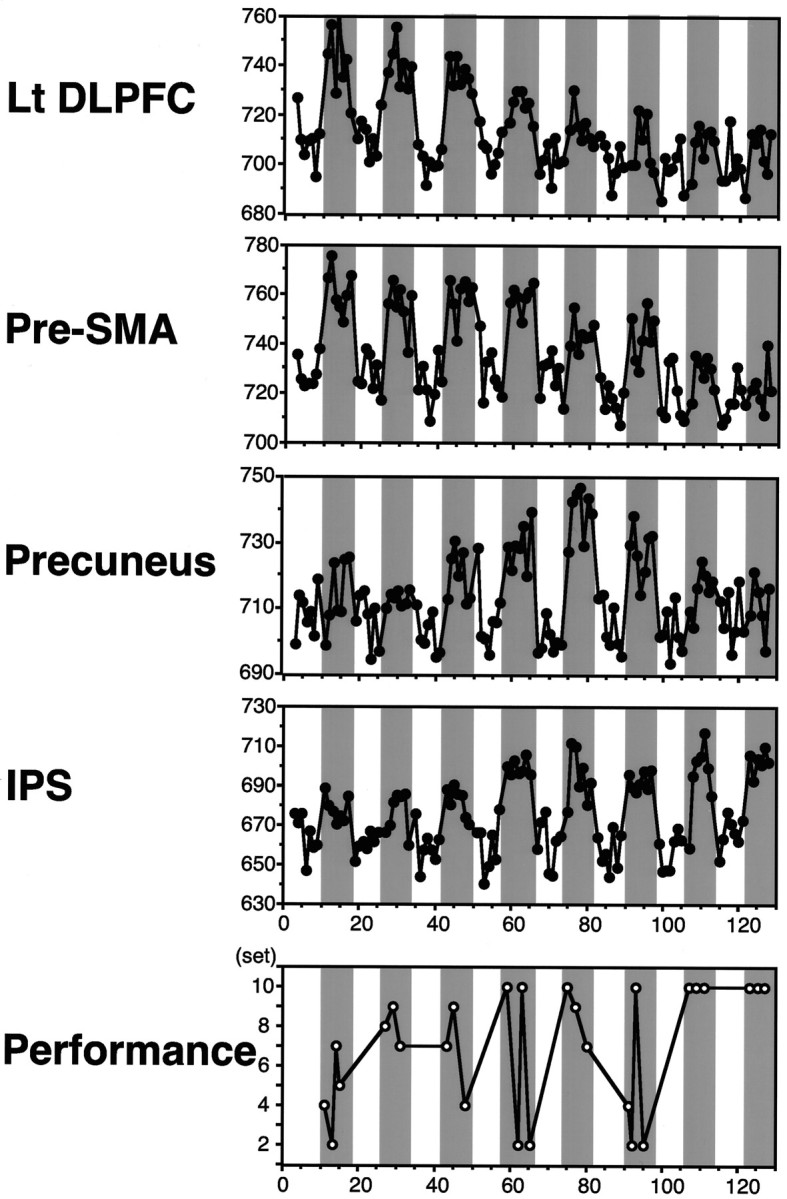
Changes in signal intensity in the four learning-related cortical areas during learning of a single visuomotor sequence (plotted against the serial scan number). On thebottom is shown the learning performance (number of completed sets). Data are from a single subject (see Table 1, subject 2-1). Open and shaded areas correspond to the control epochs (pseudo learning) and test epochs (true learning), respectively, except that they have been shifted by one data point to take account of the delayed change in blood oxygenation level. Data for the instruction periods have been omitted.
We found that the time courses of ΔSI were different for different subjects depending on their learning performance (Fig.6). For the subject with a good performance (Fig. 6, subject 5), the pre-SMA and precuneus activation decreased earlier than did that in subject 2-1. For the subject with a poor performance (Fig. 6, subject 4-2), the left DLPFC and pre-SMA activation stayed high, whereas the precuneus and the IPS remained less activated.
Fig. 6.

Time course of signal intensity changes depends on the learning performance. For three subjects whose learning performances varied (bottom; number of completed sets), ΔSIs (i.e., test − control) are plotted against the eight test epochs (top). Data are shown individually for the four cortical areas. The subject numbers correspond to those in Table1.
Learning-related changes in number of active pixels
We so far have identified learning-related areas by examining the signal intensity data across the entire learning period. With this method, however, areas might not have been detected that showed signal intensity changes only during a particular learning stage. We therefore classified the eight test epochs into three learning stages (Fig.7, bottom) and created activation maps for each of the three learning stages (Fig. 7).
Fig. 7.
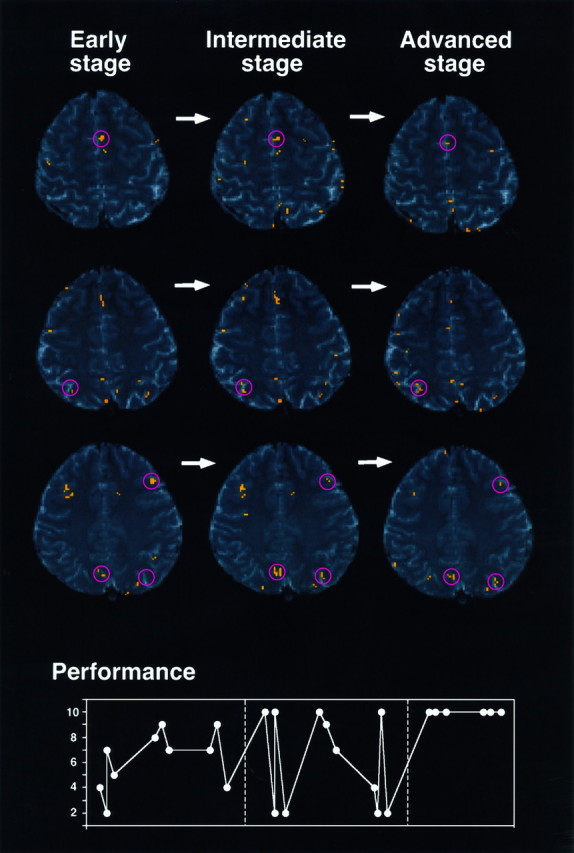
Activation maps for the early, intermediate, and advanced stages (the same subject analyzed in Fig. 3). Three contiguous slices, which correspond to slices 2, 3, and 4 in Figure 3, are shown in the first to third rows, respectively. Clusters of activated pixels are indicated by pink circles. The learning performance of the subject (number of completed sets), on which the determination of the three learning stages (divided by hatched lines) was based, is shown (bottom).
The results were similar to those obtained by the preceding analysis (compare Fig. 7 with Fig. 3). Activation foci (p< 0.01) were found in the left DLPFC, pre-SMA, precuneus, and IPS in all the subjects, the right DLPFC (Rt DLPFC) in six subjects, and the rostral cingulate area in four subjects. Of interest is the fact that the number of activated pixels changed across the three learning stages. The number of active pixels appears larger in the earlier stages of learning for the left DLPFC (Fig. 7, third row) and for the pre-SMA (first row), whereas it appears larger in the later stages of learning for the precuneus (third row) and for the IPS (second and third rows).
Time course of activation across learning stages
We then examined whether learning-related changes in activation were commonly observed across subjects in terms of the SI change and in terms of the number of activated pixels (Fig.8). To account for the difference in the learning performance between the subjects, we classified the eight test epochs into three learning stages for individual subjects (see Fig. 7; Materials and Methods).
Fig. 8.

Across-subject comparison showing the correlation of individual cortical activation with learning stages.a, Signal intensity changes (mean ΔSI).b, Number of activated pixels. For each cortical area, data obtained from seven subjects are shown for the three learning stages: early (left), intermediate (center), and advanced (right) stages. Paired comparisons were made between the learning stages using Wilcoxon’s signed rank test; significant differences (p < 0.05) are indicated byasterisks.
First, the pattern of the mean ΔSI change was similar across subjects but different across the brain areas (Fig. 8a). The mean ΔSI for the left DLPFC was highest in the early stage of learning. A significant difference (Wilcoxon’s signed rank test; p< 0.05) was observed between the early and intermediate stages and also between the early and advanced stages. The right DLPFC was activated in five subjects, and the mean ΔSI was relatively higher in the early and intermediate stages compared with that for the advanced stage. The mean ΔSI for the pre-SMA was higher in the early or intermediate stage than in the advanced stage. The mean ΔSI for the precuneus was higher in the intermediate stage than in the early or advanced stage. The mean ΔSI for the IPS was higher in the intermediate or advanced stage than in the early stage. The mean ΔSI for the rostral cingulate area was higher in the early and intermediate stages than in the advanced stage.
Second, very similar time courses of activation were found in terms of the number of activated pixels (Fig. 8b). The statistical comparison using Wilcoxon’s signed rank test showed significant differences that were identical with those observed for the signal intensity data.
DISCUSSION
Frontal-to-parietal activation during visuomotor sequence learning
We identified four cortical areas that were related to learning of visuomotor sequences: DLPFC, pre-SMA, precuneus, and IPS. The learning-related activation of the prefrontal and parietal areas have been shown in previous studies (Seitz et al., 1990; Grafton et al., 1992; Rauch et al., 1995; Blaxton et al., 1996). However, there have been few studies that asked whether these areas were differentially activated (see, however, Passingham et al., 1997).
We now demonstrate that the time course of activation was different between these areas. The two frontal areas, DLPFC and pre-SMA, became active in the early stage of learning, followed by activation of the two parietal areas, precuneus and IPS, in the intermediate or advanced stages. Recently, Shadmehr and Holcomb (1997) reported a similar prefrontal-to-parietal transition of activation in motor memory consolidation. These data might suggest a similarity between the neural mechanisms for the short-term learning in our paradigm (<10 min) and those for the long-term memory consolidation in the study of Shadmehr and Holcomb (1997) (6 hr).
In the present study, we found that there were some differences between the two frontal areas and the two parietal areas. The left DLPFC was highly active in the early stage of learning, whereas the right DLPFC and the pre-SMA were active in the early and the intermediate stages. The precuneus and the IPS became active in the intermediate stage, but only the IPS remained active in the advanced stage. Thus, a specific set of brain areas was activated in each learning stage.
Possible information processes underlying the transition of learning stages
Learning a new procedure requires attention initially, but the procedure becomes automatic eventually. This can be viewed as a transition from the declarative stage to the procedural stage (Fitts, 1964; Anderson, 1982). It is thought that attentive processes are performed one at a time, whereas automatic processes are performed in parallel (Schneider and Shiffrin, 1977; Kahneman and Treisman, 1984). This is shown experimentally as the difference in the processing time (typically measured as a reaction time). As the number of processed items increases, the processing time increases for the attentive process (Sternberg, 1966; Sternberg et al., 1978) but stays at a lower level for the automatic process (Treisman and Gelade, 1980; Schneider and Fisk, 1982; Fendrich et al., 1991).
In our behavioral experiment in which the subjects were instructed to learn a hyperset as quickly as possible (reaction time measurements), the processing time was represented by the set completion time. In the early stage, it increased monotonically with the number of processed items (sets), suggesting that the underlying processes were declarative (attentive). The set completion time then decreased in the intermediate stage during which the subjects tried to process all 10 items (i.e., sets), although sometimes without success. This suggests that the procedural process had started to work, whereas the declarative process was still required. The set completion time reached its lowest level in the advanced stage during which the subjects were able to process the 10 items perfectly, suggesting that the declarative process gradually gave way to the procedural process. Thus the process of learning involves various cognitive components that change over time. Based on the above consideration, we suggest functional roles for the four cortical areas.
DLPFC
The DLPFC activation was marked in the early stage, when the declarative (attentive) process is thought to dominate. This finding is consistent with the idea that the DLPFC is the central neural substrate for the working-memory process (Goldman-Rakic, 1987; Funahashi et al., 1989; Jonides et al., 1993; Petrides et al., 1993a; McCarthy et al., 1994), in which attentive manipulation of stored information is necessary (Baddley, 1992). A similar decrease in the DLPFC activation with learning has been shown in previous studies (Jenkins et al., 1994;Shadmehr and Holcomb, 1997).
The prolonged activation of the right DLPFC compared with the left is consistent with the idea that the former subserves retrieval processes, whereas the latter subserves encoding processes (Petrides et al., 1993b; Shallice et al., 1994; Tulving et al., 1994; Fletcher et al., 1995a, 1996).
Pre-SMA
Learning-related activation of the pre-SMA confirmed our previous report (Hikosaka et al., 1996) and is consistent with the results of single unit recordings in monkeys performing the same paradigm (Miyashita et al., 1995); in the initial phase of learning, pre-SMA neurons showed vigorous activity, which decreased dramatically as learning proceeded. Furthermore, the reversible blockade of the pre-SMA by muscimol injections impaired the new learning but not the performance of well-learned sequences (Miyashita et al., 1996b).
A functional distinction between pre-SMA and SMA proper was proposed in experiments using monkeys (Tanji, 1994). Recent positron emission tomography (PET) and fMRI studies suggest that the pre-SMA is also present in humans and is located slightly anterior to the anterior commissure (Picard and Strick, 1996). Unlike the SMA proper, the pre-SMA has been shown to be active in tasks that required selection of actions (Deiber et al., 1991, 1996; Rao et al., 1997), working memory (Paulesu et al., 1993; Buckner et al., 1996), and sequential saccades (Petit et al., 1996).
Our study showed that the pre-SMA, unlike the left DLPFC, remained active in the intermediate stage during which the declarative process was being replaced by the procedural process. This suggests that the pre-SMA receives declarative information from the DLPFC, via corticocortical connections (Dum and Strick, 1991; Matsuzaka et al., 1992; Luppino et al., 1993), and uses it to generate a procedure for sequential button presses.
Precuneus
The precuneus was activated preferentially in the intermediate stage, in which the information on the whole sequence had been acquired in working memory. This suggests that the precuneus may play a role in retrieving the sequence from memory, as suggested by Sadato et al. (1996). Consistent with this idea, the precuneus has been shown to be active in the execution of prelearned saccade sequences (Petit et al., 1996) and in the navigation of familiar routes (Ghaem et al., 1997). Crucial in navigation is the information on visuomotor sequences, as in our 2 × 10 task.
The reduced precuneus activation in the advanced stage suggests that the activation reflects declarative access to the sequence memory. This is consistent with previous reports showing that the precuneus is active in verbal memory tasks (Grasby et al., 1993; Shallice et al., 1994; Buckner et al., 1996) and manipulation of visual imagery (Roland and Gulyás, 1994; Fletcher et al., 1995b, 1996).
IPS
Unlike the precuneus, the IPS remained active in the advanced stage beyond the intermediate stage. This suggests that the IPS is more involved in the procedural process.
The IPS is thought to be part of the dorsal visual system that carries spatial information (Ungerleider and Mishkin, 1982). Another aspect of the dorsal visual system is that it is related to “intention” or “action” rather than “perception” (Goodale and Milner, 1992;Mazzoni et al., 1996; Snyder et al., 1997). Neurons in the monkey parietal cortex including the IPS become active during manipulation of particular objects (Taira et al., 1990). Lesions in the parietal cortex are known to induce apraxia, an inability to manipulate common objects (Heilman and Rothi, 1985). However, it is still unknown whether the memories for visuomotor sequences, as implemented in our 2 × 10 task, are also stored in the IPS.
The posterior portion of IPS is related to saccadic eye movements (Andersen and Gnadt, 1989; Kawashima et al., 1996; Petit et al., 1996).Miyashita et al. (1996a) showed that anticipatory eye–hand movements were critical for skilled performance in the 2 × 5 task, which developed later in the long-term learning. The posterior IPS activation would possibly reflect the process for the eye–hand coordination.
Integrated learning system
Studies from our laboratory using monkeys have shown that the subcortical structures also participated in learning and/or memory of visuomotor sequences. Miyachi et al. (1997) showed that the anterior part of the caudate/putamen is related to the learning of new sequences, whereas the midposterior putamen is related to the performance of well-learned sequences. The results were supported by a recent PET study (Jueptner et al., 1997b). In addition, Lu et al. (1996) showed that the dorsal part of the dentate nucleus was important for the storage or retrieval of long-term memories for well-learned sequences. These studies, together with recent imaging studies (Passingham et al., 1997; Shadmehr and Holcomb, 1997), suggest that cerebral cortical (frontal and parietal) areas, basal ganglia, and cerebellum all contribute to visuomotor sequence learning but with different time courses until procedural skills are eventually stored as long-term memories.
Footnotes
This study was supported by the Japan Society for Promotion of Science Research for the Future program and by the Basic Research System Core. We are grateful to H. Imamizu and M. Kawato in the Japan Science and Technology Corporation for their cooperation in the Talairach registration of the functional images.
Correspondence should be addressed to Dr. Okihide Hikosaka, Department of Physiology, Juntendo University School of Medicine, 2-1-1 Hongo, Bunkyo-ku, Tokyo 113, Japan.
REFERENCES
- 1.Andersen RA, Gnadt JW. Posterior parietal cortex. In: Wurtz RH, Goldberg ME, editors. The neurobiology of saccadic eye movements. Elsevier; Amsterdam: 1989. pp. 315–335. [PubMed] [Google Scholar]
- 2.Anderson JR. Acquisition of cognitive skill. Psychol Rev. 1982;89:369–406. [Google Scholar]
- 3.Baddley A. Working memory. Science. 1992;255:556–559. doi: 10.1126/science.1736359. [DOI] [PubMed] [Google Scholar]
- 4.Bandettini PA, Wong EC, Hinks RS, Tikofsky RS, Hyde JS. Time course of EPI of human brain function during task activation. Magn Reson Med. 1992;25:390–397. doi: 10.1002/mrm.1910250220. [DOI] [PubMed] [Google Scholar]
- 5.Bandettini PA, Jesmanovicz A, Wong EC, Hyde JS. Processing strategies for time-course data sets in functional MRI of the human brain. Magn Reson Med. 1993;30:161–173. doi: 10.1002/mrm.1910300204. [DOI] [PubMed] [Google Scholar]
- 6.Blaxton TA, Zeffiro TA, Gabrieli JDE, Bookheimer SY, Carrillo MC, Theodore WH, Disterhoft JF. Functional mapping of human learning: a positron emission tomography activation study of eyeblink conditioning. J Neurosci. 1996;16:4032–4040. doi: 10.1523/JNEUROSCI.16-12-04032.1996. [DOI] [PMC free article] [PubMed] [Google Scholar]
- 7.Buckner RL, Raichle ME, Miezin FM, Petersen SE. Functional anatomic studies of memory retrieval for auditory words and visual pictures. J Neurosci. 1996;16:6219–6235. doi: 10.1523/JNEUROSCI.16-19-06219.1996. [DOI] [PMC free article] [PubMed] [Google Scholar]
- 8.Deiber M-P, Passingham RE, Colebatch JG, Friston KJ, Nixon PD, Frackowiak RSJ. Cortical areas and the selection of movement: a study with positron emission tomography. Exp Brain Res. 1991;84:393–402. doi: 10.1007/BF00231461. [DOI] [PubMed] [Google Scholar]
- 9.Deiber M-P, Ibanez V, Sadato N, Hallett M. Cerebral structures participating in motor preparation in humans: a positron emission tomography study. J Neurophysiol. 1996;75:233–247. doi: 10.1152/jn.1996.75.1.233. [DOI] [PubMed] [Google Scholar]
- 10.Dum RP, Strick PL. The origin of corticospinal projections from the premotor areas in the frontal lobe. J Neurosci. 1991;11:667–689. doi: 10.1523/JNEUROSCI.11-03-00667.1991. [DOI] [PMC free article] [PubMed] [Google Scholar]
- 11.Duvernoy HM. The human brain. Surface, three dimensional sectional anatomy and MRI. Springer; Vienna: 1991. [Google Scholar]
- 12.Fendrich DW, Healy AF, Bourne LEJ. Long-term repetition effects for motoric and perceptual procedures. J Exp Psychol Learn Mem Cognit. 1991;17:137–151. doi: 10.1037//0278-7393.17.1.137. [DOI] [PubMed] [Google Scholar]
- 13.Fitts PM. Perceptual-motor skill learning. In: Melton AW, editor. Categories of human learning. Academic; New York: 1964. pp. 243–285. [Google Scholar]
- 14.Fletcher PC, Frith CD, Grasby PM, Shallice T, Frackowiak RSJ, Dolan RJ. Brain systems for encoding and retrieval of auditory-verbal memory. Brain. 1995a;118:401–416. doi: 10.1093/brain/118.2.401. [DOI] [PubMed] [Google Scholar]
- 15.Fletcher PC, Frith CD, Baker SC, Shallice T, Frackowiak RSJ, Dolan RJ. The mind’s eye–precuneus activation in memory related imagery. NeuroImage. 1995b;2:195–200. doi: 10.1006/nimg.1995.1025. [DOI] [PubMed] [Google Scholar]
- 16.Fletcher PC, Shallice T, Frith CD, Frackowiak RSJ, Dolan RJ. Brain activity during memory retrieval: the influence of imagery and semantic cuing. Brain. 1996;119:1587–1596. doi: 10.1093/brain/119.5.1587. [DOI] [PubMed] [Google Scholar]
- 17.Friston KJ, Jezzard P, Turner R. The analysis of functional MRI time series. Hum Brain Mapp. 1994;1:153–171. [Google Scholar]
- 18.Funahashi S, Bruce CJ, Goldman-Rakic PS. Mnemonic coding of visual space in the monkey’s dorsolateral prefrontal cortex. J Neurophysiol. 1989;61:331–349. doi: 10.1152/jn.1989.61.2.331. [DOI] [PubMed] [Google Scholar]
- 19.Ghaem O, Mellet E, Crivello F, Tzourio N, Mazoyer B, Berthoz A, Denis M. Mental navigation along memorized routes activates the hippocampus, precuneus and insula. NeuroReport. 1997;8:739–744. doi: 10.1097/00001756-199702100-00032. [DOI] [PubMed] [Google Scholar]
- 20.Goldman-Rakic PS. Circuitry of primate prefrontal cortex and regulation of behavior by representational memory. In: Plum F, Mountcastle VB, editors. The nervous system, Vol V, Higher functions of the brain, Pt 1. American Physiological Society; Bethesda, MD: 1987. pp. 373–417. [Google Scholar]
- 21.Goodale MA, Milner AD. Separate visual pathways for perception and action. Trends Neurosci. 1992;15:20–25. doi: 10.1016/0166-2236(92)90344-8. [DOI] [PubMed] [Google Scholar]
- 22.Grafton ST, Mazziotta JC, Presty S, Friston KJ, Frackowiak RSJ, Phelps ME. Functional anatomy of human procedural learning determined with regional cerebral blood flow and PET. J Neurosci. 1992;12:2542–2548. doi: 10.1523/JNEUROSCI.12-07-02542.1992. [DOI] [PMC free article] [PubMed] [Google Scholar]
- 23.Grafton ST, Woods RP, Tyszka M. Functional imaging of procedural motor learning: relating cerebral blood flow with individual subject performance. Hum Brain Mapp. 1994;1:221–234. doi: 10.1002/hbm.460010307. [DOI] [PubMed] [Google Scholar]
- 24.Grafton ST, Hazeltine E, Ivry R. Functional mapping of sequence learning in normal humans. J Cognit Neurosci. 1995;7:497–510. doi: 10.1162/jocn.1995.7.4.497. [DOI] [PubMed] [Google Scholar]
- 25.Grasby PM, Frith CD, Friston KJ, Bench C, Frackowiak RSJ, Dolan RJ. Functional mapping of brain areas implicated in auditory-verbal memory function. Brain. 1993;116:1–20. doi: 10.1093/brain/116.1.1. [DOI] [PubMed] [Google Scholar]
- 26.Heilman KM, Rothi LJG. Apraxia. In: Heilman KM, Valenstein E, editors. Clinical neuropsychology. Oxford UP; New York: 1985. pp. 131–150. [Google Scholar]
- 27.Hikosaka O, Rand MK, Miyachi S, Miyashita K. Learning of sequential movements in the monkey–process of learning and retention of memory. J Neurophysiol. 1995;74:1652–1661. doi: 10.1152/jn.1995.74.4.1652. [DOI] [PubMed] [Google Scholar]
- 28.Hikosaka O, Sakai K, Miyauchi S, Takino R, Sasaki Y, Pütz B. Activation of human pre-supplementary motor area in learning of sequential procedures: a functional MRI study. J Neurophysiol. 1996;76:617–621. doi: 10.1152/jn.1996.76.1.617. [DOI] [PubMed] [Google Scholar]
- 29.Jenkins IH, Brooks DJ, Nixon PD, Frackowiak RSJ, Passingham RE. Motor sequence learning: a study with positron emission tomography. J Neurosci. 1994;14:3775–3790. doi: 10.1523/JNEUROSCI.14-06-03775.1994. [DOI] [PMC free article] [PubMed] [Google Scholar]
- 30.Jiang A, Kennedy DN, Baker JR, Weisskoff RM, Tootell RBH, Woods RP, Benson RR, Kwong KK, Brady TJ, Rosen BR, Belliveau JW. Motion detection and correction in functional MR imaging. Hum Brain Mapp. 1995;3:224–235. [Google Scholar]
- 31.Jonides J, Smith EE, Koeppe RA, Awh E, Minoshima S, Mintun MA. Spatial working memory in humans as revealed by PET. Nature. 1993;363:623–625. doi: 10.1038/363623a0. [DOI] [PubMed] [Google Scholar]
- 32.Jueptner M, Stephan KM, Frith CD, Brooks DJ, Frackowiak RSJ, Passingham RE. Anatomy of motor learning. I. Frontal cortex and attention to action. J Neurophysiol. 1997a;77:1313–1324. doi: 10.1152/jn.1997.77.3.1313. [DOI] [PubMed] [Google Scholar]
- 33.Jueptner M, Frith CD, Brooks DJ, Frackowiak RSJ, Passingham RE. Anatomy of motor learning. II. Subcortical structures and learning by trial and error. J Neurophysiol. 1997b;77:1325–1337. doi: 10.1152/jn.1997.77.3.1325. [DOI] [PubMed] [Google Scholar]
- 34.Kahneman D, Treisman A. Changing views of attention and automaticity. In: Parasuraman R, Davies DR, editors. Varieties of attention. Academic; New York: 1984. pp. 29–62. [Google Scholar]
- 35.Karni A, Meyer G, Jezzard P, Adams MM, Turner R, Ungerleider LG. Functional MRI evidence for adult motor cortex plasticity during motor skill learning. Nature. 1995;377:155–158. doi: 10.1038/377155a0. [DOI] [PubMed] [Google Scholar]
- 36.Kawashima R, Naitoh E, Matsumura M, Itoh H, Ono S, Satoh K, Gotoh R, Koyama M, Inoue K, Yoshioka S, Fukuda H. Topographic representation in human intraparietal sulcus of reaching and saccade. NeuroReport. 1996;7:1253–1256. doi: 10.1097/00001756-199605170-00006. [DOI] [PubMed] [Google Scholar]
- 37.Lu X, Hikosaka O, Miyachi S. Effects of cerebellar dentate nucleus inactivation on procedural memory in monkey. Neurosci Res [Suppl] 1996;20:S243. [Google Scholar]
- 38.Luppino G, Matelli M, Camarda R, Rizzolatti G. Corticocortical connections of area F3 (SMA-proper) and area F6 (pre-SMA) in the macaque monkey. J Comp Neurol. 1993;338:114–140. doi: 10.1002/cne.903380109. [DOI] [PubMed] [Google Scholar]
- 39.Matsuzaka Y, Aizawa H, Tanji J. A motor area rostral to the supplementary motor area (pre-supplementary motor area) in the monkey: neuronal activity during a learned motor task. J Neurophysiol. 1992;68:653–662. doi: 10.1152/jn.1992.68.3.653. [DOI] [PubMed] [Google Scholar]
- 40.Mazzoni P, Bracewell RM, Barash S, Andersen RA. Motor intention activity in the macaque’s lateral intraparietal area. I. Dissociation of motor from sensory memory. J Neurophysiol. 1996;76:1439–1456. doi: 10.1152/jn.1996.76.3.1439. [DOI] [PubMed] [Google Scholar]
- 41.McCarthy G, Blamire AM, Puce A, Nobre AC, Bloch G, Hyder F, Goldman-Rakic P, Shulman RG. Functional magnetic resonance imaging of human prefrontal cortex activation during a spatial working memory task. Proc Natl Acad Sci USA. 1994;91:8690–8694. doi: 10.1073/pnas.91.18.8690. [DOI] [PMC free article] [PubMed] [Google Scholar]
- 42.Miyachi S, Hikosaka O, Miyashita K, Karádi Z, Rand MK. Differential roles of monkey striatum in learning of sequential hand movement. Exp Brain Res. 1997;115:1–5. doi: 10.1007/pl00005669. [DOI] [PubMed] [Google Scholar]
- 43.Miyashita K, Hikosaka O, Lu X, Miyachi S. Neuronal activities in medial premotor area of monkey during learning of sequential movements. Soc Neurosci Abstr. 1995;21:1928. [Google Scholar]
- 44.Miyashita K, Rand MK, Miyachi S, Hikosaka O. Anticipatory saccades in sequential procedural learning in monkeys. J Neurophysiol. 1996a;76:1361–1366. doi: 10.1152/jn.1996.76.2.1361. [DOI] [PubMed] [Google Scholar]
- 45.Miyashita K, Sakai K, Hikosaka O. Effects of SMA and pre-SMA inactivation on learning of sequential movements in monkey. Soc Neurosci Abstr. 1996b;22:1862. [Google Scholar]
- 46.Naidich TP, Valavanis AG, Kubic S. Anatomic relationships along the low-middle convexity: part I–normal specimens and magnetic resonance imaging. Neurosurgery. 1995;36:517–532. doi: 10.1227/00006123-199503000-00011. [DOI] [PubMed] [Google Scholar]
- 47.Ono M, Kubik S, Abernathey CD. Atlas of the cerebral sulci. Thieme; Stuttgart, Germany: 1990. [Google Scholar]
- 48.Passingham RE, Toni I, Krams M, Turner R, Ashburner J, Friston K. The time-course of activity in motor areas during motor learning. NeuroImage. 1997;5:S12. [Google Scholar]
- 49.Paulesu E, Frith CD, Frackowiak RSJ. The neural correlates of the verbal component of working memory. Nature. 1993;362:342–345. doi: 10.1038/362342a0. [DOI] [PubMed] [Google Scholar]
- 50.Paus T. Location and function of the human frontal eye-field: a selective review. Neuropsychologia. 1996;34:475–483. doi: 10.1016/0028-3932(95)00134-4. [DOI] [PubMed] [Google Scholar]
- 51.Petit L, Orssaud C, Tzourio N, Crivello F, Berthoz A, Mazoyer B. Functional anatomy of a prelearned sequence of horizontal saccades in humans. J Neurosci. 1996;16:3714–3726. doi: 10.1523/JNEUROSCI.16-11-03714.1996. [DOI] [PMC free article] [PubMed] [Google Scholar]
- 52.Petrides M, Pandya DN. Comparative architectonic analysis of the human and the macaque frontal cortex. In: Boller F, Grafman J, editors. Handbook of neuropsychology. Elsevier; Amsterdam: 1994. pp. 17–58. [Google Scholar]
- 53.Petrides M, Alivisatos B, Evans AC, Meyer E. Dissociation of human mid-dorsolateral from dorsolateral frontal cortex in memory processing. Proc Natl Acad Sci USA. 1993a;90:873–877. doi: 10.1073/pnas.90.3.873. [DOI] [PMC free article] [PubMed] [Google Scholar]
- 54.Petrides M, Alivisatos B, Meyer E, Evans AC. Functional activation of the human frontal cortex during the performance of verbal working memory tasks. Proc Natl Acad Sci USA. 1993b;90:878–882. doi: 10.1073/pnas.90.3.878. [DOI] [PMC free article] [PubMed] [Google Scholar]
- 55.Picard N, Strick PL. Motor areas of the medial wall: a review of their location and functional activation. Cereb Cortex. 1996;6:342–353. doi: 10.1093/cercor/6.3.342. [DOI] [PubMed] [Google Scholar]
- 56.Rao SM, Bobholz JA, Hammeke TA, Rosen AC, Woodley SJ, Cunningham JM, Cox RW, Stein EA, Binder JR. Functional MRI evidence for subcortical participation in conceptual reasoning skills. NeuroReport. 1997;8:1987–1993. doi: 10.1097/00001756-199705260-00038. [DOI] [PubMed] [Google Scholar]
- 57.Rauch SL, Savage CR, Brown HD, Curran T, Alpert NM, Kendrick A, Fischman AJ, Kosslyn SM. A PET investigation of implicit and explicit sequence learning. Hum Brain Mapp. 1995;3:271–286. [Google Scholar]
- 58.Roland PE, Gulyás B. Visual imagery and visual representation. Trends Neurosci. 1994;17:281–287. doi: 10.1016/0166-2236(94)90057-4. [DOI] [PubMed] [Google Scholar]
- 59.Sadato N, Campbell G, Ibáñez V, Deiber MP, Hallet M. Complexity affects regional cerebral blood flow change during sequential finger movements. J Neurosci. 1996;16:2693–2700. doi: 10.1523/JNEUROSCI.16-08-02691.1996. [DOI] [PMC free article] [PubMed] [Google Scholar]
- 60.Schlaug G, Knorr U, Seitz RJ. Inter-subject variability of cerebral activations in acquiring a motor skill: a study with positron emission tomography. Exp Brain Res. 1994;98:523–534. doi: 10.1007/BF00233989. [DOI] [PubMed] [Google Scholar]
- 61.Schneider W, Fisk AD. Concurrent automatic and controlled visual search: can processing occur without resource cost? J Exp Psychol Learn Mem Cognit. 1982;8:261–278. [Google Scholar]
- 62.Schneider W, Shiffrin RM. Controlled and automatic human information processing. I. Detection, search, and attention. Psychol Rev. 1977;84:1–66. [Google Scholar]
- 63.Seitz RJ, Roland PE, Bohm C, Greitz T, Stone-Elander S. Motor learning in man: a positron emission tomographic study. NeuroReport. 1990;1:57–66. doi: 10.1097/00001756-199009000-00016. [DOI] [PubMed] [Google Scholar]
- 64.Shadmehr R, Holcomb HH. Neural correlates of motor memory consolidation. Science. 1997;277:821–825. doi: 10.1126/science.277.5327.821. [DOI] [PubMed] [Google Scholar]
- 65.Shallice T, Fletcher P, Frith CD, Grasby P, Frackowiak RSJ, Dolan RJ. Brain regions associated with acquisition and retrieval of verbal episodic memory. Nature. 1994;368:633–635. doi: 10.1038/368633a0. [DOI] [PubMed] [Google Scholar]
- 66.Snyder LH, Batista AP, Andersen RA. Coding of intention in the posterior parietal cortex. Nature. 1997;386:167–170. doi: 10.1038/386167a0. [DOI] [PubMed] [Google Scholar]
- 67.Sternberg S. High-speed scanning of human memory. Science. 1966;153:652–654. doi: 10.1126/science.153.3736.652. [DOI] [PubMed] [Google Scholar]
- 68.Sternberg S, Monsell S, Knoll RL, Wright CE. The latency and duration of rapid movement sequences: comparisons of speech and typewriting. In: Stelmach GE, editor. Information processing in motor control and learning. Academic; New York: 1978. pp. 117–152. [Google Scholar]
- 69.Taira M, Mine S, Georgopoulos AP, Murata A, Sakata H. Parietal cortex neurons of the monkey related to the visual guidance of hand movement. Exp Brain Res. 1990;83:29–36. doi: 10.1007/BF00232190. [DOI] [PubMed] [Google Scholar]
- 70.Talairach J, Tournoux P. Co-planar stereotaxic atlas of the human brain. Thieme; New York: 1988. [Google Scholar]
- 71.Tanji J. The supplementary motor area in the cerebral cortex. Neurosci Res. 1994;19:251–268. doi: 10.1016/0168-0102(94)90038-8. [DOI] [PubMed] [Google Scholar]
- 72.Treisman AM, Gelade G. A feature-integration theory of attention. Cognit Psychol. 1980;12:97–136. doi: 10.1016/0010-0285(80)90005-5. [DOI] [PubMed] [Google Scholar]
- 73.Tulving E, Kapur S, Craik FIM, Markowitch HJ, Houle S. Hemispheric encoding/retrieval asymmetry in episodic memory: positron emission tomography findings. Proc Natl Acad Sci USA. 1994;91:2016–2020. doi: 10.1073/pnas.91.6.2016. [DOI] [PMC free article] [PubMed] [Google Scholar]
- 74.Ungerleider LG, Mishkin M. Two cortical visual systems. In: Ingle DJ, Goodale MA, Manfield RJM, editors. Analysis of visual behavior. MIT; Cambridge, MA: 1982. pp. 549–585. [Google Scholar]
- 75.Woods RPW, Cherry SR, Mazziotta JC. Rapid automated algorithm for aligning and reslicing PET images. J Comput Assist Tomogr. 1992;16:620–633. doi: 10.1097/00004728-199207000-00024. [DOI] [PubMed] [Google Scholar]
- 76.Woods RPW, Cherry SR, Mazziotta JC. MRI-PET registration with an automated algorithm. J Comput Assist Tomogr. 1993;17:536–546. doi: 10.1097/00004728-199307000-00004. [DOI] [PubMed] [Google Scholar]