

Abstract
Fast excitatory synapses are generally thought to act as private communication channels between presynaptic and postsynaptic neurons. Some recent findings, however, suggest that glutamate may diffuse out of the synaptic cleft and bind to several subtypes of receptors, either in the perisynaptic membrane or at neighboring synapses. It is not known whether activation of these receptors can occur in response to the release of a single vesicle of glutamate. Here we estimate the spatiotemporal profile of glutamate in the extrasynaptic space after vesicle exocytosis, guided by detailed ultrastructural measurements of the CA1 neuropil in the adult rat. We argue that the vicinity of the synapse can be treated as an isotropic porous medium, in which diffusion is determined by the extracellular volume fraction and the tortuosity factor, and develop novel stereological methods to estimate these parameters. We also estimate the spatial separation between synapses, to ask whether glutamate released at one synapse can activate NMDA and other high-affinity receptors at a neighboring synapse. Kinetic simulations of extrasynaptic glutamate uptake show that transporters rapidly reduce the free concentration of transmitter. Exocytosis of a single vesicle is, however, sufficient to bind to high-affinity receptors situated in the immediate perisynaptic space. The distance separating a typical synapse from its nearest neighbor is ∼465 nm. Whether glutamate can reach a sufficient concentration to activate NMDA receptors at this distance depends critically on the diffusion coefficient in the extracellular space. If diffusion is much slower than in free aqueous solution, NMDA receptors could mediate crosstalk between neighboring synapses.
Keywords: diffusion, spillover, tortuosity, extrasynaptic, transporters, AMPA, NMDA
Several lines of evidence have recently converged to suggest that glutamate released at CNS synapses may not act exclusively via receptors situated within the synaptic cleft. First, the metabotropic glutamate receptor 1α (mGluR1α) is preferentially localized to the perisynaptic membrane (Baude et al., 1993). Such a location would serve little adaptive purpose unless glutamate molecules could escape from the synaptic cleft. Second, mGluR2 receptors occur on preterminal membranes of mossy fibers, relatively far away from sites of glutamate release (Yokoi et al., 1996). Glutamate released from mossy fiber terminals in the hippocampus can presynaptically inhibit further glutamate release, and this effect can be blocked by an mGluR2 antagonist (Scanziani et al., 1997). Assuming that the phenomenon is mediated by the preterminal receptors, it implies that glutamate must diffuse out of the synapse to activate them. Third, kainate acts on presynaptic receptors on GABAergic interneurons (Clarke et al., 1997), in a location where axoaxonic synapses have not been reported. Assuming, again, that these synapses serve an adaptive purpose, they must be bound by extrasynaptic glutamate. Finally, synaptically released glutamate elicits signals in hippocampal pyramidal cells that show a striking discrepancy in quantal structure, depending on which receptor is isolated pharmacologically. The average number of quanta (quantal content) mediated by NMDA receptors is consistently larger than that mediated by AMPA receptors (Kullmann, 1994; Isaac et al., 1995; Liao et al., 1995). This can be explained by proposing that glutamate acts locally on relatively low-affinity AMPA receptors but also acts nonlocally on the high-affinity NMDA receptors at neighboring synapses (Kullmann et al., 1996; Asztely et al., 1997; Kullmann and Asztely, 1998).
Because nonlocal actions of glutamate have wide-ranging implications for the specificity of synaptic transmission and the interpretation of quantal changes seen in use-dependent plasticity (Kullmann and Siegelbaum, 1995; Malenka and Nicoll, 1997), it is important to understand the spatiotemporal transmitter profile after exocytosis. We have therefore simulated the exocytosis of glutamate and its diffusion out of the synaptic cleft, as well as its interaction with transporters and the effects of the geometrical obstacles represented by glial processes and neurites. Some previous attempts to model extrasynaptic glutamate diffusion have relied on simplified geometric representations of the extracellular space (Barbour et al., 1994; Clements, 1996;Uteshev and Pennefather, 1997), which are difficult to relate to the neuropil in vivo. Here, we argue instead that a “typical” synapse, together with the extrasynaptic diffusion barriers, can be characterized on the basis of detailed ultrastructural measurements of the hippocampal neuropil. However, rather than adopting one particular, explicit representation, we treat it as a synaptic cleft surrounded by an isotropic porous medium, the latter described only by the extracellular volume fraction and the tortuosity factor (Nicholson et al., 1979; Barbour and Häusser, 1997). We describe novel methods to estimate these parameters from electron micrographs of the rat CA1 region. Although the results are relevant to several of the nonlocal actions of glutamate listed above, we relate them explicitly to the hypothesis that glutamate released at one synapse can activate NMDA receptors at a neighboring synapse. We therefore estimate the mean distance separating a typical synapse from its nearest neighbor and explore the probability of opening of AMPA and NMDA receptors positioned at various distances from a “donor” synapse.
MATERIALS AND METHODS
Quantitative electron microscopy. Electron microscopy preparations were generously provided by Heather Davies and Michael Stewart (The Open University). Briefly, four male Sprague Dawley rats (350–400 gm), anesthetized with pentobarbitone, were perfused transcardially with 2% glutaraldehyde and 2% paraformaldehyde in 0.1m PBS at room temperature. The brains were removed and placed in the same fixative overnight at 4°C. The next day 1 mm sagittal slabs across the entire left dorsal hippocampus (∼4 mm from the midline) were dissected, and the tissue was then trimmed to leave a block containing area CA1. The tissue was post-fixed in 1% osmium tetroxide, dehydrated, and embedded in Epon as described by Doubell and Stewart (1993). In each animal, ultrathin sections were cut to include area CA1. For morphometric analyses, digital images were acquired from a JEM 1010 electron microscope using a Kodak (Rochester, NY) Megaplus camera as follows. First, the areas of interest were selected using a relatively low-magnification (1200×) allowing observation of the whole section. A region was then selected in the proximal part of the basal dendrites in area CA1, 75–100 μm from the proximal edge of the pyramidal cell body layer. Within this region, 12–15 sampling frames (2-μm-wide squares), containing relatively homogeneous neuropil, were captured (Fig. 1A). Large dendritic shaft profiles and blood vessels were avoided, but sampling was otherwise randomized.
Fig. 1.

Morphometric analysis of neuropil. A, Representative picture of the neuropil in area CA1 of rat hippocampus. The sampling frame (2 μm square) is shown in white. pt, Presynaptic terminal;ds, dendritic spine; Ax, axon profile;De, dendritic profile. Scale bar, 400 nm.B, Binary traces of membrane profiles observed inA within the sampling frame. The narrow, vertically orientated rectangular frame represents sampling of surface profile fragments (indicated with dots) according to an infinitesimal approximation illustrated in Figure 2. The angles between each sampled fragment and a horizontal line therefore represent sampled values of Ω or Θ (see Materials and Methods). C, Visible intermembrane distances were measured in electron micrographs as distances between two peaks of gray levels (d in insets) in a direction perpendicular to the cell membranes (whitesegments).
Diffusion in the extracellular space. To model extracellular diffusion, we adopted the approach developed by Nicholson et al. (1979)(Nicholson and Phillips, 1981). In accordance with our morphometric assessment (see sections below), the extrasynaptic spatial environment (beyond the synaptic cleft) was treated as an isotropic porous medium, in which the obstacles to diffusion reduce to only two parameters: the extracellular volume fraction α, and the tortuosity factor λ. Assuming that the cell walls are impermeable to glutamate, the effect of the parameter α is to make the diffusion source stronger, by a factor 1/α, than in a free medium (Lehner, 1979, their Eqs. 24, 36;Nicholson and Phillips, 1981). λ, on the other hand, represents the increase in path length of a molecule diffusing around obstacles compared with free solution. Macroscopic diffusion in a porous material is described by the same fundamental differential equation as diffusion in a free medium (Fick’s second law):
| Equation 1 |
where C is the concentration of the diffusing substance, and D* is the apparent diffusion coefficient, which is related to its value in a free medium D byD* = D/λ2 (Harris and Burn, 1949;Fenstermacher and Patlak, 1975; Lehner, 1979). So far, α and λ have only been estimated on a scale of hundreds of micrometers by fitting solutions of diffusion equations to the concentration profiles of molecules iontophoresed into the extracellular space (Nicholson and Phillips, 1981; McBain et al., 1990; Lehmenkühler et al., 1993;Rice et al., 1993). Because cell bodies, blood vessels, and other macroscopic obstacles affect the movement of these molecules, it is not clear that the results can be readily extrapolated to the microenvironment of the synapse. We therefore estimated the parameters α and λ from electron micrographs of the CA1 neuropil with stereological methods.
Estimating the extracellular volume fraction α from electron micrographs. Provided that the tissue can be represented by a homogeneous and isotropic medium, the extracellular volume fraction α can be estimated from electron micrographs (that is, randomly oriented planar sections) simply by calculating the fractional area of the extracellular space (Underwood, 1970, p 27). This may, however, give a biased estimate because the thickness of ultrathin sections is normally larger than the distance between adjacent cell membranes. An alternative estimate of α can be obtained if the average distanced between apposing cell membranes is known. The mean total length of cell membrane profiles per unit area of micrographs,LA, provides an unbiased estimate of the mean total membrane surface area per unit volume of tissue, SV(Underwood, 1970, p 24):
| Equation 2 |
The extracellular volume fraction α in neuropil is then simply given by:
| Equation 3 |
The distance d between adjacent cell membranes was measured as follows. Image analysis routines (NIH Image) were used to place straight sampling segments on a calibrated electron micrograph, perpendicular to the interface between two cells (Fig. 1C,white bars); d was then estimated as the distance between two peaks in the profile of gray levels along the segment (Fig.1C, insets). The choice of membrane locations to be measured was randomized, and 40–60 measurements were made in each of four animals. To estimate LA we used the image analysis system to sample 2 × 2 μm fragments of neuropil and to trace narrow gaps between adjacent membrane profiles with black binary lines (Fig. 1A). In each sampling frame the rest of the image was cut off using thresholding, and the remaining traces were thinned down to one-pixel lines with a skeletonizing algorithm, as shown in Figure 1B. The total length of membrane profiles per frame (and therefore per section areaLA) was then measured automatically with an NIH Image macro. This procedure was repeated in 10 frames in each of four animals.
Estimating the tortuosity factor λ from electron micrographs. Consider an infinitesimally thin (thicknessdx) and narrow (width dy) slab of tissue perpendicular to the concentration gradient ▿C (Fig.2). Each diffusing particle crosses this slice of neuropil along a certain path AB =dq lying on a cell surface K, whereas in a free medium this particle would be simply translated by distancedx. Because dx is infinitesimally small, the fragment of K within the slice is a parallelogram with sidesdq* and dq**, and the direction of dqis effectively determined by a pair of forces acting on the diffusing particle: (1) normal N to K and (2) the “diffusion force field” parallel to ▿C (which is also the direction of dx). Because the position of Kin space is determined by two angles, Θ and Ω (see Fig. 2), basic geometry yields the following equivalences:
These expressions provide the relationship between dqand dx:
| Equation 4 |
The ratio dq/dx represents the “porous-to-free” increase in the path of the diffusing particle across the slab, that is, “local” tortuosity. The mean tortuosity λ can then be estimated by averaging dq/dxacross a large sample of thin and narrow slabs akin to that illustrated in Figure 2. Assuming that the medium is isotropic, angles Θ and Ω must have equivalent distributions. Furthermore, because cell membranes in the neuropil bend in an irregular and largely unpredictable manner, we can assume that the statistical correlation between Θ and Ω is negligibly weak (for a discussion of “random” cellular shapes as those showing weak dependence between their orthogonal projections, seeRusakov, 1993). Finally, because the assumption of isotropicity implies that diffusion in any direction is equivalent, we can treat the section of an electron micrograph as the plane containing dx −dq. The frequency distribution of angle Θ, or equally Ω, can then be estimated from electron micrographs by using a sampling procedure that reproduces the infinitesimal approximation illustrated in Figure 2. λ is then estimated from Equation 4 by performing a Monte Carlo sampling of Θ (or Ω).
Fig. 2.

Geometric assessment of tortuosity. A diffusing particle driven by diffusion gradient ▿C moves along the path dq = AB on surfaceK (with normal vector N) of a diffusion barrier. In free space, however, the particle would be translated by distance dx = AD. An infinitesimally thin (dx thick) slab perpendicular to ▿C intersects a planar fragment of surfaceK (diffusion barrier) giving the relationship between the particle path dq and two angles, Ω and Θ, which determine the orientation of the surface fragment.
The frequency distribution of Θ in area CA1 was estimated as follows. In each electron micrograph, the direction of diffusion was arbitrarily chosen to be horizontal, and the geometrical idealization illustrated in Figure 2 was reproduced by sampling the membrane profiles seen within narrow, vertically orientated rectangular slots (Fig.1B). Each membrane profile within the narrow window corresponded to segment dq* (or dq**). To minimize the departure from the idealized approximation, the sampling window width was set at ∼40 nm, so that the profiles appeared rectilinear. The values of angle Θ (or, equivalently, angle Ω) between each sampled segment and the horizontal were measured and recorded automatically using image analysis routines. The measurements were stored and later sampled randomly, with replacement, in Monte Carlo simulation experiments to estimate λ according to Equation 4(see Results).
The synaptic environment as a porous medium. A central assumption in the diffusion simulations is that the extrasynaptic neuropil can be treated as a homogenous porous medium on a scale relevant to the distance between neighboring synapses. We tested this assumption by asking whether any regular features (other than a uniform system of extracellular gaps) emerge when the arrangement of extrasynaptic obstacles is compared across a large number of synapses. Figure 3A shows a micrograph taken at random in area CA1. The area extending up to 1.5–2 μm from the active zone (AZ) of each synapse represents a random planar section through its microenvironment. The pattern of cell membranes in this area thus represents one of many possible profiles of the extracellular space available for extrasynaptic diffusion. We adopted a similar procedure as described above to reduce this pattern to binary lines one pixel wide (Fig. 3B). The position of each visible AZ center was labeled, and the corresponding presynaptic and postsynaptic parts were also noted (Fig. 3B). This procedure was then repeated in a total of 86 synapses. To combine the spatial information on extrasynaptic geometry across this population, individual binary outlines were translated and rotated so that the AZ profiles were centered, aligned, and superimposed, as illustrated in Figure3C (with a constant gray level representing each contributing profile). Because the problem is symmetrical about an axis perpendicular to the AZ orientation, each profile outline was combined with its mirror image, obtained by reflection about this axis. The profile image in Figure 3C represents a small sample (two synaptic profiles) of planar sections of the three-dimensional space available for extracellular diffusion near a typical synapse. The complete sample of possible diffusion paths surrounding 86 synapses is shown in Figure 3D. Gray levels in this image represent the probability for the extracellular space to occur in particular locations with respect to the AZ center. Two conclusions can be drawn from Figure 3D. First, within 100–120 nm of the AZ center, the extracellular space is confined to a narrow strip corresponding to the synaptic cleft (dark segment in the center) and is excluded from the presynaptic and postsynaptic elements (paler areas on either side of the cleft). Second, at distances of more than ∼120 nm from the AZ center, the probability that the extracellular space occurred at any point was uniform.
Fig. 3.

Typical geometry of synaptic microenvironment in CA1. A, Representative picture of the synaptic microenvironment in area CA1 of rat hippocampus. syn1,syn2, Two synaptic profiles of interest. Scale bar, 300 nm. B. Profile of the extracellular space obtained fromA using an image analysis algorithm (see Materials and Methods). Two synaptic active zones (AZ) are marked with short segments. C, Two synaptic profiles depicted inA (syn1, syn2) and B(segments) are centered, aligned, and superimposed (including their mirror images) with respect to the AZ center. The gray levels are reduced proportionately to the number of profiles. D.Superposition of 86 synaptic profiles. The gray level indicates the probability of encountering an extracellular space profile at any point relative to the AZ center.
Although this test does not prove that the extrasynaptic space is isotropic, it shows that there is no consistent pattern of extracellular space with cylindrical or spherical symmetry with respect to the typical synapse. Guided by these results, we consider a reasonable approximation of the typical constraints on the movement of glutamate to be a disk-shaped synaptic cleft, enclosed between two hemispheric obstacles to diffusion, and surrounded by a spherically isotropic porous medium. This arrangement is shown schematically in Figure 4; a synaptic vesicle releases its contents into the center of a flat cylindrical cleft between two solid hemispheres (radius of 100 nm). At the edge of the cleft the space transforms into an isotropic porous medium, in which the effective glutamate diffusion coefficient is reduced according to the expressionD* = D/λ2. We observed a tendency for presynaptic and postsynaptic membranes to be closer at the edge of the synaptic cleft than in the middle (Fig. 3A). Because this could represent an additional obstacle to diffusion to the extrasynaptic space, we measured the intermembrane separation at the edge and in the center of the cleft profile for 77 synapses (four animals). The mean separation between membranes at the edge fell to 61 ± 3% of its value in the middle of the cleft. We therefore incorporated this in the simulations, as indicated below (Simulations: parameter estimates).
Fig. 4.

Schematic diagram (two-dimensional profile of a three-dimensional model) of the synaptic environment adopted in the simulations. Arrows indicate the diffusion of glutamate (glu) from the cleft into the porous medium. See Materials and Methods for details.
Uptake of neurotransmitter. Extracellular glutamate uptake is likely to involve very rapid binding to transporters, which are located on cell membranes outside the synaptic cleft (Chaudhry et al., 1995), followed by relatively slow (dozens of cycles per second) translocation into the cell (Wadiche et al., 1995; Diamond and Jahr, 1997). The kinetics of glutamate binding and uptake can therefore be represented by a chain reaction:
where Glu denotes glutamate, B denotes the transporter, and GluB denotes the glutamate–transporter complex. The second step describes the effectively irreversible translocation of glutamate into an intracellular compartment, and reappearance of the unbound transporter, with rate k2. This scheme implies that, in the absence of diffusion, the following set of equations describes the glutamate concentration time course:
| Equation 5a |
| Equation 5b |
| Equation 5c |
where [B] and [CB] denote the concentrations of free and liganded transporters, respectively, and [Btot] is the total concentration of transporters. Equations 5-5 combined with the diffusion equation (Eq. 1) represent a complete system describing glutamate movement in the extracellular space. Because this system has no straightforward analytical solution, we instead modeled the role of uptake by computing fluxes of the free, bound, and translocated glutamate between thin concentric shells making up the geometrical representation of the perisynaptic space.
Noninstantaneous transmitter release. The spatiotemporal profile of glutamate within the synaptic cleft can be affected by noninstantaneous release from a synaptic vesicle (Wahl et al., 1996; Uteshev and Pennefather, 1997; Kleinle et al., 1996; Stiles et al., 1996). A reasonably general approximation for the time course of release is given by the function Φ(t):
| Equation 6 |
Setting ς = 39 msec−1 gives a release function in approximate agreement with that computed by Stiles et al. (1996) for rapid release of acetylcholine at the neuromuscular junction, assuming rapid expansion of the pore.
Simulations: parameter estimates. We simulated glutamate diffusion by computing fluxes between thin concentric shells (cylindrical within the cleft and spherical outside the cleft), in accordance with a numerical version of Equations 1 and 5. The transition from the free medium (in the cleft) to a porous medium (outside the cleft) was simulated by scaling the diffusion source at the last cylindrical shell by a factor 1/α. Two types of diffusion obstacles retarding the neurotransmitter flux at the cleft edge were incorporated: (1) a rapid change of diffusion coefficient, fromD to D* = D/λ2, and (2) a narrowing of the synaptic cleft at its edge, modeled by reducing the width of the last cylindrical shell by 40%. We used the following parameter estimates for the simulations: synaptic cleft radius = 100 nm; synaptic cleft width = 20 nm; and vesicle glutamate contents = 5000 molecules (Riveros et al., 1986; Burger et al., 1989; Bruns and Jahn, 1995). The extracellular volume fraction α was 0.12, and tortuosity factor λ was 1.34 (see Results). The initial level of glutamate was set to zero, and the initial concentration of free transporters in the extracellular space, [Btot], was 0.1 or 0.5 mm (see Discussion). The role of glutamate transporters was modeled by setting the binding rate constant at k+1 = 5 × 10⁶m/sec and the unbinding rate constant at k−1 = 100 sec−1(Diamond and Jahr, 1997). The rate constant for the step describing glutamate translocation (and the rest of the transport cycle),k2, was set at 20 sec−1 (Wadiche et al., 1995).
A critical unknown parameter is the free diffusion coefficientD for glutamate in the extracellular space. This is likely to be considerably lower than its value in free aqueous solution, generally assumed to be ∼0.75 μm2/msec (estimated for glutamine at room temperature; Longsworth, 1953), because of the viscosity of the medium and interactions with cell walls and extracellular macromolecules. We therefore explored a range of values for D, decreasing from 0.75 to 0.05 μm2/msec.
The simulation results were obtained with 190 concentric shells with thickness that varied between 10 and 50 nm. An “open boundary” condition was set at the last simulated shell, corresponding to ∼5 μm from the release site where the computed glutamate concentration was <10−8m. The time steps varied as a power function of time, with the smallest steps used for the fastest concentration changes and a total of 105–106 steps. We tested convergence of the numerical solution explicitly by verifying that a twofold increase in the number of integration steps produced <0.5% change in the results. We also verified the programmed solution by reducing the model to a simpler case, namely an instantaneous point source (by setting ς = 2000 msec−1 andR = 0 μm), with no transporters. The computed glutamate concentration time course was indistinguishable from the analytical solution (Crank, 1975, p 29) over the range 10−7–10−2m.
Glutamate receptor kinetics. To estimate the consequences of different glutamate concentration profiles on the membrane current flowing through AMPA and NMDA receptors, we used the kinetic schemes published by Jonas et al. (1993) and Lester and Jahr (1992), respectively. The rate constants are given in Table1, as identified in the general scheme:

Table 1.
Rate constants for the kinetic scheme assumed for AMPA and NMDA receptors
| Forward rate constants | Backward rate constants | ||||
|---|---|---|---|---|---|
| AMPA | NMDA | AMPA | NMDA | ||
| kon(m−1sec−1) | 4.59 × 10⁶ | 10 × 106 | koff1(sec−1) | 4.26 × 10³ | 4.7 |
| kon2(m−1sec−1) | 28.4 × 10⁶ | 5 × 10⁶ | koff2(sec−1) | 3.26 × 10³ | 9.4 |
| β (sec−1) | 4.24 × 10³ | 46.5 | α (sec−1) | 900 | 91.6 |
| kd+1(sec−1) | 2.89 × 10³ | 0 | kd−1(sec−1) | 39.2 | 0 |
| kd+2(sec−1) | 172 | 8.4 | kd−2(sec−1) | 0.727 | 1.8 |
| kd+3(sec−1) | 17.7 | 0 | kd−3(sec−1) | 4 | 0 |
| kd+4(m−1sec−1) | 1.27 × 10⁶ | 0 | kd−4(sec−1) | 45.7 | 0 |
| kd+5(sec−1) | 16.8 | 0 | kd−5(sec−1) | 190.4 | 0 |
The values are taken from Jonas et al. (1993) and Lester and Jahr (1992), respectively.
where R indicates the receptor, GluR, Glu2R, and Glu2R* represent the singly bound, doubly bound, and open states, respectively, and GluRD, Glu2RD, and Glu2R*D are three desensitized states.
The time course of the open probability (state Glu2R*) was calculated by direct integration of the transitions between the different states during each time step, starting with the system entirely occupying the unbound state. The time steps were deliberately made smaller (<1 μsec) at early times after the simulated release event, when the glutamate concentration changed rapidly, and the calculations were systematically repeated with smaller time steps to verify that the results were stable.
RESULTS
Extracellular space fraction, membrane surface areas, and geometric tortuosity of neuropil
The morphometric method illustrated in Figure1B was used to measure the total lengths of cell membrane profiles in 40 sampling frames (2-μm-wide squares) in four animals. This provided an estimate for the mean length of cell membrane profiles per unit area LA = 5.54 ± 0.09 μm/μm2 (mean ± SEM); therefore, for the mean surface area of cell membranes per unit volume (see Eq. 2)Sv = 7.05 ± 0.11 μm2/μm3 (two adjacent membranes counted as one; otherwise, the value should be doubled). The mean intermembrane distance measured as illustrated in Figure1C was 16.6 ± 0.3 nm (n = 214). These data allowed estimation of the extracellular volume fraction α = 0.117 ± 0.002.
The histogram of the values of Θ (or Ω), sampled according to the procedure illustrated in Figure 1B, is shown in Figure 5. Based on these data, 10 Monte Carlo simulations of Equation 4 yielded an estimate of the tortuosity factor λ = 1.34 ± 0.01 (mean ± SD).
Fig. 5.

Morphometric parameters estimated in the neuropil in area CA1. Frequency distribution of angles Ω and Θ, as shown in Fig. 2, sampled as illustrated in Figure 1B.N, Sample size.
Mean nearest neighbor distance between hippocampal synapses
The likelihood of significant crosstalk between neighboring synapses depends on the average intersynaptic distance. Electron micrographs of the hippocampal neuropil do not reveal any distinctive patterns in the distribution of AZs, except that two synapses cannot be closer to one another than is allowed by their physical dimensions (Rusakov et al., 1997). Therefore, by assigning the geometrical center of each AZ a point identifying its position in space, the spatial layout of synapses can be treated as a three-dimensional “hardcore” Poisson point process, that is, a uniformly random point pattern with the restriction that the minimum interpoint distance must be greater than the mean AZ size (Braendgaar and Gundersen, 1986). For an unconstrained Poisson point process, the probability density function of nearest neighbor distances (analogous to an experimental frequency histogram) is given by a stochastic geometry formula (Stoyan et al., 1987, p 49):
| Equation 7 |
where NV is the numerical synaptic density, andr is the distance from a typical point (AZ center). Thedotted line in Figure 6illustrates the distribution of the nearest neighbor distances given by Equation 7, taking the mean value of NV as 2.06 μm−3. This value was previously estimated in area CA1 in the rat hippocampus using a stereological dissector method (Rusakov et al., 1997). Assuming an unconstrained Poisson process, therefore, the mean nearest neighbor distance is ∼0.436 μm. At the same time, the average three-dimensional size of axospinous synapses in this area, represented by the mean “projected height” (Braendgaar and Gundersen, 1986), was evaluated to be ∼0.215 μm (Rusakov et al., 1997). This value represents the hard core for a uniformly random arrangement of the synapses. There is, however, no straightforward analytical solution for the mean nearest neighbor distance in a hardcore Poisson point process. We therefore devised the following Monte Carlo experiment to simulate an arrangement of idealized synapses, which results in parameters (spatial density and AZ size) corresponding to the experimental data (Rusakov et al., 1998). First, we generated a uniformly random Poisson point process in an 8-μm-sided cube, with a spatial density NV set by the numeric volume density of synapses observed experimentally (2.06 μm−3). Second, the simulated scatter was “thinned” systematically (Stoyan et al., 1987) by deleting all of the points that had nearest neighbors at a distance less than the AZ size. (Euclidean distances were calculated using a “minus-sampling” procedure, which eliminates edge bias; Stoyan et al., 1987). Finally, because the thinning lowered the total number of points, the entire procedure was repeated with a higher initial point density until the observed synaptic density was achieved. The histogram in Figure 6 shows the final result of this Monte Carlo procedure, obtained with 1053 simulated synapses and a minimum separation between AZ centers of 0.215 μm. The mean nearest neighbor distance was ∼0.465 μm. This is ∼1.7 times lower than the mean nearest neighbor distance, which would be expected if synapses with the same overall density were arranged in a regular cubic lattice: NV−1/3 = 0.786 μm.
Fig. 6.

Distribution of distances separating synapses from their nearest neighbors. Dotted line, Unconstrained Poisson process (purely random arrangement); solid histogram, hardcore Poisson process (minimum intersynapse distance = 0.21 μm); arrows indicate the corresponding mean values (see Results). N, Sample size;V, volume used for Monte Carlo simulations.
Simulation results
Figure 7A shows the simulated time course of the glutamate concentration within the synaptic cleft (radial distance = 50 nm) after release of 5000 molecules, with the free diffusion coefficient D ranging from 0.05 to 0.75 μm2/msec. The concentration of transporters in the extrasynaptic space was assumed to be 0.1 mm. Also plotted for comparison are the biexponential glutamate profiles estimated in hippocampal cultures by Clements et al. (1992) (also see Clements, 1996) and Diamond and Jahr (1997). For all but the highest free diffusion coefficients, the glutamate concentration reaches a higher peak than predicted by the biexponential profiles. The decay rate gradually slows, so that at later times the time courses given by Clements (1996) and Diamond and Jahr (1997) are better approximated with a low estimate of D. Reducing the number of molecules released (Fig. 7B) gives a better agreement with the early peak of the biexponential profiles but underestimates the later concentration unless D is <0.1 μm2/msec.
Fig. 7.
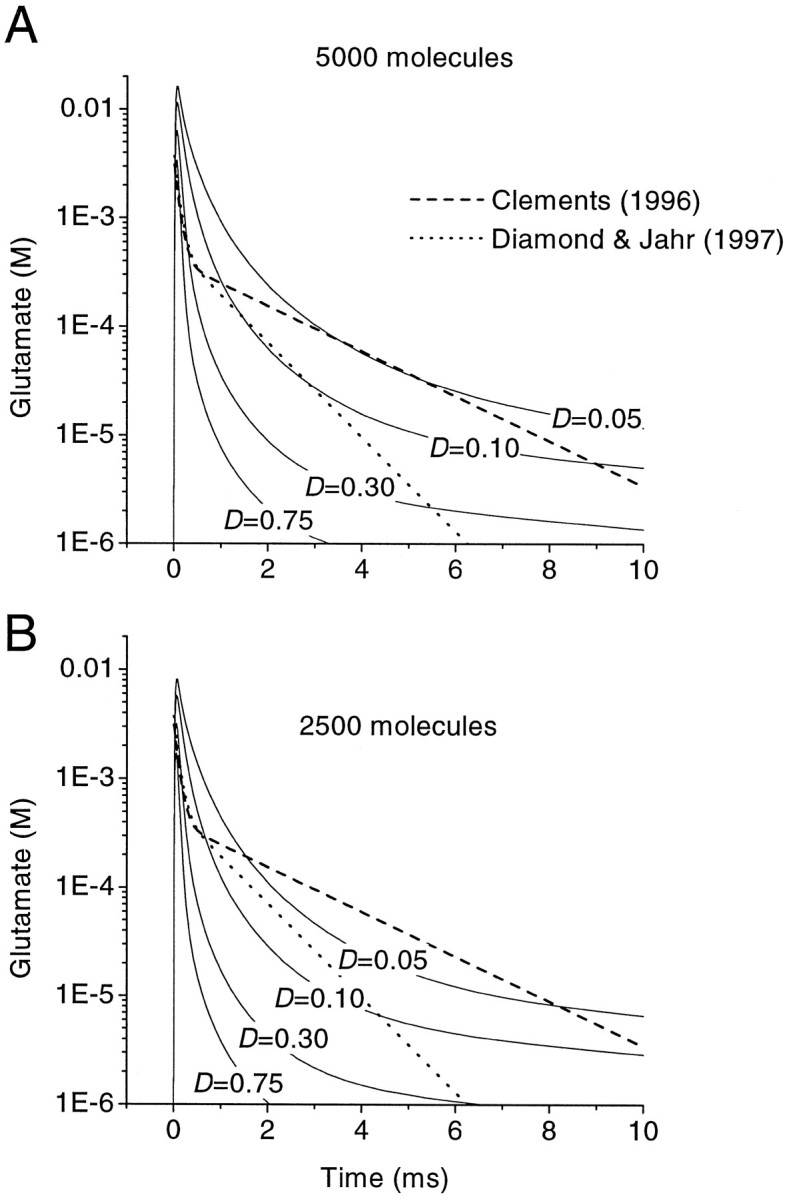
Simulated glutamate concentration time course within the synaptic cleft. A, Glutamate concentration profiles after release of 5000 molecules. The concentration of glutamate transporters outside the cleft ([Btot]) was 0.1 mm (see Materials and Methods for other uptake parameters). The solid curves were obtained with different values for the diffusion coefficient in the extracellular space D (in square micrometers per millisecond). The dashed anddotted lines show biexponential glutamate concentration profiles proposed by Clements (1996) and Diamond and Jahr (1997), on the basis of the displacement of rapidly dissociating receptor antagonists in hippocampal cultures. B. Concentration profiles after release of 2500 molecules.
The role of transporters in determining the glutamate profile both within and outside the synaptic cleft is explored in Figure8A, where Dwas assumed to be 0.1 μm2/msec. Increasing the density of transporters, [Btot], from 0 to 0.5 mm has two effects. First, it rapidly reduces the glutamate concentration after the first millisecond. This effect is small within the synaptic cleft and becomes more prominent at increasing distances from the release site. Second, after the initial rapid reduction, the concentration decays with a shallow slope on a semilogarithmic plot (Fig. 8, compare A1, A3). These effects result, first, from rapid binding of glutamate to the unoccupied transporters and, second, from the buffering effect of the transporters; glutamate shuttles between the free and bound states, thereby spending a smaller proportion of the time diffusing away from the release site. The translocation step plays a negligible role on the time scale explored here, because the rate constantk2 is very slow compared with the binding and unbinding to the transporters.
Fig. 8.

Effects of varying the concentration of transporters on the spatiotemporal glutamate concentration profiles and opening probability of receptors.A1–A3, The curves in each panel show the simulated glutamate concentration time course 50, 100, 200, 300, and 465 nm from the center of the synaptic cleft. Five thousand molecules were released into the center of the cleft, either without transporters (A1) or with an extrasynaptic transporter concentration ([Btot]) of 0.1 mm(A2) or 0.5 mm(A3).B1–B3, Opening probability of AMPA receptors positioned at different distances from the release site. C1–C3, Opening probability for NMDA receptors, showing a shallower decrease with distance.
Synaptic currents
The glutamate concentration profiles illustrated in Figure 8A were used to calculate the time course of the open probability of AMPA and NMDA receptors positioned at different distances from the synaptic cleft. Figure 8, B andC, shows families of open probability (Po) time courses for AMPA and NMDA receptors, respectively. Po is proportional to the predicted synaptic current, assuming equal numbers of receptors and constant driving forces at each distance r from the release site. In the absence of glutamate uptake, the Poof AMPA receptors decreases steeply with distance (Fig.8B1). At 465 nm, the mean nearest neighbor distance estimated above, the peak open probability (Po,max) is ∼8% of its value within the synaptic cleft. Po,max for NMDA receptors decreases with distance much less steeply (Fig. 8C1), reflecting the relatively higher affinity for glutamate. At the same distance, Po,max is 62% of its value within the cleft.
Incorporating glutamate transporters has a profound effect on the degree of activation of receptors positioned outside the synaptic cleft (Fig. 8B,C). However, even with the highest concentration of transporters explored here (0.5 mm), the NMDA receptors positioned at 465 nm still opened to 17% of the maximal probability reached within the cleft (Fig. 8C3). The AMPA receptors at this distance, in contrast, were essentially unaffected by the glutamate transient (Fig.8B3).
The opening of receptors at different distances from the release site depends steeply on the diffusion coefficient. Figure9 plots the Po,maxagainst distance for different values of D, ranging from 0.05 to 0.75 μm2/msec. This yields the paradoxical result that the slower glutamate diffuses away from the release site, the higher the opening probability of receptors outside the synaptic cleft, both in absolute terms, and as a fraction ofPo,max within the synaptic cleft.
Fig. 9.

Effect of varying the glutamate diffusion coefficient on the peak opening probability of AMPA and NMDA receptors. The curves in each panel show the Po,maxcalculated at different distances from the release site (synaptic cleft center). Filled triangles, AMPA receptors; open circles, NMDA receptors. The diffusion coefficientD is indicated in each panel (in square micrometers per millisecond). The transporter concentration ([Btot]) was 0.1 mm. Theshaded area represents the synaptic cleft (radius, 100 nm), and the vertical line at 465 nm represents the estimated mean nearest neighbor distance. The ratio ofPo,max at 465 nm toPo,max within the synaptic cleft thus indicates the extent of crosstalk between one typical synapse and its nearest neighbor.
Exocytosis of 5000 molecules of glutamate may thus be sufficient to activate a significant proportion of NMDA receptors at a distance similar to that separating neighboring synapses, as long asD ≤ 0.1 μm2/msec. At shorter distances, corresponding to the immediate vicinity of the synaptic cleft, NMDA receptors can be opened with D ≤ 0.75 μm2/msec, the value in free medium. The AMPA receptor opening probability, as a fraction of thePo,max within the cleft, is always smaller.
Effect of nonzero background glutamate concentration
The above conclusions depend on the assumption that the extracellular glutamate concentration was zero before exocytosis. This may not be correct, both because vesicles at neighboring synapses undergo spontaneous exocytosis and because the stoichiometry of glutamate transporters sets a lower limit on the resting extracellular concentration, which has been estimated as ∼0.6 μm (Bouvier et al., 1992). We explored the effect of a background glutamate concentration of 0.6 μm by adding a constant “leak” into each spatial compartment, with leak rateL determined as follows. In the steady state:
| Equation 8a |
| Equation 8b |
Because [CB] + [B] = [Btot], this yields L = k2 k1 C[Btot]/(k−1 +k2 + C k1). We repeated the simulations of exocytosis to obtain the glutamate concentration profiles at different distances, with initial and boundary concentrations of 0.6 μm. The time course of the opening probability of AMPA and NMDA receptors was then calculated as before, with the difference that the receptor kinetic scheme was allowed to equilibrate with 0.6 μm glutamate for several seconds before exocytosis. This led to marked desensitization of the NMDA receptors. There was also a small background opening probability, which we subtracted from the peak response to the glutamate transient. The dependence of Po,max on distance was qualitatively unchanged from that determined with a zero resting glutamate concentration. This is shown in Figure10, wherePo,max, normalized byPo,max in the synaptic cleft, is plotted against distance for different values of D. The peak increase in open probability after exocytosis always fell with distance faster for the AMPA receptors than for the NMDA receptors.
Fig. 10.

Dependence of peak opening probability on distance in the presence of background glutamate. The curves in each panel show Po,max, normalized byPo,max in the cleft (50 nm), calculated with a resting glutamate concentration of 0.6 μm. The background Po was first subtracted from the peak response. The diffusion coefficient D is indicated in each panel (in square micrometers per millisecond), and the transporter concentration ([Btot]) was 0.1 mm, as for Figure 9. AMPA receptor-mediated responses show the same steep dependence on distance as with a zero resting glutamate concentration.
DISCUSSION
Geometric constraints on diffusion
The present study relies on the assumption that the extrasynaptic space can be reasonably approximated by a homogeneous porous medium. No regularities with cylindrical or spheric symmetry with respect to an individual synapse emerged when a large number of perisynaptic membrane profiles were examined (Fig. 3). The design of this test, however, could have concealed some preferred directions with respect to the whole hippocampus, because the images (and the corresponding sections) were rotated to allow them to be superimposed. Indeed, the apparent diffusion coefficient in the cerebellar cortex, measured on a scale of >100 μm with ion-selective microelectrodes, differs according to the axis in which the measurement is made (Rice et al., 1993), implying that a unique tortuosity factor may not fully characterize the obstacles to ion movements. On a scale of <1 μm, however, this effect is probably very weak, and the present results, which represent arbitrarily orientated synapses, are very unlikely to be affected by deviations from the assumption that diffusion is spherically symmetrical.
The present estimate of the extracellular volume fraction α (0.117) is close to previous estimates obtained with microiontophoretic methods in acute brain slices (McBain et al., 1990; Pérez-Pinzón et al., 1995). The geometric method used here is potentially sensitive to fixation artifacts, but the agreement implies that any error introduced may be small. These estimates are, however, lower than in other brain areas when measured in vivo (Lehmenkühler et al., 1993). It is not clear whether this reflects a genuine difference between different parts of the brain or some bias affecting both the reported and the present estimates in the hippocampus.
The estimate of the tortuosity factor λ (1.34) is ∼20% lower than previously reported in acute slices (McBain et al., 1990;Pérez-Pinzón et al., 1995). An important distinction, however, must be made between the “geometric tortuosity” measured here, which reflects only the visible obstacles presented by neurites and glial processes, and the “total tortuosity” estimated with ion-sensitive microelectrodes. The latter measure also reflects the slowing of ion movement caused by interactions with macromolecules and membranes, and, as a corollary, the nonzero viscosity of the extracellular medium. The discrepancy between the two measures, however, does not give an indication of the effective diffusion coefficient in the extracellular medium, because the slowing of diffusion depends on the ion species. The movement of glutamate may be more severely retarded than that of small inorganic ions used in iontophoretic measurements (such as tetramethylammonium). The correct value of D for glutamate in the extracellular medium thus remains uncertain, preventing a unique solution for the spatiotemporal profile after exocytosis of known amounts of the transmitter.
Role of uptake
Some uncertainty also surrounds the parameters describing glutamate uptake. The rate constants assumed here were guided by the affinity of transporters and kinetic measurements reported by Wadiche et al. (1995) and are similar to those used by Diamond and Jahr (1997). Less is known about the concentration of transporters. Takahashi et al. (1996), working on rodent Purkinje cells, estimated the density of transporters as 1300–13,000 μm−2. Assuming an intermembrane distance of 0.017 μm (see Results), this gives a spatial density of ∼70,000–700,000 μm−3 within the extracellular space, corresponding to [Btot] between 0.1 and 1.0 mm. This value may be lower in the CA1 region of the hippocampus, because two of the cloned glutamate transporters are expressed at higher levels in the cerebellum than elsewhere in the brain (Storck et al., 1992;Rothstein et al., 1994; Chaudhry et al., 1995; Fairman et al., 1995).
An important effect of incorporating reversible binding to transporters was that, after a rapid reduction in the first millisecond, the decline in the free glutamate concentration proceeded more slowly than without uptake, as if the diffusion coefficient was reduced. Zador and Koch (1994) and Wagner and Keizer (1994) analyzed the formally equivalent process of buffered Ca2+ ion diffusion. Their results imply that, when the concentration of the diffusing glutamate is low, Equation 1 given above can be replaced by:
| Equation 9 |
where
and
is an apparent dissociation constant characterizing the “reappearance” of free binding sites (see Eqs. 5-5 above).β∞ is effectively the asymptotic bound-to-free glutamate ratio, and our computations indicate that the actual bound-to-free glutamate ratio reachesβ∞ within a few milliseconds (data not shown).
Glutamate transporters can thus slow down the diffusion of glutamate molecules away from the site of exocytosis, in good agreement with Equation 9. This phenomenon, however, only becomes noticeable when the glutamate concentration is low, and at higher concentrations, sufficient to activate AMPA and NMDA receptors, the major effect is a rapid “soaking up” of part of the vesicle contents as glutamate molecules bind to unoccupied transporters (Diamond and Jahr, 1997). The subsequent translocation into the intracellular space plays only a very small role on the time scale of interest here, because the rate constant k2 is very slow.
Two additional parameters affected the simulation results: the narrowing of the synaptic cleft edge and the time course of exocytosis. Eliminating the cleft edge barrier or making exocytosis instantaneous, however, had only relatively minor effects on the extrasynaptic glutamate profiles. Note, however, that if the viscosity of the extracellular medium at the cleft edges were significantly higher, escape of glutamate could be significantly retarded.
Activation of extrasynaptic receptors
The simulation results allow some conclusions to be drawn about the likely activation of extrasynaptic receptors after the release of the contents of a single vesicle, assumed to be ∼5000 molecules (Riveros et al., 1986; Burger et al., 1989; Bruns and Jahn, 1995). First, the immediate perisynaptic membrane (<200 nm from the cleft center) is exposed to a glutamate transient that is sufficient to open NMDA receptors. This holds even if the glutamate diffusion coefficient in the extracellular medium is as high as in water (0.75 μm2/msec). This implies that perisynaptic mGluR1α receptors (Baude et al., 1993), which have affinity for glutamate similar to that of NMDA receptors (Hayashi et al., 1993), are normally liganded after the release of a single vesicle of glutamate. Whether this is sufficient to stimulate phospholipase C (Aramori and Nakanishi, 1992) is, however, not known.
Second, high-affinity receptors located at a greater distance from the cleft center may also be activated by the contents of a single vesicle, although this depends on the diffusion coefficient for glutamate. IfD is ≤0.1 μm2/msec, a significant proportion of NMDA receptors located at the nearest neighboring synapse will be opened. In other words, glutamate released from a typical synapse will, on average, reach a sufficient concentration to open some of the NMDA receptors at a neighboring synapse. AMPA receptors at the neighboring synapse are, however, much less likely to be opened because their affinity is lower. An additional phenomenon that can limit the opening of AMPA receptors by “spillover” glutamate is that they desensitize rapidly (Trussell and Fischbach, 1989). This discrepancy in the response of AMPA and NMDA receptors could underlie the observation that the number of quanta signaled by NMDA receptors at CA1 cells is consistently larger than that mediated by AMPA receptors (Kullmann and Asztely, 1998). A proportion of synapses at which NMDA receptors open could thus act as “bystanders” to conventional dual-component transmission at neighboring synapses, which may have distinct presynaptic and/or postsynaptic elements. This is in general agreement with the simulations of Uteshev and Pennefather (1997), who argued for spillover of glutamate onto NMDA receptors at a similar intersynaptic distance as estimated here (400 nm), on the basis of an alternative analytical treatment of diffusion and receptor kinetics.
Intersynaptic crosstalk mediated by NMDA receptors becomes less likely as the diffusion coefficient is increased to >0.3 μm2/msec. It could, however, still occur even with the higher estimates of D, if the two synapses were very close together. Note that approximately half of the nearest neighbor distances estimated here fell below the mean value (Fig. 6). This can also occur at multisynapse boutons, in which distinct synapses, mainly made on different postsynaptic dendrites (Sorra and Harris, 1993), may have cleft centers separated by ≤300 nm (data not shown).
It is less clear whether the extrasynaptic glutamate transient resulting from the release of a single vesicle could also reach a sufficient concentration to activate preterminal mGluR2 receptors at mossy fibers (Yokoi et al., 1996) or kainate receptors on GABAergic terminals (Clarke et al., 1997), because the linear and/or effective distances separating these receptors from glutamatergic release sites have yet to be estimated. Finally, synaptic elements (in particular dendritic spines) in area CA1 may alter their shapes and/or positions with time (at least in vitro), together with changes in synaptic efficacy (Hosokawa et al., 1995). The parameters that determine extracellular glutamate diffusion therefore may not be fixed.
The conclusions summarized here rely on the assumption that 5000 molecules of glutamate are exocytosed. Given a vesicle diameter of 40 nm, this corresponds to a vesicular glutamate concentration of ∼250 mm, which is below the theoretical maximum of 320 mm (Maycox et al., 1990). Estimates of vesicle contents are sensitive to a number of experimental difficulties (Riveros et al., 1986; Burger et al., 1989), but if the true vesicle contents were much lower, or if vesicles did not discharge all of their contents, extrasynaptic receptors would be exposed to a lower glutamate concentration. In this situation, however, a significant proportion of the NMDA receptors at the nearest neighboring synapse could still open as long as the diffusion coefficient is sufficiently low. For instance, with 2500 molecules released, and with a transporter density [Btot] of 0.1 mm,Po,max at 465 nm was still 36% ofPo,max within the synaptic cleft whenD = 0.05 μm2/msec. This was little changed by allowing a resting glutamate concentration of 0.6 μm.
Conclusion
Extrasynaptic receptors are likely to be activated by relatively small amounts of glutamate, especially if the diffusion coefficient in the extracellular medium is low. Other groups have argued that the diffusion coefficient is lower than in free solution (Holmes, 1995;Wahl et al., 1996). Paradoxically, Kleinle et al. (1996) argued for a low effective diffusion coefficient to avoid interactions between neighboring clusters of receptors. This is because they considered spillover at AMPA, rather than at NMDA, receptors; whereas AMPA receptors are very sensitive to the peak glutamate concentration (and desensitize rapidly), NMDA receptors are relatively more sensitive to the duration of the agonist transient at micromolar levels. Slowing diffusion enhances the activation of AMPA receptors close to the release site by ensuring that a higher peak concentration is reached.
Footnotes
This work was supported by the Biotechnology and Biological Sciences Research Council and the Medical Research Council. We are grateful to M. Stewart and H. Davies for providing tissue samples and to C. Nicholson and E. Syková for valuable comments on preliminary results.
Correspondence should be addressed to Dr. Dimitri M. Kullmann, University Department of Clinical Neurology, Institute of Neurology, University College London, Queen Square, London WC1N 3BG, United Kingdom.
Dr. Rusakov’s present address: Division of Neurophysiology, National Institute for Medical Research, London NW7 1AA, United Kingdom.
REFERENCES
- 1.Aramori I, Nakanishi S. Signal transduction and pharmacological characteristics of a metabotropic glutamate receptor, mGluT1, in transfected CHO cells. Neuron. 1992;8:757–765. doi: 10.1016/0896-6273(92)90096-v. [DOI] [PubMed] [Google Scholar]
- 2.Asztely F, Erdemli G, Kullmann DM. Extrasynaptic glutamate spillover in the hippocampus: dependence on temperature and the role of active glutamate uptake. Neuron. 1997;18:281–293. doi: 10.1016/s0896-6273(00)80268-8. [DOI] [PubMed] [Google Scholar]
- 3.Barbour B, Häusser M. Intersynaptic diffusion of neurotransmitter. Trends Neurosci. 1997;20:377–384. doi: 10.1016/s0166-2236(96)20050-5. [DOI] [PubMed] [Google Scholar]
- 4.Barbour B, Keller BU, Llano I, Marty A. Prolonged presence of glutamate during excitatory synaptic transmission to cerebellar Purkinje cells. Neuron. 1994;12:1331–1343. doi: 10.1016/0896-6273(94)90448-0. [DOI] [PubMed] [Google Scholar]
- 5.Baude A, Nusser Z, Roberts JDB, Mulvihill E, Somogyi P. The metabotropic glutamate receptor (mGluR1α) is concentrated at perisynaptic membrane of neuronal subpopulations a detected by immunogold reaction. Neuron. 1993;11:771–787. doi: 10.1016/0896-6273(93)90086-7. [DOI] [PubMed] [Google Scholar]
- 6.Bouvier M, Szatkowski M, Amato A, Attwell D. The glial cell glutamate uptake carrier countertransports pH-changing ions. Nature. 1992;360:471–474. doi: 10.1038/360471a0. [DOI] [PubMed] [Google Scholar]
- 7.Braendgaar H, Gundersen HJG. The impact of recent stereological advances on quantitative studies of the nervous system. J Neurosci Methods. 1986;18:39–78. doi: 10.1016/0165-0270(86)90112-3. [DOI] [PubMed] [Google Scholar]
- 8.Bruns D, Jahn R. Real-time measurement of transmitter release from single synaptic vesicles. Nature. 1995;377:62–65. doi: 10.1038/377062a0. [DOI] [PubMed] [Google Scholar]
- 9.Burger PM, Mehl E, Cameron PL, Maycox PR, Baumert M, Lottspeich F, De Camilli P, Jahn R. Synaptic vesicles immunoisolated from rat cerebral cortex contain high levels of glutamate. Neuron. 1989;3:715–720. doi: 10.1016/0896-6273(89)90240-7. [DOI] [PubMed] [Google Scholar]
- 10.Chaudhry FA, Lehre KP, van Lookeren-Campagne M, Ottersen OP, Danbolt NC, Storm-Mathisen J. Glutamate transporters in glial plasma membranes: highly differentiated localizations revealed by quantitative ultrastructural immunocytochemistry. Neuron. 1995;15:711–720. doi: 10.1016/0896-6273(95)90158-2. [DOI] [PubMed] [Google Scholar]
- 11.Clarke VRJ, Ballyk BA, Hoo K, Madelzys A, Pellizzari A, Bath C, Thomas J, Harpe E, Davies CH, Ornstein PL, Shoepp DD, Kamboj RK, Collingridge GL, Lodge D, Bleakman D. A hippocampal GluR5 kainate receptor regulating inhibitory synaptic transmission. Nature. 1997;389:599–603. doi: 10.1038/39315. [DOI] [PubMed] [Google Scholar]
- 12.Clements JD. Transmitter timecourse in the synaptic cleft: its role in central synaptic function. Trends Neurosci. 1996;5:163–170. doi: 10.1016/s0166-2236(96)10024-2. [DOI] [PubMed] [Google Scholar]
- 13.Clements JD, Lester RA, Tong G, Jahr CE, Westbrook GL. The time course of glutamate in the synaptic cleft. Science. 1992;258:1498–1501. doi: 10.1126/science.1359647. [DOI] [PubMed] [Google Scholar]
- 14.Crank J. The mathematics of diffusion. Clarendon Press; Oxford: 1975. [Google Scholar]
- 15.Diamond JS, Jahr CE. Transporters buffer synaptically released glutamate on a submillisecond time scale. J Neurosci. 1997;17:4672–4687. doi: 10.1523/JNEUROSCI.17-12-04672.1997. [DOI] [PMC free article] [PubMed] [Google Scholar]
- 16.Doubell TP, Stewart MG. Short term changes in the numerical density of synapses in the intermediate and medial hyperstriatum ventrale following one-trial passive avoidance learning. J Neurosci. 1993;13:2230–2236. doi: 10.1523/JNEUROSCI.13-05-02230.1993. [DOI] [PMC free article] [PubMed] [Google Scholar]
- 17.Fairman WA, Vandenberg RJ, Arriza JL, Kavanaugh MP, Amara SG. An excitatory amino-acid transporter with properties of a ligand-gated chloride channel. Nature. 1995;375:599–603. doi: 10.1038/375599a0. [DOI] [PubMed] [Google Scholar]
- 18.Fenstermacher JD, Patlak CS. The exchange of material between cerebrospinal fluid and brain. In: Cserr HF, Fenstermacher JD, Fencl V, editors. Fluid environment of the brain. Academic; New York: 1975. pp. 201–214. [Google Scholar]
- 19.Harris KM. How multiple-synapse boutons could preserve input specificity during an interneuronal spread of LTP. Trends Neurosci. 1995;18:365–369. doi: 10.1016/0166-2236(95)93930-v. [DOI] [PubMed] [Google Scholar]
- 20.Harris EJ, Burn GP. The transfer of sodium and potassium ions between muscle and the surrounding medium. Trans Faraday Soc. 1949;45:508–528. [Google Scholar]
- 21.Hayashi Y, Momiyama A, Takahashi T, Ohishi H, Ogawa-Meguro R, Shigemoto R, Mizuno N, Nakanishi S. Role of a metabotropic glutamate receptor in synaptic modulation in the accessory olfactory bulb. Nature. 1993;366:687–690. doi: 10.1038/366687a0. [DOI] [PubMed] [Google Scholar]
- 22.Holmes WR. Modeling the effect of glutamate diffusion and uptake on NMDA and non-NMDA receptor saturation. Biophys J. 1995;69:1734–1747. doi: 10.1016/S0006-3495(95)80043-3. [DOI] [PMC free article] [PubMed] [Google Scholar]
- 23.Hosokawa T, Rusakov DA, Bliss TVP, Fine A. Repeated confocal imaging of individual dendritic spines in the living hippocampal slice: evidence for changes in length and orientation associated with chemically induced LTP. J Neurosci. 1995;15:5560–5573. doi: 10.1523/JNEUROSCI.15-08-05560.1995. [DOI] [PMC free article] [PubMed] [Google Scholar]
- 24.Isaac JT, Nicoll RA, Malenka RC. Evidence for silent synapses: implications for the expression of LTP. Neuron. 1995;15:427–434. doi: 10.1016/0896-6273(95)90046-2. [DOI] [PubMed] [Google Scholar]
- 25.Jonas P, Major G, Sakmann B. Quantal components of unitary EPSCs at the mossy fibre synapse on CA3 pyramidal cells of rat hippocampus. J Physiol (Lond) 1993;472:615–663. doi: 10.1113/jphysiol.1993.sp019965. [DOI] [PMC free article] [PubMed] [Google Scholar]
- 26.Kleinle J, Vogt K, Müller L, Senn W, Wyler K, Streit J. Transmitter concentration profiles in the synaptic cleft: an analytical model of release and diffusion. Biophys J. 1996;71:2413–2426. doi: 10.1016/S0006-3495(96)79435-3. [DOI] [PMC free article] [PubMed] [Google Scholar]
- 27.Kullmann DM. Amplitude fluctuations of dual-component EPSCs in hippocampal pyramidal cells: implications for long-term potentiation. Neuron. 1994;12:1111–1120. doi: 10.1016/0896-6273(94)90318-2. [DOI] [PubMed] [Google Scholar]
- 28.Kullmann DM, Asztely F. Extrasynaptic glutamate spillover in the hippocampus: evidence and implications. Trends Neurosci. 1998;21:8–14. doi: 10.1016/s0166-2236(97)01150-8. [DOI] [PubMed] [Google Scholar]
- 29.Kullmann DM, Siegelbaum SA. The site of expression of NMDA receptor-dependent LTP: new fuel for an old fire. Neuron. 1995;15:997–1002. doi: 10.1016/0896-6273(95)90089-6. [DOI] [PubMed] [Google Scholar]
- 30.Kullmann DM, Erdemli G, Asztely F. LTP of AMPA and NMDA receptor-mediated signals: evidence for presynaptic expression and extrasynaptic glutamate spill-over. Neuron. 1996;17:461–474. doi: 10.1016/s0896-6273(00)80178-6. [DOI] [PubMed] [Google Scholar]
- 31.Lehmenkühler A, Syková E, Svoboda J, Zilles K, Nicholson C. Extracellular space parameters in the rat neocortex and subcortical white matter during postnatal development determined by diffusion analysis. Neuroscience. 1993;55:339–351. doi: 10.1016/0306-4522(93)90503-8. [DOI] [PubMed] [Google Scholar]
- 32.Lehner FK. On the validity of Fick’s law for transient diffusion through a porous medium. Chem Engng Sci. 1979;34:821–825. [Google Scholar]
- 33.Lester RA, Jahr CE. NMDA channel behavior depends on agonist affinity. J Neurosci. 1992;12:635–643. doi: 10.1523/JNEUROSCI.12-02-00635.1992. [DOI] [PMC free article] [PubMed] [Google Scholar]
- 34.Liao D, Hessler NA, Malinow R. Activation of postsynaptically silent synapses during pairing-induced LTP in CA1 region of hippocampal slice. Nature. 1995;375:400–404. doi: 10.1038/375400a0. [DOI] [PubMed] [Google Scholar]
- 35.Longsworth LG. Diffusion measurements at 25° of aqueous solutions of amino acids, peptides and sugars. J Am Chem Soc. 1953;75:5705–5709. [Google Scholar]
- 36.Malenka RC, Nicoll RA. Silent synapses speak up. Neuron. 1997;19:473–476. doi: 10.1016/s0896-6273(00)80362-1. [DOI] [PubMed] [Google Scholar]
- 37.Maycox PR, Hell JW, Jahn R. Amino acid neurotransmission: spotlight on synaptic vesicles. Trends Neurosci. 1990;13:83–87. doi: 10.1016/0166-2236(90)90178-d. [DOI] [PubMed] [Google Scholar]
- 38.McBain CJ, Traynelis SF, Dingledine R. Regional variation of extracellular space in the hippocampus. Science. 1990;249:674–677. doi: 10.1126/science.2382142. [DOI] [PubMed] [Google Scholar]
- 39.Nicholson C, Phillips JM. Ion diffusion modified by tortuosity and volume fraction in the extracellular microenvironment of rat cerebellum. J Physiol (Lond) 1981;321:225–257. doi: 10.1113/jphysiol.1981.sp013981. [DOI] [PMC free article] [PubMed] [Google Scholar]
- 40.Nicholson C, Phillips JM, Gardner-Medwin AR. Diffusion from an iontophoretic source in the brain: role of tortuosity and volume fraction. Brain Res. 1979;169:580–584. doi: 10.1016/0006-8993(79)90408-6. [DOI] [PubMed] [Google Scholar]
- 41.Pérez-Pinzón MA, Tao L, Nicholson C. Extracellular potassium, volume fraction and tortuosity in rat hippocampal CA1, CA3, and cortical slices during ischemia. J Neurophysiol. 1995;74:565–573. doi: 10.1152/jn.1995.74.2.565. [DOI] [PubMed] [Google Scholar]
- 42.Rice ME, Okada YC, Nicholson C. Anisotropic and heterogeneous diffusion in the turtle cerebellum—implications for volume transmission. J Neurophysiol. 1993;70:2035–2044. doi: 10.1152/jn.1993.70.5.2035. [DOI] [PubMed] [Google Scholar]
- 43.Riveros N, Fieldler J, Lagos N, Munoz C, Orrego G. Glutamate in rat brain cortex synaptic vesicles: influence of the vesicle isolation procedure. Brain Res. 1986;386:405–408. doi: 10.1016/0006-8993(86)90181-2. [DOI] [PubMed] [Google Scholar]
- 44.Rothstein JD, Martin L, Levey AI, Dykes-Hoberg M, Jin L, Wu D, Nash N, Kuncl RW. Localization of neuronal and glial glutamate transporters. Neuron. 1994;13:713–725. doi: 10.1016/0896-6273(94)90038-8. [DOI] [PubMed] [Google Scholar]
- 45.Rusakov DA. Estimation of the size distribution of closed cell elements from analysis of their plane random sections. Biometrics. 1993;49:141–149. [Google Scholar]
- 46.Rusakov DA, Davies HA, Harrison E, Diana D, Richter-Levin G, Bliss TVP, Stewart MG. Ultrastructural synaptic correlates of spatial learning in rat hippocampus. Neuroscience. 1997;80:69–77. doi: 10.1016/s0306-4522(97)00125-5. [DOI] [PubMed] [Google Scholar]
- 47.Rusakov DA, Harrison E, Stewart MG (1998) Synapses in hippocampus occupy only 1–2% of cell membranes and are spaced less than half-micron apart. Neuropharmacology, in press. [DOI] [PubMed]
- 48.Scanziani M, Salin PA, Vogt KE, Malenka RC, Nicoll RA. Use-dependent increases in glutamate concentration activate presynaptic metabotropic glutamate receptors. Nature. 1997;385:630–634. doi: 10.1038/385630a0. [DOI] [PubMed] [Google Scholar]
- 49.Sorra KE, Harris KM. Occurrence and three-dimensional structure of multiple synapses between individual radiatum axons and their target pyramidal cells in hippocampal area CA1. J Neurosci. 1993;13:3736–3748. doi: 10.1523/JNEUROSCI.13-09-03736.1993. [DOI] [PMC free article] [PubMed] [Google Scholar]
- 50.Stiles JR, Van Helden D, Bartol TM, Salpeter EE, Salpeter MM. Miniature endplate current rise times <100 μs from improved dual recordings can be modeled with passive acetylcholine diffusion from a synaptic vesicle. Proc Natl Acad Sci USA. 1996;93:5747–5752. doi: 10.1073/pnas.93.12.5747. [DOI] [PMC free article] [PubMed] [Google Scholar]
- 51.Storck T, Schulte S, Hofmann K, Stoffel W. Structure, expression, and functional analysis of a Na+-dependent glutamate/aspartate transporter from rat brain. Proc Natl Acad Sci USA. 1992;89:10955–10959. doi: 10.1073/pnas.89.22.10955. [DOI] [PMC free article] [PubMed] [Google Scholar]
- 52.Stoyan D, Kendall WS, Mecke J. Stochastic geometry and its applications. Wiley; Chichester, UK: 1987. [Google Scholar]
- 53.Takahashi M, Sarantis M, Attwell D. Postsynaptic glutamate uptake in rat cerebellar Purkinje cells. J Physiol (Lond) 1996;497:523–530. doi: 10.1113/jphysiol.1996.sp021785. [DOI] [PMC free article] [PubMed] [Google Scholar]
- 54.Trussell LO, Fischbach GD. Glutamate receptor desensitization and its role in synaptic transmission. Neuron. 1989;3:209–218. doi: 10.1016/0896-6273(89)90034-2. [DOI] [PubMed] [Google Scholar]
- 55.Underwood EE. Quantitative stereology. Addison–Wesley; Reading, MA: 1970. [Google Scholar]
- 56.Uteshev VV, Pennefather PS. Analytical description of the activation of multi-state receptors by continuous neurotransmitter signals at brain synapses. Biophys J. 1997;72:1127–1134. doi: 10.1016/S0006-3495(97)78761-7. [DOI] [PMC free article] [PubMed] [Google Scholar]
- 57.Wadiche JI, Arriza JL, Amara SG, Kavanaugh MP. Kinetics of a human glutamate transporter. Neuron. 1995;14:1019–1027. doi: 10.1016/0896-6273(95)90340-2. [DOI] [PubMed] [Google Scholar]
- 58.Wagner J, Keizer J. Effects of rapid buffers on Ca2+ diffusion and Ca2+ oscillations. Biophys J. 1994;67:447–656. doi: 10.1016/S0006-3495(94)80500-4. [DOI] [PMC free article] [PubMed] [Google Scholar]
- 59.Wahl LM, Pouzat C, Stratford KJ. Monte Carlo simulation of fast excitatory synaptic transmission at a hippocampal synapse. J Neurophysiol. 1996;75:597–608. doi: 10.1152/jn.1996.75.2.597. [DOI] [PubMed] [Google Scholar]
- 60.Yokoi M, Kobayashi K, Manabe T, Takahashi T, Sakaguchi I, Katsuura G, Shigemoto R, Ohishi H, Nomura S, Nakamura K, Nakao K, Katsuki M, Nakanishi S. Impairment of hippocampal mossy fiber LTD in mice lacking mGluR2. Science. 1996;273:645–647. doi: 10.1126/science.273.5275.645. [DOI] [PubMed] [Google Scholar]
- 61.Zador A, Koch C. Linearized models of calcium dynamics: formal equivalence to the cable equation. J Neurosci. 1994;14:4705–4715. doi: 10.1523/JNEUROSCI.14-08-04705.1994. [DOI] [PMC free article] [PubMed] [Google Scholar]