

Abstract
In this study, we describe the development of electrical properties of Drosophila embryonic central neurons in vivo. Using whole-cell voltage clamp, we describe the onset of expression of specific voltage- and ligand-gated ionic currents and the first appearance of endogenous and synaptic activity. The first currents occur during midembryogenesis [late stage 16, 13–14 hr after egg laying (AEL)] and consist of a delayed outward potassium current (IK) and an acetylcholine-gated inward cation current (IACh). As development proceeds, other voltage-activated currents arise sequentially. An inward calcium current (ICa) is first observed at 15 hr AEL, an inward sodium current (INa) at 16 hr AEL, and a rapidly inactivating outward potassium current (IA) at 17 hr AEL. The inward calcium current is composed of at least two individual and separable components that exhibit small temporal differences in their development. Endogenous activity is first apparent at 15 hr AEL and consists of small events (peak amplitude, 5 pA) that probably result from the random opening of relatively few numbers of ion channels. At 16 hr AEL, discrete (10–15 msec duration) currents that exhibit larger amplitude (25 pA maximum) and rapid activation but slower inactivation first appear. We identify these latter currents as EPSCs, an indication that functional synaptic transmission is occurring. In the neurons from which we record, action potentials first occur at 17 hr AEL. This study is the first to record from Drosophila embryonic central neurons in vivo and makes possible future work to define the factors that shape the electrical properties of neurons during development.
Keywords: CNS, connectivity, development, Drosophila, neurogenesis, neuron, synaptogenesis
Neural development inDrosophila, as in vertebrates, involves an early, relatively activity-independent phase during which neurons are born, extend axons, and contact targets, followed by a later phase when neurons acquire their electrical properties, refine their synaptic connections, and become the functional units of neural circuits (Goodman and Shatz, 1993). There has been a rapid increase in our understanding of the early development of the nervous system, including the mechanisms of neural cell fate determination, axon growth and guidance, target recognition, and the establishment of synaptic terminals (Goodman and Doe, 1993; Hall and Sanes, 1993; Tessier-Lavigne and Goodman, 1996). On the other hand, relatively little is known of the later stages of neuronal development when nerve cells first become functional and when neuronal activity may itself contribute to the maturation of neuronal characteristics and the refinement of connections. The difficulty inDrosophila is that although it is an ideal organism for genetic and molecular analysis, there are technical problems in gaining access to embryonic neurons and, in particular, in applying advanced electrophysiological techniques to these cells that would allow their developing functional properties to be assayed.
Because of these difficulties our knowledge of the electrical properties of Drosophila neurons has been gained almost exclusively from neurons grown in culture. Studies with cultured neurons have not only described the kinetics of activation and inactivation, ion specificity, and pharmacological blockade of particular voltage- and ligand-dependent ion channels, but more importantly, their molecular identities. Thus, for a majority of voltage-dependent ion channels expressed in Drosophilaneurons, genes have been cloned, and mutations have been generated. In brief, at least four genes are known to encode voltage-dependent potassium channels; these are Shal and Shaker(both of which encode a fast IA-type current),Shab (IK, slowly inactivating), and Shaw (IK, noninactivating) (Solc and Aldrich, 1988; Baker and Salkoff, 1990;Tsunoda and Salkoff, 1995a,b). The para gene product carries the inward voltage-dependent sodium current (Germeraad et al., 1992), whereas the molecular identities of voltage-dependent calcium channels are less well established, but candidate genes (Dmca1A andDmca1D) await characterization (Zheng et al., 1995; Smith et al., 1996).
The fact that Drosophila neurons can express the full array of voltage- and ligand-gated currents in culture could be taken as indicating that there is a significant degree of cell autonomy in the determination of the neuronal phenotype (O’Dowd et al., 1988; Ribera and Spitzer, 1990; Spitzer 1994). However, whether the characteristics of such cultured neurons accurately reflect properties such as current densities, thresholds for excitability, and patterns of activity, which would be appropriate for such cells in vivo, has yet to be determined. Intuitively, one might expect that the development of specific characteristics by individual neurons would require extrinsic cues that would be provided, for example, by cell–cell interactions and an appropriate pattern of synaptic connectivity. Cues of this kind would be primarily missing from cell cultures, and it might be that under these conditions neurons would develop generalized properties of excitability rather than the specific attributes that allow them to contribute to the function of particular neural circuits.
To resolve questions of this kind and to begin an analysis of the mechanisms that regulate the functional development of nerve cells, we have developed a preparation of the Drosophila embryo that allows the application of standard whole-cell recording techniques to the CNS. Here we show that readily accessible neurons, those situated along the dorsal surface of the ventral nerve cord, express specific voltage- and ligand-gated ion channels sequentially according to a developmental timetable. We also describe the onset of appearance of synaptic input and action potentials in these neurons. This information, which represents the first developmental description of the electrical properties of Drosophila embryonic neurons, provides a framework for further studies aimed at investigating the genetic basis of later, potentially activity-dependent neural development.
MATERIALS AND METHODS
Fly stocks. The wild-type strain Oregon-R was used. UAS-Tetanus (G) toxin light chain was expressed throughout the CNS using a Scabrous Gal4 driver (Brand and Perrimon, 1993; Sweeney et al., 1995; Thor and Thomas, 1997). A small deficiency in the para locus, Df(1)LD34, was used to remove INa (Broadie and Bate, 1993c). Flies were kept at 25°C and fed on apple juice agar supplemented with yeast.
Staging and dissection. Eggs collected from overnight lays were dechorionated in commercial bleach. Early stage 16 embryos, from 12 hr 45 min to 12 hr 55 min after egg laying (AEL), were identified by the presence of three disk-like contractions of the gut. These embryos were further incubated at 25°C until they had reached the required developmental time. Embryos were removed from their vitelline membrane using a glass micropipette and fixed at both their anterior and posterior ends to a Sylgard (Dow Corning)-coated coverslip using cyanoacrylate glue (Histoacryl; Braun, Melsungen, Germany) under dissection saline (see below). Embryos were opened dorsally using sharp tungsten needles and then glued flat to the Sylgard coverslip. Gut and fat body were removed to expose the ventral nerve cord. The embryo was viewed using a 63× water immersion lens combined with Nomarski optics.
A small section of the neurilemma surrounding the nerve cord between abdominal segments A1–A4 was ruptured using protease (1% type XIV; Sigma, Dorset, UK) made up in whichever external saline was required (see below). The protease saline was contained in a large-diameter (10–20 μm) patch pipette that was brought into contact with a region of neurilemma covering the dorsal surface of the CNS. A small amount of the neurilemma was drawn into the pipette using gentle suction and held for 2 min. After this period a small hole was made in the neurilemma by alternating pulses of gentle suction and expulsion of the saline in the pipette. With care, it is possible to rupture the neurilemma to expose neurons in at least the two adjacent segments. Any debris, including the transverse nerves, are removed by suction into the protease pipette, and the pipette is then withdrawn. With a region of neurilemma removed, the underlying neurons are exposed. However, the characteristic position of the exposed neurons is sometimes lost during this procedure; unequivocal neuronal identification based on position in the nerve cord is, therefore, not always possible.
Electrophysiology. Whole-cell recordings were achieved with standard patch electrodes (thick-walled borosilicate glass), fire-polished to final resistances of between 15 and 20 MΩ. Amplification and voltage control were achieved using an Axoclamp-1D patch clamp amplifier and pCLAMP6 software running on an IBM-compatible personal computer (Axon Instruments, Foster City, CA). Tight seals (usually >5 GΩ) formed readily, but the success of going whole-cell was lower (∼20–50%), a problem that is more severe with younger embryos, particularly <16 hr AEL (10–20% success rate). The reason for this difference in younger embryos is unknown but possibly represents an age-related difference in the rigidity and/or composition of the neuronal membrane. Only cells with an input resistance >1 GΩ (average, 5.1 ± 0.4 GΩ; n = 100; mean ± SE) were accepted for analysis. Typical cell capacitances (determined by integration of the area under the capacitative transients for the average of 50 steps from −60 to −90 mV) ranged between 0.7 and 4.6 pF (2.1 ± 0.15 pF; n = 37; mean ± SE) and were not compensated for on the patch amplifier. Series resistance (52 ± 3.3 MΩ; n = 10; mean ± SE) was not corrected; with maximum currents <200 pA (and usually <100 pA), series resistance error should not have exceeded 10 mV. Current traces were sampled at 20 KHz and filtered using pCLAMP6 at 2 KHz. For potassium and calcium currents, a linearly scaled leak current obtained from hyperpolarizing conditioning steps (from −60 to −90 mV) before any depolarizing voltage steps was subtracted from each current trace before analysis using pCLAMP6. To resolve sodium currents better, an on-line leak substraction option within pCLAMP6 was used: the protocol using the average of 4 depolarizing pulses (P/4). All traces shown are the average of at least five trials. All recordings were made at room temperature (21–25°C). Recordings in current clamp were unsatisfactory because of uncontrolled fluctuations in membrane voltage, attributable to the fact that only small holding currents (<10 pA) are required to maintain resting potentials of −60 to −40 mV.
Iontophoresis. A 60 MΩ electrode containing 0.1m aqueous ACh (HCl; Sigma) was brought to within 1–2 μm of the neuron under examination. A retaining current of approximately −2 nA and an ejection current of approximately +30 nA (although this was varied) was used to prevent leakage and expel ACh, respectively. Current was generated by pCLAMP6 and a homemade intracellular amplifier. Cells were allowed to recover for at least 30 sec between successive applications.
Solutions. External saline for dissection and normal whole-cell recording consisted of (in mm): 135 NaCl, 5 KCl, 2 MgCl2, 0.5 CaCl2, 5N-Tris[hydroxymethyl]methyl-2-aminoethanesulfonic acid (TES), and 36 sucrose. Potassium conductance saline consisted of (in mm): 6 KCl, 140 Tris-HCl, 10 MgCl2, 10 HEPES, and 10 glucose. Calcium conductance saline consisted of (in mm): 50 Tris-HCl, 50 BaCl2, 50 tetraethylammonium chloride (TEA), 10 4-aminopyridine, 10 MgCl2, 10 HEPES, and 10 glucose. Sodium conductance saline consisted of (in mm): 100 NaCl, 50 TEA, 10 4-aminopyridine, 10 MgCl2, 10 HEPES, and 10 glucose. All solutions were pH 7.4.
Internal saline consisted of (in mm): 140 KCl, 2 MgCl2, 11 EGTA, and 10 HEPES, pH 7.4. In some instances, K-aspartate was substituted for KCl with identical results. It was noted, however, that cell survival increased when chloride was substituted. When recording either calcium or sodium conductances, CsCl2 was substituted for KCl. ATP and GTP were not routinely added, because the required duration of whole-cell access normally lasted <3 min, and their inclusion was found unnecessary. All chemicals were obtained from Sigma.
RESULTS
Heterogeneity of neuronal properties
This study reports the development of electrical properties of neurons located dorsally in the nervous system and close to the midline in abdominal segments A1–A4. These neurons were chosen because of their relative ease of access and their relatively large-diameter (3–4 μm) cell bodies. The majority of neurons examined expressed the same range of whole-cell currents, including at least two voltage-activated outward potassium currents (IA andIK), a voltage-activated inward sodium current (INa), at least two voltage-activated inward calcium currents (ICa), and an ACh-gated inward current (IACh).
Figure 1 shows typical whole-cell recordings from three such neurons at the same late developmental stage (19–21 hr AEL). At least two outward K currents were present in all three: a fast, rapidly inactivating IA-like current and a slower, inactivating (delayed-rectifier)IK-like current. Additionally, two of the three neurons express an initial fast inward current that representsINa. ICa was masked in these recordings by the outward K currents. The largest source of heterogeneity we observed between neurons was in the characteristics and amplitude of their K currents. The majority of developmentally mature neurons expressed both a clear IA-like and an IK-like current at all voltages above threshold (approximately −30 to −20 mV; see below) (Fig.1A). The remainder of neurons exhibited either a clear predominance of IA-like (Fig.1B) or IK-like (Fig.1C) currents. The significance of this distinction is unclear, but it could contribute to the characteristic spiking activity of individual neurons.
Fig. 1.

Current heterogeneity between neurons. Whole-cell voltage clamp shows the presence of at least two voltage-activated outward K currents and a voltage-activated inward Na current (INa) in developmentally mature neurons (19 hr AEL and older). K currents include a fast, inactivating A-type (IA) current and a slower, inactivating, delayed rectifier (IK)-like current. These neurons also express inward Ca currents, but these are masked by the outward K currents under the conditions used for these recordings (but see Fig.4). A, The majority of neurons examined exhibit prominent IA andIK currents. The remainder of neurons predominantly express either IA(B) or IK(C). INa is present in most but not all neurons (e.g., absent in B; see Fig.6). The presence or absence of INa appears unrelated to neuronal K current characteristics. D, Currents were evoked from voltage steps (15 mV increments; range, −60 to +45 mV; 50 msec) applied from a conditioning prepulse of −90 mV. Recordings were obtained in normal whole-cell saline (see Materials and Methods).
Voltage-activated potassium currents
Potassium currents were isolated by substitution of Na with Tris (an impermeant ion of Na channels) and by using a calcium-free saline (see Materials and Methods). Under these conditions at least two distinct voltage-activated outward currents were present in late embryonic central neurons, IA-like andIK-like (although theIK-like current comprised more than one current; see Discussion) (Fig.2A). The absence of extracellular Ca removes the contribution of any calcium-activated K currents that may be present. The first K current to appear in development was the slow IK-like current (hereafter termed IK), and this was the first voltage-activated whole-cell current to be expressed, preceding the IA-like current (hereafter termedIA) by ∼3–4 hr. AlthoughIK first appeared at ∼13 hr AEL (present in 2 of 10 neurons), the majority (8 of 10 neurons) of whole-cell recordings from 13 hr neurons showed only leakage currents that were no greater than 10 pA at +40 mV (Fig. 2). By 14 hr AEL, however,IK was expressed by a majority of neurons (8 of 10 neurons) (Fig. 2), and by 16 hr AEL, IK had developed to its mature state, which remains constant to hatching (Fig.2). IA, on the other hand, first appeared at 17 hr AEL (6 of 9 neurons) (Fig. 2). Significantly, the appearance of IA coincided precisely with the first appearance of action potentials in the soma (see below).
Fig. 2.

Voltage-activated potassium currents appear sequentially during development. A,IK is the first K current expressed during development and is first reliably observed at 14 hr AEL (ii). Before 14 hr AEL, most neurons exhibit only leakage currents (i, but see B). By 16 hr AEL, IK has increased in amplitude and is at this stage representative of its mature form (iii). At 17–18 hr AEL, the second voltage-activated K current (IA) is first seen (iv). Recordings were obtained in K conductance saline (see Materials and Methods), and voltage steps (15 mV increments; range, −60 to +45 mV; 50 msec) were applied from a conditioning prepulse of −90 mV (v). B,C, Beginning at 13 hr AEL, neuronal recordings were made to determine the presence or absence of each of the two K currents isolated using these conditions. Results shown are based on at least 10 (IK) and 9 (IA) neurons for each time point.
To be confident that the voltage-activated K current expressed before 17 hr AEL did not contain any inactivating components (such asIA), currents were separated by exploiting differences in their steady-state inactivation (Tsunoda and Salkoff, 1995a, Martínez-Padrón and Férrus, 1997). In Drosophila neurons, IA is inactivated by a conditioning holding potential (Vh) of −20 mV, whereas IK is primarily unaffected. Currents elicited from Vh of −20 mV, therefore, isolateIK by inactivation of IA. Subtraction of IK from combinedIK–IA currents evoked from Vh −90 mV isolates IA. At 16 hr AEL, K currents evoked from Vh −90 or −20 mV were essentially identical, and their subtraction yielded no inactivating outward K component (Fig. 3A). However, by 17 hr AEL when IA was present, Vh −20 mV isolated IK, and subtraction currents isolated IA (Fig.3B). Thus, we are confident that IAdoes not appear in the neuronal cell body before 17 hr AEL.
Fig. 3.

IK andIA can be separated by differences in voltage-dependent inactivation. A, Voltage-activated K currents evoked from different conditioning prepulses (−90 and −20 mV) at 16 hr AEL are essentially identical such that their subtraction from one another shows no evidence for any inactivating K-currents (which are inactivated by a prepulse to −20 mV). B, At 17 hr AEL when both IK andIA are present, a prepulse of −20 mV inactivates only IA-isolatingIK; subtraction yieldsIA. C, Recordings were obtained in K conductance saline (see Materials and Methods), and voltage steps (15 mV increments; range, −60 to +45 mV; 50 msec) were applied from conditioning prepulses of either −90 or −20 mV.D, E, Current–voltage relationships forIK and IAisolated by differential voltage-dependent inactivation. To overcome heterogeneity in current amplitude between individual neurons, currents are normalized to the maximum current (I) evoked at 45 mV in each neuron. Each point is the average of 13 (IK) or 14 (IA) determinations ± SE (average peak amplitude: IK, 64 ± 13 pA; IA, 141 ± 29 pA) from neurons 19–21 hr AEL.
Current–voltage relationships for IK andIA, separated by differential inactivation, show that each current is activated at different membrane potentials (Fig. 3C,D). To overcome problems associated with heterogeneity, current amplitude (I) was normalized to Imax (current evoked at 45 mV) for each neuron. IK activates between −30 and −15 mV and is 50% activated at approximately +20 mV.IA activates between −45 and −30 mV and is 50% activated at 0 mV.
Voltage-activated calcium currents
Calcium channel activity was isolated by substitution of extracellular Na with Tris, and K currents were blocked by the inclusion of TEA and 4-AP in the saline and by substitution of K by cesium in the patch pipette (see Materials and Methods). Ca current was measured using barium (Ba; 50 mm) to prevent activation of Ca-activated K currents. This also allowed the extracellular concentration of the permeant ion to be increased without exacerbating the problems that increased muscle contractility has on the stability of the preparation. Ba has been previously demonstrated to be suitable in measuring ICa in isolatedDrosophila neurons (Leung and Byerly, 1991).
ICa(Ba) is adequately resolved in most neurons, although its voltage control is not always good. This indicates that unlike K currents in which voltage control is excellent, a significant portion of the ICa(Ba) we observed was generated outside the membrane of the cell body (i.e., in the membrane of the distal neuronal processes). Under the conditions used,ICa(Ba) was first apparent in neurons at 15 hr AEL (4 of 10 neurons), which was ∼1–2 hr afterIK first appeared and 2 hr beforeIA was expressed (Fig.4A,B). However, given the caveat that a significant portion of theICa(Ba) we recorded may be generated outside of the cell body, it is conceivable that the first appearance ofICa(Ba) may occur somewhat earlier than this. How much earlier is hard to estimate, but because we saw clear differences between the magnitude of ICa(Ba)recorded at 15 and 16 hr AEL, respectively, we speculate that its first appearance (in the distal regions of neurons) would occur no more than 1 hr earlier (i.e., at 14 hr AEL). Later in development, between 19 and 21 hr AEL, almost all neurons examined expressedICa(Ba) (Fig. 4B).
Fig. 4.

Development of voltage-activated calcium current.A, Representative whole-cell currents showing the development of ICa during embryonic development. At 14 hr AEL, neurons do not express Ca currents (i). ICa is first observed at 15–16 hr AEL and thereafter increases in magnitude such that by late development (e.g., 19–21 hr AEL, iii)ICa is clearly visible in the majority of neurons examined (ii). Recordings were obtained in Ca conductance saline (see Materials and Methods), and voltage steps (15 mV increments; range, −60 to +45 mV; 50 msec) were applied from a conditioning prepulse of −90 mV (iv). All recordings use Ba as the permeant ion. Note that the small amount of outward current present in Aii is almost certainly attributable to an incomplete blockade of the voltage-activatedIK current. This outward current begins to become apparent because of the small size ofICa observed at this stage. At later stages of development, ICa is large enough to mask it completely. B, The presence or absence ofICa was determined during the second half of embryogenesis beginning at 13 hr AEL. Results shown are based on at least 10 neurons for each time point. C, Current–voltage relationship in mature embryos (19–21 hr AEL) showsICa activates above −30 mV, peaks at 0–15 mV, and reverses at ∼45 mV. Currents are normalized toImax. Each point is the average of 11 determinations ± SE (average peak amplitude, −34 ± 5 pA). Only recordings that showed a clear and graded voltage dependency ofICa were used.
Normalizing individual neuronal conductances toImax, ICa(Ba)activated above −30 mV, reached its peak near 0 mV, and reversed at ∼45 mV (Fig. 4C). Over the 50 msec voltage step duration used, ICa(Ba) inactivated only slowly, reducing in amplitude by ∼10% by the end of the voltage step. In an analysis of ICa in culturedDrosophila neurons, both slow and fast inactivating Ca currents were observed. Replacement of Ca by Ba in these studies resulted in the appearance of only the slowly inactivating current. It was concluded that in some neurons, Ca-induced inactivation ofICa was occurring (Byerly and Leung, 1988; Leung and Byerly, 1991).
In Drosophila larval muscles it is possible to separate two voltage-activated Ca channels using either pharmacology or differential inactivation (Gielow et al., 1995). One channel, similar to the vertebrate T-type Ca channel, is blocked by amiloride and is virtually inactivated by Vh −30 mV. Removal of this T-type channel reveals an underlying L-type Ca channel. We used both these approaches to determine whether the neuronal Ca conductance we recorded was composed of similar Ca channel types. Figure5A shows the effect of Vh −30 mV on the evoked voltage-dependent Ca conductance in neurons of mature embryos (19–21 hr AEL). The peak current evoked from Vh −30 mV was significantly less than that from Vh −90 mV in the same neurons (33 ± 4 vs 51 ± 6 pA for Vh −30 and −90 mV, respectively;n = 8; mean ± SE). To determine whether the current inactivated by Vh −30 mV corresponded totally or partially to a T-type amiloride-sensitive current, the recordings were repeated in the presence of amiloride (1 mm). If amiloride and depolarization affect two different components, then amiloride would be expected to reduce the current recorded at Vh −30 mV further. This is clearly not the case; the peak Ca current recorded at −90 mV was not significantly different from that at Vh−30 mV in the presence of amiloride (18 ± 4 vs 16 ± 4 pA for Vh −90 and −30 mV, respectively; n = 5; mean ± SE) (Fig. 5B). Thus, it would seem that amiloride removes the portion of Ca current that is sensitive to inactivation by Vh −30 mV (i.e., a T-type Ca channel) (Gielow et al., 1995).
Fig. 5.
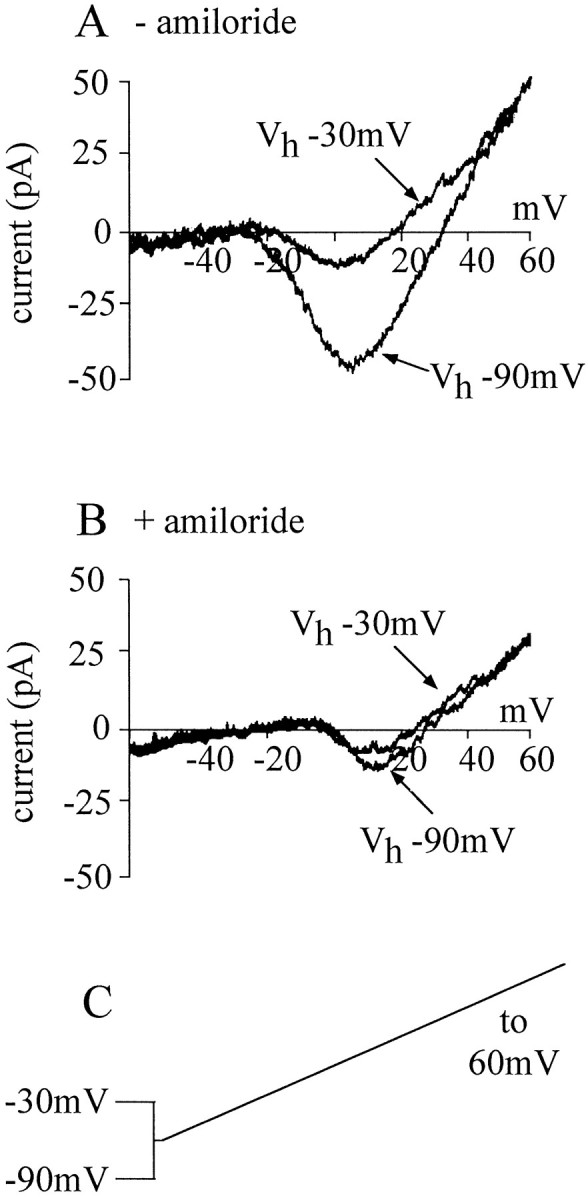
At least two voltage-activated Ca currents are present in neurons. A, The voltage-activated Ca current can be visualized using a ramp protocol (shown in C). Depolarization inactivates a significant portion of this Ca current, indicating the presence of more than one current. B, In the presence of amiloride (1 mm), depolarization does not significantly reduce the whole-cell Ca current, showing that amiloride blocks that portion of current that can be inactivated by depolarization. C, Voltage ramps of −60 to +45 mV over 500 msec were applied from holding potentials of either −90 mV (normal) or −30 mV (depolarized). Currents shown in Aand B are from different neurons (19–21 hr AEL) and are representative of at least five separate experiments.
We used differential inactivation to determine the developmental profile of the two Ca currents isolated by this manipulation. At 16 hr AEL, 70% of neurons (7 of 10) expressed a Ca conductance that was reduced by Vh −30 mV. ICa(Ba) in the remaining 30% of neurons at this stage was not affected, suggesting that these neurons lacked a depolarization-sensitive T-type channel. At 17 hr 90% (9 of 10) of neurons and at 18 hr AEL 100% (6 of 6) of neurons expressed a current that was reduced by Vh−30 mV (i.e., all neurons of this stage expressed more than one Ca current). We could not extend our analysis to 15 hr AEL, which was the time we first observed an inward voltage-activated Ca current (see above), because at this early stage the magnitude of current was too small, and its voltage control was too poor to allow reliable measurements. Thus, it appears that although both Ca currents separable by this manipulation are expressed at or approximately the same time, a minority of neurons first express the current that is unaffected by Vh −30 mV (i.e., probably an L-type Ca current) at least 1 hr before the Vh −30 mV-sensitive T-type channel.
Voltage-activated sodium current
Na conductance was isolated by omission of extracellular Ca and by blockade of K currents with TEA–4-AP and cesium in the patch pipette (see Materials and Methods). Depolarizing voltage steps under these conditions elicited rapidly inactivating inward currents characteristic of INa previously characterized inDrosophila neurons maintained in culture (Byerly and Leung, 1988; O’Dowd and Aldrich, 1988). Further evidence that these were Na currents was provided by the fact that they are eliminated by null mutations in para (O’Dowd and Aldrich, 1988). Of all the whole-cell currents measured in this study, INawas the most difficult to visualize and often escaped from voltage control. An on-line leak subtraction (P/4) protocol provided optimal separation of INa and was, therefore, routinely used. As with ICa(Ba) it would seem thatINa is also generated primarily outside the neuronal cell body. INa was first expressed in dorsal neurons at 16 hr AEL (5 of 10 neurons) and in all neurons examined by 17 hr AEL (10 of 10 neurons) (Fig.6A,B). Again, because we suspect that INa is generated mainly outside the cell body, its first appearance may precede our timings (see above). INa activated between −60 and −45 mV, peaked near −15 mV, and reversed thereafter (Fig.6C).
Fig. 6.

Development of voltage-activated sodium current.A, Representative whole-cell currents showing the development of INa during embryogenesis. At 15 hr AEL, INa is not present in neuronal recordings (i). INa is first observed at 16 hr AEL, although at this stage its amplitude is small (ii). As development continues,INa increases in size such that by late development (18–21 hr AEL,) it is clearly visible in the majority of neurons examined (iii). Recordings were made in Na conductance saline (see Materials and Methods), and voltage steps (15 mV increments; range, −60 to +45 mV; 50 msec) were applied from a conditioning prepulse of −90 mV (iv). Currents were leak-subtracted on-line using a P/4 protocol. B, The presence or absence of INa was determined throughout mid to late embryogenesis. Results shown are based on at least 10 neurons for each time point. C, Current–voltage relationship in mature embryos (19–21 hr AEL) shows that INa activates between −60 and −45 mV and reaches its maximum amplitude at approximately −15 mV. Currents are normalized to Imax. Each point is the average of 11 determinations ± SE (average peak amplitude, −47 ± 7 pA). Only recordings that showed a clear and graded voltage dependency of INa were used.
Development of acetylcholine receptor expression
The major excitatory neurotransmitter of the insect CNS is ACh; it is also the principle neurotransmitter of sensory neurons that send their axons into the CNS (Burrows, 1996). We were interested, therefore, in determining when in their developmentDrosophila central neurons begin to express functional receptors for ACh. We applied ACh to neurons under whole-cell voltage clamp (Vh −60 mV) by iontophoresis from a high-resistance microelectrode positioned 1–2 μm away from the neuronal cell body. The current used to expel ACh from the iontophoretic pipette was sufficient to cause a saturating response in late embryonic neurons (+30 nA, 100 msec) (Fig. 7B). Neurons were first responsive to applied ACh relatively early in their development, at 13 hr AEL (2 of 7 neurons) (Fig. 7A,i, ii). Before this, no response to ACh was observed (12 hr AEL, 0 of 6 neurons; data not shown) (Fig.7C), even if an ejection current of significantly increased amplitude and/or duration was used (up to +80 nA, 500 msec). By 16 hr AEL and older, all neurons tested were responsive to ACh (Fig.7A,C).
Fig. 7.

Development of an ACh-gated current.A, At 13 hr AEL, the majority of neurons do not respond to applied ACh (i); the minority respond to applied ACh by exhibiting a weak and slow inward current (ii). By 16 hr AEL, all neurons tested responded to ACh (iii). The inward current evoked at this stage displays markedly increased amplitude and kinetics. As development continues, the ACh-evoked current increases further in amplitude and in rate of onset (iv). Recordings were obtained in normal whole-cell saline (see Materials and Methods) and neurons were held under voltage clamp at −60 mV. ACh was applied to the neurons by iontophoresis using an ejection current of +30 nA (a saturating level; see B). B, Application of ACh by iontophoresis shows a clear dose-dependent response relative to the amplitude of ejection current. The responses shown are evoked by an increasing series of ejection currents (1, 2.5, 5, 10, 20, 30, and 40 nA) applied at 30 sec intervals to a neuron 21 hr AEL that responded particularly strongly. The response saturates at an ejection current amplitude of ≥20 nA, and no response is evoked by 1 nA. Ejection current of opposite sign (i.e., hyperpolarizing) evoked no response (data not shown). C, The effect of ACh was determined during embryogenesis beginning at 13 hr AEL. Determinations were made at each successive hour in development, and the results shown are based on at least six neurons for each time point.
IACh activated rapidly, decayed quickly, and exhibited a reversal potential of −0.68 ± 12.7 mV (n = 3; mean ± SE), characteristic of a nonselective cation channel (Benson, 1992; Baines and Bacon, 1994). Controls consisted of using water only, negative ejection current and placing the pipette at least 10 μm from the cell; all failed to elicit any response. Furthermore, successive applications of ACh applied within 5–10 sec of each other induced a rapidly diminishing response, indicative of receptor desensitization (data not shown).
Synaptogenesis and the development of active properties
Arguably the most important developmental phase in a nervous system occurs during synaptogenesis and the completion of neuronal networks. The time at which this critical phase occurs cannot readily be deduced by extrapolation from the developmental profile of individual neuronal ion channels. In an attempt to establish the developmental window during which synaptogenesis is initiated in the CNS, we recorded endogenous neuronal activity in the hope of observing the first appearance of postsynaptic events.
Under voltage clamp, the earliest reliable activity we recorded in neurons occured at ∼15 hr AEL and was primarily composed of multiple random openings of single channels (Fig.8A). These currents (amplitude, <5 pA) usually came in bursts that occasionally lasted for as long as 1–2 sec (data not shown). Because of the complexity of the inward currents expressed by neurons at this stage in development, including IACh and ICa(and possibly INa in the neuronal processes), we did not attempt to identify the ionic nature of these currents. Currents that have the characteristics associated with synaptic input (i.e., those resembling EPSCs) were first seen at 16 hr AEL (5 of 18 neurons). These currents, the largest of which were 25 pA in amplitude, displayed rapid activation, slower inactivation, and a duration of ∼10–15 msec (Fig. 8B). However, it should be pointed out that because the events reflected in these currents are likely to be occurring at some distance away from the recording site on the cell body, it is difficult to assess their true amplitude and duration. Given that currents associated with miniature postsynaptic potentials are notoriously difficult to record in neuronal cell bodies and are unlikely to spread far from their site of generation, we conclude that these currents are EPSCs and indicate that active synaptic release of neurotransmitter is occurring. We discount the possibility that these events are attenuated action potentials (arising in areas of the neurons that are only weakly voltage-clamped), because in older embryos such events are seen together with larger-current wave forms that we identify unequivocally as being associated with action potentials (see below).
Fig. 8.

Development of endogenous neuronal activity.A, At 15 hr AEL whole-cell recordings reveal small inward currents that exhibit characteristics of single channel activity. B, Inward currents that resemble EPSCs are first observed in neurons at 16 hr AEL. These currents, which can reach 25pA in amplitude, have a rapid onset but slower decay and persist for ∼10–15 msec. C, Endogenous currents that are attributable to the generation and spread of action potentials in neurons are first observed at 17 hr AEL. These currents are relatively large (some exceeding 50 pA), are brief (3–5 msec), and overshoot. ForB and C, three representative examples from three individual neurons are shown. Neurons are voltage-clamped at −60 mV (A, B) and −40 mV (C) in normal whole-cell saline. Calibration:A, 2.5 pA, 40 msec; B, C, 10 pA, 20 msec.
To substantiate the view that the events we identified as EPSCs are evoked synaptic currents, we recorded neuronal activity under conditions in which synaptic activity should be either absent or severely reduced. First, we used a 0 Ca2+–high-Mg2+ saline (normal whole-cell saline containing no CaCl2 and 20 mmMgCl2) that does not support synaptic release of neurotransmitter (Getting, 1981). Second, we recorded from neurons that are expressing tetanus toxin light chain (UAS-TNT with expression driven by Scabrous Gal4; Brand and Perrimon, 1993; Thor and Thomas, 1997). Tetanus toxin light chain cleaves synaptobrevin in synaptic terminals, severely reducing evoked, but not spontaneous (e.g., minis), release of neurotransmitter (Sweeney et al., 1995). Third, we recorded from neurons deficient for para, which eliminatesINa and, therefore, presumably prevents sodium-based action potentials (O’Dowd and Aldrich, 1988; Broadie and Bate, 1993c). Synaptic events that we classified as EPSCs in wild-type neurons (Fig. 9A) are absent in 0 Ca2+–high-Mg2+ saline (Fig.9B) and are severely reduced in both amplitude and frequency in neurons that express tetanus toxin light-chain (Fig. 9C) or are para deficient (Fig. 9D). Event frequency is shown in Figure 9E and represents the average number of events that we identified as EPSCs from five separate recordings from various motoneurons (visualized by inclusion of 0.25% carboxyfluoroscein in the pipette saline and identified by the fact that their axon leaves the CNS). Motoneurons, rather than interneurons, where selected because they show the highest incidence of EPSC-like events in wild-type embryos. Thus, based on these further observations, we conclude that the events that we first observed from 16 hr AEL are indeed EPSCs.
Fig. 9.
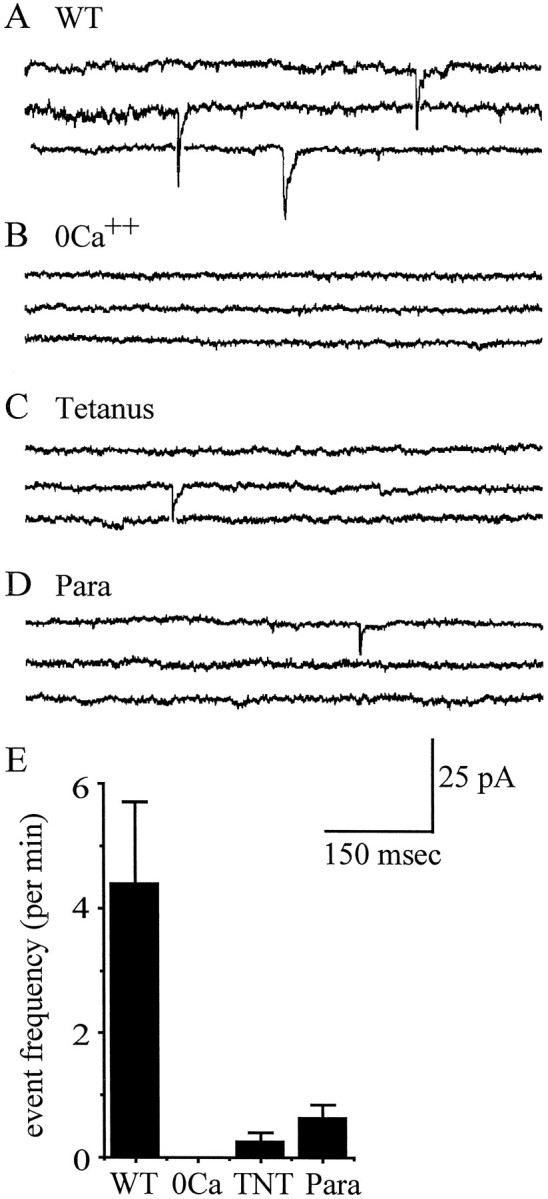
Characterization of EPSC-like currents.A, Neuronal recordings from wild-type (WT) embryos show currents that we classify as EPSCs (see Fig. 8). B, In conditions of 0 Ca2+–high Mg2+ (20 mm) known to prevent evoked release of neurotransmitter, no such currents are observed, supporting our identification of these events as resulting from the evoked release of synaptic neurotransmitter. C, Disruption of synaptic release by the expression of tetanus toxin light chain (TNT) in all neurons of the CNS (see Results) markedly reduces both frequency and amplitude of these currents. D, In embryos that carry a deficiency for para and cannot therefore support sodium-based action potentials, these events are also, as expected for evoked synaptic currents, severely reduced in both frequency and amplitude. E, Average frequency ± SE of EPSC-like currents per minute, determined from 3 min recordings from five separate motoneurons for each category. All three treatments are significantly different from WT at p< 0.05 (Mann–Whitney U test). Neurons are voltage-clamped at −60 mV in normal whole-cell saline.
Because we can record apparent EPSCs in neurons 16 hr AEL, we would expect that other neurons, presynaptic to them, would be able to fire action potentials. By 16 hr AEL, many neurons have acquired bothICa and INa and, thus, have the necessary ion channels to support the initiation of action potentials. However, in the neurons we examined, we never observed currents attributable to endogenous action potentials before 17 hr AEL (Fig. 8C). These currents, which are relatively large (some exceeding 50 pA in amplitude), are brief (lasting between 3 and 5 msec), and overshoot, display all the characteristics expected of the currents that underlie an action potential. Furthermore, these currents were rarely seen in neurons voltage-clamped at −60 mV but were common in neurons clamped at potentials more positive than −40 mV. The fact that these currents were present at all, however, is indicative that distal parts of the neurons recorded from are poorly voltage-clamped, because the currents arise from action potentials generated in these regions. However, although undesirable, this lack of space clamp has allowed us to estimate the time in development when the neurons we sampled were first able to generate propagating action potentials.
DISCUSSION
Based on general properties such as excitation threshold, inactivation, and reversal potential, the currents we recorded from neurons in vivo are essentially identical to those obtained from Drosophila neurons maintained in culture. This similarity validates our preparation as a suitable model for analyzing the electrogenesis of neurons and indicates that the development of individual neuronal currents is, to a significant degree, cell autonomous. However, by recording from neurons in vivo, we gain the additional advantage of potentially being able to determine the extent to which external signals also influence neural development.
Development of voltage-activated ion channels
As far as we can judge from studying a population of neurons rather than individual cells, voltage-gated currents appear in sequence in the developing central neurons of the Drosophila embryo. The first current to appear, IK, occurs between 13 and 14 hr AEL (62–67% of development) and is followed byICa (15 hr AEL, 71% of development),INa (16 hr AEL, 76% of development), and finally IA (17 hr AEL, 81% of development). The sequence, which is summarized in Figure10, has some similarity to that seen inDrosophila photoreceptors as they develop in the pupa. Photoreceptors are also neural in origin, and the first whole-cell current they express is IK (60 hr after pupariation, ∼60% of pupal development), followed byIA at 76 hr (76% pupal development) (Hardie, 1991). The sequence of current expression in neurons is, however, different from that seen in both Drosophila embryonic and pupal muscle (Broadie and Bate 1993b; Salkoff, 1985). Vertebrate neural development also involves a stereotyped sequence in which specific voltage- and ligand-gated currents appear in an order that varies between different types of neurons (O’Dowd et al., 1988; Ribera and Spitzer, 1990; Spitzer 1994). Thus, the progressive appearance of currents is a typical feature of the development of excitable cells. The sequence that we observed suggests that at least the neurons from which we have recorded (those situated dorsally in the abdominal ventral nerve cord) share a common developmental program and that individual characteristics will be superimposed on this general sequence of maturation.
Fig. 10.

Summary of the electrophysiological development of Drosophila embryonic neurons. The development of electrical properties of embryonic central neurons are shown with published data summarizing the development of the electrical properties of an identified body wall muscle (muscle 6) (Broadie and Bate, 1993).Bars show the onset of each current, andarrowheads show that the currents continue throughout the rest of development in the direction shown. The first appearance of both a voltage- and a ligand-gated current (IK andIACh) in central neurons coincides with the onset of currents in muscle. However, the ionic nature of the currents first observed in neurons differs from those in muscle 6.
We have not isolated all the voltage-activated currents known to be present in Drosophila neurons. To do that we will have to be able to recognize and record reliably from individual identified neurons. The neuronal IK current inDrosophila is composed of at least two currents; one inactivates slowly and is encoded by Shab, whereas the other, encoded by Shaw, is smaller and noninactivating (Solc and Aldrich, 1988; Tsunoda and Salkoff, 1995b). Northern analysis shows that transcripts for the relevant channels are expressed simultaneously in the developing embryo from 9 hr AEL (Tsunoda and Salkoff, 1995a). These two genes are also responsible for the IKcurrent present in muscle (Tsunoda and Salkoff, 1995a). By contrast, the molecular identity of the principal IAappears to differ between neuron and muscle. In muscle,IA is encoded by Shaker (Singh and Wu, 1990; Broadie and Bate, 1993b), although in central neurons,Shaker IA is only detectable in a subpopulation of neurons and even then does not constitute the majorIA (Baker and Salkoff, 1990; Tsunoda and Salkoff, 1995a,b). The principal neuronal IA is encoded by Shal and exhibits different kinetics toShaker (Tsunoda and Salkoff, 1995a). Because Shaker IA appears to be either absent or relatively insignificant in the majority of recordings from the neuronal cell body, it has been suggested that its expression in the CNS is restricted to the terminals of neurons (Tsunoda and Salkoff, 1995a). However, an analysis of type III (peptidergic) motoneuron terminals by whole-cell voltage clamp has failed to find any evidence forShaker IA, the presentIA being removed by null mutations ofShal (Martínez-Padrón and Férrus, 1997). Recordings from neurons in embryos carrying null mutations inShaker also show no obvious contribution ofShaker to IA (R. A. Baines, unpublished observations).
Development of acetylcholine-gated currents
In insects, acetylcholine is the principal sensory neurotransmitter and is also the major neurotransmitter of the CNS (Burrows, 1996). Interestingly, our data show thatDrosophila embryonic neurons respond to ACh early in their development (13–14 hr AEL) at a stage when they are only expressing one of their normal range of voltage-dependent whole-cell current types (IK). The response of such neurons to ACh is, therefore, unlikely to resemble that of fully developed cells, and it seems likely that if ACh has a function at this early developmental stage, it is not as a conventional neurotransmitter. The dorsal unpaired median (DUM) neurons of grasshopper embryos are sensitive to ACh (and GABA) even earlier in embryogenesis (40%), sensitivity in this instance coinciding with the initiation of axon outgrowth (Goodman and Spitzer, 1979). Such observations are circumstantial evidence for the view that ACh may have an early developmental function, in addition to its later role as a neurotransmitter. More convincing evidence for such a developmental role for ACh comes from observations of some of the early expressed nicotinic acetylcholine receptor subunits in the vertebrate CNS. These receptors are unusually permeable to Ca, and when they are expressed in PC12 cells, calcium influx mediates the initiation of early gene expression (Greenberg et al., 1996). Thus, extrinsic factors such as neurotransmitters may influence, through Ca influx and/or second messenger activation, gene expression and, hence, the determination of final neuronal phenotypes.
Synaptogenesis
Our recordings suggest that functional synapses formed by neurons that are presynaptic to the cells from which we record first appear between 15 and 16 hr AEL (71–76% embryonic development). Synaptic input is first apparent in recordings from DUM neurons in grasshoppers at 75% embryogenesis and between cercal afferents and central giant interneurons in cockroaches at 55% embryogenesis (Goodman and Spitzer, 1979; Blagburn et al., 1996). The embryonic Drosophilaneuromuscular junction, a peripheral synapse that has been investigated in some detail, is established at 13 hr AEL, becomes functional at 14 hr AEL (67%), and reaches maturity by 17 hr AEL (Broadie and Bate, 1993a), the time at which our observations show that embryonic neurons display their full complement of voltage-activated ion channels. Synaptic activity underlies the mechanism of synapse elimination in vertebrate muscle, whereby multiply innervated embryonic muscle fibers gradually remove inappropriate inputs to become individually innervated (Colman et al., 1997). Similar activity-dependent mechanisms refine axonal projections in the vertebrate lateral geniculate nucleus and visual cortex (Goodman and Shatz, 1993). Whether synaptic activity promotes the refinement of neuron–neuron connectedness inDrosophila is not known, but it may now be possible to resolve this issue during the later phases of embryogenesis that we describe in this study.
Regulation of electrogenesis
An important goal of our work is to identify and understand the mechanisms of action of factors that regulate the functional development of neurons and lead to the acquisition of specific characteristics by individual cells or cell classes. In this study we have begun to focus on the differentiation of excitable properties during late stages of neuronal development. There are several questions that we need to address before we begin to understand the development of excitable properties by central neurons. The first and most important of these is the extent to which there is diversification in the excitable properties of different neurons and classes of neurons. We can only resolve this by dealing with the development of different identified cells. The work we report here sets the stage for this by showing that recording from central neurons in vivo is feasible. The use of markers such as green fluorescent protein (Brand 1995) and the means to target these to individual cells or cell populations in the nervous system (Brand and Perrimon, 1993) means that we may now be able to address the question of diversity by recording from individual cells identified by such markers. If diversification is a fact, we turn to the mechanism of its control, which is likely to have larger implications for our understanding of functional plasticity, as well as functional development. In general, as with any other developmental sequence, we can divide the factors that might influence this process into those that are extrinsic and those that are intrinsic to the cells themselves. For example, the phenotype of individual neurons is likely to be dictated in part by their lineage within a particular neuroblast clone and in part by interactions with neighboring cells (Kuwada and Goodman, 1985; Spana et al., 1995; Doe et al., 1996). It will be important in this context to establish whether the expression of a particular transcription factor or constellation of transcription factors can be decisive in dictating the development of excitable properties just as, for example, the expression ofislet is required for the development of appropriate neurotransmitter synthesis and for axon pathfinding by a subset ofDrosophila central neurons (Thor and Thomas, 1997). Interestingly, recent work with the leech shows that injection of transcripts of the homeobox gene, Lox1, into neurons can lead to a change of electrical properties that is manifested as a threefold increase in action potential amplitude (Aisemberg et al., 1997). At the same time it will be important to establish the extent to which cell contact triggers or modifies the acquisition of electrical properties during development. Candidates for such a role might include glial cells, or targets such as muscles that are specific to a particular class of cells, the motoneurons. Finally, and perhaps most interesting and challenging, is the prospect that activity and activity-mediated signaling may influence the development of specific excitable properties. In this sense, connectivity may be an essential component of the process by which the excitable properties of individual neurons are set. If this is true, then a proper analysis of the functional characteristics of individual neurons will only be possible if their correct connectivity within the CNS is maintained. The prospect now is that it may be possible to show the extent to which this expectation is fulfilled and to dissect the pathways by which the functional characteristics of nerve cells are actually set during development.
Footnotes
This work is supported by The Wellcome Trust. We thank Roger Hardie, Simon Laughlin, Laurent Seugnet, Maximiliano Suster, and Matthias Landgraf for their help and comments on this manuscript. We thank Sean Sweeney for the gift of UAS-TNTG flies.
Correspondence should be addressed to Dr. R.A. Baines, Department of Zoology, University of Cambridge, Cambridge, CB2 3EJ, UK.
REFERENCES
- 1.Aisemberg GO, Gershon TR, Macagno ER. New electrical properties of neurons induced by a homeoprotein. J Neurobiol. 1997;33:11–17. doi: 10.1002/(sici)1097-4695(199707)33:1<11::aid-neu2>3.0.co;2-g. [DOI] [PubMed] [Google Scholar]
- 2.Baines RA, Bacon JP. Pharmacological analysis of the cholinergic input to the locust VPLI neuron from an extraocular photoreceptor system. J Neurophysiol. 1994;72:2864–2874. doi: 10.1152/jn.1994.72.6.2864. [DOI] [PubMed] [Google Scholar]
- 3.Baker K, Salkoff L. The Drosophila shaker gene codes for a distinctive K+ current in a subset of neurons. Neuron. 1990;2:129–140. doi: 10.1016/0896-6273(90)90449-p. [DOI] [PubMed] [Google Scholar]
- 4.Benson JA. Electrophysiological pharmacology of the nicotinic and muscarinic cholinergic responses of isolated neuronal somata from locust thoracic ganglia. J Exp Biol. 1992;170:203–233. [Google Scholar]
- 5.Blagburn JM, Sosa MA, Blanco RE. Specificity of identified central synapses in the embryonic cockroach: appropriate connections form before the onset of spontaneous afferent activity. J Comp Neurol. 1996;373:511–528. doi: 10.1002/(SICI)1096-9861(19960930)373:4<511::AID-CNE4>3.0.CO;2-4. [DOI] [PubMed] [Google Scholar]
- 6.Brand AH. GFP in Drosophila. Trends Genet. 1995;11:324–325. doi: 10.1016/s0168-9525(00)89091-5. [DOI] [PubMed] [Google Scholar]
- 7.Brand AH, Perrimon N. Targeted gene expression as a means of altering cell fates and generating dominant phenotypes. Development. 1993;118:401–415. doi: 10.1242/dev.118.2.401. [DOI] [PubMed] [Google Scholar]
- 8.Broadie KS, Bate M. Development of the embryonic neuromuscular synapse of Drosophila melanogaster. J Neurosci. 1993a;13:144–166. doi: 10.1523/JNEUROSCI.13-01-00144.1993. [DOI] [PMC free article] [PubMed] [Google Scholar]
- 9.Broadie KS, Bate M. Development of larval muscle properties in the embryonic myotubes of Drosophila melanogaster. J Neurosci. 1993b;13:167–180. doi: 10.1523/JNEUROSCI.13-01-00167.1993. [DOI] [PMC free article] [PubMed] [Google Scholar]
- 10.Broadie KS, Bate M. Activity-dependent development of the neuromuscular synapse during Drosophila embryogenesis. Neuron. 1993c;11:607–609. doi: 10.1016/0896-6273(93)90073-z. [DOI] [PubMed] [Google Scholar]
- 11.Burrows M. The neurobiology of an insect brain. Oxford UP; Oxford: 1996. [Google Scholar]
- 12.Byerly L, Leung HT. Ionic currents of Drosophila neurons in embryonic cultures. J Neurosci. 1988;8:4379–4393. doi: 10.1523/JNEUROSCI.08-11-04379.1988. [DOI] [PMC free article] [PubMed] [Google Scholar]
- 13.Colman H, Nabekura J, Lichtman JW. Alterations in synaptic strength preceding axon withdrawal. Science. 1997;275:356–361. doi: 10.1126/science.275.5298.356. [DOI] [PubMed] [Google Scholar]
- 14.Doe CQ, Skeath JB. Neurogenesis in the insect central nervous system. Curr Opin Neurobiol. 1996;6:18–24. doi: 10.1016/s0959-4388(96)80004-3. [DOI] [PubMed] [Google Scholar]
- 15.Germeraad S, O’Dowd D, Aldrich RW. Functional assay of a putative Drosophila sodium channel gene in homozygous deficiency neurons. J Neurogenet. 1992;8:1–16. doi: 10.3109/01677069209167268. [DOI] [PubMed] [Google Scholar]
- 16.Getting PA. Mechanisms of pattern generation underlying swimming in Tritonia. I. Neuronal network formed by monosynaptic connections. J Neurophysiol. 1981;46:65–79. doi: 10.1152/jn.1981.46.1.65. [DOI] [PubMed] [Google Scholar]
- 17.Gielow ML, Gu GG, Singh S. Resolution and pharmacological analysis of the voltage-dependent calcium channels of Drosophila larval muscles. J Neurosci. 1995;15:6085–6093. doi: 10.1523/JNEUROSCI.15-09-06085.1995. [DOI] [PMC free article] [PubMed] [Google Scholar]
- 18.Goodman CS, Doe CQ. Embryonic development of Drosophila central nervous system. In: Bate M, Martinez Arias A, editors. The development of Drosophila melanogaster. Cold Spring Harbor Laboratory; Cold Spring Harbor, NY: 1993. pp. 1131–1206. [Google Scholar]
- 19.Goodman CS, Shatz CJ. Developmental mechanisms that generate precise patterns of neuronal connectivity. Cell [Suppl] 1993;72:77–98. doi: 10.1016/s0092-8674(05)80030-3. [DOI] [PubMed] [Google Scholar]
- 20.Goodman CS, Spitzer NC. Embryonic development of identified neurons: differentiation from neuroblast to neuron. Nature. 1979;280:208–214. doi: 10.1038/280208a0. [DOI] [PubMed] [Google Scholar]
- 21.Greenberg ME, Ziff EB, Greene LA. Stimulation of neuronal acetylcholine receptors induces rapid gene transcription. Science. 1996;234:80–83. doi: 10.1126/science.3749894. [DOI] [PubMed] [Google Scholar]
- 22.Hall ZW, Sanes JR. Synaptic structure and development: the neuromuscular junction. Cell [Suppl] 1993;10:99–121. doi: 10.1016/s0092-8674(05)80031-5. [DOI] [PubMed] [Google Scholar]
- 23.Hardie RC. Voltage-sensitive channels in Drosophila photoreceptors. J Neurosci. 1991;11:3079–3095. doi: 10.1523/JNEUROSCI.11-10-03079.1991. [DOI] [PMC free article] [PubMed] [Google Scholar]
- 24.Kuwada JY, Goodman CS. Neuronal determination during embryonic development of the grasshopper nervous system. Dev Biol. 1985;110:114–126. doi: 10.1016/0012-1606(85)90069-7. [DOI] [PubMed] [Google Scholar]
- 25.Leung HT, Byerly L. Characterization of single calcium channels in Drosophila embryonic nerve and muscle cells. J Neurosci. 1991;11:3047–3059. doi: 10.1523/JNEUROSCI.11-10-03047.1991. [DOI] [PMC free article] [PubMed] [Google Scholar]
- 26.Martínez-Padrón M, Férrus A. Presynaptic recordings from Drosophila: correlation of macroscopic and single channel K+ currents. J Neurosci. 1997;17:3412–3424. doi: 10.1523/JNEUROSCI.17-10-03412.1997. [DOI] [PMC free article] [PubMed] [Google Scholar]
- 27.O’Dowd D, Aldrich RW. Voltage-clamp analysis of sodium channels in wild-type and mutant Drosophila neurons. J Neurosci. 1988;8:3633–3643. doi: 10.1523/JNEUROSCI.08-10-03633.1988. [DOI] [PMC free article] [PubMed] [Google Scholar]
- 28.O’Dowd D, Ribera AB, Spitzer NC. Development of voltage-dependent calcium, sodium, and potassium currents in Xenopus spinal neurons. J Neurosci. 1988;8:792–805. doi: 10.1523/JNEUROSCI.08-03-00792.1988. [DOI] [PMC free article] [PubMed] [Google Scholar]
- 29.Ribera AB, Spitzer NC. Differentiation of IKA in amphibian spinal neurons. J Neurosci. 1990;10:1886–1991. doi: 10.1523/JNEUROSCI.10-06-01886.1990. [DOI] [PMC free article] [PubMed] [Google Scholar]
- 30.Salkoff L. Development of ion channels in the flight muscles of Drosophila. J Physiol (Lond) 1985;80:275–282. [PubMed] [Google Scholar]
- 31.Singh S, Wu CF. Properties of potassium currents and their role in membrane excitability in Drosophila larval muscle fibers. J Exp Biol. 1990;152:59–76. doi: 10.1242/jeb.152.1.59. [DOI] [PubMed] [Google Scholar]
- 32.Smith LA, Wang X, Peixoto AA, Neumann EK, Hall LM, Hall JC. A Drosophila calcium channel α1 subunit gene maps to a genetic locus associated with behavioral and visual defects. J Neurosci. 1996;16:7868–7879. doi: 10.1523/JNEUROSCI.16-24-07868.1996. [DOI] [PMC free article] [PubMed] [Google Scholar]
- 33.Solc CK, Aldrich RW. Voltage-gated potassium channels in larval CNS neurons of Drosophila. J Neurosci. 1988;8:2556–2570. doi: 10.1523/JNEUROSCI.08-07-02556.1988. [DOI] [PMC free article] [PubMed] [Google Scholar]
- 34.Spana EP, Kopczynski C, Goodman CS, Doe CQ. Asymmetric localization of numb autonomously determines sibling neuron identity in the Drosophila CNS. Development. 1995;121:3489–3494. doi: 10.1242/dev.121.11.3489. [DOI] [PubMed] [Google Scholar]
- 35.Spitzer NC. Development of voltage-dependent and ligand-gated channels in excitable membranes. In: van Pelt J, Corner MA, Uylings HBM, Lopes da Silva FH, editors. Progress in brain research. Elsevier; Amsterdam: 1994. pp. 169–179. [DOI] [PubMed] [Google Scholar]
- 36.Sweeney ST, Broadie KS, Keane J, Niemann H, O’Kane CJ. Targeted expression of tetanus toxin light chain in Drosophila specifically eliminates synaptic transmission and causes behavioural defects. Neuron. 1995;14:341–351. doi: 10.1016/0896-6273(95)90290-2. [DOI] [PubMed] [Google Scholar]
- 37.Tessier-Lavigne M, Goodman CS. The molecular biology of axon guidance. Science. 1996;274:1123–1133. doi: 10.1126/science.274.5290.1123. [DOI] [PubMed] [Google Scholar]
- 38.Thor S, Thomas JB. The Drosophila islet gene governs axon pathfinding and neurotransmitter identity. Neuron. 1997;18:397–409. doi: 10.1016/s0896-6273(00)81241-6. [DOI] [PubMed] [Google Scholar]
- 39.Tsunoda S, Salkoff L. Genetic analysis of Drosophila neurons: Shal, Shaw and Shab encode most embryonic potassium currents. J Neurosci. 1995a;15:1741–1754. doi: 10.1523/JNEUROSCI.15-03-01741.1995. [DOI] [PMC free article] [PubMed] [Google Scholar]
- 40.Tsunoda S, Salkoff L. The major delayed rectifier in both Drosophila neurons and muscle is encoded by Shab. J Neurosci. 1995b;15:5209–5221. doi: 10.1523/JNEUROSCI.15-07-05209.1995. [DOI] [PMC free article] [PubMed] [Google Scholar]
- 41.Zheng W, Feng G, Ren D, Erbel D, Hannan F, Dubald M, Hall LM. Cloning and characterization of a calcium channel α1 subunit from Drosophila melanogaster with similarity to rat brain type D isoform. J Neurosci. 1995;15:1132–1143. doi: 10.1523/JNEUROSCI.15-02-01132.1995. [DOI] [PMC free article] [PubMed] [Google Scholar]