

Abstract
To address the question of the relative contributions of glial and neuronal glutamate transport in the vertebrate CNS, we studied the distribution of forebrain glutamate transporters in rat hippocampal microcultures, a preparation in which physiological functions of glutamate transporters have been well characterized. Two of the three transporters, GLAST (EAAT1) and EAAC1 (EAAT3), are localized to microculture glia and neurons, respectively, as expected. However, we find strong immunoreactivity for the third glutamate transporter GLT-1 (EAAT2), a putatively glial transporter, in microculture neurons and in a small subset of microculture glia. Indistinguishable immunohistochemical staining patterns for GLT-1 were obtained with antibodies directed against both the N terminal and C terminal of the GLT-1 protein. Double-labeling experiments suggest that neuronal GLT-1 protein is primarily localized to the dendrites of excitatory neurons. Neuronal electrogenic transport currents in response tod-aspartate applications were occluded by the selective GLT-1 inhibitor dihydrokainate. In contrast, glia exhibited a larger transporter current density than did neurons, and the glial transport current was less sensitive to dihydrokainate. Neuronal transport currents were potentiated less than were glial currents when the chaotropic anion thiocyanate was substituted for gluconate in the whole-cell recording pipette, consistent with the previously reported lower anion permeability of EAAC1 and GLT-1 compared with that of GLAST. After microculture glia were rendered nonviable, excitatory autaptic currents (EACs) were prolonged in the presence of dihydrokainate, suggesting that neuronal GLT-1 is capable of participating in the clearance of synaptically released glutamate. Our results suggest that the initially proposed characterization of GLT-1 as a purely glial transporter is too simplistic and that under certain conditions functional GLT-1 protein can be expressed in brain neurons. The study suggests that changes in GLT-1 levels that occur with pathology or experimental manipulations cannot be assumed to be glial.
Keywords: glutamate transport, glutamate uptake, astrocyte, postsynaptic, dendrite, microculture, hippocampus
Glutamate transporters participate in limiting the effective lifetime of synaptically released glutamate (Barbour et al., 1994; Mennerick and Zorumski, 1994; Tong and Jahr, 1994) and maintain ambient glutamate concentrations below toxic levels (Rothstein, 1996a; Tanaka et al., 1997). The relative contributions of glial versus neuronal glutamate transport remain unclear, although recent electrophysiological studies suggest that electrogenic transport currents can be recorded during synaptic events in both glia and neurons in situ (Bergles and Jahr, 1997; Clark and Barbour, 1997; Otis et al., 1997). Understanding the differential contributions of various transporters is likely to lead to a better understanding of the role of transporters in both normal and pathological states like amyotrophic lateral sclerosis, in which downregulation of the putatively glial glutamate transporter GLT-1 has been correlated with neurodegeneration (Rothstein, 1996b).
The recent cloning of glutamate transporters has permitted localization studies suggesting that, in the adult forebrain, two transporters, GLAST (EAAT1) and GLT-1 (EAAT2), localize to glial cells, whereas EAAC1 localizes to neurons (e.g., Rothstein et al., 1994; Lehre et al., 1995). These original distinctions have been slightly blurred recently by the observation of GLT-1 mRNA (but not protein) expression in hippocampal pyramidal cells (Schmitt et al., 1996; Torp et al., 1997), observations of transient GLT-1 protein expression in white matter of embryonic brain (Furuta et al., 1997), GLT-1 protein expression in certain neurons of the retina (Grunert et al., 1994; Rauen and Kanner, 1994), and apparent neuronal expression of GLT-1 in a porcine ischemia model (Martin et al., 1997).
Studying the localization of transporter subtypes in a preparation for which a physiological role of glutamate transporters has been characterized is one approach to understanding possible differential contributions of the various glutamate transporters. We have been studying the role of glutamate transporters in microcultures of postnatal rat hippocampus. These cultures provide a highly controlled environment that allows experimental manipulation of the cellular growth environment. Additionally, because neurons and glia in culture can be easily distinguished at the light microscopic level, it is possible to perform independent experimental manipulations on one cell type versus the other. We recently examined the effects on synaptic currents of both broad-spectrum and glial-specific glutamate transport inhibition (Mennerick and Zorumski, 1994). These results suggested a predominant role for glia in clearance and/or buffering of glutamate after presynaptic release. As part of an effort to determine the molecular identity of the transporter(s) responsible for these effects, we have undertaken an immunohistochemical localization of the three forebrain transporters in hippocampal microcultures.
Our results suggest that although two of the transporters, GLAST and EAAC1, show the expected distribution in glia and neurons, respectively, GLT-1 expression shows a surprising pattern of low glial levels and robust expression in postsynaptic neuronal processes. The results suggest that this putatively glial transporter can be functionally expressed in neurons and suggest that changes in GLT-1 expression in pathological or experimental situations need to be interpreted with caution.
MATERIALS AND METHODS
Cell culture. Hippocampal cells were prepared from 1–3 d postnatal Sprague Dawley rats. Slices of hippocampus 500–800 μm thick were treated with 1 mg/ml papain in oxygenated Leibovitz’s L-15 medium. Single-cell suspensions were obtained by trituration in modified Eagle’s medium containing 5% horse serum, 5% fetal calf serum, 17 mmd-glucose, 400 μmglutamine, 50 U/ml penicillin, and 50 μg/ml streptomycin. Cells (75/mm2 for microcultures; 2100/mm2 for mass cultures) were plated onto plastic culture dishes coated with a layer of collagen (mass cultures) or 0.15% agarose and collagen droplets (microcultures) as described previously (Mennerick et al., 1995). Cultures were treated with cytosine arabinoside (10 μm) after 3 d in vitro and were used for experiments 1–16 d after plating. For serum-free conditions, culture medium was replaced at 3 d in vitro with the above medium, minus serum, and supplemented with 10 μg/ml insulin, 10 μg/ml transferrin, and 10 ng/ml sodium selenite.
Western blots. Rat hippocampus was homogenized in ice-cold buffer containing 20 mm Tris-HCl, pH 7.4, with 10% sucrose, 10 μg/ml antipain, 5 μg/ml aprotinin, 5 μg/ml leupeptin, 0.1 mm PMSF, 1 mm EDTA, and 1 mmEGTA. Cultures were washed twice with PBS before solubilization. Hippocampal homogenates and cultures were solubilized in 2% SDS, 5% 2-mercaptoethanol, 65 mm Tris-HCl, pH 6.8, 10% glycerol, and protease inhibitors. Aliquots of samples were subjected to 4–20% SDS-PAGE electrophoresis and electroblotted onto nitroceullulose membrane using a minigel and mini transblot apparatus (Bio-Rad, Hercules, CA). Membranes were blocked (0.1% Tween and 5% nonfat powdered milk in Tris-buffered saline) for 1 hr followed by room-temperature incubation in primary antibodies diluted in Tris-buffered saline [anti-B12 antibody (Lehre et al., 1995) (from rabbit 68518), 0.25 μg/ml; C-terminal antibody (Rothstein et al., 1994), 0.011 μg/ml]. Antibody binding was detected by a horseradish peroxidase-conjugated anti-rabbit secondary and an ECL Western blotting detection kit (Amersham, Arlington Heights, IL).
Immunohistochemistry. Cultures were rinsed in PBS and fixed with 4% paraformaldehyde and 0.2% glutaraldehyde. After treatment with 1.5% hydrogen peroxide, cells were permeabilized and blocked in 10% normal goat serum and 0.1% Triton X-100. All antibodies were characterized previously or obtained from commercial suppliers as indicated, except for the anti-C510 EAAC1 antibody. The affinity-purified anti-C510 (rabbit 69738) EAAC1 antibody was raised against a C-terminal peptide of EAAC1 as described previously (Lehre et al., 1995).
Cultures were incubated in primary antibodies diluted in blocking solution at the following concentrations: 6.7 ng/ml [C-terminal affinity-purified anti-GLT-1 (Rothstein et al., 1994)], 20 ng/ml [N-terminal affinity-purified anti-B12 antibody from rabbit 68518 (Lehre et al., 1995)], and 1:20 working dilution of EAAT2 monoclonal antibody (Novo Castra, Newcastle upon Tyne, UK). For peptide block experiments, GLT-1 anti-B12 antibody was incubated overnight in 10–100-fold molar excess of free GLT-1 oligopeptide. Monoclonal antibody against GFAP (Chemicon, Temecula, CA) was used at a 1:100,000 working dilution. Monoclonal antibody against GABA (Chemicon) was used at 2 μg/ml. Affinity-purified antibodies against EAAC1 (anti-C510; rabbit 69738) and GLAST (anti A522; rabbit 68488) (Lehre et al., 1995) were used at 20–200 ng/ml, diluted in blocking solution.
Visualization of antibody binding was routinely achieved using a Vector ABC Elite Kit (Vector Laboratories, Burlingame, CA) using a horseradish peroxidase/diaminobenzidine tetrahydrochloride chromogenic reaction with nickel intensification. For some experiments, bound primary antibody was visualized with a rhodamine-conjugated secondary antibody (Chemicon) used at 2.5 μg/ml.
Electrophysiology. The extracellular bath solution for synaptic physiology contained (in mm): NaCl, 140; KCl, 4.0; CaCl2, 3.0; MgCl2, 1.0; HEPES, 10; d-APV, 0.05; and cyclothiazide, 0.01. The whole-cell recording pipette solution for synaptic studies contained (in mm): potassium gluconate, 130; NaCl, 4.0; CaCl2, 0.5; EGTA, 5.0; HEPES, 10; MgATP2, 2.0; and GTP, 0.5. The pH of solutions was adjusted to 7.25. Whole-cell, voltage-clamp recordings of excitatory autaptic currents (EACs) were performed from solitary neurons using pipettes with an open-tip resistance of 2–5 MΩ and with series resistance compensated 90–100% using the compensation circuitry of an Axopatch 1-D amplifier (Axon Instruments, Foster City, CA). Neurons were stimulated with a brief (1.5 msec) voltage command pulse to 0 mV from a holding potential of −70 mV. Solutions were exchanged with a gravity-driven local perfusion system. Averages of two to five sweeps in each condition were used for display and analysis. Although EACs under the conditions of these experiments often decay with complex kinetics (Mennerick and Zorumski, 1995), for purposes of comparison among the various experimental conditions, EAC decays were fit with a single-exponential function, generated from a Chebyshev-transform algorithm (PClamp 6.0; Axon Instruments).
For exploring responses to applications of the transporter substrated-aspartate, the composition of extracellular solution was altered as follows: cyclothiazide was omitted, and MgCl2was increased to 2 mm. Additionally, 250 nmtetrodotoxin, 10 μm MK-801, 50 μmd-APV, 25 μm bicuculline methobromide, 10 μm 6-nitro-7-sulfamoylbenzo(f)quinoxaline-2,3-dione, and 50 μm GYKI 52466 were added. Large, presumably excitatory neurons (Mennerick et al., 1995) and small, usually singly nucleated islands of glia were examined for d-aspartate responses. For some experiments, the intracellular pipette solution contained thiocyanate in place of gluconate to examine transporter-mediated anionic currents (Wadiche et al., 1995). For estimation of d-aspartate current densities, current amplitude was divided by total cell membrane capacitance, estimated from biexponential fits to the decays of neuronal and glial membrane responses to 15 mV hyperpolarizing voltage pulses (Mennerick et al., 1995).
RESULTS
Localization of GLAST, EAAC1, and GLT-1 immunoreactivity
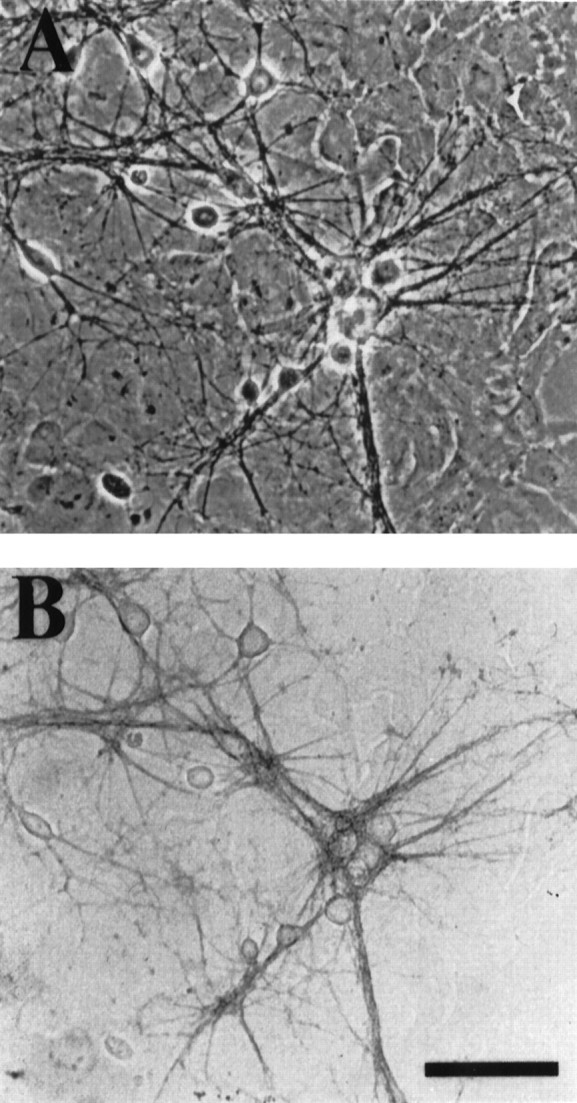
Staining of microcultures for the glial GLAST transporter and neuronal EAAC1 transporter revealed the expected complementary staining patterns in the two cell types. The vast majority of glia (>80%) in microcultures exhibited detectable immunoreactivity when stained with anti-A522 GLAST antibody. However, there was often considerable variability in staining intensity, even among glia comprising an individual microculture (Fig.1A). Detectable neuronal staining was not present with this antibody (Fig.1A). In contrast, staining with the anti-C510 (EAAC1) antibody revealed staining of neuronal cell bodies and processes but not of glia. Again, there was considerable variability in the levels of EAAC1 staining among different neurons, often with the largest neurons staining most intensely (Fig. 1B).
Fig. 1.

Expression of GLAST and EAAC1 in hippocampal microcultures. A, Bright-field photomicrograph of GLAST expression in microcultures. GLAST was confined to glia, often exhibiting a patchwork of staining intensities on a single microculture. Note a cluster of unstained neurons (arrow). Anti-A522 antibody, 100 ng/ml, was used for the stain. B, Bright-field photomicrograph of EAAC1 staining. Staining was confined to neuronal somata and processes. Anti-C510 antibody was used at 54 ng/ml. Scale bars: A, 80 μm; B, 40 μm.
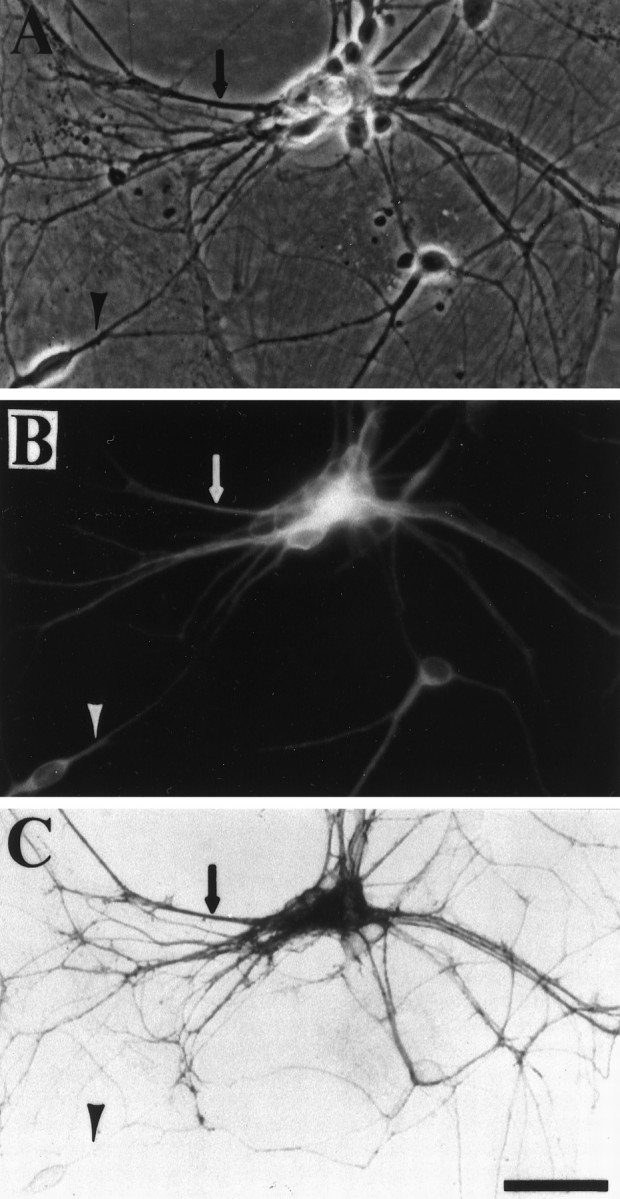
Immunostaining for the third forebrain transporter GLT-1 exhibited a surprising pattern of labeling. Figure2C shows immunoreactivity found on a microculture stained with an antibody raised against an N-terminal region of the GLT-1 glutamate transporter (anti-B12 antibody) (Lehre et al., 1995). Only a minority of microculture glia was immunoreactive for GLT-1. Immunoreactive clusters of a few glial cells were often present on individual microcultures (Fig.2B,C). These low levels of GLT-1 expression in microculture glia are consistent with descriptions of low GLT-1 mRNA and protein levels in immature hippocampus (Shibata et al., 1996; Ullensvang et al., 1997) and in other culture systems (Kondo et al., 1995; Swanson et al., 1997).
Fig. 2.

Immunohistochemical evidence of GLT-1 expression in microculture neurons. A, Phase-contrast photomicrograph of a microculture of postnatal hippocampal neurons 8 d in vitro. The photomicrograph was obtained after fixation and immunohistochemical processing. Note the numerous neuronal somata, two of the largest of which are indicated byarrows, and processes (e.g., arrowheads) present. B, Immunofluorescence photomicrograph of the microculture in A. The microculture was stained using an antibody against GFAP and was visualized with a rhodamine-conjugated secondary antibody to demonstrate the population of astrocytes underlying the microculture. C, Bright-field photomicrograph of GLT-1-like immunoreactivity. Note the immunoreactivity of a small, clustered population of astrocytes on theleft of the microculture and the strong immunoreactivity of many neuronal processes (e.g., arrowheads) but not somata (e.g., arrows). Anti-B12 antibody, 20 ng/ml, and anti-GFAP, 1:100,000, were used for the staining. Scale bar, 76 μm.
Surprisingly, the most prominent GLT-1-immunoreactive com- ponents of the microcultures were processes of microculture neurons (Fig. 2C). In contrast to EAAC1 immunoreactivity, neuronal somata were primarily devoid of immunoreactivity. GLT-1 immunoreactivity was most prominent in the proximal portions of neuronal processes, and only a subset of processes appeared to be labeled (Fig. 2A,C; see below). Immunoreactivity was not detectable in neurons 1 d after plating, when cells are primarily devoid of processes (data not shown). Immunoreactivity gradually increased in subsequent days in vitro, during the period of axon and dendrite elaboration.
Specificity of GLT-1 immunolocalization
Although mRNA for GLT-1 has been detected in neurons from several brain regions by in situ hybridization (Schmitt et al., 1996; Torp et al., 1997), GLT-1 protein has not been detected in brain neurons. Therefore, we performed several experiments to examine the robustness and validity of the GLT-1-like immunoreactivity in microculture neurons. To determine whether properties unique to the microculture environment are responsible for GLT-1 immunoreactivity, we examined GLT-1 immunoreactivity in conventional mass cultures of postnatal hippocampal neurons. Figure 3shows that mass-culture neurons, like microculture neurons, exhibit prominent GLT-1 immunoreactivity in neuronal processes, with little somatic immunoreactivity (Fig. 3B). As observed in microcultures, only a minority of mass-culture glia was immunoreactive for GLT-1. We also found that growing cultures in serum-free medium beginning at day 3–6 in vitro did not alter neuronal GLT-1 immunoreactivity when examined between days 7–11 in vitro(data not shown). These results indicate that neuronal GLT-1 immunoreactivity is a robust phenomenon, present in neurons grown in a variety of culture conditions.
Fig. 3.
Mass-culture processes also display GLT-1 immunoreactivity. A, Phase-contrast photomicrograph of a hippocampal mass culture 9 d in vitro.B, Bright-field photomicrograph of the same field of view shown in A. Staining with the anti-B12 antibody reveals prominent staining of neuronal processes with little glial or neuronal soma staining. Anti-B12 antibody was used at 20 ng/ml. Scale bar, 76 μm.
We compared Western blots using antibodies raised against N- and C-terminal regions of the GLT-1 protein. Because of the larger amounts of available tissue per culture dish, mass cultures rather than microcultures were used for these experiments. The N-terminal anti-B12 antibody was compared with an antibody raised against a C-terminal GLT-1 peptide (Rothstein et al., 1994). Both GLT-1 antibodies stained a band of ∼66 kDa in homogenates prepared from adult hippocampus and from cultures (Fig. 4). GLT-1 in cultures possessed a much lower relative abundance than in adult hippocampus (Fig. 4), consistent with its restricted localization in immunohistochemistry experiments.
Fig. 4.

Immunoblots of GLT-1. Immunoblots were prepared as described in Materials and Methods either using the N-terminal anti-B12 antibody (left; 250 ng/ml) (Lehre et al., 1995) or using a C-terminal antibody (right; 11 ng/ml) (Rothstein et al., 1994). Lanes represent spleen (S; 20 μg of protein), adult hippocampus (H; 0.1 μg of protein), and hippocampal cultures (HC; 50 μg of protein). Molecular mass migration is indicated between thepanels in kDa.
Several GLT-1 antibodies were also used in immunohistochemical experiments and yielded indistinguishable patterns of staining. Figure5 shows a comparison of the patterns of immunostaining observed with the N-terminal (anti-B12) and C-terminal GLT-1 antibodies in single-neuron microcultures. A monoclonal antibody raised against a C-terminal portion of the human GLT-1 homolog EAAT2 also yielded staining indistinguishable from the other two antibodies (data not shown).
Fig. 5.

Different GLT-1 antibodies yield similar cellular staining patterns. Phase-contrast (A, C) and bright-field (B, D) photomicrographs of single-neuron microcultures immunostained for GLT-1 are shown.A, B, A microculture immunostained using an affinity-purified antibody directed against an N-terminal peptide (anti-B12 antibody; 20 ng/ml). C, D, An immunostain obtained using an affinity-purified antibody directed against a C-terminal GLT-1 peptide (7 ng/ml). Scale bar, 76 μm. Note that, with both antibodies, staining is localized to a nest of neuronal processes and is primarily excluded from neuronal somata and glial cells.
Omission of primary antibody from the incubation solution caused a complete loss of staining in both microculture glia and neurons (data not shown). Similarly, Figure 6 shows that when primary antibody was preabsorbed with an excess of the free N-terminal peptide used to raise the antibody, both neuronal and glial immunostaining was abolished. Together the above results support the idea that the staining pattern of neuronal processes observed is attributable to neuronal expression of GLT-1 protein.
Fig. 6.

Peptide block of immunoreactivity.A, B, Phase-contrast (A) and bright-field (B) photomicrographs of a microculture fixed after 10 d in vitro and stained with the anti-B12 GLT-1 antibody (20 ng/ml).C, D, Phase-contrast (C) and bright-field (D) photomicrographs of a microculture from the same plating of the culture shown in A and B. The microculture was fixed and processed for immunohistochemistry at the same time and using the same reagents as the microculture inA and B except that the primary antibody was preabsorbed with an excess of the free-peptide immunogen. Scale bar, 76 μm.
Cellular localization of GLT-1 immunoreactivity
Postnatal hippocampal cultures comprise both excitatory (glutamatergic) and inhibitory (GABAergic) neurons (Mennerick et al., 1995). To determine whether GLT-1 protein is differentially expressed in one neuronal phenotype versus another, we performed double-labeling studies with a GLT-1 antibody and with an antibody against GABA, to identify inhibitory neurons. Figure 7shows that neuronal processes labeled for GLT-1 were never double labeled with the antibody against GABA. This result indicates that neuronal GLT-1 expression is limited primarily, if not exclusively, to excitatory neurons in hippocampal microcultures.
Fig. 7.

Segregation of GLT-1 immunoreactivity and GABA immunoreactivity. A, Phase-contrast photomicrograph of a microculture 11 d in vitro. B, Fluorescence photomicrograph showing GABA immunoreactivity of the microculture depicted in A. The anti-GABA antibody was used at 2 μg/ml. C, Bright-field photomicrograph showing GLT-1 immunoreactivity (C-terminal antibody, 7 ng/ml) of the same microculture. A GABA-positive process (presumed dendrite) is indicated by the arrow in A–C. Scale bar, 38 μm.
Although axon terminals of excitatory neurons can be shown biochemically to possess strong glutamate transport activity (Gundersen et al., 1993), immunocytochemical localization studies have failed to detect evidence of a presynaptic transporter (Rothstein et al., 1994;Chaudhry et al., 1995; Yamada et al., 1996). To determine whether axons or dendrites might preferentially exhibit GLT-1 immunoreactivity, we combined staining for the dendritic marker MAP2 (Caceres et al., 1986) and GLT-1. Results showed extensive overlap of the staining patterns yielded by the MAP2 and GLT-1 antibodies (Fig.8). Additionally, many processes that showed no MAP2 immunoreactivity were also GLT-1 negative (Fig. 8). However, there were also instances of MAP2-positive processes that were GLT-1 negative. These processes likely arose from GABAergic cells (see Fig. 8). Finally, we also found some examples of GLT-1-positive processes that showed no detectable MAP2 immunoreactivity. These could represent axons or could represent dendrites expressing MAP2 at levels below the threshold for detection. These experiments suggest that neuronal GLT-1 expression localizes to specific cellular and subcellular compartments in hippocampal microcultures.
Fig. 8.
GLT-1 immunoreactivity is primarily colocalized with a dendritic marker. A, Phase-contrast photomicrograph of microculture neurons. B, The same field depicting MAP2 immunofluorescence. C, Bright-field view showing GLT-1 immunoreactivity (C-terminal antibody, 7 ng/ml) of the same microculture. The arrow indicates a double-labeled process. The arrowhead indicates a neuronal process labeled for MAP2 but devoid of GLT-1 immunoreactivity. Note that an occasional neuronal process positive for GLT-1 immunoreactivity but negative for MAP2 immunoreactivity can also be found. Scale bar, 76 μm.
Evidence that neuronal GLT-1 is functional
Immunostaining does not give a clear picture of the density of functional transporters in neuronal or glial membranes. Because glutamate transport is electrogenic, it is possible to monitor the function of glutamate transporters using standard electrophysiological techniques (Brew and Attwell, 1987). To obtain a comparative estimate of the density of functional transporters in neurons and glia and to determine the potential contribution of GLT-1 to the glutamate transport, we recorded from neurons and glia voltage clamped at −70 mV. In the presence of competitive and noncompetitive glutamate receptor blockade, 100 μmd-aspartate elicited small inward currents in both neurons and glia. The currents were sensitive to substitution of lithium for extracellular sodium (n = 10 neurons and 6 glia; data not shown), indicating the currents were attributable to sodium-dependent glutamate transport. We used the GLT-1-selective inhibitor dihydrokainate (DHK) to assess the potential contribution of GLT-1 to transport currents. The amplitude of neuronal d-aspartate responses was occluded by 56 ± 6% (n = 7) in the presence of 500 μm DHK (Fig. 9). In contrast to neurons, glial d-aspartate currents were less sensitive to DHK, consistent with the low levels of GLT-1 expression and high levels of GLAST expression observed in microculture glia (Fig.9B). In neurons but not in glial cells, DHK applied alone resulted in a small inward current (−14.4 ± 3.8 pA;n = 7; data not shown) despite the presence of high concentrations of postsynaptic receptor antagonists. The nature of this current was not explored further.
Fig. 9.

DHK-sensitive d-aspartate currents in neurons and glia. A, A response of a neuron to 100 μmd-aspartate (d-Asp) applied for the duration indicated by the bars above thetraces. d-Aspartate was applied either alone (left) or with 500 μm DHK (right). Traces are averages of five interleaved responses in each condition and were filtered at 50 Hz. In the DHK condition, DHK was preapplied for 2 sec before and afterd-aspartate application. B, DHK (500 um) more strongly inhibited neuronald-aspartate (100 um) responses (filled bar) than glial d-aspartate responses (open bar; asterisk denotes p < 0.01, independent ttest, n = 7 neurons and 6 glia).
Glutamate transporters can also be functionally distinguished on the basis of a recently described anion permeability (Wadiche et al., 1995;Eliasof and Jahr, 1996). The rank order of anion permeability for the forebrain transporters is EAAT1 (GLAST) > EAAT3 (EAAC1) > EAAT2 (GLT-1) (Wadiche et al., 1995). As in the previous experiment, we first recorded from neurons and glia with gluconate as the main pipette anion and at a holding potential of −70 mV, near ECl. Under these conditions, the response recorded tod-aspartate applications should be nearly completely mediated by transport current rather than by anion current. The current density in glial cells filled with gluconate was nearly threefold larger than that in neurons (Fig. 10), suggesting a higher transport rate per transporter or a higher density of functional transporters in glia. We next substituted thiocyanate for gluconate in the pipette solution. Thiocyanate is the most permeant of the chaotropic anions through the transporter anion conductance (Eliasof and Jahr, 1996). With thiocyanate-filled cells, the difference between current density in glia and neurons became much more dramatic (Fig. 10), indicating that glial transporters have a much higher anion permeability than do neurons. These results are consistent with GLAST (EAAT1) being the predominant transporter in microculture glia and with EAAC1 (EAAT3) and GLT-1 (EAAT2) functioning predominantly in neurons. The results also make it unlikely that either EAAT4 or EAAT5, two recently cloned transporters from cerebellum and retina (Fairman et al., 1995; Arriza et al., 1997), contribute significantly to neuronal transport currents in hippocampal microcultures. These two transporters have a much larger anion conductance than do the forebrain transporters.
Fig. 10.

Anion permeability of glial and neuronal transporters. A, Membrane currents in a glial cell in response to 100 μmd-aspartate (d-Asp) applied for the duration indicated by the bars above thetraces. The cell was first filled with a gluconate-based whole-cell pipette solution. The pipette was gently removed and replaced with a whole-cell pipette containing thiocyanate substituted for gluconate. Membrane capacitance of the cell was 47 pF.B, The same protocol described in Aperformed on a microculture neuron. Membrane capacitance was 80 pF.C, D, A comparison of neuronal and gliald-aspartate current density measured in cells filled either with gluconate (C) or with thiocyanate (D). A two-way (cell type by pipette solution) ANOVA revealed a significant interaction between cell type and pipette solution (p < 0.001; n= 10 gluconate-filled glia and 5 thiocyanate-filled glia;n = 13 gluconate-filled neurons and 9 thiocyanate-filled neurons). Glial cells exhibited a larger current density than did neurons in both conditions (p < 0.01, Bonferroni-correctedt tests), but the difference was much larger with a thiocyanate-based pipette solution. Statistically significant differences between the current density obtained with different internal solutions were also detected in both cell types (p < 0.01, Bonferroni-correctedt tests). Not obvious from the bar graphsis the difference between neuronal current density with a gluconate pipette solution (0.13 ± 0.03 pA/pF) versus that with a thiocyanate pipette solution (0.30 ± 0.06 pA/pF).
At some glutamate synapses, including microculture synapses, transport inhibition can prolong the decay of EPSCs (Barbour et al., 1994;Mennerick and Zorumski, 1995; Otis et al., 1996). However, the molecular identity of the transporters responsible for these effects remains to be elucidated. To test for a role of GLT-1 in modulating the time course of synaptic glutamate, we examined decays of EACs mediated by AMPA receptors in single-neuron microcultures. We compared the effects of DHK, a selective blocker of GLT-1 (Pines et al., 1992;Arriza et al., 1994), with the effects of the broad-spectrum transporter substrate l-trans-pyrollidine dicarboxylic acid (PDC) (Arriza et al., 1994). The AMPA receptor potentiator cyclothiazide (CYZ; 10 μm) was included in bath solutions to enhance our ability to detect effects of glutamate uptake inhibition (Mennerick and Zorumski, 1995). At 500 μm, DHK had a consistently weaker effect on the decay of the EAC than did a low (50 μm) concentration of PDC (Fig.11A). In six cells, DHK increased EAC decay time constants by 21 ± 3%, whereas PDC increased the decay time constants by 47 ± 8%. Essentially identical results were obtained when the effects of as much as 1 mm DHK were compared with that of another broad-spectrum substrate inhibitor, threo-3-hydroxy aspartate (THA; 30 μm; Fig. 11B). Based on the experiments of Figure 11, we conclude that although neuronal and glial GLT-1 contribute measurably to glutamate transport during a synaptic event, GLT-1 is not the primary transporter involved.
Fig. 11.

DHK prolongs EACs, but less than broad-spectrum substrate inhibitors. A, Superimposedtraces showing the averages of responses from a solitary excitatory neuron in the absence of transport inhibition (Control) interleaved with responses obtained in the presence of 500 μm DHK and of 50 μmPDC. B, Experiment similar to that shown inA except that 1 mm DHK and 30 μm THA, another broad-spectrum transporter substrate, were used.
The effects of DHK on EACs in Figure 11 suggest that GLT-1 participates in limiting the lifetime of synaptically released glutamate, but these results do not address the question of whether neuronal GLT-1 specifically is capable of participating in the clearance of synaptic glutamate. Toward this end, we designed an experiment to examine neuronal GLT-1 contributions to the decay of the synaptic glutamate transient in the absence of glial transport. Previously, we have shown that microculture glia make a strong contribution to synaptic glutamate transport (Mennerick and Zorumski, 1994). This conclusion was based on the ability to record from and depolarize microculture glia during a synaptic event, thereby exploiting the voltage dependence of glutamate transport (Brew and Attwell, 1987) to slow the rate of glial transport. However, toward the goal of abolishing glial transport, this technique suffers from its dependence on a high degree of spatial voltage control over the glial cells, which may not be achieved in recordings from multiglial microcultures.
Therefore, to abolish glial glutamate transport in the present experiments, we killed microculture glia using a sharp glass pipette to stab glial nuclear and cytoplasmic regions repeatedly before recording from an overlying excitatory neuron. This treatment resulted in the immediate swelling of glial nuclei, blebbing of the glial plasma membrane, and retraction of the glial membrane from the edges of the microculture. Glia stabbed in the presence of trypan blue showed immediate accumulation of the dye into the nucleus, indicating that the cell membrane was effectively rendered nonviable (e.g., Fig.12B,C). Similarly, stabs performed during a whole-cell, current-clamp recording from the stabbed cell resulted in the immediate abolishment of the membrane potential (−61.4 ± 5.2 to 0.7 ± 5.9 mV;n = 3). For reasons that are unclear, the baseline glial resting potential was more positive than that observed in glia in more intact preparations (Bergles and Jahr, 1997; Clark and Barbour, 1997). However, the experiment indicates that the stabbing procedure effectively abolished the ion gradients necessary to drive glutamate transport.
Fig. 12.

DHK prolongs EPSCs in the absence of viable glial cells. A, Left, Tracesshowing averages of interleaved EACs in the absence (Control) or presence of 500 μm DHK. Mechanical stab wounds with a sharp glass pipette had rendered underlying glia nonviable (see B, C).Right, The best-fit time constants of 13 interleaved responses in each condition; filled bar, control; open bar, DHK (*p < 0.01, unpaired two-tailedt test; data from the same cell shown on theleft). B, C, Phase contrast (B) and bright-field (C) photomicrographs of the microculture from which the traces in A were recorded. Immediately after the experiment in A, 0.1% trypan blue was added to the culture dish for 10 min. The arrow inC indicates a trypan-positive glial nucleus. Two other trypan-positive glial nuclei are also visible. After photography was completed, the microculture was stabbed again repeatedly, and trypan blue was added a second time to the dish. No other trypan-positive nuclei were observed after the second insult, indicating that no other viable glia were present in this microculture (data not shown). Thearrowhead indicates the remnants of the soma of the recorded neuron, primarily destroyed after removing the whole-cell recording pipette. Scale bar: B, C, 32 μm. D, E, Phase-contrast (D) and bright-field (E) photomicrographs of another microculture not used for experiments but in the same dish as that represented in A–C. Note the absence of trypan-positive nuclei. Scale bar: D,E, 32 μm.
Recordings from solitary excitatory neurons were performed 5–10 min after stabbing underlying glia, again in the presence of 10 μm CYZ to enhance our ability to detect residual glutamate. Under these conditions, DHK application resulted in a statistically significant prolongation of EAC decays (Fig. 12). Mean time constants in eight neurons changed from 17.4 ± 3.4 to 20.3 ± 4.8 msec (p < 0.05, paired one-tailed t test). Immediately after the experiment, trypan blue was added to the culture dish to assess cell viability. In all eight cases, all underlying glia were compromised by the stabbing procedure (e.g., Fig. 12B,C). Unstabbed glia from the same dish exhibited no trypan-positive nuclei (Fig. 12D,E), indicating that trypan staining was specific to nonviable cells.
In five of the above eight cases, THA was also applied to cells in which DHK was tested. Application of a moderate concentration of THA had a smaller effect than did DHK (15 ± 5% prolongation with 500 μm DHK; 6 ± 3% prolongation with 50 μm THA), in contrast to the results obtained in Figure11. Importantly, these results suggest that DHK prolongs synaptic currents via a strong effect on GLT-1 rather than via a weak effect on another transporter. The diminished THA effects after killing glia are also consistent with a strong contribution of glial uptake during evoked synaptic events in intact microcultures (Mennerick and Zorumski, 1994). In conclusion, these experiments demonstrate that neuronal GLT-1 is functional and capable of participating in the clearance of synaptic glutamate.
DISCUSSION
The present results represent evidence that brain neurons can express the glutamate transporter protein GLT-1 (EAAT2) (Pines et al., 1992; Arriza et al., 1994). GLT-1 was localized primarily to the dendrites of presumed excitatory neurons in microcultures and conventional mass cultures of postnatal hippocampal cells. Although there is evidence of expression of GLT-1 protein in certain classes of retinal photoreceptors and bipolar cells (Grunert et al., 1994; Rauen and Kanner, 1994), GLT-1 mRNA, but not protein, has been detected in synaptically mature hippocampal neurons (Schmitt et al., 1996; Torp et al., 1997). Interestingly, a recent genetic knock-out of GLT-1 in mice revealed a drastic diminution of synaptosomal transport, suggesting the possibility of neuronal expression of GLT-1 (Tanaka et al., 1997). Although glial contamination of synaptosomes cannot be excluded, another very recent paper described detectable levels of GLT-1 expression in glial-poor cultures of cortical neurons and a large contribution of DHK-sensitive transport to neuronal glutamate uptake (Wang et al., 1998).
There are several possible reasons for the detection of neuronal GLT-1 protein in the present study compared with previous studies (Danbolt et al., 1992; Levy et al., 1993; Rothstein et al., 1994; Chaudhry et al., 1995; Lehre et al., 1995; Schmitt et al., 1996). First, the failure to detect neuronal GLT-1 in light and electron microscopic studies on intact brain tissue does not exclude neuronal expression of GLT-1. The detection failure only implies that the highest GLT-1 concentrations are found in brain astrocytes in situ. The GLT-1 concentration in brain tissue is extremely high, with GLT-1 representing as much as 1% of brain membrane protein (Danbolt et al., 1990). Therefore, it is possible that in situ comparatively low levels of neuronal GLT-1 protein, although perhaps functionally significant, have gone unappreciated. Extremely high levels of astrocyte expression of GLT-1 may have prompted use of antibody concentrations below those that would reveal significant neuronal labeling. Therefore, the low levels of GLT-1 expression in cultured astrocytes may have helped facilitate our detection of neuronal GLT-1.
Second, because previous electron microscopy has not revealed neuronal labeling in situ, it is also possible that neuronal GLT-1 expression is a reflection of the ex vivo environment of the cultured cells. Thus, GLT-1 expression in brain neurons may be suppressed by novel regulatory mechanisms. This possibility was originally suggested after detection of GLT-1 mRNA in certain neuronal populations (Schmitt et al., 1996; Torp et al., 1997). This idea has not previously gained support because of the failure to detect neuronal GLT-1 protein. The findings presented here are therefore important as the first demonstration that under appropriate conditions, brain neurons express functional GLT-1 protein. Consequently, when biochemical studies of human pathological tissue or of mammalian cell cultures are interpreted, it should not be assumed that GLT-1 protein is always glial. The findings presented here suggest the cellular localization may change under certain conditions.
Third, the possibility exists that the neuronal expression of GLT-1 in our cultures could be a reflection of the immature state of the neurons used. This seems unlikely because the levels of GLT-1 are undetectable at birth and gradually increase in the first 2 weeks after birth (Ullensvang et al., 1997).
The present results suggest that neuronal GLT-1 protein is expressed primarily, if not exclusively, in non-GABAergic microculture cells. Because glutamatergic cells comprise the other major transmitter phenotype in postnatal hippocampal microcultures (Segal and Furshpan, 1990; Bekkers and Stevens, 1991; Mennerick et al., 1995), we conclude that neuronal GLT-1 expression is limited to excitatory cells. These results are consistent with in situ hybridization studies of brain, in which neuronal GLT-1 mRNA is found primarily in the principal neurons of the hippocampus, especially CA3 pyramidal cells (Schmitt et al., 1996; Torp et al., 1997). Although the reasons for the selective expression in excitatory neurons are unclear, principal cells of the hippocampus are highly susceptible to cell death in many models of glutamate excitotoxicity (Choi, 1994). It is possible that selective expression of GLT-1 and other glutamate transporters in these glutamatergic cells helps maintain low ambient glutamate concentrations in the microenvironment of the cells, thereby protecting against glutamate excitotoxicity.
At the subcellular level, antibody localization studies have usually found neuronal transporters at the postsynaptic side of the synaptic cleft but not at the presynaptic side (Rothstein et al., 1994; Yamada et al., 1996). Notable exceptions to these studies are several studies that have found GLT-1 immunoreactivity in certain photoreceptors and bipolar cells of the mammalian retina. In these studies, immunoreactivity is found throughout the cells, apparently including the presynaptic terminals (Grunert et al., 1994; Rauen and Kanner, 1994). Despite this precedent for a presynaptic localization of GLT-1 in retina, our MAP2 colocalization experiments suggest that in excitatory hippocampal cells, GLT-1 is primarily a postsynaptic transporter.
Interestingly, neuronal GLT-1 can apparently participate in the clearance of synaptically released glutamate. However, the effects are weak compared with the pharmacological blockade of neuronal and glial transporters with broad-spectrum substrates such as PDC. Our previous results suggest that glial cells are strong contributors to synaptic glutamate uptake in microcultures (Mennerick and Zorumski, 1994). Based on the pharmacological and immunohistochemical evidence in the present study, it is likely that these effects are mediated predominantly by GLAST.
In summary, we have presented evidence that functional GLT-1 glutamate transporter protein can be expressed in brain neurons. The expression of GLT-1 in cultured neurons is specific to excitatory cells and is specifically localized to the processes of these cells. The results make it more likely that GLT-1 may be expressed by hippocampal neuronsin situ and that certain environmental conditions may alter the expression of neuronal GLT-1 protein.
Footnotes
This work was supported by National Institutes of Health Grants MH-00964 and MH-45493 and a grant from the Bantly Foundation (C.F.Z.). S.M. was supported by a fellowship from the McDonnell Center for Cellular and Molecular Neurobiology and a Lucille P. Markey postdoctoral fellowship. We thank Drs. John Olney and Nuri Farber (Washington University) for help with image processing.
Correspondence should be addressed to Dr. Steven Mennerick, Department of Psychiatry, Washington University School of Medicine, 4940 Children’s Place, St. Louis, MO 63110
REFERENCES
- 1.Arriza JL, Fairman WA, Wadiche JI, Murdoch GH, Kavanaugh MP, Amara SG. Functional comparisons of three glutamate transporter subtypes cloned from human motor cortex. J Neurosci. 1994;14:5559–5569. doi: 10.1523/JNEUROSCI.14-09-05559.1994. [DOI] [PMC free article] [PubMed] [Google Scholar]
- 2.Arriza JL, Eliasof S, Kavanaugh MP, Amara SG. Excitatory amino acid transporter 5, a retinal glutamate transporter coupled to a chloride conductance. Proc Natl Acad Sci USA. 1997;94:4155–4160. doi: 10.1073/pnas.94.8.4155. [DOI] [PMC free article] [PubMed] [Google Scholar]
- 3.Barbour B, Keller BU, Llano I, Marty A. Prolonged presence of glutamate during excitatory synaptic transmission to cerebellar Purkinje cells. Neuron. 1994;12:1331–1343. doi: 10.1016/0896-6273(94)90448-0. [DOI] [PubMed] [Google Scholar]
- 4.Bekkers JM, Stevens CF. Excitatory and inhibitory autaptic currents in isolated hippocampal neurons maintained in cell culture. Proc Natl Acad Sci USA. 1991;88:7834–7838. doi: 10.1073/pnas.88.17.7834. [DOI] [PMC free article] [PubMed] [Google Scholar]
- 5.Bergles DE, Jahr CE. Synaptic activation of glutamate transporters in hippocampal astrocytes. Neuron. 1997;19:1297–1308. doi: 10.1016/s0896-6273(00)80420-1. [DOI] [PubMed] [Google Scholar]
- 6.Brew H, Attwell D. Electrogenic glutamate uptake is a major current carrier in the membrane of axolotl retinal glial cells. Nature. 1987;327:707–709. doi: 10.1038/327707a0. [DOI] [PubMed] [Google Scholar]
- 7.Caceres A, Banker GA, Binder L. Immunocytochemical localization of tubulin and microtubule-associated protein 2 during the development of hippocampal neurons in culture. J Neurosci. 1986;6:714–722. doi: 10.1523/JNEUROSCI.06-03-00714.1986. [DOI] [PMC free article] [PubMed] [Google Scholar]
- 8.Chaudhry FA, Lehre KP, van Lookeren Campagne M, Ottersen OP, Danbolt NC, Storm-Mathisen J. Glutamate transporters in glial plasma membranes: highly differentiated localizations revealed by quantitative ultrastructural immunocytochemistry. Neuron. 1995;15:711–720. doi: 10.1016/0896-6273(95)90158-2. [DOI] [PubMed] [Google Scholar]
- 9.Choi DW. Glutamate receptors and the induction of excitotoxic neuronal death. Prog Brain Res. 1994;100:47–51. doi: 10.1016/s0079-6123(08)60767-0. [DOI] [PubMed] [Google Scholar]
- 10.Clark BA, Barbour B. Currents evoked in Bergmann glial cells by parallel fibre stimulation in rat cerebellar slices. J Physiol (Lond) 1997;502:335–350. doi: 10.1111/j.1469-7793.1997.335bk.x. [DOI] [PMC free article] [PubMed] [Google Scholar]
- 11.Danbolt NC, Pines G, Kanner BI. Purification and reconstitution of the sodium- and potassium-coupled glutamate transport glycoprotein from rat brain. Biochemistry. 1990;29:6734–6740. doi: 10.1021/bi00480a025. [DOI] [PubMed] [Google Scholar]
- 12.Danbolt NC, Storm-Mathisen J, Kanner BI. An [Na+ + K+] coupled l-glutamate transporter purified from rat brain is located in glial cell processes. Neuroscience. 1992;51:295–310. doi: 10.1016/0306-4522(92)90316-t. [DOI] [PubMed] [Google Scholar]
- 13.Eliasof S, Jahr CE. Retinal glial cell glutamate transporter is coupled to an anionic conductance. Proc Natl Acad Sci USA. 1996;93:4153–4158. doi: 10.1073/pnas.93.9.4153. [DOI] [PMC free article] [PubMed] [Google Scholar]
- 14.Fairman WA, Vandenberg RJ, Arriza JL, Kavanaugh MP, Amara SG. An excitatory amino-acid transporter with properties of a ligand-gated chloride channel. Nature. 1995;375:599–603. doi: 10.1038/375599a0. [DOI] [PubMed] [Google Scholar]
- 15.Furuta A, Rothstein JD, Martin LJ. Glutamate transporter protein subtypes are expressed differentially during rat CNS development. J Neurosci. 1997;17:8363–8375. doi: 10.1523/JNEUROSCI.17-21-08363.1997. [DOI] [PMC free article] [PubMed] [Google Scholar]
- 16.Grunert U, Martin PR, Wassle H. Immunocytochemical analysis of bipolar cells in the macaque monkey retina. J Comp Neurol. 1994;348:607–627. doi: 10.1002/cne.903480410. [DOI] [PubMed] [Google Scholar]
- 17.Gundersen V, Danbolt NC, Ottersen OP, Storm-Mathisen J. Demonstration of glutamate/aspartate uptake activity in nerve endings by use of antibodies recognizing exogenous d-aspartate. Neuroscience. 1993;57:97–111. doi: 10.1016/0306-4522(93)90114-u. [DOI] [PubMed] [Google Scholar]
- 18.Kondo K, Hashimoto H, Kitanaka J-I, Sawada M, Suzumura A, Marunouchi T, Baba A. Expression of glutamate transporters in cultured glial cells. Neurosci Lett. 1995;188:140–142. doi: 10.1016/0304-3940(95)11408-o. [DOI] [PubMed] [Google Scholar]
- 19.Lehre KP, Levy LM, Ottersen OP, Storm-Mathisen J, Danbolt NC. Differential expression of two glial glutamate transporters in the rat brain: quantitative and immunocytochemical observations. J Neurosci. 1995;15:1835–1853. doi: 10.1523/JNEUROSCI.15-03-01835.1995. [DOI] [PMC free article] [PubMed] [Google Scholar]
- 20.Levy LM, Lehre KP, Rolstad B, Danbolt NC. A monoclonal antibody raised against an [Na+ + K+] coupled l-glutamate transporter purified from rat brain confirms glial cell localization. FEBS Lett. 1993;317:79–84. doi: 10.1016/0014-5793(93)81495-l. [DOI] [PubMed] [Google Scholar]
- 21.Martin LJ, Brambrink AM, Lehmann C, Porteracailliau C, Koehler R, Rothstein JD, Traystman RJ. Hypoxia-ischemia causes abnormalities in glutamate transporters and death of astroglia and neurons in newborn striatum. Ann Neurol. 1997;42:335–348. doi: 10.1002/ana.410420310. [DOI] [PubMed] [Google Scholar]
- 22.Mennerick S, Zorumski CF. Glial contributions to excitatory neurotransmission in cultured hippocampal cells. Nature. 1994;368:59–62. doi: 10.1038/368059a0. [DOI] [PubMed] [Google Scholar]
- 23.Mennerick S, Zorumski CF. Presynaptic influence on the time course of fast excitatory synaptic currents in cultured hippocampal cells. J Neurosci. 1995;15:3178–3192. doi: 10.1523/JNEUROSCI.15-04-03178.1995. [DOI] [PMC free article] [PubMed] [Google Scholar]
- 24.Mennerick S, Que J, Benz A, Zorumski CF. Passive and synaptic properties of neurons grown in microcultures and in mass cultures. J Neurophysiol. 1995;73:320–332. doi: 10.1152/jn.1995.73.1.320. [DOI] [PubMed] [Google Scholar]
- 25.Otis TS, Wu Y-C, Trussell LO. Delayed clearance of transmitter and the role of glutamate transporters at synapses with multiple release sites. J Neurosci. 1996;16:1634–1644. doi: 10.1523/JNEUROSCI.16-05-01634.1996. [DOI] [PMC free article] [PubMed] [Google Scholar]
- 26.Otis TS, Kavanaugh MP, Jahr CE. Postsynaptic glutamate transport at the climbing fiber–Purkinje cell synapse. Science. 1997;277:1515–1518. doi: 10.1126/science.277.5331.1515. [DOI] [PubMed] [Google Scholar]
- 27.Pines G, Danbolt NC, Bjørås M, Zhang Y, Bendahan A, Eide L, Koepsell H, Storm-Mathisen J, Seeberg E, Kanner BI. Cloning and expression of a rat brain l-glutamate transporter. Nature. 1992;360:464–467. doi: 10.1038/360464a0. [DOI] [PubMed] [Google Scholar]
- 28.Rauen T, Kanner BI. Localization of the glutamate transporter Glt-1 in rat and macaque monkey retinae. Neurosci Lett. 1994;169:137–140. doi: 10.1016/0304-3940(94)90375-1. [DOI] [PubMed] [Google Scholar]
- 29.Rothstein JD. Knockout of glutamate transporters reveals a major role for astroglial transport in excitotoxicity and clearance of glutamate. Neuron. 1996a;16:675–686. doi: 10.1016/s0896-6273(00)80086-0. [DOI] [PubMed] [Google Scholar]
- 30.Rothstein JD. Therapeutic horizons for amyotrophic lateral sclerosis. Curr Opin Neurobiol. 1996b;6:679–687. doi: 10.1016/s0959-4388(96)80103-6. [DOI] [PubMed] [Google Scholar]
- 31.Rothstein JD, Martin L, Levey AI, Dykes-Hoberg M, Jin L, Wu D, Nash N, Kuncl RW. Localization of neuronal and glial glutamate transporters. Neuron. 1994;13:713–725. doi: 10.1016/0896-6273(94)90038-8. [DOI] [PubMed] [Google Scholar]
- 32.Schmitt A, Asan E, Puschel B, Jons T, Kugler P. Expression of the glutamate transporter GLT1 in neural cells of the rat central nervous system: non-radioactive in situ hybridization and comparative immunocytochemistry. Neuroscience. 1996;71:989–1004. doi: 10.1016/0306-4522(95)00477-7. [DOI] [PubMed] [Google Scholar]
- 33.Segal MM, Furshpan EJ. Epileptiform activity in microcultures containing small numbers of hippocampal neurons. J Neurophysiol. 1990;64:1390–1399. doi: 10.1152/jn.1990.64.5.1390. [DOI] [PubMed] [Google Scholar]
- 34.Shibata T, Watanabe M, Tanaka K, Wada K, Inoue Y. Dynamic changes in expression of glutamate transporter mRNAs in developing brain. NeuroReport. 1996;7:705–709. doi: 10.1097/00001756-199602290-00006. [DOI] [PubMed] [Google Scholar]
- 35.Swanson RA, Miller JW, Rothstein JD, Farrell K, Stein BA, Longuemare MC. Neuronal regulation of glutamate transporter subtype expression in astrocytes. J Neurosci. 1997;17:932–940. doi: 10.1523/JNEUROSCI.17-03-00932.1997. [DOI] [PMC free article] [PubMed] [Google Scholar]
- 36.Tanaka K, Watase K, Manabe T, Yamada K, Watanabe M, Takahashi K, Iwama H, Nishikawa T, Ichihara N, Kikuchi T, Okuyama S, Kawashima N, Hori S, Takimoto M, Wada K. Epilepsy and exacerbation of brain injury in mice lacking the glutamate transporter GLT-1. Science. 1997;276:1699–1702. doi: 10.1126/science.276.5319.1699. [DOI] [PubMed] [Google Scholar]
- 37.Tong G, Jahr CE. Block of glutamate transporters potentiates postsynaptic excitation. Neuron. 1994;13:1195–1203. doi: 10.1016/0896-6273(94)90057-4. [DOI] [PubMed] [Google Scholar]
- 38.Torp R, Hoover F, Danbolt NC, StormMathisen J, Ottersen OP. Differential distribution of the glutamate transporters GLT1 and rEAAC1 in rat cerebral cortex and thalamus: an in situ hybridization analysis. Anat Embryol (Berl) 1997;195:317–326. doi: 10.1007/s004290050051. [DOI] [PubMed] [Google Scholar]
- 39.Ullensvang K, Lehre KP, StormMathisen J, Danbolt NC. Differential developmental expression of the two rat brain glutamate transporter proteins GLAST and GLT. Eur J Neurosci. 1997;9:1646–1655. doi: 10.1111/j.1460-9568.1997.tb01522.x. [DOI] [PubMed] [Google Scholar]
- 40.Wadiche JI, Amara SG, Kavanaugh MP. Ion fluxes associated with excitatory amino acid transport. Neuron. 1995;15:721–728. doi: 10.1016/0896-6273(95)90159-0. [DOI] [PubMed] [Google Scholar]
- 41.Wang GJ, Chung HJ, Schnuer J, Pratt K, Zable AC, Kavanaugh MP, Rosenberg PA. High affinity glutamate transport in rat cortical neurons in culture. Mol Pharmacol. 1998;53:88–96. doi: 10.1124/mol.53.1.88. [DOI] [PubMed] [Google Scholar]
- 42.Yamada K, Watanabe M, Shibata T, Tanaka K, Wada K, Inoue Y. EAAT4 is a post-synaptic glutamate transporter at Purkinje cell synapses. NeuroReport. 1996;7:2013–2017. doi: 10.1097/00001756-199608120-00032. [DOI] [PubMed] [Google Scholar]