

Abstract
The distribution of synapses formed by corticostriatal neurons was measured to determine the average connectivity and degree of convergence of these neurons and to search for spatial inhomogeneities. Two kinds of axonal fields, focal and extended, and two striatal tissue compartments, the patch (striosome) and matrix, were analyzed separately. Electron microscopic examination revealed that both kinds of corticostriatal axons made synapses at varicosities that could be identified in the light microscope, and each varicosity made a single synapse. Thus, the distribution of varicosities was a good estimate of the spatial distribution of synapses. The distance between axonal varicosities was measured to determine the density of synaptic connections formed by one axon within the volume occupied by a striatal neuron. Intersynaptic distances were distributed exponentially, except that synapses were rarely located <4 μm apart. The mean distance between synapses was ∼10 μm, so axons made a maximum of 40 synapses within the dendritic volume of a spiny neuron. There are ∼2840 spiny neurons located within the volume of the dendrites of one spiny cell (Oorschot, 1996), so each axon must contact ≤1.4% of all cells in its axonal arborization. Within the same volume there are ∼30.5 million asymmetric synapses (Ingham et al., 1996), approximately half of which are cortical in origin. Thus, ∼380,000 cortical axons innervate the volume of the dendritic tree of one spiny cell. Striatal neurons with totally overlapping dendritic volumes have few presynaptic cortical axons in common, and cortical cells with overlapping axons have few striatal target neurons in common. These results explain the absence of redundancy in the responses of neurons located near each other in the striatum.
Keywords: cerebral cortex, neostriatum, synapse, axonal arborization, neuronal connectivity, convergence, divergence
Since the pioneering work of Webster (1961), cortical afferents to the neostriatum have been known to maintain an orderly spatial map of the cortex within the three dimensional structure of the neostriatum. Although early studies of the nature of the corticostriatal projection suggested that it was a continuous one in which near neighbors in the cortex are connected to near neighbors in the neostriatum (Kemp and Powell, 1970), more recent findings have shown it to be essentially discontinuous (Selemon and Goldman-Rakic, 1985; Malach and Graybiel, 1986). The discontinuities are most clearly shown in axonal tracing studies from physiologically characterized cortical regions performed by Flaherty and Graybiel (1991, 1993a) and Parthasarathy et al. (1992). These experiments show that individual locations in the cortex give rise to multiple separate foci of innervation in the neostriatum and that axons from functionally related cortical regions (e.g., the finger area of primary motor and somatosensory cortex) share common focal innervation zones. Subsequent studies of the arborization patterns of single corticostriatal cells have shown that many of these make multiple focal axonal arborizations in the neostriatum, corresponding in both size and number to the foci seen in the population axonal tracing studies (Cowan and Wilson, 1994;Levesque et al., 1996). Thus, this arrangement probably does not represent a separation of projections from adjacent cortical neurons but, rather, a replication of the entire output of a single cortical region to several different places in the neostriatum. Moreover,Flaherty and Graybiel (1994) have shown that the output from these separate neostriatal representations of a single cortical region may reconverge in the globus pallidus. It has been suggested that the discontinuous nature of the corticostriatal mapping is suited for a discrete combinatorial function in which cortical output is separated at the striatal level to allow for the independent interactions of cortical inputs within each focus (Brown, 1992; Graybiel et al., 1994).
According to this idea, the functional unit of computation in the neostriatum is the set of neurons located in a 200- to 500-μm-diameter cluster (striosome or matrisome) receiving a common set of converging corticostriatal inputs. The internal organization of such clusters has not yet been determined. The most simple interpretation is that all the neostriatal cells in a single cluster are interchangeable, all of which redundantly represent a particular combination of inputs determined by the convergence of inputs that is specific for that focus. This view is supported by the finding that cells responding to movement of single body parts are located in similar clusters (Alexander and DeLong, 1985a,b). Alternatively, there may be a spatial fine structure in which some important functional parameter (e.g., direction of motion) is mapped spatially within the cluster. Finally, each cluster may contain a mixture of functionally related but unique input combinations in no particular spatial order.
These different functional models for the internal details of the striatal cell clusters predict different structural arrangements for axons arborizing within the clusters. For example, the interchangeability of neostriatal cells in the first interpretation could only be strictly true if every cortical axon innervating the focus made synaptic connections with all the neostriatal neurons within the focus. The second and third interpretations (a microtopography within the arborizations or a mixture of functionally unique combinations) would both require the opposite. For these, individual axons should not connect with a large proportion of cells within the focal arborization. The difference between these two latter interpretations depends on the presence or absence of a spatial inhomogeneity of synaptic connectivity within the arborizations of single axons. In the experiments described here, the spacing of synapses along individual corticostriatal axons was used to probe for spatial inhomogeneities within the axonal arborizations to determine the average number of synapses formed within a dendritic tree of a single striatal neuron and the average amount of input sharing that may occur among nearby neostriatal neurons.
MATERIALS AND METHODS
Axonal arborizations in the neostriatum of rats were stained by intracellular injection of biocytin during intracellular recording of identified corticostriatal neurons of the medial agranular field or by small extracellular injection of biotinylated dextran amine (BDA) in the cingulate, medial agranular cortex, or lateral agranular cortex. When extracellular injections were used, tissue sections were counterstained with calbindin to reveal the calbindin-poor patch (striosome) and calbindin-rich matrix compartments of the neostriatum, and sections were prepared so that they could be used for both light and electron microscopy. Intracellularly stained axons were used for light microscopy only. Estimates of synaptic density were obtained by measuring the spacing between adjacent boutons along individual stained axons. To determine whether these boutons actually represent synapses and whether synapses occur specifically at boutons, the axonal diameters at synaptic and nonsynaptic regions of corticostriatal axons were compared using electron microscopy.
BDA injections. For extracellular tracing, injections of BDA (Molecular Probes, Eugene, OR) were made into the cingulate, medial agranular cortex, or lateral agranular cortex of adult Sprague Dawley rats. Animals were anesthetized intraperitoneally with a mixture of 100 mg/kg ketamine and 20 mg/kg xylazine. A glass micropipette with a tip diameter of 20–40 μm was filled with a solution of 5% BDA in isotonic saline buffered with 0.01 m phosphate buffer, pH 7.4, and placed in the cerebral cortex 1.0–2.0 mm from the surface. The details of injection sites and the macroscopic pattern of axonal arborizations from these injections have been described previously (Kincaid and Wilson, 1996). BDA was ejected using 5 μA current pulses lasting 7 sec and presented every 17 sec for 10–30 min. After a recovery time of 7–12 d to allow for transport of BDA throughout the corticostriatal fibers, the animals were again anesthetized and perfused with 150 ml of isotonic buffered saline followed by 400 ml of a solution of 4% formaldehyde in 0.1 m phosphate buffer. The brains were fixed overnight in the fixative solution and cut in the coronal plane on a vibratome at a thickness of 50 μm. For visualization of BDA, tissue sections were incubated in ABC (1:200; Vector Laboratories, Burlingame, CA) containing 0.2% Triton X-100 for 2 hr, washed in buffered saline, and reacted for 10–20 min in a solution of 0.05% diaminobenzidine, 0.003% hydrogen peroxide, and 0.12% nickel chloride in buffered isotonic saline. The sections were washed thoroughly and incubated in mouse anti-calbindin antibody (1:000; Sigma, St. Louis, MO) with 0.2% Triton X-100 overnight at 4°C. They were then washed thoroughly, treated with biotinylated anti-mouse secondary antibody (1:200; Vector) for 2 hr, and treated again as described above, except for the omission of nickel chloride. The reaction time of this step was shortened to yield a light-brown reaction product in the matrix compartment of the striatum.
Intracellular staining. Corticostriatal neurons were identified in the cortex of adult male Long–Evans rats anesthetized with urethane (1.5 gm/kg) supplemented hourly with a combination of ketamine (30 mg/kg) and xylazine (6 mg/kg, i.m.). Neurons projecting to the neostriatum were impaled using micropipettes containing 4% biocytin in 1 m potassium acetate and identified by antidromic activation from the contralateral neostriatum or the ipsilateral cerebral peduncle. Biocytin was ejected by passing 0.5–1.0 nA current pulses, 300 msec in duration, applied every 600 msec for 15–45 min. At the end of the experiment, animals were perfused intracardially with a fixative containing 4% formaldehyde and 0.1% glutaraldehyde and treated as described above for animals given extracellular BDA injections. Two of the axons analyzed in the study were originally collected in the course of another experiment, as described by Cowan and Wilson (1994). A third axon was also analyzed. This cell was selected because it exhibited the focal pattern but was verified as arborizing exclusively in the matrix using calbindin counterstaining. After drying onto slides, sections prepared for light microscopy shrank 28–44% in thickness, as measured using the focal plane method in the microscope. All measurements were corrected in that dimension using the measured degree of shrinkage, whereas shrinkage in the other dimensions was negligible and was not corrected. Tissue prepared for electron microscopy (see below) showed no measurable shrinkage in any dimension, and no corrections were made. Measurements of the distances between boutons were made using a 100× oil immersion objective (numerical aperture, 1.4), and boutons were plotted in three dimensions using a computer-aided microscope and a video camera. The three-dimensional distances between adjacent boutons were measured automatically using the coordinates for the boutons (without regard to the path of the axon between boutons).
Transmission and high-voltage electron microscopy for measurement of axonal diameters. Neurons used for high-voltage electron microscopy (HVEM) and conventional electron microscopic analysis were collected as described above, except for the addition of 0.1% glutaraldehyde to the fixative and the exclusion of Triton X-100 from all solutions. After processing, the sections were post-fixed in a solution of 0.25% osmium tetroxide in 0.15 m phosphate buffer, infiltrated with epoxy resin, and embedded between slides and coverslips coated with liquid releasing agent (Polysciences, Warrington, PA). Areas selected for electron microscopic study were removed from their mounts and glued to blocks for resectioning on an ultramicrotome. For HVEM study, thick sections (2–5 μm) were cut using a dry glass knife, collected on uncoated sandwich grids, and examined at 1000 kV using the high-voltage electron microscope at the University of Colorado (Boulder, CO). Methods for HVEM preparation have been described in detail elsewhere (Wilson, 1994). Ultrathin sections for conventional electron microscopy were cut with a diamond knife and examined at 80 kV on a JEOL 200EX microscope. Because the calbindin antiserum did not fully penetrate the vibratome sections, the selection of tissue from patch or matrix compartments could be made in the light microscope, but thin sections were collected from regions located deeper within the section where the calbindin labeling was not present. This prevented any ambiguity between the labeling of corticostriatal axons and axons of the striatal spiny neurons positive for calbindin. In addition, all axons used for these experiments were positively identified as profiles of corticostriatal axons seen in the light microscopic examination of the same specimen. Diameters of profiles in the electron microscope were measured by digitizing the images, drawing the outlines of their profiles using NIH Image software, and measuring the short and long (perpendicular) diameters through the centroid of the profile using that software.
Connectivity calculations. Connectivity calculations were made using the binomial theorem. The approach was similar to that described by Abeles (1991). To determine the number of axons making 0,1, … k synapses on spiny neurons, the probability of making a synapse on a particular cell was taken as the reciprocal of the number of candidate cells in the volume. Thus, the probability of making k synapses with n synapses per axon was given as:
where p is 1/number of candidate cells, andn is the number of synapses per axon. The number of axons in each category was calculated by multiplying the probability obtained in this way by the number of candidate axons innervating the volume.
A similar approach was used to determine the probability of shared input to single cells and the probability of two cortical axons converging on k spiny neurons. To determine the number of cortical inputs held in common by two spiny cells, the probability of a synaptic contact by a given axon was taken as the square of the quotient of cortical synapses per cell and the number of candidate cortical axons. The likelihood of two spiny neurons receiving 0,1,2, … k axons in common was calculated as above, using the probability of a contact on both cells from a single axon asp and the number of candidate axons as n. To determine the number of spiny cells jointly innervated by any pair of cortical axons, the probability of sharing any one target neuron was calculated as the square of the probability of either axon innervating the cell (as described above). The likelihood of two axons jointly innervating 0,1,2, … k spiny neurons was calculated as above, using this probability for p and the number of candidate striatal cells in the volume as n.
RESULTS
As described previously (Wilson, 1987; Cowan and Wilson, 1994), corticostriatal axonal arborizations arose either as collaterals of descending axons in the internal capsule fascicles or as arborizations of axons that did not join the internal capsule but terminated within the neostriatum. In addition to this difference in axons of origin, the cells formed one of two different kinds of arborizations. Some corticostriatal axons formed one to four small arborizations, ∼0.5 mm in diameter, usually separated by >0.5 mm. These arborizations, which will be called focal, often arose from collaterals of descending axons. The other form of axonal arborization was a single large and sparse axonal arborization, usually ≥1 mm in diameter, which will be called the extended type (Kincaid and Wilson, 1996). In all cases, the intrastriatal axons were extremely fine but showed varicosities that were easily identified in the light microscope. These varicosities were not present along the axonal trajectory through the white matter or internal capsule fascicles. Although they were easily identified in the light microscope, they were too small to measure accurately using that instrument. This was evident because their apparent diameter was <1 μm, and the diameter of intervaricose segments appeared to be <0.5 μm. For comparison with identified synaptic regions in thin sections, it was desirable to have more accurate images of the diameters of the varicosities and intervaricose segments as seen in the light microscope (LM). For this purpose, images were taken using HVEM of thick (3–5 μm) sections stained as for light microscopy. Examples showing the appearance of axonal varicosities in the LM and the HVEM are shown in Figure 1. The varicosities varied from 0.2 to 1.0 μm in diameter when measured using HVEM, whereas the intervaricose segments were ∼0.1 μm in diameter. Varicosities were more apparent in the HVEM images than in the LM. The intervaricose segments appeared to be of larger diameter in the LM because of filtration by its point spread function. For the same reason, measurements of varicosity diameter in the LM were also inaccurate, but comparison of the LM and HVEM images of the same axons showed that the location of the varicosities could reliably be determined. In thin sections cut from the same animals, biocytin-labeled axons were photographed and measured using conventional electron microscopy. A sample of 56 axonal profiles with an evident synapse and 95 profiles with no evident synapse was measured. In addition, two axons were reconstructed in serial thin sections through at least one synaptic site, allowing repeated measurements of the same axons at synaptic and nonsynaptic regions. The results of this analysis are shown in Figure1. Together, these data confirm that the axonal varicosities seen in the LM and HVEM correspond to synaptic sites seen by electron microscopy of thin sections. Furthermore, each axonal varicosity examined formed a single synapse, indicating that bouton counts within the axonal arborization are a good estimate of the total number of synapses.
Fig. 1.
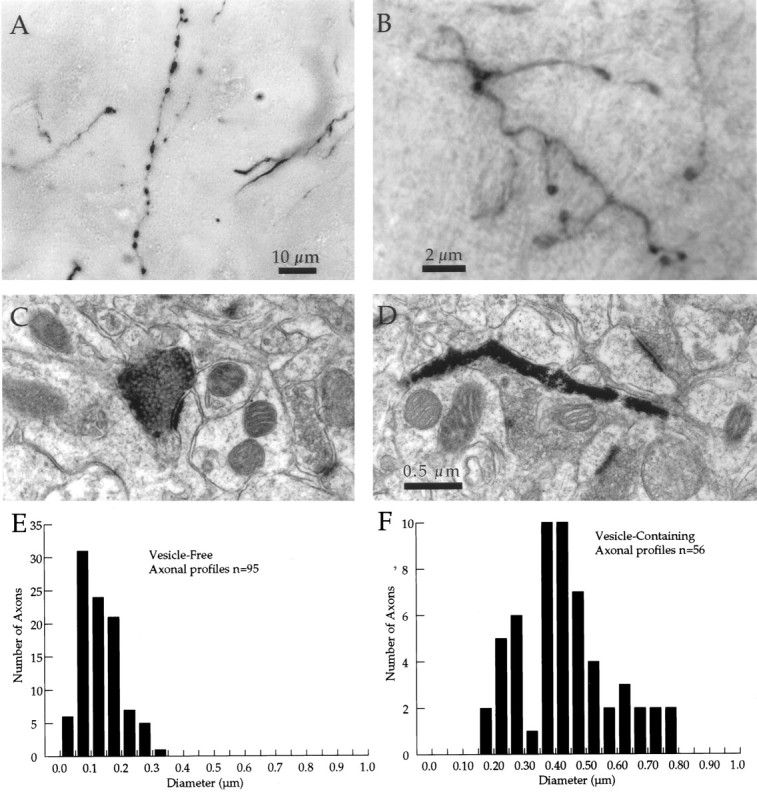
Synapses occur exclusively at varicosities on corticostriatal axons. A, Varicosities as they appear in the light microscope stained by anterograde transport of BDA. The diameters of the intervaricose regions cannot be measured accurately, but the varicosities were as large as 1 μm in diameter.B, High-voltage electron micrograph from a 4-μm-thick section through axons as in A. Intervaricose segments were resolved and measured to be ∼0.1 μm in diameter. Varicosities were between 0.2 and 1.0 μm. C, Thin-section conventional electron micrograph through a varicosity on a BDA-labeled corticostriatal axon. A single synapse was formed with an unlabeled dendritic spine. The diameter of the axon at the synaptic site is ∼0.5 μm. Scale as in D. D, Thin-section conventional electron micrograph through the intervaricose segment of a labeled corticostriatal axon. As was typical for this part of the axon, there were no vesicles present and no synaptic contact. The diameter of the axon is ∼0.1 μm. E, Histogram of the diameters of nonsynaptic vesicle-free profiles of BDA-labeled corticostriatal axons examined in conventional electron micrographs as in Cand D. Axonal diameter was measured on the short diameter of each profile. F, Histogram of diameters of vesicle-containing profiles in thin sections measured inE.
The distribution of axonal varicosities along corticostriatal axons is shown in Figure 2. Figure 2, Eand F, shows distributions generated by pooling many fragments of axonal arborizations stained by extracellular injections of BDA. Most corticostriatal projections to the patch compartment arise from axons forming focal arborizations. In general, projections to the matrix are more heterogeneous, with both focal and extended arborizations contributing significantly (Kincaid and Wilson, 1996). Because the goal was to compare focal and extended arborizations, samples of the matrix were selected from the portion of the projection containing primarily extended arborizations. Thus, the matrix measurements are an estimate of primarily extended arborizations, and the patch sample is primarily focal arborizations. Matrisomal arborizations are not represented in the BDA data but were measured for single axons. As shown in Figure 2, the distribution of axonal spacings did not differ in the two compartments. The relative contribution of axons of the extended and focal types also differed in the projections from different cortical regions, with the extended type being most pronounced for the medial agranular (premotor) field. Table1 compares the intervaricose spacing for the three different cortical fields examined and shows that there were no differences among cortical fields or between projections to the patch or matrix. In all cases, the distribution was highly asymmetrical, being skewed to the right, and the tail of the distribution was approximately exponential. The distribution was not exponential at short intervaricose distances, with distances <1–4 μm being much less common than expected for an exponential distribution. A similar distribution has been reported for the spacing of varicosities along axon collaterals of pyramidal neurons in the cortex (Hellwig et al., 1994).
Fig. 2.

Distribution of boutons along axonal branches in the patch and matrix and in single axons arborizing in extended and focal patterns. A, Drawing of a focal arborization from a single corticostriatal neuron stained by intracellular injection of biocytin. In the drawing, the arborization was projected onto the sagittal plane. Twenty-two boutons were present in this arborization.B, Drawing of the axon of another corticostriatal neuron arborizing in the extended manner, shown at the same magnification and in the same plane. This axonal arborization contained 935 boutons.C–F, Distribution of distances between nearest neighbor boutons along corticostriatal axons. The straight-line distance between nearest neighbor boutons along axonal branches was measured to make these histograms. Individual axonal branches seldom approached each other (the appearance that they do in the drawings is caused by the projection onto two dimension), so measurements along branches accurately represent absolute nearest-neighbor relationships. For each histogram, an exponential curve has been fit to the tail of the histogram (ignoring the bins preceding the peak of the histogram) and is shown as a solid line. The decay constant for the best-fitting exponential is indicated for each histogram (λs). This would be the mean spacing between boutons if the distribution were truly exponential. The actual mean spacing is also indicated for each histogram (). The difference between these is primarily attributable to the deviation from an exponential distribution near zero. In all cases, there were fewer interbouton segments shorter than 1–4 μm than expected on the basis of the exponential distribution. C, Histogram for the focal axonal arborization shown in A.D, Histogram of interbouton spacing for the extended arborization shown in B. E, Histogram of spacing among 1425 boutons measured from corticostriatal axons arborizing in the matrix compartment (mostly extended type) in sections from BDA injections from four animals. F, Histogram of the patch compartment (mostly focal) calculated from four animals as inE.
Table 1.
Intervaricose distances for BDA-stained corticostriatal axons
| Cortical location | Intervaricose distances | Number of segments measured |
|---|---|---|
| Cingulate | Patch = 1–43 μm (mean = 10.5) | Patch = 614 |
| Matrix = 1–89 μm (mean = 12.0) | Matrix = 320 | |
| Medial agranular | Patch = 1–73 μm (mean = 10.0) | Patch = 781 |
| Matrix = 1–58 μm (mean = 11.65) | Matrix = 832 | |
| Lateral agranular | Patch = 1–64 μm (mean = 11.2) | Patch = 603 |
| Matrix = 1–54 μm (mean = 10.6) | Matrix = 272 |
To further examine the possibility of differences in synaptic spacing among axons showing different arborization types, the distributions of intervaricose distances were also measured for three arborizations of single corticostriatal axons stained by intracellular injection. All three of these neurons arose from the medial agranular cortical field. Examples of one focal and one extended type arborization are shown in Figure 2, A and B, and the distributions of intervaricose segments from these are shown in Figure 2, Cand D. Although the extended axonal arborization formed many more varicosities over a much larger volume of the neostriatum, the individual branches of the arborization were separated by relatively large distances, and the spacing of varicosities along the branches was not distinguishable from that seen in the focal arborizations. Regardless of axonal type, the number of synapses generated by corticostriatal axons within a region comparable with the volume of the dendritic tree of a spiny neuron is approximately the same. Axons forming focal arborizations had more axonal branches within the volume occupied by the dendritic tree of a spiny neuron (∼400 μm radius) but still made between 20 and 40 synapses within the volume. The individual branches of the extended arborizations were generally spaced so far apart that only one branch could cross over the dendrites of any one spiny neuron but could make up to 40 synapses within that volume. The superimposition of axons in Figure 2B is attributable to the projection into two dimensions. Most axons contributing synapses within the dendritic volume of a spiny neuron would make <40, because they would not pass through the center of the dendritic tree.
The spacing of synapses along the axons of corticostriatal axons can be combined with a number of previously published observations to set upper and lower limits on the connectivity of the pathway and sharing of common inputs by nearby striatal neurons. Most corticostriatal synapses (∼95%) are formed with the dendritic spines of the spiny projection neurons of the striatum (e.g., Kemp and Powell, 1971b;Somogyi et al., 1981; Xu et al., 1989). These spines are distributed throughout the dendritic trees of the cells, except for a region within ∼20 μm of the soma. The dendrites extend in an approximately spherical manner with a diameter of ∼400 μm (Kemp and Powell, 1971a; DiFiglia et al., 1976; Wilson et al., 1983b; Wilson, 1992). Although many dendritic trees are distorted from the spherical (Kawaguchi et al., 1990; Walker and Graybiel, 1993), this is still a best estimate of the volume they occupy. Thus, the dendritic field of each spiny neuron occupies a region of ∼33,500,000 μm3. Within that volume, in the rat there are an average of 2845 neurons (based on the shrinkage-corrected estimate of 84,900 neurons/mm3 by Oorschot, 1996), most of which (∼95%) are spiny cells. The number of corticostriatal synapses that will be found in that volume can be estimated from the published report of Ingham et al. (1996), who measured the density of asymmetric synapses in the neostriatum using unbiased sampling in ultrathin sections and estimated that there are 0.91 afferent-type (asymmetric) synapses per cubic micrometer, or ∼30,500,000 within the volume occupied by the dendritic tree of one spiny neuron. Based on their studies of spine loss after lesions, Kemp and Powell (1971c) concluded that the corticostriatal and thalamostriatal inputs to spiny neurons were approximately equal. Although not a direct measurement, this estimate is consistent with more recent qualitative studies of these two pathways (Dubé et al., 1988; Xu et al., 1991; Ragsdale and Graybiel, 1991; Berendse and Groenewegen, 1990), which together account for most of the asymmetric synapses. It is also in agreement with neurophysiological studies showing approximately equal-sized monosynaptic responses of striatal neurons to stimulation of axonal pathways from the cortex and thalamus (Wilson et al., 1983a; Wilson, 1986). Assuming the cortical input as the origin of 50% of all asymmetric synapses in the striatum, there are ∼15,250,000 corticostriatal synapses within the volume occupied by one spiny neuron dendritic field in the rat. Estimates of the number of asymmetric synapses per spiny neuron have been calculated using spine density (Wilson et al., 1983b). Integration of the spine density distribution along individual dendrites published by Wilson et al. (1983b) yields an estimate of between 250 and 500 spines per spiny dendritic branch. Each neuron has 25–30 such spiny dendrites, yielding values between ∼6250 and 15,000 spines per neuron, depending on the number of dendrites on each cell. As each dendritic spine receives one asymmetric synapse (Wilson et al., 1983b), this yields the same number of asymmetric synapses per cell. Using an independent approach, the stereological measurements of Ingham et al. (1996) and Oorschot (1996) together yield an average asymmetric synapse count of 10,719 (9.1 × 10⁸ synapses/mm per 84,900 cells/mm) per striatal neuron (all types combined). This average number, which is in good agreement with that obtained by spine counts, will be used for subsequent calculations. The axonal measurements reported here indicate that individual corticostriatal axonal arborizations of both the extended and focal types usually have only one branch passing through the volume occupied by the dendritic tree of any one striatal projection neuron, and that on average a maximum of 40 asymmetrical synapses will be formed by the axon in that volume. The exceptions to this were axons of the focal arborizations, which formed <40 synapses in a volume approximately the size of a spiny cell dendritic tree. In both cases, of the 15,250,000 corticostriatal synapses present, ≤40 (0.00027%) could be formed by a single axon. Conversely, ∼381,180 different corticostriatal axons would be required to arborize in that volume to achieve the known density of corticostriatal synapses. These calculations are independent of the degree to which cortical axons make repeated contacts on single striatal cells. They are summarized in Table 2.
Table 2.
Measurements of corticostriatal connectivity within the volume of one projection neuron’s dendritic tree
| Volume of one dendritic tree2-a | 0.0335 mm2 |
| Number of neuronal somata in that volume2-b | 2845 |
| Total asymmetric synapses2-c | 30.5 × 10⁶ |
| Total corticostriatal synapses2-d | 15.25 × 10⁶ |
| Asymmetric synapses per cell | 10720 |
| Corticostriatal synapses per cell | 5360 |
| Average synapses formed per axon | 40 |
| Number of corticostriatal axons participating | 381180 |
Based on a spherical dendritic tree of 400 μm diameter.
Based on Oorschot (1996).
Based on Ingham et al. (1996).
Based on the assumption that corticostriatal inputs form half of the total asymmetric synapses.
It is not known whether individual corticostriatal axons make multiple synaptic contacts on single spiny neurons. Because the axons do not make boutons in clusters, and the dendritic fields of the striatal neurons radiate throughout their volume, this cannot be determined from the data at hand. But even if they do so in the most extreme form, one cortical axon can represent only a tiny fraction of the total cortical innervation of any spiny neuron. If synapses are made promiscuously within the volume of the dendritic field of one cell, then each axon may contact as many as 40 (1.4%) of the 2845 cells of all types whose somata are located in that volume. The chances of any neuron receiving more than one input from the same axon would be low, so one axon could only contribute one synaptic contact (0.009%) of the 10,719 asymmetrical synapses formed on the average per neuron. Two spiny projection cells located so close to each other that their dendritic fields totally overlapped would independently sample ∼5360 cortical inputs from the 381,180 in that volume and so would have only ∼75 of their cortical afferent axons in common. Because the axonal arborizations of corticostriatal neurons are usually larger than the dendritic fields of spiny neurons, cells located farther apart but still within the region of overlap of axonal fields would have approximately the same (actually slightly higher) chance of sharing inputs as those with overlapping dendritic fields.
In the opposite extreme case in which each cortical axon makes all of its synapses on a single postsynaptic neuron, the number of corticostriatal neurons innervating a single striatal cell would be 134 instead of 5360, so an individual corticostriatal axon would account for as much as 0.75% of the cortical input of a single striatal neuron (0.37% of total asymmetric synapses). However, in that case, nearby striatal projection neurons with overlapping dendritic trees would never share common inputs. Because individual axons of the focal type project to more than one cluster and extended axonal fields extend across the dendritic trees of many cells, striatal cells that separated from each so that their dendritic fields did not overlap would be much more likely to share a common input than would nearby cells (although still not likely in an absolute sense).
A similar calculation can be made for the sharing of target neurons in the striatum by axons arborizing in the same space. If two cortical neurons arborizing in exactly the same space make synapses with spiny neurons at random in their terminal fields, they will each contact 40 (1.4%) cells of the 2845 in the volume. The chance that both axons converge onto one spiny neuron is 2 × 10⁻⁴, and on average there will not be even one neuron within that volume that receives synapses from both cortical axons. The statistics of connectivity for both the nonselective and the totally selective cases are shown in Table 3.
Table 3.
Corticostriatal statistics assuming four different examples of connectivity rules
| Non-selective | Growth rule | Affinity groups | Totally selective | |
|---|---|---|---|---|
| Number of spiny cells contacted by one axon | 40 | 10 | 10 | 1 |
| Average number of synapses per axon per contacted cell | 1 | 4 | 4 | 40 |
| Percent of total number of spiny neurons in the volume of one dendritic field contacted by one axon | 1.4% | 0.35% | 0.35% | 0.035% |
| Average number of axons shared by two spiny neurons | 75.3 | 4.7 | 1300 | 0.0 |
| Percent of total population of cortical axons shared by a randomly selected pair of spiny neurons | 1.4% | 0.09% | 0.34% | 0.0% |
| Average number of cortical cells innervating each spiny cell | 5360 | 1340 | 1340 | 134 |
| Average number of spiny cells within the volume of one dendritic field shared by a randomly selected pair of cortical neurons | 0.55 | 0.035 | 0.97 | 0.00035 |
| Chances that two randomly selected cortical axons arborizing in the same volume converge onto a given spiny neuron | 0.02% | 3.4% | 0.35% | 0.035% |
All calculations are for contacts within the volume of one spiny neuron, as in Table 2. Nonselective, Axons contact any spiny neurons in the volume with constant probability. Growth rule, Axons contact any spiny neuron but make multiple synapses per contacted neuron (calculations are for four synapses per neuron). Affinity groups, Axons and spiny neurons are divided into subsets and only make synapses within their groups. Group sizes were adjusted to average four synapses per contacted neuron (284 groups) for comparison with the Growth rule.
A number of intermediate cases can be hypothesized in which single axons are neither completely nonselective nor do they seek out single postsynaptic targets. For example, spiny neurons may receive different cortical inputs depending on whether they participate in the direct or indirect pathway. Such a division of the spiny neurons into two populations would not make a significant difference in the results. The key feature for this kind of mechanism is the ratio of cortical axons to the number of cortical synapses per spiny neuron. With only two groups of axons, there would still be an enormous excess of cortical axons innervating the volume in comparison with the number of corticostriatal synapses on each cell. Thus, single spiny neurons would still share only a tiny proportion of their input and would receive only a single input from each of the cortical neurons innervating them. To produce a substantially higher mean connectivity, the population of axons that are candidates for innervating any particular postsynaptic cell would have to be reduced so that it is close to the number of cortical synapses on each spiny neuron. If each axon belonged to a group that had a predisposed affinity to contact only a small subset of spiny neurons, this could be achieved. To ensure that each axon made an average of one synapse on all the candidate neurons in its affinity group, the axons and striatal neurons would have to be divided into 71 such groups (381,180/5359). Sharing among affinity groups would be nearly total, and there would be no sharing at all across groups. To average four synapses per candidate striatal neuron, the striatal spiny cells and the innervating axons would have to be divided into 284 affinity groups. The results for this arrangement is shown in Table 3(affinity groups). The value of 4 used in this calculation was chosen arbitrarily to illustrate the concept. There is currently no evidence to suggest any value for the number of contacts on each striatal projection cell per cortical axon. In a second method for obtaining higher mean connectivity, cortical axons could make their initial synapses in a nonselective manner but once establishing one contact with a spiny neuron establish a strong selectivity for that cell resulting in a mean of more than one synapse per axon. This could arise from the action of a growth rule that encourages multiple synapses, such as one based on correlated firing in the presynaptic and postsynaptic cells. The results from this model are also shown in Table3 (growth rule), again arbitrarily choosing four synapses per axon per cell. Table 3 shows that these two patterns produce dramatically different results. In the growth rule case, sharing is effectively reduced, because the number of spiny neurons contacted by each axon is reduced from 40 to 10 without any change in the number of candidate neurons or axons in the volume. In the affinity group case, the axons and cells are divided into 284 different subclasses, reducing the number of axons per group to one-fourth of postsynaptic sites per neuron. Each axon innervates nearly every spiny neuron in its affinity group, so all the cells in the affinity group have identical input. The total number of unique combinations of inputs represented in the volume is reduced from 2840 to 284, and each spiny neuron has exactly the same input signal as the nine other cells in its affinity group. Because connectivity is measured across all cells in the volume, the average connectivity is approximately 1/284.
DISCUSSION
Patches (striosomes)
The available information on the convergence of corticostriatal inputs in the striosomal, focal matrix (matrisomal), and extended matrix patterns are summarized in Figure3. In the focal arborizations of the patches, axonal fields are approximately the same size as dendritic trees of spiny cells, and both the axons and the spiny cell dendrites observe the patch boundaries (Penny et al., 1988; Kawaguchi et al., 1989, 1990). As a result, all axons that arborize in a given patch in rats share a common volume of innervation, and all the dendrites of the cells in the patch at that level are equally able to be contacted by all the axons. Calculations of innervation density and connectivity in the patch compartment are the most simple. Axons fill the patch cross section and make synapses at equal density everywhere in the arborization, so no spatial gradients of innervation can occur within the volume. The synaptic density generated by one axon is low so there are many axons, and each one contacts only a small subset (on average, ≤40) of the cells in the volume. Regardless of the degree to which axons make repeated contacts on the same spiny cell, the influence of any one axon on any cell is low, and sharing of inputs is low. If selectivity is higher, sharing of inputs approaches zero. Cells share ∼75 or fewer input axons in common unless there are affinity groups on the order of ≥75, as in Table 3 (affinity groups).
Fig. 3.

Three different corticostriatal convergence patterns. A, In the patches (striosomes) and perhaps in the matrix focal arborizations (matrisomes), focal corticostriatal axonal fields and spiny neuron dendrites obey the patch boundaries and are approximately the same size as the patch cross-section. In this arrangement, all connectivity is discontinuous, and every cell in the patch has access to all the axons arborizing there. The number of possible synaptic connections on one spiny neuron is merely the number of synapses made in the patch, and there is a direct trade-off between that number and the degree of input sharing in the patch.B, The extended axonal fields of some corticostriatal neurons take a straight course through their large arborizations, with branches separated so that a single neuron is crossed by only one branch. The number of possible synaptic contacts is determined by the interval between synapses along the axon and the diameter of the dendritic tree of the spiny cell. C, Unlike the situation in the striosomes, the focal axonal arborizations of corticostriatal cells in the matrix may not be totally overlapping, and spiny cells may not observe boundaries of matrisomes. In this hypothetical case, a continuous topography is possible.
Focal arborizations in the matrix (matrisomes)
In the focal arborizations in the matrix (matrisomes), we do not know yet whether spiny dendrites obey the boundaries observed by axonal arborizations. Distortions of spiny neuron dendritic fields within the matrix in ways resembling those seen in patches have been observed (Kawaguchi et al., 1990; Walker and Graybiel, 1993). It is possible that the matrisomes are just as well defined as the patch compartment, but the cytochemical tools for demonstrating their boundaries have not yet been discovered. If so, the matrisomes obey exactly the same convergence rules as striosomes. However, it is not certain that the axons that arborize in the focal arborizations in the matrix are doing so to obey the boundaries of a tissue compartment or whether they are simply making small arborizations. In the absence of an independent cytochemical marker for these matrisomes, it is not possible to compare axonal arborizations with compartmental boundaries, as can be done for the striosomes. Confidence in the reality of matrisomes as tissue compartments is undermined by reports of incomplete overlap of projections to matrisomes (Flaherty and Graybiel, 1993a). That is, when focal projections from physiologically characterized cortical regions were compared, there were occasionally areas of incomplete overlap in the projections of different cortical areas representing the same body part. This raises the possibility that corticostriatal axons make focal arborizations in the matrix that overlap more or less according to a functionally organized topography. For purposes of convergence of inputs, this would be the opposite situation to that of the striosomes. Striatal spiny neurons would send their dendrites into different axonal arborizations according to proximity, and there would result a continuous microtopography in the matrix, with each point of the striatum representing a unique combination of cortical inputs. Even if this is the case (Fig. 3C, Continuous Focal Arborizations: Matrisome?), the low amount of sharing and the low connectivity with single axons ensures that nearby cells will get different inputs, and the combination of inputs to each striatal cell, even those with totally overlapping dendritic fields, would be unique.
Extended matrix arborizations
The extended arborizations are not usually described in population-labeling studies of the corticostriatal pathway. In those studies, they contribute to a generalized background of labeling around the foci, so their contribution does not stand out well. These axons have been shown to cross patch and matrix boundaries, making synapses in both compartments (Kincaid and Wilson, 1996). Their wide-ranging arborizations give the superficial appearance of making synapses at a lower density than the focal arborizations, but it is not so. They make many more synapses and make arborizations as rich as the focal ones but over much larger areas. So far, these have only been seen arising from axons that do not have axons descending beyond the neostriatum. Because of the large arborization sizes of these cells, they are unlikely to produce any fine spatial patterning of inputs on the spatial scale of the matrisome or smaller. Because the density of the individual branches of these neurons is low, few spiny cells could be crossed by more than one branch, and so the important issue for these arborizations is simply the spacing of synapses along the axons. The results of the present study show that, like the focal arborizations, these axons make ≤40 synapses on average while crossing the dendritic field of a spiny neuron. As in the case of the focal arborizations, the small number of inputs formed within the dendritic tree of a single cell and the high density of spiny neurons ensures that each spiny neuron will receive inputs from a large number of such axons and that cells with overlapping dendritic trees will not share many input axons. For this kind of axon, as for the others, two spiny neurons with nonoverlapping dendritic fields are more likely to share common inputs than cells located near each other. This occurs because an axon having made a synaptic input on one of two cells with overlapping dendritic trees has thereby reduced by 1 of 40 its chance of contacting another cell in the same location.
Uniqueness of connectivity of striatal neurons
These results offer an explanation for a variety of physiological findings on the functional properties of striatal neurons. Although striatal neurons responding to movement of particular body parts are found near each other (Alexander and DeLong, 1985b), there is a wide variability of the finer functional properties of the cells within a body part (Alexander et al., 1992, their Discussion). Striatal neurons responding to movement of a particular body part are found in clusters ∼0.2–0.5 mm in diameter (Alexander and DeLong, 1985b). These clusters of neurons associated with movements of single body parts probably correspond to microexcitable zones in which stimulation can evoke movement of a single body part (Alexander and DeLong, 1985a) and also to the focal regions of labeling seen after injections of axonal tracers into physiologically characterized cortical body part representations (Flaherty and Graybiel, 1991). The excitability of clusters to microstimulation probably arises from antidromic activation of corticofugal neurons and the recurrent excitation of the motor cortex through axon collaterals of the corticostriatal cells. However, within this pattern of discontinuous corticostriatal connections, studies involving simultaneous recording of striatal neurons have shown that nearby cells generally do not show correlations of firing that would be expected if they all received contacts from the same axons from the cortex or elsewhere (Jaeger et al., 1995). Likewise, although responding to the same body part, the neurons in these clusters show an enormous variability in their responsiveness to various other parameters of the task, and this variability is not related in any obvious way to their location within the cluster (Hikosaka et al., 1989; Alexander and Crutcher, 1990; Alexander et al., 1992). In light of the anatomical arrangement of corticostriatal connections demonstrated here, these results are easily understood as a result of the low level of redundancy within the corticostriatal projections. Because neurons within individual clusters receive their input systematically from certain cortical regions, they respond in the overall pattern typical of those cortical regions. However, because of the low degree of input sharing by nearby neurons, each striatal neuron receives a unique set of inputs from the population of cortical cells. This absence of redundancy among neostriatal neurons is guaranteed as long as each cortical neuron transmits a unique signal, a result that is assured by the connectivity within the cerebral cortex (Markram, 1997).
It should be noted that despite the uniqueness of innervation of each neostriatal neuron, the striatum does not encode an exhaustive set of all combinations of cortical inputs. On the contrary, only a tiny proportion of all combinations of inputs to a single cluster of neostriatal neurons is represented in its output. As calculated above, each volume of striatum equal to that occupied by a spiny cell dendritic field is innervated by ∼380,000 corticostriatal axons. Of the possible ∼109000 combinations when taken 5300 at a time, only ∼2800 are expressed by the same number of cells in the volume. Regardless of whether axons of cortical cells specifically seek individual target neurons in the striatum, use an activity-based growth rule for establishing synaptic contacts, or make synapses at random among available spiny neurons in the striatum, the low density of synaptic contacts made by individual cortical axons reported here applies strong constraints on the interpretation of topography in this projection. Cortical neurons projecting to the same region of the striatum do not share a common set of postsynaptic cells by virtue of having overlapping axonal arborizations, and nearby striatal neurons probably do not share more than ∼1% of cortical afferent neurons. Thus, the spiny neurons certainly do not fully encode all combinations of cortical afferents available to them, even when taking into account the dimensional reduction imposed by the topographic nature of the projection. The variation of functional properties of spiny neurons observed within the topography probably reflects cell to cell variation in which the choice of combinations of afferents are encoded. The absence of fine spatial gradients in these properties suggests that at that level, nontopographical factors dominate the organization of the corticostriatal pathway.
Footnotes
This work was supported by National Institutes of Health, National Institutes of Neurological Diseases and Stroke Grant NS20473. HVEM images were obtained from the High Voltage Electron Microscopy facility at the University of Colorado at Boulder, which is supported by National Institutes of Health Grant RR00592.
Correspondence should be addressed to Charles J. Wilson, Department of Anatomy and Neurobiology, University of Tennessee, Memphis, 855 Monroe Avenue, Memphis, TN 38163.
Dr. Kincaid’s present address: Department of Physical Therapy, Creighton University, Omaha, NE 68178.
REFERENCES
- 1.Abeles M. Corticonics, pp 67–72. Cambridge UP; Cambridge, UK: 1991. [Google Scholar]
- 2.Alexander GE, Crutcher MD. Preparation for movement: neural representations of intended direction in three motor areas of the monkey. J Neurophysiol. 1990;64:133–150. doi: 10.1152/jn.1990.64.1.133. [DOI] [PubMed] [Google Scholar]
- 3.Alexander GE, DeLong MR. Microstimulation of the primate neostriatum. I. Physiological properties of striatal microexcitable zones. J Neurophysiol. 1985a;53:1401–1416. doi: 10.1152/jn.1985.53.6.1401. [DOI] [PubMed] [Google Scholar]
- 4.Alexander GE, DeLong MR. Microstimulation of the primate neostriatum. II. Somatotopic organization of striatal microexcitable zones and their relation to neuronal response properties. J Neurophysiol. 1985b;53:1417–1430. doi: 10.1152/jn.1985.53.6.1417. [DOI] [PubMed] [Google Scholar]
- 5.Alexander GE, DeLong MR, Crutcher MD. Do cortical and basal ganglionic motor areas use “motor programs” to control movement? Behav Brain Sci. 1992;15:656–665. [Google Scholar]
- 6.Berendse HW, Groenewegen HJ. Organization of the thalamostriatal projections in the rat, with special emphasis on the ventral striatum. J Comp Neurol. 1990;299:187–228. doi: 10.1002/cne.902990206. [DOI] [PubMed] [Google Scholar]
- 7.Brown LL. Somatotopic organization in rat striatum: evidence for a combinational map. Proc Natl Acad Sci USA. 1992;89:7403–7407. doi: 10.1073/pnas.89.16.7403. [DOI] [PMC free article] [PubMed] [Google Scholar]
- 8.Cowan RH, Wilson CJ. Spontaneous firing patterns and axonal projections of single corticostriatal neurons in the rat medial agranular cortex. J Neurophysiol. 1994;71:17–32. doi: 10.1152/jn.1994.71.1.17. [DOI] [PubMed] [Google Scholar]
- 9.DiFiglia M, Pasik P, Pasik T. A Golgi study of neuronal types in the neostriatum of monkeys. Brain Res. 1976;114:245–256. doi: 10.1016/0006-8993(76)90669-7. [DOI] [PubMed] [Google Scholar]
- 10.Dubé L, Smith AD, Bolam JP. Identification of synaptic terminals of thalamic or cortical origin in contact with distinct medium-size spiny neurons in the rat neostriatum. J Comp Neurol. 1988;267:455–471. doi: 10.1002/cne.902670402. [DOI] [PubMed] [Google Scholar]
- 11.Flaherty AW, Graybiel AM. Corticostriatal transformations in the primate somatosensory system. Projections from physiologically mapped body-part representations. J Neurophysiol. 1991;66:1249–1263. doi: 10.1152/jn.1991.66.4.1249. [DOI] [PubMed] [Google Scholar]
- 12.Flaherty AW, Graybiel AM. Two input systems for body representations in the primate striatal matrix: experimental evidence in the squirrel monkey. J Neurosci. 1993a;13:1120–1137. doi: 10.1523/JNEUROSCI.13-03-01120.1993. [DOI] [PMC free article] [PubMed] [Google Scholar]
- 13.Flaherty AW, Graybiel AM. Output architecture of the primate putamen. J Neurosci. 1993b;13:3222–3237. doi: 10.1523/JNEUROSCI.13-08-03222.1993. [DOI] [PMC free article] [PubMed] [Google Scholar]
- 14.Flaherty AW, Graybiel AM. Input-output organization of the sensorimotor striatum in the squirrel monkey. J Neurosci. 1994;14:599–610. doi: 10.1523/JNEUROSCI.14-02-00599.1994. [DOI] [PMC free article] [PubMed] [Google Scholar]
- 15.Graybiel AM, Aosaki T, Flaherty AW, Kimura M. The basal ganglia and adaptive motor control. Science. 1994;265:1826–1831. doi: 10.1126/science.8091209. [DOI] [PubMed] [Google Scholar]
- 16.Hellwig B, Schütz A, Aertsen A. Synapses on axon collaterals of pyramidal cells are spaced at random intervals: a Golgi study in the mouse cerebral cortex. Biol Cybern. 1994;71:1–12. doi: 10.1007/BF00198906. [DOI] [PubMed] [Google Scholar]
- 17.Hikosaka O, Sakamoto M, Usui S. Functional properties of monkey caudate neurons. I. Activities related to saccadic eye movements. J Neurophysiol. 1989;61:780–798. doi: 10.1152/jn.1989.61.4.780. [DOI] [PubMed] [Google Scholar]
- 18.Ingham CA, Hood SH, Taggart P, Arbuthnott GW. Synaptic plasticity in the rat neostriatum after unilateral 6-hydroxydopamine lesion of the nigrostriatal dopaminergic pathway. In: Ohye VC, Kimura M, McKenzie JS, editors. The basal ganglia. Plenum; New York: 1996. pp. 157–164. [Google Scholar]
- 19.Jaeger D, Gilman S, Aldridge JW. Neuronal activity in the striatum and pallidum of primates related to the execution of externally cued reaching movements. Brain Res. 1995;694:111–127. doi: 10.1016/0006-8993(95)00780-t. [DOI] [PubMed] [Google Scholar]
- 20.Kawaguchi Y, Wilson CJ, Emson PC. Intracellular recording of identified neostriatal patch and matrix spiny cells in a slice preparation preserving cortical inputs. J Neurophysiol. 1989;62:1052–1068. doi: 10.1152/jn.1989.62.5.1052. [DOI] [PubMed] [Google Scholar]
- 21.Kawaguchi Y, Wilson CJ, Emson PC. Projection subtypes of rat neostriatal matrix cells revealed by intracellular injection of biocytin. J Neurosci. 1990;10:3421–3438. doi: 10.1523/JNEUROSCI.10-10-03421.1990. [DOI] [PMC free article] [PubMed] [Google Scholar]
- 22.Kemp JM, Powell TPS. The cortico-striate projection in the monkey. Brain. 1970;93:525–546. doi: 10.1093/brain/93.3.525. [DOI] [PubMed] [Google Scholar]
- 23.Kemp JM, Powell TPS. The structure of the caudate nucleus of the cat: light and electron microscopy. Phil Trans R Soc Lond B Biol Sci. 1971a;262:383–401. doi: 10.1098/rstb.1971.0102. [DOI] [PubMed] [Google Scholar]
- 24.Kemp JM, Powell TPS. The site of termination of afferent fibres in the caudate nucleus. Phil Trans R Soc Lond B Biol Sci. 1971b;262:403–412. doi: 10.1098/rstb.1971.0104. [DOI] [PubMed] [Google Scholar]
- 25.Kemp JM, Powell TPS. The termination of fibres from the cerebral cortex and thalamus upon the dendritic spines in the caudate nucleus: a study with the Golgi method. Phil Trans R Soc Lond B Biol Sci. 1971c;262:429–439. doi: 10.1098/rstb.1971.0105. [DOI] [PubMed] [Google Scholar]
- 26.Kincaid AE, Wilson CJ. Corticostriatal innervation of the patch and matrix in the rat neostriatum. J Comp Neurol. 1996;374:578–592. doi: 10.1002/(SICI)1096-9861(19961028)374:4<578::AID-CNE7>3.0.CO;2-Z. [DOI] [PubMed] [Google Scholar]
- 27.Levesque M, Gagnon S, Parent A, Deschenes M. Axonal arborizations of corticostriatal and corticothalamic fibers arising from the second somatosensory area in the rat. Cereb Cortex. 1996;6:759–770. doi: 10.1093/cercor/6.6.759. [DOI] [PubMed] [Google Scholar]
- 28.Malach R, Graybiel AM. Mosaic architecture of the somatic sensory-recipient sector of the cat’s striatum. J Neurosci. 1986;6:3436–3458. doi: 10.1523/JNEUROSCI.06-12-03436.1986. [DOI] [PMC free article] [PubMed] [Google Scholar]
- 29.Markram H. A network of tufted layer 5 pyramidal neurons. Cereb Cortex. 1997;7:523–533. doi: 10.1093/cercor/7.6.523. [DOI] [PubMed] [Google Scholar]
- 30.Oorschot DE. Total number of neurons in the neostriatal, pallidal, subthalamic and substantia nigral nuclei of the rat basal ganglia: a stereological study using the Cavalieri and optical dissector methods. J Comp Neurol. 1996;366:580–599. doi: 10.1002/(SICI)1096-9861(19960318)366:4<580::AID-CNE3>3.0.CO;2-0. [DOI] [PubMed] [Google Scholar]
- 31.Parthasarathy HB, Schall JD, Graybiel AM. Distributed but convergent ordering of corticostriatal projections: analysis of the frontal eye field and the supplementary eye field in the macaque monkey. J Neurosci. 1992;12:4468–4488. doi: 10.1523/JNEUROSCI.12-11-04468.1992. [DOI] [PMC free article] [PubMed] [Google Scholar]
- 32.Penny GR, Wilson CJ, Kitai ST. Relationship of the axonal and dendritic geometry of spiny projection neurons to the compartmental organization of the neostriatum. J Comp Neurol. 1988;269:275–289. doi: 10.1002/cne.902690211. [DOI] [PubMed] [Google Scholar]
- 33.Ragsdale CW, Graybiel AM. Compartmental organization of the thalamostriatal connection in the cat. J Comp Neurol. 1991;311:134–167. doi: 10.1002/cne.903110110. [DOI] [PubMed] [Google Scholar]
- 34.Selemon LD, Goldman-Rakic PS. Longitudinal topography and interdigitation of corticostriatal projections in the rhesus monkey. J Neurosci. 1985;5:776–794. doi: 10.1523/JNEUROSCI.05-03-00776.1985. [DOI] [PMC free article] [PubMed] [Google Scholar]
- 35.Somogyi P, Bolam JP, Smith AD. Monosynaptic cortical input and local axon collaterals of identified stiratonigral neurons. A light and electron microscopic study using the Golgi-peroxidase transport-degeneration method. J Comp Neurol. 1981;195:567–584. doi: 10.1002/cne.901950403. [DOI] [PubMed] [Google Scholar]
- 36.Walker RH, Graybiel AM. Dendritic arbors of spiny neurons in the primate striatum are directionally polarized. J Comp Neurol. 1993;337:629–639. doi: 10.1002/cne.903370408. [DOI] [PubMed] [Google Scholar]
- 37.Webster KE. Cortico-striate interrelations in the albino rat. J Anat. 1961;95:532–545. [PMC free article] [PubMed] [Google Scholar]
- 38.Wilson CJ. Postsynaptic potentials evoked in spiny neostriatal projection neurons by stimulation of ipsilateral or contralateral neocortex. Brain Res. 1986;367:201–213. doi: 10.1016/0006-8993(86)91593-3. [DOI] [PubMed] [Google Scholar]
- 39.Wilson CJ. Morphology and synaptic connections of crossed corticostriatal neurons in the rat. J Comp Neurol. 1987;263:567–580. doi: 10.1002/cne.902630408. [DOI] [PubMed] [Google Scholar]
- 40.Wilson CJ. Dendritic morphology, inward rectification and the functional properties of neostriatal neurons. In: McKenna T, Davis J, Zornetzer SF, editors. Single neuron computation. Academic; San Diego: 1992. pp. 141–171. [Google Scholar]
- 41.Wilson CJ. Understanding the neostriatal microcircuitry: high voltage electron microscopy. Microsc Res Tech. 1994;29:368–380. doi: 10.1002/jemt.1070290507. [DOI] [PubMed] [Google Scholar]
- 42.Wilson CJ, Chang HT, Kitai ST. Origins of postsynaptic potentials evoked in spiny neostriatal projection neurons by thalamic stimulation in the rat. Exp Brain Res. 1983a;51:217–226. doi: 10.1007/BF00237197. [DOI] [PubMed] [Google Scholar]
- 43.Wilson CJ, Groves PM, Kitai ST, Linder JC. Three-dimensional structure of dendritic spines in the rat neostriatum. J Neurosci. 1983b;3:383–398. doi: 10.1523/JNEUROSCI.03-02-00383.1983. [DOI] [PMC free article] [PubMed] [Google Scholar]
- 44.Xu ZC, Wilson CJ, Emson PC. Restoration of the corticostriatal projection in rat neostriatal grafts: electron microscopic analysis. Neuroscience. 1989;29:539–550. doi: 10.1016/0306-4522(89)90129-2. [DOI] [PubMed] [Google Scholar]
- 45.Xu ZC, Wilson CJ, Emson PC. Restoration of thalamostriatal projections in rat neostriatal grafts: an electron microscopic analysis. J Comp Neurol. 1991;303:22–34. doi: 10.1002/cne.903030104. [DOI] [PubMed] [Google Scholar]