

Abstract
The identification of a common cis-acting silencer element, a neuron-restrictive silencer element (NRSE), in multiple neuron-specific genes, together with the finding that zinc finger transcription factor REST/NRSF/XBR could confer NRSE-mediated silencing in non-neuronal cells, suggested that REST/NRSF/XBR is a master negative regulator of neurogenesis. Here we show that, although REST/NRSF/XBR expression decreases during neuronal development, it proceeds in the adult nervous system. In situhybridization analysis revealed neuronal expression of rat REST/NRSF/XBR mRNA in adult brain, with the highest levels in the neurons of hippocampus, pons/medulla, and midbrain. The glutamate analog kainic acid increased REST/NRSF/XBR mRNA levels in various hippocampal and cortical neurons in vivo, suggesting that REST/NRSF/XBR has a role in neuronal activity-implied processes. Several alternatively spliced REST/NRSF/XBR mRNAs encoding proteins with nine, five, or four zinc finger motifs are transcribed from REST/NRSF/XBR gene. Two of these transcripts are generated by neuron-specific splicing of a 28-bp-long exon. Rat REST/NRSF/XBR protein isoforms differ in their DNA binding specificities; however, all mediate repression in transient expression assays. Our data suggest that REST/NRSF/XBR is a negative regulator rather than a transcriptional silencer of neuronal gene expression and counteracts with positive regulators to modulate target gene expression quantitatively in different cell types, including neurons.
Keywords: REST, NRSF, XBR, transcription factor, zinc finger, silencer, negative regulator, repressor, gene structure, neuron-specific splicing, neuronal expression, brain, kainic acid, NRSE, BDNF
The balance between negative and positive regulators is critical in determining cell type and developmental stage-specific transcription of a gene. Recently, two groups identified a gene encoding zinc finger protein that was suggested to function as a master regulator of the neuronal phenotype. Transcription factor REST, an RE1-silencing transcription factor (Chong et al., 1995), also known as neuron-restrictive silencer factor (NRSF;Schoenherr and Anderson, 1995a) was identified as a factor that could interact with a 23 bp cis-element, a neuron-restrictive silencer element (NRSE/RE1), and mediate silencing of type II voltage-dependent sodium channel (NaCh II) and SCG10 genes in non-neuronal cells. Analysis of the REST/NRSF mRNA expression pattern, exclusive to the CNS neurons, together with the results of transient expression assays, suggested that REST/NRSF acts as a silencer of neuron-specific gene expression in the undifferentiated neuronal progenitors and in non-neuronal cells (Chong et al., 1995; Schoenherr and Anderson, 1995a). Since then, several other neuronal genes that contribute to many different aspects of neuronal phenotype have been shown to contain functional NRSE-like sequences in their regulatory regions (Schoenherr et al., 1996). However, some of the published data do not support the proposed role of REST/NRSF/XBR as a neuron-restrictive silencer factor. For example, the same factor has been identified as an X2 box repressor (XBR), which represses the promoter activity of DPA, the immune system-specific major histocompatibility complex class II gene in terminally differentiated B-cell lineage (Scholl et al., 1996). This suggested that REST/NRSF/XBR-mediated repression is not limited to genes involved in neuron-specific functions. It also has been reported that brain-derived nuclear extracts contain NRSE binding proteins (Thiel et al., 1994). Recently, with the use of transgenic mice, it was demonstrated that NRSE is involved in the repression of neuronal nicotinic acetylcholine receptor β2-subunit promoter activity in the neurons of adult brain (Bessis et al., 1997).
Data indicating that NRSE binding proteins regulate transcription in neurons have led us to study the expression and presence of REST/NRSF/XBR or its putative neuronal homologs in the adult brain. We show that multiple rat REST (rREST) transcripts are expressed in the neurons of adult brain, and we characterize the molecular basis for these alternatively spliced transcripts by structural analysis of the rREST gene. We further show that the expression of different rREST transcripts is increased in the brain after kainic acid (KA)-induced seizures, and we analyze the potential role of rREST and its protein isoforms by using functional assays. Our data suggest that REST/NRSF/XBR is involved in the modulation of the target gene expression in the mature neurons.
MATERIALS AND METHODS
Isolation and characterization of cDNA clones. A randomly primed cDNA library was constructed in λZAPII vector from RN33B cell poly(A+) mRNA (kindly provided by Dr. C. F. Ibañéz, Karolinska Institute) with the cDNA synthesis kit (Stratagene, La Jolla, CA) and screened at low-stringency conditions with the full-length human REST/NRSF/XBR cDNA (kindly provided by Dr. G. Mandel, State University of New York at Stony Brook). One of the positive clones contained a cDNA fragment of ∼2.5 kb. Restriction fragments of this rREST cDNA clonePvuII/PstI (encompassing zinc fingers 2–8) andPstI/SacI (encoding a part of the finger 8 and the region immediately downstream) were applied in the subsequent screenings of the same library. DNA fragments used as hybridization probes were labeled radioactively with [α-32P]dCTP by random priming (Feinberg and Vogelstein, 1983) to a specific activity of ∼109 cpm/μg. Positively hybridizing phages were isolated, applied to in vivo excision, and analyzed by DNA sequencing (T7 sequencing kit, Pharmacia, Uppsala, Sweden). Sequence comparison was performed with a software package of the University of Wisconsin Genetics Computer Group (Devereux et al., 1984).
Southern blot analysis. High-molecular-weight Sprague Dawley rat chromosomal DNA (20 μg) was digested with EcoRI andBamHI. The fragments were separated in 1.0% agarose gel and transferred to Hybond N+ filter (Amersham, Braunschweig, Germany). Then the filter was hybridized with the [α-32P]dCTP-labeled rREST cDNA fragment from riboprobes 4 and 5 (described in RNase Protection Analysis). At first the filter was washed with 2× SSC, 0.1% SDS at 50°C, and imaged. After initial imaging, the filter was washed with 0.2× SSC, 0.1%SDS at 65°C, and reexposed. The filters were imaged with PhosphorImager, and the digitized images were analyzed with ImageQuant software (Molecular Dynamics, Sunnyvale, CA).
RNA preparation and Northern blot analysis. Total and poly(A+) RNA from indicated tissues and cell lines were purified and analyzed by Northern blot as described (Timmusk et al., 1993). The filters were hybridized with the same rREST cDNA fragments as in the rescreening of the RN33B cDNA library.
RNase protection analysis. RNase protection assays (RPA) were performed with the RPAII Ribonuclease Protection Assay Kit (Ambion, Austin, TX). The templates used to generate cRNA probes were cloned in pBSKS vector (Stratagene), linearized in the 5′ end, and transcribed with T7 or T3 RNA polymerase (Promega, Madison, WI). The rREST-specific riboprobes that were applied included the following: (1) for 5′-untranslated region (5′-UTR) of type A, a 270 bpEcoRI/PvuII fragment of rREST13 cDNA; (2) for 5′-UTR of type B, a 260 bp EcoRI/PvuII fragment of rREST16 cDNA; (3) for 5′-UTR of type C, a 330 bpEcoRI/PvuII fragment of rREST11 cDNA. The 5′-UTR-specific probes yielded a fully protected fragment corresponding to the 5′-UTR-specific transcript and a 190 bp fragment corresponding to all other rREST transcripts; (4) a 460 bpPvuII/AvaII fragment, including the region upstream of zinc finger 1 up to zinc finger 2; (5) a 360 bpAvaII/DraI fragment, spanning the region between zinc fingers 2 and 6; (6) for the truncated rREST1, a 370 bpAvaII/HindIII fragment of rREST1 cDNA. This probe yielded a fully protected fragment corresponding to rREST1 mRNA and a 256 bp fragment corresponding to all other rREST transcripts; (7) for rREST2 respective reverse transcription (RT)-PCR cDNA fragment spanning the region from zinc finger 2 to zinc finger 8 (8) for rREST3, (9) for rREST4 and (10) for rREST5, respective RT-PCR cDNAs covering the region from zinc finger 5 to zinc finger 8; (11) a 360 bp XhoI fragment of rREST38 cDNA, covering the region upstream of zinc finger 9. For determining the levels of mouse REST/NRSF/XBR mRNA in Neuro-2A cells, a 380 bp HaeIII fragment of mouse REST/NRSF/XBR cDNA (GenBank accession number U13878), covering the region from zinc finger 2 to zinc finger 6, was cloned in pBSKS and used as a template forin vitro transcription. The quantification of the REST mRNA absolute amounts in tissues and cell lines was performed as described (Timmusk et al., 1994). Briefly, for quantification of rat and mouse REST/NRSF/XBR mRNAs, standard curves were constructed with known amounts of in vitro synthesized, unlabeled sense strand REST RNA hybridized with the excess of labeled antisense probe. The sense strand transcript was made by linearizing the same DNA template as that used for antisense probe synthesis on the opposite side of the probe insert. Then in vitro transcription with T3 or T7 RNA polymerase was used to synthesize the unlabeled sense strand. The absolute amount of sense RNA that was synthesized was measured spectrophotometrically. Samples containing 20 μg of total RNA from embryonic day 13 (E13) brain, E16 heart and lung, E19 kidney, adult rat brain and thymus, and Neuro-2A and C6 cells were analyzed in parallel with the samples used to generate the standard curve. Quantification of the amount of REST-specific mRNA that hybridized to the probe in different tissue samples was performed with PhosphorImager, using ImageQuant software (Molecular Dynamics).
PCR analysis of rREST mRNA expression and gene structure.First-strand cDNAs were synthesized with reverse transcriptase (Superscript II, Life Technologies, Gaithersburg, MD), using 5 μg of poly(A+) RNA from different tissues as a template and oligo-dT (Promega) as a primer. PCR reactions were performed in a volume of 25 μl containing one-tenth of RT reaction as a template and 0.25 U of thermostable DNA polymerase (Dynazyme, Finnzymes, Finland). DNA was amplified with PTC-100 TM thermocycler (MJ Research, Watertown, MA) at the following conditions: 94°C (2 min), 35 cycles of 94°C (40 sec), 60°C (40 sec), and 72°C (150 sec). To detect rREST 5′-UTR-specific transcripts, we increased the number of cycles to 45. The amplified RT-PCR products were analyzed on 2% agarose gel.
Amplification of genomic DNA by PCR was performed by using the Expand Long Distance PCR System kit (Boehringer Mannheim, Mannheim, Germany) according to manufacturer’s instructions. Annealing temperature was 60°C for all combinations of primers, and the number of cycles was 35. Primers (Eurogentec, Brussels, Belgium) that were applied included the following: pAs, 5′-GGC AAC AAA GAA AAG GAG TTA GAG CGA-3′; pBs, 5′-GCG GAG CCC CGG TAC AGG CCC GAT-3′; pBas, 5′-CGT CCG ATC GGG CCT GTA CCG GGG CT-3′; pCs, 5′-GGA GAA ACG TGG ACA TTC CTT GGA-3′; pATGs, 5′-GCT ACA GTT ATG GCC ACC CAG GTG AT-3′; pATGas, 5′-CCA TGC CCA TGT TGC CAC TGT T-3′; p2s, 5′-CTA CAT GGC ACA CCT GAA GCA CCA C-3′; pR1s, 5′-CCG TTT CCC AAG GGA ATT GAG GGC T-3′; pR1as, 5′-GCC CTC AAT TCC CTT GGG AAA CGG TA-3′; p5s, 5′-GAC TCA TCT AAC TCG ACA CAT GCG T-3′; p5as, 5′-GCA TGT GTC GAG TTA GAT GAG TCT T-3′; pR4s, 5′-CAG AGT GTG ATC TAG YTG GGT GA-3′; pR4as, 5′-GGC TTC TCA CCC ARC TAG ATC ACA CT-3′; pR5as, 5′-GGC TTC TCA CCT GAA TAC ATA CCC A-3′; pR2s, 5′-GAC ACA TGC GTA CTC ACT CAG GTT GGT-3′; pR3s, 5′-CGA CAC ATG CGT ACT CAC TCA GCC ATT-3′; p6s, 5′-GAC CCG ACA CGC AAG ACA GGT TCA CA-3′; p6as, 5′-GTG TCG GGT CAC TTC GTG CTG ATT-3′; p8as, 5′-GCG TAG TCA CAC ACG GGG CAG TTG AAC-3′; and p9as, 5′-CCA AAT GGC GAT TGA GGT GTT TGC-3′, whereA, B, and C denote the different 5′-UTRs;ATG is the translation initiation codon; single numbers 2–9 are the zinc finger motifs 2, 5, 6, 8, and 9;R1–R5 are rREST1-, rREST2-, rREST3-, rREST4-, and rREST5-specific transcripts; s is the sense strand; andas is the antisense strand.
Rat genomic DNA (250 or 500 ng) was used as a template for amplifications. Genomic PCR products were cloned into the pMOSBlueT vector and sequenced by the DNA sequencing system (AB, Perkin-Elmer, Emeryville, CA).
Pharmacological treatments. Adult male Sprague Dawley rats (body weight, 200–230 gm; Alab, Stockholm, Sweden) were used in all experiments. KA (0.35 μg/0.5 μl) or saline as a control was injected bilaterally in the brain lateral ventricle (Salin et al., 1995), and the animals were killed at the indicated times after the injections. All animal experiments were approved by the local ethical committee.
In situ hybridization. Serial coronal sections (14 μm) from fresh frozen adult rat brain were analyzed by in situ hybridization as described (Timmusk et al., 1993; Belluardo et al., 1997). Two different [α-35S]-labeled rREST cRNA probes were applied (riboprobes 4 and 11; described in RNase Protection Analysis and Fig. 1B). The hybridization specificity was confirmed by using [α-35S]-labeled sense riboprobes synthesized from the same templates. Both sense probes resulted in the hybridization signal equivalent to the background. Emulsion-dipped sections were developed after 6 weeks by using D-18 developer (Kodak, Rochester, NY), fixed, and counterstained with cresyl violet. Staining of the brain sections allowed us to distinguish large and weakly stained cells from small and strongly stained cells. The relative levels of rREST mRNA expression per cells were evaluated by counting the number of silver grains over individual cells with a computer-assisted image analysis system (IBAS I-II, Zeiss, Kontron, Munich, Germany). A correction factor for overlapping grains was applied. Labeled cells were defined on the basis that they showed more than five silver grains, as compared with the background, which was calculated by counting the grains around and close to labeled cells. Data are presented in an arbitrary semi-quantitative scale of labeling intensity. “Low intensity of labeling” (±) defined the amount of silver grains between the fixed minimum level and 10 grains per cell; “moderate intensity of labeling” (+) defined the number of grains between 10 and 20; “ high intensity of labeling” (++) defined the number of grains exceeding the maximum level selected for the moderate intensity.
Fig. 1.
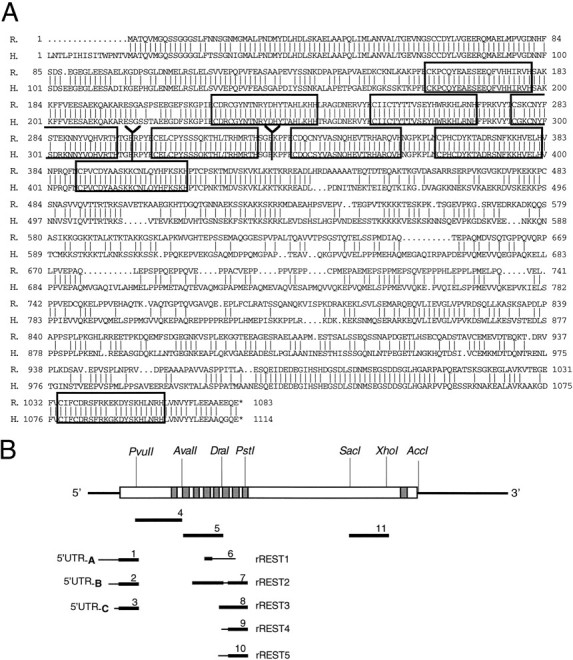
Primary structure of rREST cDNA and the predicted rREST protein. A, Optimized alignment of the rREST and human REST/NRSF/XBR amino acid sequences. Vertical linesindicate identical amino acid residues. Zinc fingers are boxed. Y marks the divergence of rREST from rREST1trunc and rREST2–5trunc. Stop codons are indicated by an asterisk.B, Schematic representation of rREST full-length cDNA encoding rREST protein with nine zinc finger motifs. Zinc finger motifs are shown as vertical gray bars. The long unfilled box indicates ORF. 5′- and 3′-UTR regions are indicated as thick lines. cRNA probes used in Southern analysis, RNase protection assays, and in situhybridization are shown below in relation to the rREST cDNA. Thin lines in the cRNA probes correspond to the unique parts of respective rREST transcripts. R., Rat;H., human. The nucleotide sequences of rREST cDNAs have been submitted to GenBank under accession numbers AF 037199, AF 037200, AF 037201, AF 037202, and AF 037203.
Cell culture, DNA transfection, and CAT assays. Mouse Neuro-2A and rat C6 cell lines were grown in DMEM supplemented with 10% fetal bovine serum. Primary cell cultures of hippocampal and cortical neurons and astrocytes were prepared as described earlier (O’Malley et al., 1994). For transfection experiments the following DNA constructs were made. MseI/ScrFI fragment located at 1873–1964 bp within BDNF promoter II region and containing the palindromic NRSE sequence (Timmusk et al., 1993) was cloned into pBLtkCAT vector (Luckow and Schutz, 1987; Jacoby et al., 1989) upstream of the thymidine kinase promoter (pNRSEBDNFCAT) intoSalI site. rREST expression deletion mutants rREST402D, rREST2–5trunc, and rREST1truncare original cDNA clones from the second screening that were cloned into pcDNA3 (Invitrogen, San Diego, CA). Neuro-2A and C6 cell lines were transfected by the calcium phosphate precipitation method, as described previously (Timmusk et al., 1993; Chiaramello et al., 1995). Freeze–thaw lysates of cells collected 48 hr after the transfection were assayed for CAT activity as described (Pothier et al., 1992). At least two different DNA preparations were tested for each plasmid. To normalize the transfection efficiencies, we cotransfected cells with pON260 expressing β-galactosidase (Spaete and Mocarski, 1985). Quantification of the acetylated ratios was performed with PhosphorImager, using ImageQuant software (Molecular Dynamics). All CAT activities were normalized to total protein and β-galactosidase activity.
Electrophoretic mobility shift assay. Recombinant proteins of rREST and rREST deletion mutants were produced by coupled in vitro transcription and translation with a rabbit reticulocyte lysate according to the manufacturer’s protocol (Promega). The following oligonucleotides, NRSE1s, 5′-GGCGAGCAGAGTCCATTCAGCACCTTGGACAGAGCCAGCGG-3′; NRSE1as, 5′-CCGCTGGCTCTGTCCAAGGTGCTGAA-3′; NRSE2s, 5′-CAGCCAGCGGATTTGTCCGAGGTGGT-3′; and NRSE2as, 5′-CCTGGATGAAGTACTACCACCTCGGACAAATCCGCTGGCTC-3′, corresponding to the upper and lower half sites of NRSEbdnf palindrome, were synthesized (Eurogentec) as paired sense and antisense oligonucleotides, annealed, and filled at their 3′ recessed ends, using Klenow enzyme (United States Biochemicals, Cleveland, OH) to create double-stranded unlabeled specific competitors NRSE11 and NRSE21. To prepare [α-32P]dCTP-labeled NRSEbdnf probe, we cleaved the pNRSEBDNFCAT plasmid withHindIII/XbaI and labeled it with Klenow enzyme (United States Biochemicals). Mobility shift assays were performed as described (Chiaramello et al., 1995).
RESULTS
Cloning of rat zinc finger transcription factor REST/NRSF/XBR (rREST)
A randomly primed cDNA library prepared from poly(A+) RNA of the rat Raphe nucleus-derived cell line (RN33B) (Whittemore and White, 1993) was screened at low stringency with the human REST/NRSF/XBR full-length cDNA (Chong et al., 1995). Sequence analysis revealed that the isolated cDNA clones showed a high degree of sequence similarity with the human REST/NRSF/XBR cDNA in the zinc finger cluster region and apparently encoded the rat homolog of REST/NRSF/XBR (rREST). Several clones differed in their 5′ sequences upstream of the first ATG, defined by analogy to the human REST/NRSF/XBR translation initiation sequence. Altogether, three different 5′-UTRs were identified (designated as types A, B, and C). A majority of the clones shared type A 5′-UTR that showed some homology to the human NRSF cDNA 5′ region (GenBank accession number U13879). Three cDNA clones shared type B 5′-UTR of various lengths. One clone contained the type C 5′-UTR, presumably referring to the rare use of this type 5′-UTR. All of the different 5′ regions extended the open reading frame (ORF) by 9 bp, preceded by the termination codon and 5′-UTRs of various lengths. A combination of the sequences of several rREST cDNAs formed an ORF that predicted a protein of 1083 amino acids with nine zinc finger motifs (Fig.1). However, one of the clones, rREST1, showed an in-frame termination codon immediately after the region encoding zinc finger 4, predicting a truncated form of rREST protein with four zinc fingers. A search of the GenBank expressed sequence tags (EST) database revealed that a human EST sequence (GenBank accession number U13877) differs from the human REST/NRSF/XBR cDNA sequence precisely in the same nucleotide position as rREST1 cDNA from the full-length rREST cDNA (Fig. 1A). This finding suggested a general mechanism of REST/NRSF/XBR gene regulation that is conserved across species.
The deduced amino acid sequence of rREST, as compared with the human REST/NRSF/XBR protein sequence, is shown in Figure1A. The ORF of rREST is overall 75% identical with the ORF of the human REST/NRSF/XBR at the nucleic acid level. At the amino acid level these two proteins share 70% identity. Like the human REST/NRSF/XBR, rREST gene encodes a protein with the cluster of eight zinc finger motifs located in the N terminus and a distinct ninth zinc finger motif in the C terminus. Zinc finger motifs of REST/NRSF/XBR are highly conserved between rat and human, the difference being in few, albeit nonconserved, amino acid substitutions in the finger motifs 4 and 5. Zinc finger motifs of the rREST and mouse REST/NRSF/XBR (GenBank accession number U13878) proteins are 100% conserved. Sequence analysis of the region separating the N- and C-terminal zinc finger clusters of rREST reveals 67% identity at the nucleic acid level and 54% identity at the amino acid level, as compared with the corresponding area in human REST/NRSF/XBR. This region shows a high proportion of proline and acidic amino acid residues but no repetitive proline-enriched motifs, characteristic for the human REST/NRSF/XBR. The differences in the secondary structure of the proline-rich region between species could be compensated by similar higher order structural folding if this region in human REST/NRSF/XBR and rREST proteins forms a functionally conserved interaction surface. Protein divergence between species is quite common to the family of zinc finger transcription factors, reflecting the process of evolution from a common ancestor. The human and mouse Krüppel-like ortholog (MOK-2) genes present one of the most extreme examples of the process of evolutionary divergence. These genes encode functionally different zinc finger transcription factors attributable to the loss of part of the gene that corresponds to the activator domain in the mouse MOK-2 protein (Ernoult-Lange et al., 1995).
Putative PEST-like sequences that have been found in proteins destined to rapid degradation, with intracellular half-lives of less than 2 hr (e.g., transcription factors E1A, c-myc,p53, c-fos, and v-myb) (Rogers and Rechsteiner, 1986; Rechsteiner and Rogers, 1996), are identifiable throughout the rREST protein. The most distinct PEST sequence is located between the amino acids 668 and 727 in the proline-enriched region with a PEST–FIND score of +16.4, which is considered a significant value to denote the region of proteolytic targeting (Rechsteiner and Rogers, 1996). This feature strongly suggests that rREST as a transcription factor may have rapid turnover, and/or its activity may be post-translationally regulated by proteolysis.
REST/NRSF/XBR mRNA is expressed in the neurons of adult rat brain
According to previously reported data, REST/NRSF/XBR mRNA is expressed in most non-neuronal tissues throughout development (Chong et al., 1995; Schoenherr and Anderson, 1995a; Scholl et al., 1996), whereas in the nervous system the expression is restricted to defined populations of undifferentiated neuronal progenitors (Chong et al., 1995; Schoenherr and Anderson, 1995a). Our Northern blot analysis confirmed the earlier findings showing that rREST mRNA levels decrease during brain development. However, we also could detect the expression of rREST gene in adult rat CNS. rREST transcript of 7–8 kb was present at variable levels in spinal cord and all brain regions studied (e.g., striatum, thalamus/hypothalamus, pons/medulla, hippocampus, cerebellum, midbrain, septum, olfactory bulb, cerebral cortex, and colliculi) (Fig.2).
Fig. 2.

Northern blot analysis of rREST mRNA expression. Poly(A+) RNA (10 μg) isolated from the indicated rat brain regions, peripheral tissues, and rat C6 glioma cells was electrophoresed in the agarose gel, transferred to Hybond N+ filter, and hybridized to the rREST cDNA fragment covering the region between zinc finger motifs 2 and 8.A, rREST mRNA expression in various regions of adult rat brain and in rat C6 glioma cells. B, rREST mRNA expression in non-neuronal tissues (testis, spleen, and muscle) and during the development of brain and spinal cord. The position of rREST mRNA-specific signal and migration of 28S ribosomal RNA are indicated. Integrity of RNAs was checked by reprobing the blot with a GAPDH cDNA probe. C6, Rat C6 glioma cell line; str,striatum; thal, thalamus; p/m,pons/medulla; hc, hippocampus; cblm,cerebellum; v midbr, ventral midbrain;sept, septum; o bulb, olfactory bulb;ctx, cerebral cortex; coll, colliculi;spc, spinal cord; E, embryonic day;P, postnatal day; ad, adult.
In situ hybridization was used to study the cellular localization of rREST mRNA expression in the adult rat brain. Hybridization with two different cRNA probes (see Materials and Methods and Fig. 1B) resulted in identical labeling. Widespread expression of rREST mRNA was observed in cells displaying neuronal profile (large cells with weakly stained nuclei) (Table1; Figs. 3,4). In the olfactory system, diffuse labeling was seen in the granule cell layer (Fig. 4A) and in the plexiform layers. The cerebral cortex showed labeled neurons in all cortical layers (Figs. 3C, 4C). In the hippocampal formation the granular neurons in the dentate gyrus and the neurons of the pyramidal layers were labeled (Figs. 3D,4B,D). In the basal ganglia the regions of the caudate putamen, the globus pallidus, and the accumbens showed no rREST-specific signal. In the septum and basal forebrain only very few labeled cells were observed. Labeled cells were found over the hypothalamic nuclei and the nuclei of the preoptic area. rREST mRNA was found to be expressed in most of the thalamic nuclei, particularly in the dorsal nuclei (Fig. 3E). In the mesencephalon the neurons of the substantia nigra pars compacta (Figs. 3F,4G) and the neurons of the ventral tegmental area and of the red nucleus (Fig. 3G) were found to be positive for rREST mRNA, whereas tegmentum and tectum showed diffuse labeling. In the cerebellar cortex rREST-specific signal was seen over the granular cell layers, with distinct labeling in the cells along the border between the granular and molecular layers (Figs. 3H,4E). Scattered cells were labeled in the molecular layer of cerebellum. The deep cerebellar nuclei also showed labeled cells (Fig. 3I). rREST signal-positive cells were found in most nuclei of pons, like the pontine nuclei (Fig.3J), nucleus trapezoid body (Fig.3K), and in the reticular nuclei (Fig.4F). rREST mRNA-specific signal was seen virtually in all of the nuclei of the myelencephalon.
Table 1.
rREST mRNA expression in the adult rat brain
| Brain structure | Intensity of labeling per cell |
|---|---|
| Olfactory system | |
| Granular and plexiform layers of olfactory bulb | ++ |
| Olfactory nerve layer | + |
| Neocortex | ++ |
| Hippocampal formation | |
| Dentate gyrus | ++ |
| CA1–CA4 | ++ |
| Basal ganglia | − |
| Septum and basal forebrain | ± |
| Hypothalamus and preoptic area | + |
| Thalamus | |
| Reticular thalamic nucleus | + |
| Anteromedial and dorsal tha lamic nuclei | ++ |
| Ventral thalamic nuclei | + |
| Habenular nucleus | ++ |
| Mesencephalon | |
| Substantia nigra compacta/retic ular | ++ |
| Ventral tegmental area | + |
| Interpendunuclar nucleus | + |
| Supramamillary nucleus | + |
| Superior colliculus | ± |
| Red nucleus | ++ |
| Cerebellum | |
| Granular layer | + |
| Cells adjacent to the Purkinje layer | ++ |
| Deep cerebellar nuclei | ++ |
| Purkinje cell layer | ± |
| Pons | |
| Pontine reticular nucleus | ++ |
| Pontine nuclei | ++ |
| Trapezoid body nucleus | ++ |
| Motor trigeminal nucleus | ++ |
| Reticular nuclei | ++ |
| Spinal trigeminal nucleus | + |
| Facial nucleus | ++ |
| Myelencephalon | ++ |
| Non-neuronal cells | |
| Choroid plexus | ++ |
| Ependymal cells | ++ |
| Meninges (Pial) | + |
Semi-quantitative autoradiographic analysis of rREST mRNA-labeled cells in the rat brain. ++, High; +, moderate; ±, low intensity of labeling per cell; −, negative.
Fig. 3.
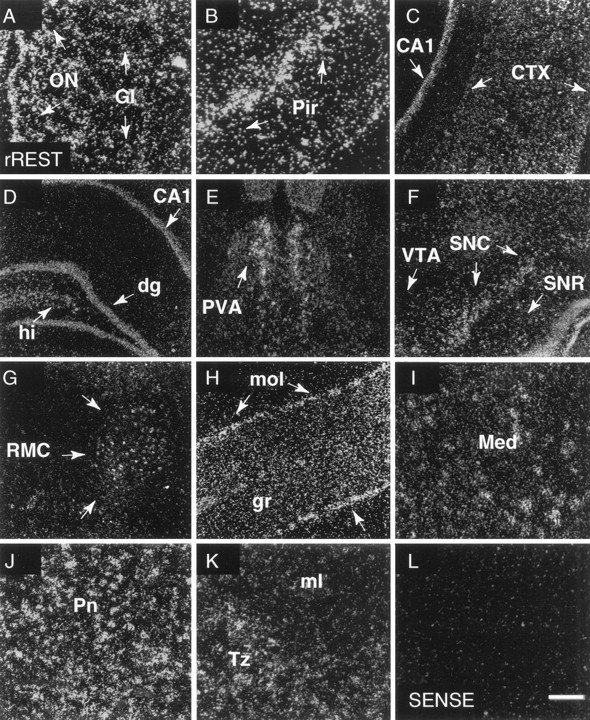
In situ hybridization analysis of rREST mRNA expression in the adult rat brain. Shown are dark-field emulsion autoradiographs obtained after hybridization of coronal sections of adult rat brain with the [α-35S]-labeled rREST cRNA probe corresponding to the region upstream of zinc finger 9 (riboprobe 11; see Materials and Methods and Fig.1B). rREST mRNA-specific labeling is shown inA, olfactory bulb; B, piriform cortex;C, cerebral cortex; D, hippocampus;E, paraventricular nucleus of thalamus;F, ventral midbrain; G, red nucleus;H, cerebellar cortex; I, deep cerebellar nuclei; J, pontine nuclei; and K, nucleus trapezoid body. L, Section of brain area shown inH hybridized with sense RNA probe. Exposure time was 6 weeks. ON, Olfactory nerve layer; Gl, glomerular layer; Pir, piriform cortex;CTX, cerebral cortex; CA1, CA1 region of the hippocampus; dg, dentate gyrus of the hippocampus;hi, hilar region of the dentate gyrus;PVA, paraventricular thalamus nucleus anterior;VTA, ventral tegmental area; SNC, substantia nigra compacta;SNR, substantia nigra reticular; RMC, red nucleus magnocellular; mol and gr, molecular and granular layers of the cerebellar cortex;Med, medial cerebellar nucleus; Pn, pontine nuclei; Tz, nucleus trapezoid body;ml, medial lemniscus. Arrowheads inH indicate labeled cells along the border between the granular and molecular layers of cerebellar cortex. Scale bar: 200 μm in C, E, F, L; 100 μm in A, B, D, G, H, I–K.
Fig. 4.
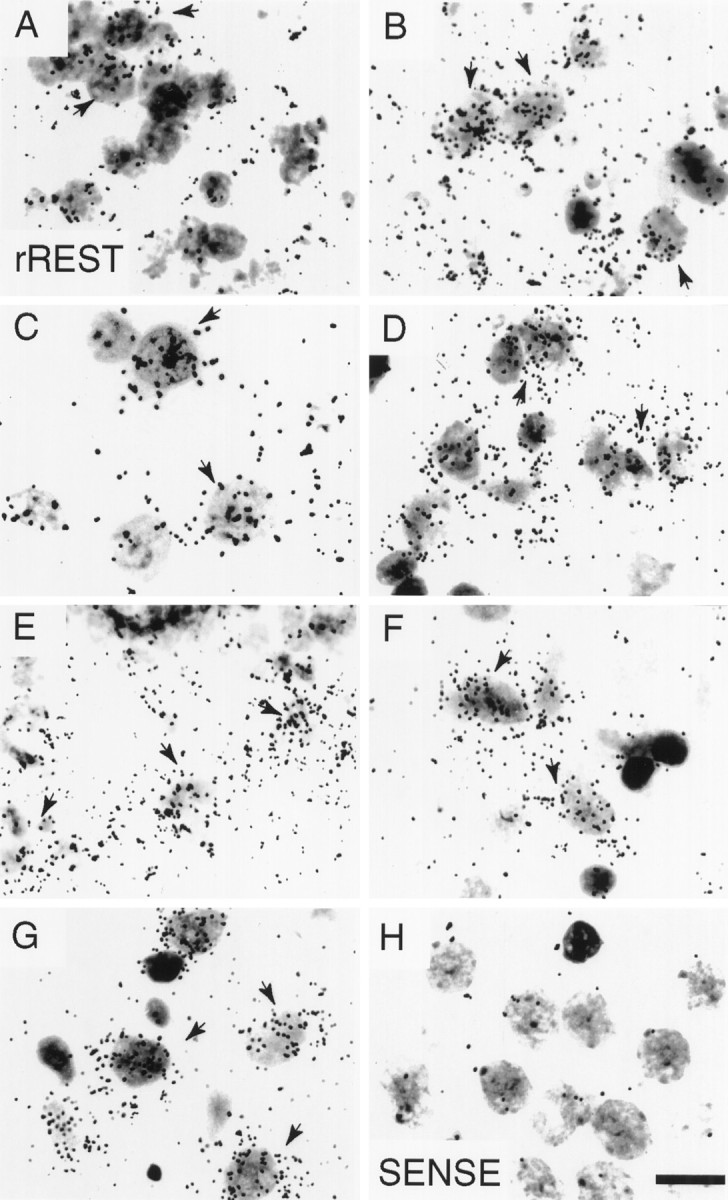
Cellular localization of rREST mRNA in the adult rat brain by in situ hybridization. Shown are bright-field emulsion autoradiographs obtained after hybridization of coronal sections of adult rat brain with the [α-35S]-labeled rREST cRNA probe corresponding to the region upstream of zinc finger 9 (riboprobe 11; see Materials and Methods and Fig. 1B). Shown is rREST-specific labeling in the cells of the following: A, granular layer of olfactory bulb; B, dentate gyrus of hippocampus; C, cerebral cortex; D, CA1 pyramidal layer of hippocampus; E, along the border between the granular and molecular layers of the cerebellar cortex;F, gigantocellular reticular nucleus; andG, substantia nigra pars compacta. A section hybridized with the sense RNA probe is shown in H, corresponding to the brain area shown in F. Exposure time was 6 weeks.Arrows point to dense accumulations of silver grains over individual cells. Scale bar, 12 μm.
rREST mRNA was not detected in the cells with glial profile (small cells with strongly stained nuclei), with the exception of the olfactory nerve layer (Fig. 3A), which contains only the axons of olfactory neurons and glial cells. In the non-neural cells of brain the choroid plexus showed high intensity of labeling for rREST mRNA. The ependymal cells and meningeal cells (pial cells) also exhibited intense signal (Table 1).
Alternative REST/NRSF/XBR transcripts show different levels of abundance in adult rat brain
We determined the levels of rREST mRNA at different stages of development in various tissues, using quantitative RNase protection assay (RPA; see Materials and Methods and Fig.5A). Based on these data, the levels of rREST mRNA are highest at the embryonic stages and decrease continually with age; however, the extent of the decrease is different in brain, as compared to non-neuronal tissues. Comparison of the levels of rREST mRNA at the embryonic stages with those seen in adult revealed a fivefold decrease in brain in contrast to a twofold decrease in lung, kidney, and heart. In absolute amounts each cell expresses ∼100 molecules of rREST mRNA in E13 brain, in E16 heart and lung, and in E19 kidney. In adult heart, lung, and kidney the amount of rREST transcripts has decreased to ∼50 molecules per cell. In the adult rat the highest levels of rREST mRNA were found in thymus, which expresses ∼200 rREST transcripts per cell. Quantification revealed that in the adult brain each cell expresses ∼20 molecules of rREST mRNA, which is 10 times less than in adult thymus or 2.5 times less than in the adult heart, lung, and kidney. For comparison, the levels of brain-derived neurotrophic factor (BDNF) mRNA transcribed from the NRSE-containing promoter II are ∼35 molecules per cell in the adult brain (Timmusk et al., 1994). This shows that a potential target gene of rREST is expressed at levels similar to rREST in the brain.
Fig. 5.

Analysis of rREST mRNA expression by RNase protection assay. A, Expression of rREST1 mRNA and all other rREST transcripts (denoted as rREST) in rat brain, in peripheral tissues, and in cultured hippocampal and cortical neurons. B, Expression of rREST transcripts with 5′-UTRs of type A (panel one),B (panel two), andC (panel three) during rat brain development and in peripheral tissues. C, Top panel, Expression of rREST transcripts exhibiting alternative splicing in the region spanning zinc fingers 5 and 6. Thearrow indicates the protected fragment that consists of a mixed population of transcripts rREST2, rREST3, rREST4, and rREST5.Middle panel, Expression of rREST4 mRNA, as compared with the expression of all other rREST transcripts (denoted asrREST). All bottom panels ofA, B, and C show the levels of GAPDH mRNA in the RNA samples that were analyzed. Total cellular RNA (20 μg in A and B; 40 μg in C) from each tissue or cultured primary neurons was analyzed by RPA. The cRNA probes that were used include the following (see Materials and Methods and Fig. 1B).A, rREST1 cDNA fragment encompassing zinc finger motifs 2–4 and the unique 3′-UTR of rREST1 cDNA (riboprobe 6).B, First panel, rREST cDNA fragment with type A (riboprobe 1); second panel, type B; third panel, type C (riboprobe 3) 5′-UTRs. C,First panel, rREST cDNA fragment spanning the region between zinc finger motifs 2 and 6 (riboprobe 5); second panel, rat REST4-specific cDNA fragment (riboprobe 9). Specific protected fragments are indicated on the left of each panel. E, Embryonic day; P, postnatal day; ad, adult; H, heart;K, kidney; L, lung; ctx,cerebral cortex; E17 hc, cultured hippocampal neurons;E16 ctx, cultured cortical neurons; ch plex, choroid plexus; astrocytes, cultured hippocampal astrocytes; tRNA, yeast tRNA as a negative control; B+C, mixed population of rREST transcripts with 5′-UTRs of types B and C; A+C, mixed population of rREST transcripts with 5′-UTRs of types A and C; A+B, mixed population of rREST transcripts with 5′-UTRs of types A and B.
We also examined the relative amount of each of the alternative splice variants in the composite pattern of rREST mRNA expression. First, we examined the possibility of tissue-specific expression of rREST transcripts with three different 5′-UTRs. Assessment of mRNA levels by RPA analysis revealed that rREST transcripts with type A 5′-UTR were most abundant (∼80% of all of the transcripts) and with type C 5′-UTR were least abundant (∼1% of all of the transcripts) in all analyzed tissues, including brain. Although Figure 5Bdepicts only a few examples from the variety of tissues analyzed, we could not detect tissue-specific or developmental stage-specific expression of any of the 5′-UTR-specific transcripts in other tissues analyzed (thymus, spleen, testis, ovary, muscle, liver, and different brain regions).
Next, we investigated the expression pattern of rREST1 mRNA. RPA analysis revealed that uniformly low levels of rREST1 mRNA are present in all tissues that were analyzed. In adult brain rREST1 mRNA constitutes ∼10% and in non-neuronal tissues ∼5% of the total rREST mRNAs (Fig. 5A). Because rREST1 mRNA is of relatively low abundance, RT-PCR was performed to examine which of the 5′-UTRs are included in rREST1 mRNAs. RT-PCR analyses of RNA from embryonic or adult brain and thymus and sequence analyses of the PCR products showed that rREST1 transcripts with all of the different 5′-UTRs are present in the tissues that were analyzed. Using RT-PCR, we analyzed brain and thymus RNA with the rREST1 3′-UTR-specific primer in combination with primers specific for zinc fingers 5, 6, 8, and 9 (see Materials and Methods and Fig. 8A) to ascertain that rREST1 cDNA was not a partially spliced transcript. Primer pairs that would amplify the corresponding fragments of full-length rREST mRNA were used as controls. No amplification products were detected with rREST1-specific primer combinations.
Fig. 8.

Structure of the rREST gene and alternative transcripts. A, The structural organization of rREST gene determined by PCR analysis of genomic DNA. Exons are shown asboxes, and introns are shown as lines. The numbers above the introns indicate their respective sizes. Short black bars with primer-specific identification symbols shown above orbelow the exons indicate the position of the sense or antisense primers used in PCR analyses. The putative extension of exon IV is shown with the dashed stroke. The vertical gray bars indicate zinc finger motifs. Exon numbers inbold Roman characters from I toVI are shown below the respective exons; the neural-specific exon located between exons V andVI is indicated as N. The schematic representation of rREST transcripts in relation to the gene is shownbelow the gene structure. Alternatively spliced rREST transcripts are shown. 5′-UTRs of types A, B, and C are indicated asopen boxes. Dashed lines and linesindicate the regions that are spliced out from the primary transcripts.Dashed lines also show the usage of alternative 5′-UTRs. 3′-UTRs are shown as open boxes with dashed strokes. The ORF of each rREST transcript is indicated as afilled box. B, Alternative splice sites for exons V, N, and VI. Exon sequences are given in capital letters and areboxed. Alternatively spliced sequences are indicated asstriped boxes. Lines indicate the regions that are spliced out of the primary transcript. rREST4 and rREST5 transcripts are the products of neuron-specific splicing with the insertion of either partial or entire exonN, shown as striped boxes between exonsV and VI. C, Partial alignment of rREST cDNAs in the region that follows zinc finger 4 (rREST1) or zinc finger 5 motif (rREST2–5), where the introduced termination codons lead to altered ORFs. The amino acid sequences of the predicted proteins are shown. The termination codons are indicated by anasterisk.
However, two distinct PCR products differing in size by ∼30 bp were identified in the cDNA of brain while the regions from zinc finger 2 to zinc finger 6 or from zinc finger 2 to zinc finger 8 (p2s–p6as and p2s–p8as; see Materials and Methods) were amplified. Sequence analysis revealed that some of the PCR clones represented unique rREST transcripts with either partial loss of the coding sequences (rREST3) or short insertions of novel sequences (rREST2, +4 bp; rREST4, +16 bp; and rREST5, +28 bp) in the region encoding the spacer between zinc finger motifs 5 and 6 (Fig.8B). All three different insertions as well as the novel deletion led to translational frame shifts that predict truncated forms of rREST protein with five zinc finger motifs (Fig.8B,C). The expression levels of rREST splice variants encoding truncated proteins were analyzed by RPA, using the probe spanning the spacer region between zinc fingers 5 and 6 (riboprobe 5; see Materials and Methods and Fig. 1B). A fully protected fragment (360 bp) corresponding to the full-length rREST mRNA was seen in all tissues that were analyzed, whereas a shorter (346 bp) fragment was detected specifically in neural tissues (various brain regions and during brain development; Fig. 5C). The shorter protected fragment represented a mixed population of rREST2, rREST3, rREST4, and rREST5 transcripts that diverge from the full-length rREST mRNA in a defined residue after zinc finger 5 motif. RPA analysis of rREST4 mRNA revealed its neural-specific expression pattern, with the highest levels in embryonic brain (∼1% of total rREST mRNA) and in the cultured cortical neurons (∼30% of total rREST mRNA), whereas no expression was detected in non-neuronal tissues and in the cultured astrocytes (Fig. 5C). Because of the detection limit of RPA method, we were not able to detect rREST2, rREST3, and rREST5 mRNAs, indicative of their extremely low abundance. RT-PCR analyses of RNA from several tissues confirmed the neural-specific expression of rREST4 and rREST5 mRNAs and identified the presence of rREST2 and rREST3 mRNAs in all analyzed tissues of both neuronal and non-neuronal origin (Fig.6A). By means of RT-PCR we also established that these low-abundant rREST transcripts had no bias for any particular 5′-UTR sequence (Fig. 6B).
Fig. 6.

RT-PCR analysis of the expression of rREST transcripts encoding truncated rREST protein isoforms with five zinc finger motifs. Shown are ethidium bromide stains of 2% agarose gels. Poly(A+) RNA (500 ng) was reverse-transcribed; 35 cycles of PCR amplification were performed in A, and 45 cycles were performed in B. Each lane contains one-fifth of the RT-PCR reaction. A, Expression of rREST2, rREST3, rREST4, and rREST5 mRNAs during rat brain development and in non-neuronal tissues. Note that rREST2 and rREST3 mRNA are expressed during brain development and in non-neuronal tissues, whereas expression of rREST4 and rREST5 mRNA is detected exclusively in the brain at different stages of development. RT-PCR analysis was performed by using primer sets specific to rREST2 mRNA (p2s–pR2as), rREST3 mRNA (p2s–pR3as), rREST4 mRNA (p2s–pR4as), and rREST5 mRNA (p2s–pR5as) (see also Materials and Methods and Fig. 8A). B, Expression of rREST2, rREST3, rREST4, and rREST5 mRNAs with different 5′-UTRs of type A (lanes 1–3), type B (lanes 4–6), and type C (lanes 7–9) in the brain (lanes 1, 4, 7) and thymus (lanes 2, 5, 8). Note that all of these truncated rREST transcripts exhibit no bias for any particular 5′-UTR sequence. RT-PCR analyses that were performed are not quantitative and show only the presence or absence of the rREST transcripts analyzed. Primer combinations that were used include the following (see also Materials and Methods and Fig. 8A): lanes 1–3,pAs in combination with pR2as, pR3as, pR4as, or pR5as; lanes 4–6,pBs in combination with pR2as, pR3as, pR4as, or pR5as; lanes 7–9,pCs in combination with pR2as, pR3as, pR4as, or pR5as. −RT in A andlanes 3, 6, and 9 in B are negative controls for which no cDNA was added to the PCR reaction.
Our data show that the expression levels of different rREST transcripts in the brain are in the following rank of abundance: rREST (90% of all rREST transcripts) > rREST1 (∼10%) > rREST4 (1%) > rREST2 = rREST3 = rREST5 (each < 0.1%). In the non-neuronal tissues, approximate levels of rREST transcripts are rREST (95%) > rREST1 (∼5%) > rREST2 = rREST3 (each ≤ 0.1%). These relative levels of abundance, together with the in situ hybridization data, suggest that the major transcript expressed in neurons encodes rREST protein with nine zinc fingers.
Structure of the rat REST/NRSF/XBR gene
The possibility that different transcripts could be generated by alternative splicing motivated us to characterize the rREST gene structure. The human REST/NRSF/XBR mRNA has been shown previously to be encoded by a single-copy gene (Scholl et al., 1996). Southern blot analysis of rat genomic DNA at high- and low-stringency conditions with different probes showed that rREST is encoded by a single-copy gene (Fig. 7). Because all the signals detected at low-stringency washing conditions also were seen after high-stringency washes, we concluded that the REST/NRSF/XBR has no close homologs in the rat genome. Alternatively, if rREST homologs exist, they would share low relatedness within the zinc finger region, which, however, remained below the detection limit of our Southern hybridization method.
Fig. 7.

Southern blot analysis of rREST gene. Rat genomic DNA was digested with the indicated restriction enzymes. Two identical filters were hybridized with probes corresponding to different regions of rREST cDNA. Left, Hybridization with the 460 bpPvuII/AvaII rREST cDNA fragment (riboprobe 4; see Materials and Methods) spanning the region encoding part of the N terminus up to the zinc finger 2 motif.Right, Hybridization with the 360 bpAvaII/DraI rREST cDNA fragment (riboprobe 5; see Materials and Methods) covering the region from the zinc finger 2 motif up to the zinc finger 6 motif. The detection of two genomic DNA fragments of different sizes in both lanes of the right panel indicates that at least one intron is present in the region encoding the N-terminal zinc finger cluster. The DNA molecular weight size markers (in kb) are indicated at left.
To characterize the structure of the rREST gene further, we applied long-distance PCR of rat genomic DNA, using primers specific for different 5′-UTRs, the region of translation initiation, and individual zinc finger motifs (see Materials and Methods and Fig.8A). Sequence comparison of the amplified genomic fragments with rREST cDNA revealed that rREST gene consists of at least six exons and identified the splice site sequences of exon/intron boundaries (Table2), which are all in agreement with the respective consensus sequences (Csank et al., 1990). The results of the structural analysis of rREST gene are depicted in Figure 8 and summarized as follows.
Table 2.
Intron/exon boundary sequences of the rat rREST gene
| Exon | Intron | Exon |
|---|---|---|
| I CCACCTAAGAGG/xxx … … | kb… … … … .xxxGCGAGCCCCGG | II |
| II GCCGGTAGCGAG/gtaacttccg … 0.3 | kb… … … … .xxxGGTGGCAGCGG | III |
| III GTGGCAACTGAG/gtgcgtgtggag … .1.2 | kb… . . tttatccag/CTACAGTTATG | IV |
| IV GAACTCACACAG/gtaagagagcct … .6.8 | kb… . . attttgcag/GAGAACGCCCT | V |
| V GTACTCACTCAG/GTTG/gtaagaga . . 5.2 | kb… . . atttactag/AGTGTGATCTA | N |
| N TTGGGTATGTATTCAG/gtagaattt . 0.8 | kb… . . tacctttag/GTGAGAAG/CCA | VI |
Positions of the introns are indicated in Figure 8. Exon sequences are shown in upper case and intron sequences in lower case. Bold lower case indicates conserved nucleotides found at intron/exon boundary. Bold upper case indicates alternatively spliced sequences of exons V, N, and VI. x denotes sequences not determined.
All of the different 5′-UTRs are encoded by separate exons (exons I, II, and III, respectively) and predisposed to alternative splicing (Table 2; Fig. 8A). We could not determine the size of the intron separating exon I encoding the type A 5′-UTR from exon IV encoding the beginning of the protein coding region, most likely attributable to its large size, because we could amplify fragments up to 15 kb by using the same genomic DNA as a template with other primer combinations. In contrast, the introns separating exon II (5′-UTR-B) from exon III and exon III (5′-UTR-C) from exon IV are relatively short, 1.5 and 1.2kb of length (Fig. 8A), respectively.
Exon IV (905 bp) is coding the region from the translation initiation codon up to the end of zinc finger 4 motif and is separated by a 7.5 kb intron from exon V. Exon V is 84 bp long and encodes the spacer between zinc fingers 4 and 5 and the entire zinc finger 5 motif. rREST1-specific 3′-UTR is encoded by intron IV (Fig.8B), suggesting a mechanism of splicing in which intron IV is retained in the moiety of mature rREST1 mRNA. Intron retention type splicing is suggested to be a rarely detected splicing phenomenon (Nakai and Sakamoto, 1994). Although the molecular basis for the rREST1 pre-mRNA processing still remains obscure, it results in the translational frame shift and predicts a rREST isoform (rREST1trunc), which is one-third of the size of rREST protein.
The intron separating exon V from exon VI is ∼6 kb long. Exon VI contains the region of rREST encoding zinc fingers 6–9 (Fig.8A). Alignment of different rREST cDNAs with the sequence of the intron separating exon V from exon VI revealed the following (Table 2; Fig. 8): (1) rREST2 containing a 4 bp (gttg) insertion originates from the usage of a cryptic splice donor site located immediately downstream from the authentic one, (2) rREST3 with partial loss of coding sequences (corresponding to amino acids 327–329) results from the usage of a cryptic splice acceptor site located within exon V, and (3) rRESTR4 and rREST5 are generated by alternative splicing of a neuron-specific (N) exon that is located 5.2 kb downstream of exon V and 0.8 kb upstream of exon VI. The varying length of the inserted exon N in the processed transcripts reflects the use of two different splice donor sites. All of these secondary splicing patterns lead to translational frame shifts and predict truncated isoforms of rREST protein with five zinc finger motifs.
Slow onset and prolonged activation of REST/NRSF/XBR gene after kainate-induced seizures
Neuronal activity has been shown to alter the expression of various genes in adult neurons. These alterations are thought to be involved in long-lasting or adaptive changes leading to synaptic reorganization (Ben-Ari and Represa, 1990) or persisting hyperexcitability (Meier et al., 1992) associated with LTP or epilepsy, accordingly. Because in certain experimental seizure models the transcription of some of the rREST target genes has been shown to be modified, we studied the effect of KA-induced seizures on the expression of rREST transcripts in the adult rat brain (Fig.9). RPA analyses revealed a similar pattern of induction of rREST1, rREST4, and rREST mRNAs in the hippocampus at 4 hr after injection of KA; the levels remained elevated up to 24 hr after treatment, the last time point analyzed (Fig.9A). Using in situ hybridization, we observed a pronounced increase in rREST mRNA levels in the hippocampal formation in the granular neurons of dentate gyrus at 4 hr after the injection of KA (Fig. 9B). At 24 hr, rREST mRNA levels in the dentate gyrus had decreased, whereas a significant increase in rREST mRNA levels was observed in the pyramidal layers CA1–CA4. Notably increased levels of rREST mRNA expression were seen also in the external and internal layers of cerebral cortex (Fig. 9B) and piriform cortex.
Fig. 9.

Expression of rREST mRNA in the hippocampus after kainic acid treatment. A, RPA of rREST1, rREST4, and rREST mRNA expression in the hippocampus at 2, 4, and 24 hr after KA-induced seizures. The amount of RNA used in RPA was 20 μg for rREST1 transcripts (riboprobe 6; see Materials and Methods and Fig.1B) and 40 μg for rREST4 transcripts (riboprobe 9; see Materials and Methods and Fig. 1B). Total RNA was isolated from the hippocampus of saline- or KA-treated animals. Protected fragments corresponding to rREST1, rREST4, rREST, and GAPDH mRNA are indicated. Saline treatment was performed for 2, 4, and 24 hr; no changes were detected in the expression levels of any of the rREST transcripts. B, Dark-field autoradiographs showing rREST mRNA-specific labeling in the adult rat brain at 4 and 24 hr after KA-induced seizures. Coronal sections were prepared at the level of dorsal hippocampus and hybridized with the rREST-specific cRNA probes (riboprobes 4 and 11; see Materials and Methods and Fig.1B). contr., Endogenous levels of corresponding rREST transcripts in hippocampus; saline,levels of rREST1, rREST4, and rREST transcripts 4 hr after saline treatment; KA, kainic acid; tRNA, yeast tRNA as a negative control; SENSE, section hybridized with the [α-35S]-labeled sense riboprobe;CP, choroid plexus; dg, dentate gyrus of the hippocampus; CTX, cerebral cortex;CA1, CA3, CA4, pyramidal layers CA1, CA3, and CA4 of the hippocampus.
REST/NRSF/XBR protein isoforms convey transcriptional repression
We generated a series of C-terminal deletion mutants that correspond to the predicted truncated forms of rREST protein to study their functional role, using transient expression assays. Expression plasmids of various rREST deletion mutants (see Materials and Methods) were cotransfected, along with the thymidine kinase (TK) promoter-based reporter construct (pNRSEBDNFCAT), in mouse neuroblastoma Neuro-2A and rat glioma C6 cells and were analyzed with chloramphenicol acetyltransferase (CAT) assays. pNRSEBDNFCAT contains a palindromic NRSE originating from the promoter II region of the rat BDNF gene (NRSEbdnf) (Timmusk et al., 1993) linked to the TK promoter.
First, we determined the levels of REST/NRSF/XBR mRNA in Neuro-2A and C6 cells. RPA analysis revealed that rREST full-length mRNA is the major transcript (∼200 molecules per cell) in C6 cells, whereas the major transcript in Neuro-2A cells is a splice variant that corresponds to the neural-specific rREST4 mRNA (∼50 molecules per cell). In Neuro-2A cells the REST/NRSF/XBR full-length mRNA was not detectable, even by means of RT-PCR method.
In Neuro-2A cells, increasing amounts of the plasmid encoding rREST protein led to the concentration-dependent repression of the pNRSEBDNFCAT activity (Fig.10A). Both deletion mutants of rREST corresponding to the natural truncated isoforms with five (rREST2–5trunc) or four zinc finger motifs (rREST1trunc) acted also as transcriptional repressors in Neuro-2A cells (Fig. 10B). Expression of rREST2–5trunc resulted in relatively weak (3.2-fold) repression, whereas expression of rREST1trunc resulted in strong repression (6.7-fold) of the pNRSEBDNFCAT promoter activity in Neuro-2A cells. Next, we tested the transcriptional activities of rREST deletion mutants in C6 cells in which the endogenous levels of rREST full-length mRNA are high. In C6 cells, overexpression of rREST and rREST2–5trunc resulted in relatively weak (3.7- and 2.7-fold, respectively) repression, as compared with overexpression of rREST1trunc, which resulted in strong repression (6.5-fold) of the reporter gene activity (Fig. 10B). To exclude the possibility that silencing activity resides in the pBLtkCAT vector backbone, we also performed transfection assays, using pBLtkCAT as a reporter gene. Our data revealed that repression mediated by rREST and its deletion mutants is attributable to NRSE in pNRSEBDNFCAT construct, because we could not detect any changes in TK promoter activity in response to the overexpression of rREST or its deletion mutants (data not shown).
Fig. 10.

Effects of rREST and rREST-truncated isoforms on pNRSEBDNFCAT promoter activity in Neuro-2A and C6 cells. A, rREST represses pNRSEBDNFCAT activity in a concentration-dependent manner. Transient transfection assays were performed in Neuro-2A cells, using 2 μg of pNRSEBDNFCAT and various amounts of plasmid encoding rREST protein, as indicated. Acetylated (Cm-3-Ac) and nonacetylated (Cm) forms of chloramphenicol are indicated on the left. CAT activity of pNRSEBDNFCAT in the presence of pcDNA3 alone was assigned a level of 100% activity. Repression (fold) is calculated as 100% ÷ CAT activity at a given plasmid concentration. Shown are the calculated values of one experiment; however, similar results were obtained in four independent experiments. B, Effects of rREST and rREST-truncated isoforms on pNRSEBDNFCAT activity. Shown is a schematic representation of rREST protein and the rREST-truncated isoforms; the last amino acid is indicated on the right, and the designation of the construct is shown on the left. Black boxes represent zinc fingers. The pNRSEBDNFCAT reporter plasmid was cotransfected with 15 μg of parental pcDNA3 or with 15 μg of recombinant expression vectors of rREST or rREST-truncated isoforms. In the table atright, the values denoting repression were calculated as described in A of this figure and represent averages of at least four independent experiments performed in triplicate. SEM is shown. C, Gel retardation assays showing the DNA binding activity of rREST isoforms (rREST1trunc andrREST2–5trunc), the deletion mutant with seven zinc fingers (rREST402D), and rREST protein to the wild-type palindromic NRSEbdnfsequence derived from the promoter II region of BDNF gene. The radiolabeled DNA fragment containing NRSEbdnf was incubated in the binding buffer with the in vitrotranslated protein products in the presence of the nonspecific competitor or 100-fold excess of the specific competitors, the unlabeled oligonucleotides corresponding to the upper (lane +11) or lower (lane +21) half site of NRSEbdnf. The DNA–protein complexes were resolved by native 5% PAGE electrophoresis. D, In vitro translation analyses of equimolar amounts of different rREST expression plasmids. [35S]methionine-labeled protein samples were analyzed by 12.5% SDS-PAGE electrophoresis. Molecular weight size standard markers are shown on theleft.
Because both truncated isoforms of rREST caused effects of similar magnitude in different cellular contexts, it suggests that truncated rREST isoforms convey repression independent of the transcriptional activities of endogenous rREST proteins. During the revision of this manuscript Tapia-Ramirez et al. (1997) identified the presence of two distinct repressor domains located at opposite ends of the REST/NRSF/XBR molecule, using the GAL4 expression system. Because the N terminus of REST/NRSF/XBR is highly conserved between rat and human (Fig. 1A), the repressor activity of rREST-truncated isoforms apparently originates from the N terminus.
We performed gel retardation assays to investigate whether rREST-truncated isoforms with four or five zinc fingers (rREST1trunc and rREST2–5trunc) are capable of binding to NRSEbdnf in vitro. As shown in Figure 10C, rREST with the intact nine zinc finger DNA binding domain and rREST deletion mutant with seven zinc fingers (rREST402D) could form sequence-specific retarded complexes with the upper half site of the palindromic NRSEbdnf motif. However, by means of our assay we were not able to detect any DNA–protein complexes in the samples containing rREST2–5trunc or rREST1trunc. Equimolar amounts of expression plasmids yielded similar amounts of proteins, as shown by in vitro translation analysis (Fig. 10D), indicating that the absence of shifted complexes was not attributable to the differences in the protein expression levels.
Taken together, these data suggest the following: (1) the truncated forms of rREST protein individually may affect gene transcription without interfering with rREST-mediated effects, and (2) loss of the region between zinc finger motifs 5 and 9 leads to the loss of binding of rREST protein isoforms to the NRSE of rat BDNF gene in vitro.
DISCUSSION
The main conclusions of the present study are the following: (1) alternative splicing is used in the regulation of rat REST/NRSF/XBR (rREST) gene to generate multiple transcripts with differential expression profiles; (2) different rREST splice variants are expressed in mature neurons of adult brain; (3) rREST mRNA levels are induced in the hippocampal and cortical neurons by neuronal activity; (4) alternatively spliced rREST transcripts encode protein isoforms that differ in their DNA binding specificity, and all mediate repression of transcription.
We show that rREST shares overall 70% amino acid identity with the human REST/NRSF/XBR protein, exhibiting poor homology in the region separating the N- and C-terminal zinc finger clusters (the amino acid identity is ∼50%). Partial analysis of the structural organization of the gene reveals the presence of three introns in the region encoding the N-terminal zinc finger cluster of rREST protein. Modular structure of rREST gene with separate exons encoding functionally defined domains reflects the divergent evolutionary origin of these distinct structural units. On the other hand, modular structure provides the basis for regulation of rREST gene expression by alternative splicing.
Our data reveal multiple splicing patterns of rREST pre-mRNA. Most striking is the finding that all of the different rREST splice variants are expressed in adult brain neurons. Another interesting finding is that the splicing pattern that involves the insertion of a short exon (exon N) is only characteristic to neurons and results in two neuron-specific splice variants, rREST4 and rREST5. rREST4 and rREST5 mRNAs encode truncated rREST protein isoforms with five zinc fingers as a result of the frame shift introduced by exon N. Neuron-specific splicing of short exons has been described, for example, inc-src (Levy et al., 1987; Martinez et al., 1987), trkA (Barker et al., 1993), and nonmuscle myosin heavy chain-B (MHC-B) genes (Takahashi et al., 1992). The biological significance of neuron-specific splicing in rREST gene regulation currently remains unclear, because the expression levels of exon N-containing rREST transcripts in adult rat brain are much lower than the levels of rREST transcripts in which exon N is not included. All other forms of rREST pre-mRNA splicing are common to structures of both neuronal and non-neuronal origin. The dominant splicing pattern involves exon N skipping and results in rREST transcript with the longest ORF. Of all of the rREST transcripts expressed in the brain, 90% exhibit exon N skipping and encode rREST protein with the DNA binding domain of nine zinc fingers. Two secondary patterns of splicing may occur simultaneously with exon N skipping. These are caused by the activation of cryptic splice sites and result in splice variants (rREST2 and rREST3) that encode truncated forms of rREST protein with the DNA binding domain of five zinc fingers. rREST2 and rREST3 show the lowest levels of expression of all of the rREST transcripts, both in neuronal and non-neuronal tissues. rREST1 mRNA, which encodes a protein with the DNA binding domain of four zinc fingers, also is widely expressed in neuronal and non-neuronal structures. The molecular basis for this type of splicing is currently unclear; however, it appears to be conserved across species because a human EST displays high sequence homology to the rREST1 cDNA.
Previous studies detected abundant expression of REST/NRSF/XBR mRNA in most of the non-neuronal tissues during development and also in undifferentiated neuronal progenitors, but not in differentiated CNS neurons. These results suggested that REST/NRSF/XBR is a transcription factor that controls neurogenesis (Chong et al., 1995; Schoenherr and Anderson, 1995a). Here, we propose that, in addition to its role during neurogenesis, REST/NRSF/XBR also is involved in maintaining neuronal identity by quantitatively modulating the expression level of its target genes. We provide several pieces of evidence to support this hypothesis.
First, we demonstrate that rREST mRNA is differentially expressed in the mature neurons of adult brain. The highest levels of rREST mRNA were detected in the neurons of hippocampus and the nuclei of pons/medulla and midbrain. Previous studies have shown that neuronal genes that contain NRSE-like sequences (Schoenherr et al., 1996) may convey NRSF/REST/XBR-mediated repression (Kraner et al., 1992; Mori et al., 1992; Pathak et al., 1994; Thiel et al., 1994; Lönnerberg et al., 1996; Mieda et al., 1996; Wood et al., 1996). Analyses of the data available in the literature about the expression profiles of REST/NRSF/XBR target genes revealed that expression of some of these genes (M4 muscarinic receptor, NMDAR1, and GABA-A receptor) is limited to the brain regions in which rREST mRNA is not expressed or expressed at low levels. For example, M4 muscarinic receptor mRNA is highly expressed in caudate putamen (Vilaro et al., 1991), where rREST mRNA is not detected. On the other hand, a majority of REST/NRSF/XBR target genes are expressed in most regions of adult brain. The high level of expression of these target genes is found mostly in the regions that exhibit low levels of rREST mRNA. The expression pattern of rREST mRNA shows an inverse correlation with the expression of NaCh II (Brysch et al., 1991), SCG10 (Himi et al., 1994), calbindin I (Abe et al., 1992), synaptotagmin IV (Berton et al., 1997), neuronal nicotinic ACh receptor β2 (Wada et al., 1989), and several other target genes in most structures of adult brain. NaCh II mRNA expression levels, for example, are highest in cerebellar granular neurons (Brysch et al., 1991), where rREST mRNA levels are low. Hippocampus is an exceptional structure in adult brain in which rREST and also many of its target genes show relatively high levels of expression. Because each of the target genes shows a unique expression pattern, we hypothesize that the effectiveness of REST/NRSF/XBR is affected by the presence and amount of cofactors and the affinity of interaction between REST/NRSF/XBR and a target gene. Accordingly, REST/NRSF/XBR may act at multiple concentration thresholds to control the level of expression of a target gene in different neuronal populations.
We also demonstrate that rREST mRNA levels are upregulated after KA-induced seizures. We show that KA-induced seizures result in elevated levels of different rREST transcripts, with the most pronounced increases in the neurons of hippocampus. The earliest induction of rREST mRNAs was detected in the granular neurons of dentate gyrus at 4 hr after treatment. Decreased expression in the dentate gyrus area and increased expression in the pyramidal layers CA1–CA4 is observed at 24 hr after kainate treatment. KA-induced seizures have been shown to induce the expression of several REST/NRSF/XBR target genes, such as BDNF (Zafra et al., 1990; Metsis et al., 1993), synaptotagmin IV (Vician et al., 1995), calbindin (Lee et al., 1997), NaCh II (Gastaldi et al., 1997), and others in the same neuronal populations. However, the induction of these genes precedes the induction of rREST gene, reaching a maximum at 3–6 hr after drug injection and then disappearing at ∼12 hr. This finding suggests that, if these phenomena are related causally, KA-induced seizures may evoke a REST/NRSF/XBR-mediated negative regulatory mechanism to suppress excessive expression of some of neuronal genes. Earlier studies have shown that enhanced neuronal activity leads to marked increases in the concentration of cytosolic calcium, which as a second messenger affects activity-dependent cell survival and modulates synaptic strength (for review, see Ghosh and Greenberg, 1995). Whether the prolonged activation of rREST gene in response to the enhanced neuronal activity reflects neuroprotection, synaptic reorganization, or any other cellular processes needs to be established.
Finally, the modular structure of rat REST/NRSF/XBR gene provides the basis for the relatively simple molecular changes leading to rREST isoforms, with different DNA binding activity and unique potential for various protein–protein interactions. Combining the expression data with the results of our functional studies, we suggest that REST/NRSF/XBR acts as a negative regulator of gene expression in neurons. Additionally, we suggest that REST/NRSF/XBR proteins with alterations in their DNA binding domain also mediate repression in neurons. REST/NRFS/XBR-mediated repression could be essential for differential expression of the target genes in different neuronal subpopulations. Hence, REST/NRSF/XBR could have a similar function in neurons as in non-neuronal cells. Several hypothetical mechanisms of how REST/NRSF/XBR may mediate negative regulation of gene transcription in neurons could be considered. For example, by analogy to theDrosophila segmentation gene Krüppel(Kr) (Sauer et al., 1995), REST/NRSF/XBR in DNA bound form may inhibit transcription by interacting directly with the essential components of the basal transcription machinery and may compete with positive factors. Alternatively, truncated REST/NRSF/XBR isoforms that do not effectively bind to DNA may form complexes with transcriptional activators and, by sequestering positive factors, block their activity, as it has been suggested for Id-like proteins (Benezra et al., 1990).
Footnotes
This work was supported by grants from Swedish Cancer Society, Swedish Research Council for Engineering Sciences, Swedish Medical Research Council, Funds from the Karolinska Institute, Karolinska Institute’s cooperation program with Baltic countries (KIRT), Tore Nilsson Foundation for Medical Research, and Lars Hierta Foundation. T.T. was supported by Swedish Medical Research Council, M.M. was partially supported by an International Research Scholars’ Award from Howard Hughes Medical Institute, and N.B. was supported by the Italian Consiglio Nazionale delle Richerche. We thank Dr. Carlos F. Ibañéz for RNA isolated from RN33B cells, Dr. Gail Mandel for human REST cDNA, and Dr. Beth-Anne Sieber for help in preparing neuronal cultures. We also thank Annika Ahlsen and Helene Vretman for the technical assistance and Lotta Johansson for secretarial assistance.
Correspondence should be addressed to Dr. T. Timmusk, Department of Developmental Neuroscience, Box 587, BMC, Uppsala University, S-751 23 Uppsala, Sweden. E-mail: tonis.timmusk@mun.uu.se
REFERENCES
- 1.Abe H, Watanabe M, Yamakuni T, Kuwano R, Takahashi Y, Kondo H. Localization of gene expression of calbindin in the brain of adult rats. Neurosci Lett. 1992;138:211–215. doi: 10.1016/0304-3940(92)90917-v. [DOI] [PubMed] [Google Scholar]
- 2.Barker PA, Lomen-Hoerth C, Gensch EM, Meakin S, Glass DJ, Shooter E. Tissue-specific alternative splicing generates two isoforms of the trkA receptor. J Biol Chem. 1993;268:15150–15157. [PubMed] [Google Scholar]
- 3.Belluardo N, Wu G, Mudo G, Hansson AC, Petterson R, Fuxe K. Comparative localization of fibroblast growth factor receptor -1, -2, and -3 mRNAs in the rat brain: in situ hybridization analysis. J Comp Neurol. 1997;379:226–246. [PubMed] [Google Scholar]
- 4.Ben-Ari Y, Represa A. Brief seizure episodes induce long-term potentiation and mossy fibre sprouting in the hippocampus. Trends Neurosci. 1990;13:375–403. doi: 10.1016/0166-2236(90)90135-w. [DOI] [PubMed] [Google Scholar]
- 5.Benezra R, Davis RL, Lockshon D, Turner DL, Weintraub H. The proteins Id: a negative regulator of helix-loop-helix DNA binding proteins. Cell. 1990;61:49–59. doi: 10.1016/0092-8674(90)90214-y. [DOI] [PubMed] [Google Scholar]
- 6.Berton F, Iborra C, Boudier J-A, Seagar MJ, Marqueze B. Developmental regulation of synaptotagmin I, II, III, and IV mRNAs in the rat CNS. J Neurosci. 1997;17:1206–1216. doi: 10.1523/JNEUROSCI.17-04-01206.1997. [DOI] [PMC free article] [PubMed] [Google Scholar]
- 7.Bessis A, Champtiaux N, Chatelin L, Changeux J-P. The neuron-restrictive silencer element: a dual enhancer/silencer crucial for patterned expression of a nicotinic receptor gene in the brain. Proc Natl Acad Sci USA. 1997;94:5906–5011. doi: 10.1073/pnas.94.11.5906. [DOI] [PMC free article] [PubMed] [Google Scholar]
- 8.Brysch W, Creutzfeldt OD, Luno K, Schlingensiepen R, Schlingensiepen K-H. Regional and temporal expression of sodium channel messenger RNAs in the rat brain during development. Exp Brain Res. 1991;86:562–567. doi: 10.1007/BF00230529. [DOI] [PubMed] [Google Scholar]
- 9.Chiaramello A, Neuman K, Palm K, Metsis M, Neuman T. Helix-loop-helix transcription factors mediate activation and repression of the p75LNGFR gene. Mol Cell Biol. 1995;15:6036–6044. doi: 10.1128/mcb.15.11.6036. [DOI] [PMC free article] [PubMed] [Google Scholar]
- 10.Chong JA, Tapia RJ, Kim S, Toledo AJ, Zheng Y, Boutros MC, Altshuller YM, Frohman MA, Kraner SD, Mandel G. REST: a mammalian silencer protein that restricts sodium channel gene expression to neurons. Cell. 1995;80:949–957. doi: 10.1016/0092-8674(95)90298-8. [DOI] [PubMed] [Google Scholar]
- 11.Csank C, Taylor FM, Martindale DW. Nuclear pre-mRNA introns: analysis and comparison of intron sequences from Tetrahymena thermophila to other eukaryotes. Nucleic Acids Res. 1990;18:5133–5141. doi: 10.1093/nar/18.17.5133. [DOI] [PMC free article] [PubMed] [Google Scholar]
- 12.Devereux J, Haerberli P, Smithies O. A comprehensive set of sequence analysis programs for the VAX. Nucleic Acids Res. 1984;10:387–395. doi: 10.1093/nar/12.1part1.387. [DOI] [PMC free article] [PubMed] [Google Scholar]
- 13.Ernoult-Lange M, Arranz V, Le Coniat M, Berger R, Kress M. Human and mouse Krüppel-like (MOK2) orthologue genes encode two different zinc finger proteins. J Mol Evol. 1995;41:784–794. doi: 10.1007/BF00173158. [DOI] [PubMed] [Google Scholar]
- 14.Feinberg AP, Vogelstein B. A technique for radiolabeling DNA restriction endonuclease fragments to high specific activity. Anal Biochem. 1983;132:6–13. doi: 10.1016/0003-2697(83)90418-9. [DOI] [PubMed] [Google Scholar]
- 15.Gastaldi M, Bartolomei F, Massacrier A, Planells R, Robaglia-Schlupp A, Cau P. Increase in mRNAs encoding neonatal II and III sodium channel α isoforms during kainate-induced seizures in adult rat hippocampus. Mol Brain Res. 1997;44:179–190. doi: 10.1016/s0169-328x(96)00199-4. [DOI] [PubMed] [Google Scholar]
- 16.Ghosh A, Greenberg ME. Calcium signaling in neurons: molecular mechanisms and cellular consequences. Science. 1995;268:239–247. doi: 10.1126/science.7716515. [DOI] [PubMed] [Google Scholar]
- 17.Himi T, Okazaki T, Wang H, McNeill TH, Mori N. Differential localization of SCG10 and p19/stathmin messenger RNAs in adult rat brain indicates distinct roles for these growth-associated proteins. Neuroscience. 1994;60:907–926. doi: 10.1016/0306-4522(94)90271-2. [DOI] [PubMed] [Google Scholar]
- 18.Jacoby DB, Zilz ND, Towle WC. Sequences within the 5′-flanking region of the S14 gene confer responsiveness to glucose in primary hepatocytes. J Biol Chem. 1989;264:17623–17626. [PubMed] [Google Scholar]
- 19.Kraner SD, Chong JA, Huey-Jen T, Mandel G. Silencing the type II sodium channel gene: a model for neural-specific gene regulation. Neuron. 1992;9:37–44. doi: 10.1016/0896-6273(92)90218-3. [DOI] [PubMed] [Google Scholar]
- 20.Lee S, Williamson J, Lothman EW, Szele FG, Chesselet MF, Von Hagen S, Sapolsky RM, Mattson MP, Christakos S. Early induction of mRNA for calbindin-D 28k and BDNF but not NT-3 in rat hippocampus after kainic acid treatment. Mol Brain Res. 1997;47:183–194. doi: 10.1016/s0169-328x(97)00043-0. [DOI] [PubMed] [Google Scholar]
- 21.Levy JB, Dorai T, Wang LH, Brugge JS. The structurally distinct form of pp60c-src detected in neuronal cells is encoded by a unique c-src mRNA. Mol Cell Biol. 1987;7:4142–4145. doi: 10.1128/mcb.7.11.4142. [DOI] [PMC free article] [PubMed] [Google Scholar]
- 22.Lönnerberg P, Schoenherr CJ, Anderson DJ, Ibañéz CF. Cell type-specific regulation of choline acetyltransferase gene expression. J Biol Chem. 1996;271:33358–33365. doi: 10.1074/jbc.271.52.33358. [DOI] [PubMed] [Google Scholar]
- 23.Luckow B, Schutz G. CAT constructions with multiple unique restriction sites for the functional analysis of eukaryotic promoters and regulatory elements. Nucleic Acids Res. 1987;15:5490. doi: 10.1093/nar/15.13.5490. [DOI] [PMC free article] [PubMed] [Google Scholar]
- 24.Martinez R, Mathey-Prevot B, Bernards A, Baltimore D. Neuronal pp60c-src contains a six-amino acid insertion relative to its non-neuronal counterpart. Science. 1987;236:411–415. doi: 10.1126/science.2440106. [DOI] [PubMed] [Google Scholar]
- 25.Meier CL, Obenaus A, Dudek FE. Persistent hyperexcitability in isolated hippocampal CA1 of kainate-lesioned rats. J Neurophysiol. 1992;68:2120–2127. doi: 10.1152/jn.1992.68.6.2120. [DOI] [PubMed] [Google Scholar]
- 26.Metsis M, Timmusk T, Arenas E, Persson H. Differential usage of multiple brain-derived neurotrophic factor promoters in the rat brain following neuronal activation. Proc Natl Acad Sci USA. 1993;90:8802–8806. doi: 10.1073/pnas.90.19.8802. [DOI] [PMC free article] [PubMed] [Google Scholar]
- 27.Mieda M, Haga T, Saffen DW. Promoter region of the rat M4 muscarinic acetylcholine receptor gene contains a cell type-specific silencer element. J Biol Chem. 1996;271:5177–5182. doi: 10.1074/jbc.271.9.5177. [DOI] [PubMed] [Google Scholar]
- 28.Mori N, Schoenherr C, Vandenbergh DJ, Anderson DJ. A common silencer element in the SCG10 and type II Na+ channel genes binds a factor present in nonneuronal cells but not in neuronal cells. Neuron. 1992;9:45–54. doi: 10.1016/0896-6273(92)90219-4. [DOI] [PubMed] [Google Scholar]
- 29.Nakai K, Sakamoto H. Construction of a novel database containing aberrant splicing mutations of mammalian genes. Gene. 1994;141:171–177. doi: 10.1016/0378-1119(94)90567-3. [DOI] [PubMed] [Google Scholar]
- 30.O’Malley EK, Sieber B-A, Morrison RS, Black IB, Dreyfus CF. Nigral type I astrocytes release S soluble factor that increases dopaminergic neuron survival through mechanisms distinct from basic fibroblast growth factor. Brain Res. 1994;647:83–90. doi: 10.1016/0006-8993(94)91401-x. [DOI] [PubMed] [Google Scholar]
- 31.Pathak BG, Neumann JC, Croyle M, Lingrel JB. The presence of both negative and positive elements in the 5′-flanking sequence of the rat Na, K-ATPase α3 subunit gene are required for brain expression in transgenic mice. Nucleic Acids Res. 1994;22:4748–4755. doi: 10.1093/nar/22.22.4748. [DOI] [PMC free article] [PubMed] [Google Scholar]
- 32.Pothier F, Ouellet M, Julien J-P, Guerin SL. An improved CAT assay for promoter analysis in either transgenic mice or tissue culture cells. DNA Cell Biol. 1992;11:83–90. doi: 10.1089/dna.1992.11.83. [DOI] [PubMed] [Google Scholar]
- 33.Rechsteiner MC, Rogers SW (1996) PEST sequences and regulation by proteolysis. Trends Biochem Sci 267–271. [PubMed]
- 34.Rogers SW, Rechsteiner MC. Microinjection studies on selective protein degradation: relationships between stability, structure, and location. Biomed Biochim Acta. 1986;45:1611–1618. [PubMed] [Google Scholar]
- 35.Salin T, Mudo G, Jiang XH, Timmusk T, Metsis M, Belluardo N. Up-regulation of trkB mRNA expression in the rat striatum after seizures. Neurosci Lett. 1995;194:181–184. doi: 10.1016/0304-3940(95)11772-o. [DOI] [PubMed] [Google Scholar]
- 36.Sauer F, Fondell JD, Ohkuma Y, Roeder RG, Jackle H. Control of transcription by Krüppel through interactions with TFIIB and TFIIEβ. Nature. 1995;375:162–164. doi: 10.1038/375162a0. [DOI] [PubMed] [Google Scholar]
- 37.Schoenherr CJ, Anderson DJ. The neuron-restrictive silencer factor (NRSF): a coordinate repression of multiple neuron-specific gene. Science. 1995a;267:1360–1363. doi: 10.1126/science.7871435. [DOI] [PubMed] [Google Scholar]
- 38.Schoenherr CJ, Paquette AJ, Anderson DJ. Identification of potential target genes for the neuron-restrictive silencer factor. Proc Natl Acad Sci USA. 1996;93:9881–9886. doi: 10.1073/pnas.93.18.9881. [DOI] [PMC free article] [PubMed] [Google Scholar]
- 39.Scholl T, Stevens MB, Mahanta S, Strominger JL. A zinc finger protein that represses transcription of the human MHC class II gene, DPA. J Immunol. 1996;156:1448–1457. [PubMed] [Google Scholar]
- 40.Spaete RR, Mocarski ES. Regulation of cytomegalovirus gene expression: α and β promoters are trans activated by viral functions in permissive human fibroblasts. J Virol. 1985;56:135–143. doi: 10.1128/jvi.56.1.135-143.1985. [DOI] [PMC free article] [PubMed] [Google Scholar]
- 41.Takahashi M, Kawamoto S, Adelstein RS. Evidence for inserted sequences in the head region of nonmuscle myosin specific to the nervous system. Cloning of the cDNA encoding the myosin heavy chain-B isoform of vertebrate nonmuscle myosin. J Biol Chem. 1992;267:17864–17871. [PubMed] [Google Scholar]
- 42.Tapia-Ramirez J, Eggen BJL, Peral-Rubio MJ, Toledo-Aral JJ, Mandel G. A single zinc finger motif in the silencing factor REST expresses the neural-specific type II sodium channel promoter. Proc Natl Acad Sci USA. 1997;94:1177–1182. doi: 10.1073/pnas.94.4.1177. [DOI] [PMC free article] [PubMed] [Google Scholar]
- 43.Thiel G, Schoch S, Petersohn D. Regulation of synapsin I gene expression by the zinc finger transcription factor zif268/egr-1. J Biol Chem. 1994;269:15294–15301. [PubMed] [Google Scholar]
- 44.Timmusk T, Palm K, Metsis M, Reintam T, Paalme V, Saarma M, Persson H. Multiple promoters direct tissue-specific expression of the rat BDNF gene. Neuron. 1993;10:475–489. doi: 10.1016/0896-6273(93)90335-o. [DOI] [PubMed] [Google Scholar]
- 45.Timmusk T, Belluardo N, Persson H, Metsis M. Developmental regulation of brain-derived neurotrophic factor messenger RNAs transcribed from different promoters in the rat brain. Neuroscience. 1994;60:287–291. doi: 10.1016/0306-4522(94)90242-9. [DOI] [PubMed] [Google Scholar]
- 46.Vician L, Lim IK, Ferguson G, Tocco G, Baudry M, Herschman HR. Synaptotagmin IV is an immediate early gene induced by de- polarization in PC12 cells and in brain. Proc Natl Acad Sci USA. 1995;92:2164–2168. doi: 10.1073/pnas.92.6.2164. [DOI] [PMC free article] [PubMed] [Google Scholar]
- 47.Vilaro MT, Wiederhold K-H, Palacios JM, Mengod G. Muscarinic cholinergic receptors in the rat caudate-putamen and olfactory tubercle belong predominantly to the M4 class: in situ hybridization and receptor autoradiography evidence. Neuroscience. 1991;40:159–167. doi: 10.1016/0306-4522(91)90181-m. [DOI] [PubMed] [Google Scholar]
- 48.Wada E, Wada K, Boulter J, Deneris E, Heinemann S, Patrick J, Swanson L. Distribution of α2, α3, α4, and β2 neuronal nicotinic receptor subunit mRNAs in the central nervous system: a hybridization histochemical study in the rat. J Comp Neurol. 1989;284:314–335. doi: 10.1002/cne.902840212. [DOI] [PubMed] [Google Scholar]
- 49.Whittemore S, White L. Target regulation of neuronal differentiation in temperature-sensitive cell line derived from medullary raphe. Brain Res. 1993;615:27–40. doi: 10.1016/0006-8993(93)91111-5. [DOI] [PubMed] [Google Scholar]
- 50.Wood IC, Roopra A, Buckley NJ. Neural specific expression of the M4 muscarinic acetylcholine receptor gene is mediated by a RE1/NRSE-type silencing element. J Biol Chem. 1996;271:14221–14225. doi: 10.1074/jbc.271.24.14221. [DOI] [PubMed] [Google Scholar]
- 51.Zafra F, Hengerer B, Leibrock J, Thoenen H, Lindholm D. Activity-dependent regulation of BDNF and NGF mRNAs in the rat hippocampus is mediated by non-NMDA glutamate receptors. EMBO J. 1990;9:3545–3550. doi: 10.1002/j.1460-2075.1990.tb07564.x. [DOI] [PMC free article] [PubMed] [Google Scholar]