

Abstract
Although two kinetically distinct evoked GABAAresponses (GABAA,fast and GABAA,slow) have been observed in CA1 pyramidal neurons, studies of spontaneous IPSCs (sIPSCs) in these neurons have reported only a single population of events that resemble GABAA,fast in their rise and decay kinetics. The absence of slow sIPSCs calls into question the synaptic basis of GABAA,slow. We present evidence here that both evoked responses are synaptic in origin, because two classes of minimally evoked, spontaneous and miniature IPSCs exist that correspond to GABAA,fast and GABAA,slow. Slow sIPSCs occur infrequently, suggesting that the cells underlying these events have a low spontaneous firing rate, unlike the cells giving rise to fast sIPSCs. Like evoked GABAA,fast and GABAA,slow, fast and slow sIPSCs are modulated differentially by furosemide, a subtype-specific GABAAantagonist. Furosemide blocks fast IPSCs by acting directly on the postsynaptic receptors, because it reduces the amplitude of both miniature IPSCs and the responses of excised patches to applied GABA. Thus, in the hippocampus, parallel inhibitory circuits are composed of separate populations of interneurons that contact anatomically segregated and pharmacologically distinct postsynaptic receptors.
Keywords: hippocampus, GABAA receptors, furosemide, IPSC, voltage clamp, pyramidal cell
Multiple kinetic classes of inhibitory synaptic currents are observed in hippocampal neurons (Pearce, 1993; Hajos and Mody, 1997; Ouardouz and Lacaille, 1997). In CA1 pyramidal cells, spontaneous IPSCs (sIPSCs) and currents evoked by stimulation of stratum pyramidale (GABAA,fast) have rapid rising and decay kinetics. In contrast, GABAAcurrents evoked by stimulating in distal dendritic layers (GABAA,slow) are slow to rise and decay (Pearce, 1993) and have time courses unlike any described sIPSCs in these cells (Ropert et al., 1990; Mody et al., 1991). The time courses of these two IPSCs have important functional consequences (Kapur et al., 1997), but the mechanisms underlying their different kinetics have not been elucidated.
We have suggested that the kinetics of these evoked currents differ because they are produced by receptors with different kinetic and pharmacological properties. The most compelling evidence that the receptors underlying GABAA,fast and GABAA,sloware distinct is their differential sensitivity to furosemide (Pearce, 1993) and other agents (Banks and Pearce, 1996; Pearce, 1996) that block GABAA,fast but have little effect on the amplitude of GABAA,slow. It is unclear, however, whether these drugs act directly on the postsynaptic receptors or by a presynaptic mechanism. For example, although furosemide is a subtype-specific blocker of GABAA receptors (Tia et al., 1996; Wafford et al., 1996), it also blocks the Na+/K+/Cl−cotransporter (Misgeld et al., 1986) and thereby could alter transmitter release. Demonstrating that the block of GABAA,fast by furosemide is postsynaptic would be strong evidence that the receptors underlying these currents are different, although it would not exclude a contribution of transmitter time course to the kinetics of the response.
An alternative to differences in receptor kinetics that might account for the prolonged time course of GABAA,slow is an extended presence of neurotransmitter (Lambert et al., 1996). This situation could arise by several mechanisms. Synchronous release in response to electrical stimulation could overwhelm the mechanisms for clearing GABA from the cleft, leading to prolonged activation of synaptic receptors. This mechanism is consistent with the absence of slow sIPSCs and implies that GABAA,slow is not physiologically relevant. It is also possible that synaptic specializations limit diffusion of transmitter even in response to physiological stimuli, as occurs at some glutamatergic synapses (Otis et al., 1996), or that GABAA,slow arises because of slow diffusion of transmitter to extrasynaptic receptors (Lambert et al., 1996).
To investigate these issues, we recorded minimally evoked, spontaneous and miniature GABAA IPSCs (mIPSCs), as well as the responses of excised receptors, in CA1 neurons and tested their sensitivity to furosemide. We observed two populations of sIPSCs with kinetics similar to those of evoked GABAA,fast and GABAA,slow. Slow sIPSCs constitute <0.1% of events, suggesting that they arise from interneurons with low intrinsic firing rates. Fast sIPSCs, mIPSCs, and excised GABAA receptors are blocked by furosemide, whereas the amplitudes of slow sIPSCs are unaffected. Thus, we conclude that in hippocampus at least two inhibitory circuits exist in which different interneuron populations communicate with pyramidal cells via pharmacologically distinct receptors.
MATERIALS AND METHODS
Slice preparation. Young rats (14–42 d old) were decapitated under ether anesthesia, and the heads immediately were immersed in cold (4°C) artificial CSF (ACSF) [composition (in mm): NaCl 127, KH2PO4 1.21, KCl 1.87, NaHCO3 26, CaCl2 2.17, MgSO41.44, and glucose 10] saturated with 95% O2/5% CO2. A block of tissue containing both hippocampi was dissected out with the brain immersed in ACSF, and the tissue was glued to a vibratome tray with cyanoacrylate glue. Slices (400 μm) were cut in a plane ∼15° off the frontal plane to allow for optimal visualization of the cortical laminae. Slices were held submerged at 35°C for 1 hr before transfer to the recording chamber, which was perfused at 3 ml/min with ACSF saturated with 95% 02/5%CO2.
Patch-clamp electrophysiology. Cells in stratum pyramidale of CA1 were visualized with a video camera (Hamamatsu C2400, Hamamatsu City, Japan) connected to an upright microscope (Zeiss Axioskop, Oberkochen, Germany) equipped with an infrared bandpass filter (Chroma D775/220), a long working-distance water-immersion objective (Zeiss Achroplan 40×, 0.75 numerical aperture), and differential interference contrast optics (Nomarski). Whole-cell recordings were obtained either at 35°C or at room temperature (24°C), as indicated, using an Axopatch 1D (Axon Instruments, Foster City, CA) patch-clamp amplifier. All data were obtained by pClamp software (Axon Instruments). Data were filtered at 5 kHz, sampled at 10–20 kHz (Digidata 1200), and stored on a Pentium-based PC. Patch pipettes were fabricated from borosilicate glass (Garner KG-33, 1.7 mm outer diameter, 1.1 mm inner diameter) with a Flaming/Brown two-stage puller (model P-87), fire-polished, and coated with SYLGARD to reduce electrode capacitance. Tight-seal whole-cell recordings were obtained by standard techniques (Hamill et al., 1981; Edwards et al., 1989). Patch pipettes had open tip resistances of 2–4 MΩ when filled with the recording solution [composition (in mm): CsCl 140, NaCl 10, HEPES 10, EGTA 5, CaCl2 0.5, MgATP 2, and QX-314 5, pH 7.3]. Access resistances were typically 10–20 MΩ and then were compensated 60–80%. Cells were held at −60 mV. Evoked GABAA IPSCS, sIPSCs, and mIPSCs were isolated by bath application of 20 μm CNQX and 40 μmd,l-APV to block AMPA and NMDA-mediated currents and by the inclusion of CsCl and QX-314 in the patch pipette to block GABAB-mediated currents. Stimuli were applied to stratum pyramidale (SP) to evoke GABAA,fast and stratum radiatum (SR) or stratum lacunosum-moleculare (SL-M) to evoke GABAA,slow. Bicuculline (10 mm) was applied focally under visual control with a Picospritzer (General Valve, Fairfield, NJ) or was bath-applied (10 μm).
Rapid agonist application. Excised outside-out patches were obtained from the somata of CA1 pyramidal cells and exposed to brief (2.6 ± 0.2 msec; see below) applications of GABA by using a modified “liquid filament” technique (Franke et al., 1987;Maconochie and Knight, 1989). Application pipettes were fabricated from double-barreled “theta” glass tubing with a thin septum (Thin Theta, Sutter Instruments, Novato, CA), pulled to a small diameter with a Flaming/Brown two-stage puller (model P-87), and broken to a tip diameter of 200–400 μm. Application pipettes were mounted to a piezoelectric stacked translator (Physik Instrumente model P-245.50), driven by a high-voltage proportional amplifier (Physik Instrumente model P-270). Solution exchange rates (10–90% in <100 μsec) were estimated by measuring open tip junction currents with dilute perfusion solution at the conclusion of each experiment (Clements and Westbrook, 1991; Raman and Trussell, 1995). The duration of the agonist pulse was defined by measuring the time between the points at 10% of the peak amplitude of the junction potential.
Data analysis. Data were analyzed on a Pentium-based PC, using ClampFit (Axon Instruments), Origin (MicroCal), and StatMost (DataMost). Spontaneous IPSC data were filtered off-line at 2 kHz. Spontaneous events were analyzed by an automated event detection algorithm that measured IPSC amplitude, 10–90% rise times (trise), and the time to 63% decay (tdecay). Amplitude threshold was set as 3·ςnoise, where ςnoise was measured during periods of no visually detectable events and was typically <3 pA. This algorithm successfully detected >98% of fast-rising sIPSCs and mIPSCs, but it consistently missed 20–40% of the slow events. Thus, the data were also scanned manually, and any missed slow events were analyzed and added to the event list. It is possible that small slow events were overlooked consistently, and this may contribute to the observed difference in mean amplitude between fast and slow sIPSCs (see Fig. 7).
Fig. 7.

Amplitude distributions of fast- and slow-rising sIPSCs. Shown are cumulative amplitude distributions for the fastest rising (trise ≤ 1 msec; dashed line) and slowest rising (trise ≥ 4 msec; dotted line) sIPSCs of >30,000 sIPSCs recorded at 35°C in six cells. The distribution for the entire population of sIPSCs (solid line) is plotted for reference. Also shown are amplitude histograms for the fast-rising (top inset, open bars) and slow-rising (bottom inset, filled bars) sIPSCs. The histogram for the entire population appears as a solid line in both insets. Histograms were normalized so that their total area = 1.
To characterize the decay kinetics of fast IPSCs and rise and decay kinetics of slow IPSCs, we selected a subset of events for exponential curve fitting as well (τrise and τdecay). The decays of fast IPSCs typically were described best by two exponential components. In those cases in which we were unsure whether the fit was improved by adding a second exponential component, the F test was used to compare the variance of the residual currents after subtracting the mono- or biexponential fit. A significance level of p < 0.01 was used. In some cases the multiexponential decay was characterized by the weighted time constant τdec,Wt = (A1τ1 +A2τ2)/(A1+ A2), where Ai is the amplitude of the ith component. One possible source of bias in analyzing the decay kinetics of slow sIPSCs should be noted. Only those spontaneous events for which the tails did not contain subsequent contaminating events of substantial amplitude [i.e., (amplitude of contaminating event) < 0.2 · (amplitude of analyzed event)] were selected for exponential fitting. Slow sIPSCs and mIPSCs were affected much more by this restriction because of their extended tails, and thus primarily the largest slow sIPSCs and mIPSCs were used for exponential fitting. It is unclear, however, whether this could cause the consistent kinetic differences observed between evoked and spontaneous events (Table 1). Statistical comparisons were made with paired t tests. All data are presented as mean ± SE.
Table 1.
Kinetic parameters for evoked, spontaneous and miniature IPSCs recorded at 35°C and 24°C
| Fast IPSCs | Slow IPSCs | |||||||
|---|---|---|---|---|---|---|---|---|
| tRise | τDec1 | Fast (%) | τDec2 | n | τRise | τDecay | n | |
| Evoked 35°C | 0.72 ± 0.07 | 3.51 ± 0.26 | 46 ± 4 | 13.7 ± 0.6 | 25 | 4.69 ± 0.41 | 50.8 ± 2.5 | 44 |
| Spont. 35°C | 0.43 ± 0.02 | 3.22 ± 0.35 | 48 ± 5 | 12.9 ± 1.1 | 16 (998) | 5.49 ± 0.59 | 41.9 ± 3.0 | 12 (97) |
| Mini 35°C | 0.43 ± 0.02 | 3.68 ± 0.59 | 55 ± 9 | 13.8 ± 1.0 | 7 (492) | 4.83 ± 0.64 | 39.7 ± 4.4 | 3 (15) |
| Evoked 24°C | 1.3 ± 0.2 | 11.2 ± 1.1 | 61 ± 3 | 38.8 ± 3.2 | 10 | 6.84 ± 0.44 | 109.4 ± 5.9 | 21 |
| Spont. 24°C | 0.77 ± 0.06 | 14.4 ± 1.0 | 67 ± 4 | 45.0 ± 4.8 | 6 (379) | 8.95 ± 0.91 | 75.8 ± 2.7 | 4 (42) |
| Mini 24°C | 0.70 ± 0.05 | 13.6 ± 0.8 | 68 ± 4 | 42.9 ± 3.4 | 7 (558) | — | — | — |
Units are in msec. Data are mean ± SEM; n = number of cells. Number of events is indicated in parentheses for spontaneous and miniature IPSCs. For fast IPSCs, 10–90% rise times (tRise), decay time constants (τDec1,2), and the percentage of amplitude contributed by the fast component are shown. For slow IPSCs, rise and decay time constants are shown. In an additional eight cells, the evoked GABAA,fast at 35°C decayed monoexponentially, with τDec = 9.40 ± 0.51 msec. Only two slow mIPSCs were obtained at room temperature and are not included in the table.n differs for fast and slow sIPSCs and mIPSCs because slow events were not observed in every cell.
RESULTS
Evoked responses
The original description of fast and slow evoked GABAAcurrents in CA1 pyramidal neurons was made by using sharp microelectrodes and discontinuous voltage clamp in brain slices obtained from adult rats (Pearce, 1993). For this study we chose to use whole-cell recording techniques in slices from juvenile rats, because these recordings offered superior noise characteristics and stability and allowed us to record minimally evoked and mIPSCs. Monosynaptic GABAergic IPSCs were elicited with bipolar glass electrodes (made from theta glass) placed in SP and either SR or SL-M (Fig.1). Evoked GABAA,fast and GABAA,slow IPSCs had time courses at 35°C and −60 mV, comparable to those recorded from adult animals by using sharp microelectrodes (Table 1) (Pearce, 1993). We found that by using these glass stimulating electrodes under direct visual control, we more reliably could evoke currents that were “pure” GABAA,slow or GABAA,fast than was possible with tungsten electrodes used in previous studies. In particular, we were able to discern that in most cells (25 of 33) the decay of evoked GABAA,fast was composed of two decay phases of ∼3.5 and 14 msec (Fig. 2, Table 1). GABAA,slow was best fit by the sum of single rising and falling exponential components (Table 1).
Fig. 1.

Selective stimuli elicit GABAA,fastand GABAA,slow. Photomicrograph (right column) of a CA1 pyramidal cell in a 400 μm slice taken from a 29-d-old rat and the monosynaptic GABAA IPSCs recorded in this cell at 35°C that were evoked by stimuli in stratum pyramidale and stratum radiatum (left column). Five superimposed traces are shown for each stimulus location. The recording electrode can be seen entering the field of view from the top right and contacting the cell body. The apical dendrite of this cell is marked by the arrowheads. A stimulating electrode placed in stratum pyramidale just apical to the cell body evoked GABAA,fast (left column, top traces), which had kinetics and amplitude similar to spontaneous events recorded in this cell. A second stimulating electrode placed next to the dendrite in stratum radiatum evoked GABAA,slow (bottom left), the kinetics of which were clearly distinct from the overlying spontaneous IPSCs. Stimulus artifacts were removed off-line for clarity. Scale bar, 20 μm.
Fig. 2.
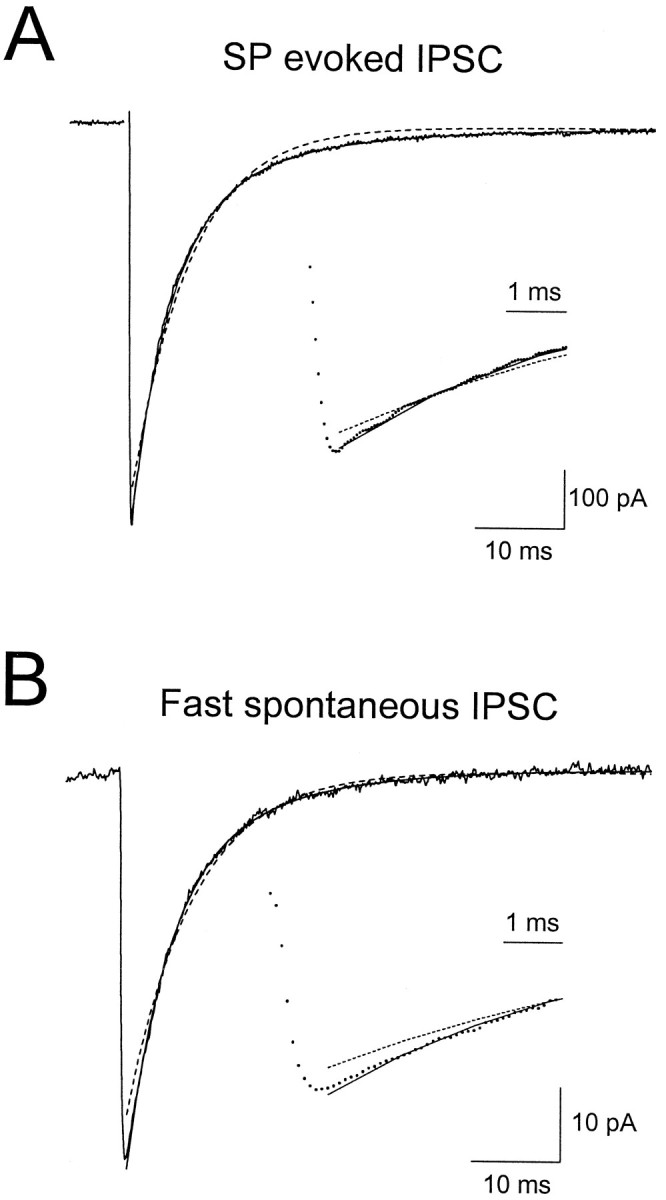
Fast IPSCs decay with biexponential kinetics. Shown are average SP-evoked (A) and spontaneous (B) IPSCs recorded in the same cell at 35°C. Both monoexponential (dashed lines) and biexponential fits (solid lines) are superimposed on the data.Insets show the data on an expanded time scale. Fit parameters are included. SP-evoked IPSC: biexponential fit, τdec1,2 = 3.6 msec (63%) and 11.3 msec; monoexponential fit, τdec = 6.5 msec. Fast sIPSC: biexponential fit, τdec1,2 = 4.5 msec (71%) and 13.6 msec; monoexponential fit, τdecay = 7.5 msec. In both cases the second decay component significantly improved the fit (p< 0.01, using the F test).
We also investigated the temperature dependence of the kinetics of GABAA,fast and GABAA,slow, both because recordings at room temperature are more stable than those obtained at elevated temperature and because we wanted to facilitate comparison with several previous studies of IPSC kinetics that also were done at room temperature (Collingridge et al., 1984; Edwards et al., 1990;Ropert et al., 1990; Otis and Mody, 1992; De Koninck and Mody, 1994). At 24°C, evoked GABAA,fast had rise times that were ∼1.8-fold slower and decay times that were approximately threefold slower than at 35°C (Table 1). The kinetics of GABAA,slowexhibited less temperature sensitivity than those of GABAA,fast, with the rise time prolonged by <1.5-fold at 24°C and the decay time by approximately twofold (Table1). The rise time of GABAA,slow is difficult to interpret, because it may be distorted by dendritic filtering. The slow decay phase of GABAA,slow is not distorted substantially by dendritic filtering (Pearce, 1993), and its temperature sensitivity argues against the decay being determined by diffusion of transmitter away from the receptors (Hille, 1992).
Minimal stimulus-evoked responses
Because both fast and slow evoked responses could be observed in low-noise patch recordings by using small glass stimulating pipettes, we used these techniques to test for responses to stimulation of single presynaptic fibers, using minimal stimuli. For these experiments, recordings were obtained under direct vision from pyramidal neurons, the dendrites of which could be visualized extending into stratum radiatum. Patch stimulating electrodes were placed either at the level of the cell body or of the dendrite and were repositioned as necessary to obtain a selective fast or slow response, with as low a stimulus intensity as possible. Stimulus intensity was raised slowly, and multiple responses were obtained at each level. Both fast (n = 7 cells) and slow (n = 5 cells) all-or-none evoked responses could be obtained by this method (Fig.3). The kinetics of these IPSCs were not significantly different from nonminimally evoked IPSCs observed in these cells (see Fig. 3 legend), and the two groups are pooled in Table1. These data suggest that both GABAA,fast and GABAA,slow can arise from neurotransmitter release triggered by activity in individual presynaptic fibers.
Fig. 3.

Minimally evoked GABAA,fast and GABAA,slow IPSCs. Shown are GABAA IPSCs recorded at 35°C in the same cell in response to stimuli in stratum pyramidale (A, a) and stratum lacunosum-moleculare (B, a). In both cases, small increases in stimulus intensity elicited all-or-none responses (A, b; B, b). Note the difference in amplitude scale in A, a versus B, a. The kinetic parameters for exponential fits to the average minimally evoked IPSCs in this cell were SP, τdec1,2 = 2.72 msec (25%) and 11.7 msec; SL-M eIPSC, τrise = 5.50 msec and τdecay = 43.0 msec. For SP minimally evoked IPSCs, the average fit parameters in seven cells were τdec1,2 = 3.37 ± 0.53 msec (38 ± 7%) and 13.0 ± 0.9 msec. ForSL-M, average parameters in five cells were τrise = 5.15 ± 0.26 msec and τdecay = 53.8 ± 8.4 msec.
Two populations of spontaneous IPSCs in pyramidal cells
If GABAA,fast and GABAA,slow are synaptic currents that result from transmitter release at two different sets of synapses, then one would expect to see two populations of sIPSCs and mIPSCs in pyramidal cells corresponding to the two evoked currents. In contrast to previous descriptions of a homogeneous population of rapidly rising and decaying sIPSCs and mIPSCs, we occasionally observed slowly rising and decaying events (Fig.4). These slow events represent a population of IPSCs with kinetic properties distinct from the more commonly observed fast events. Figure5A shows a scatterplot of decay versus rise time for sIPSCs recorded 30 sec before and 30 sec after one of the slow events shown in Figure 4A(trace b; this was the only slow sIPSC observed in this cell). This slow event appears as a lone outlier point in this graph, clearly separated from the other 320 rapidly rising and decaying sIPSCs. Even more striking is the similarity in time course of the average fast sIPSCs and the evoked GABAA,fast and of this slow sIPSC and the evoked GABAA,slow (Fig. 5A,open squares; 5B).
Fig. 4.

Kinetic heterogeneity of spontaneous and miniature IPSCs. Shown are sIPSCs (A) and mIPSCs (B) recorded at 35°C in five different cells. sIPSCs with slow kinetics are marked by asterisks. Calibration: 100 msec, 200 pA.
Fig. 5.

Evoked and spontaneous IPSCs have similar kinetics. A, Scatterplot oftdecay versustrise for 321 sIPSCs (open circles) recorded in a cell at 35°C. The single slow sIPSC is the same event that is shown in Figure 4A(second trace). The other 320 sIPSCs were recorded 30 sec before and 30 sec after this event. Also shown are the kinetic parameters for the IPSCs evoked by SP and SL-M stimulation (open squares) shown in B. B, Averaged and normalized fast sIPSC, SP-evoked IPSC, slow sIPSC, and SL-M-evoked IPSC recorded in the same cell as in A. Fit parameters include the following: fast sIPSC, trise = 0.4 msec and τdec1,2 = 3.5 msec (56%) and 13.7 msec; SP-evoked IPSC, trise = 0.8 msec and τdec1,2 = 3.9 msec (62%) and 18.5 msec; slow sIPSC, τrise = 7.2 msec and τdecay = 52.2 msec; SL-M-evoked IPSC, τrise = 6.0 msec and τdecay = 53.9 msec.
Because slow sIPSCs and mIPSCs occurred relatively infrequently, it was necessary to combine data from several cells to determine whether fast and slow sIPSCs are truly distinct populations of events or merely the two extremes of a kinetic continuum. Figure6 shows the rise and fall kinetics for >5000 sIPSCs pooled across six different cells studied at 35°C, which were chosen for their high rates of slow sIPSCs. The histograms of trise and tdecay show that, when each kinetic parameter is considered independently, it is not possible to separate out two populations of sIPSCs. However, two populations do emerge in scatterplots of tdecayversus trise. The vast majority of the sIPSCs (>98%) falls in the area of the graph defined bytrise < 2.5 msec andtdecay < 20 msec, but a second group of more slowly rising and falling events (n ≈ 100) is also apparent in the top right corner of the graph. In four additional cells studied in detail at 24°C, the two populations of sIPSCs separated attrise ∼6 msec andtdecay ∼40 msec (data not shown).
Fig. 6.

Two kinetic classes of sIPSCs. A scatterplot oftdecay versustrise is shown for >5000 sIPSCs recorded at 35°C in six different cells with high rates of slow sIPSCs. Most of the sIPSCs had rapid rise and fall kinetics and are clustered in thelower left quadrant of the plot (see histograms atleft and bottom left). Approximately 2% of the events had tdecay > 20 msec andtrise > 2.5 msec. Within these two groups there was little correlation between tdecayand trise (fast,r2 = 0.0265; slow,r2 = 0.137). Scale bars:tdecay histogram, 100 counts;trise histogram, 250 counts.
Fast and slow mIPSCs and sIPSCs had kinetics similar to those of the evoked GABAA,fast and GABAA,slow, and this was true both at 35°C and at 24°C (Table 1). On average, fast mIPSCs and sIPSCs were faster to rise than the evoked fast IPSC, possibly because of a shorter transmitter transient during the mIPSC, e.g., caused by asynchrony of release during the evoked response. It is also apparent that the slow sIPSCs were slower to rise and faster to decay than the evoked GABAA,slow, especially at 24°C. It is possible that, when we stimulated in stratum lacunosum-moleculare, we activated a subset of the synapses giving rise to slow sIPSCs that has faster rising kinetics. It is still clear, however, that fast and slow IPSCs have distinct kinetics.
Slow sIPSCs and mIPSCs frequently appeared larger in amplitude than the majority of fast events (see Fig. 4). Quantifying this observation required large numbers of fast and slow events. It was much easier to categorize events on the basis of rise times alone, because the decay phases of slow events often were contaminated with fast events and thus were difficult to analyze. We recorded >30,000 events in six cells at 35°C and constructed amplitude histograms for the fastest rising events (trise ≤ 1 msec) and the slowest rising events (trise ≥ 4 msec; Fig.7). We found that the slowest events were significantly larger than the fastest events [69.5 ± 4.8 vs 57.4 ± 0.5 pA; p < 0.01, using the Kolmogorov–Smirnov (K–S) test; n = 262 and 22888 events, respectively; both groups were significantly larger than the population as a whole (53.1 ± 0.4 pA; p < 0.01, using the K–S test; n = 30,520 events)]. Part or all of this difference may have been attributable to detection bias, because it was more difficult to detect slowly rising, small-amplitude events.
As mentioned above, slow sIPSCs and mIPSCs occurred much less frequently than did fast sIPSCs and mIPSCs. We measured the rates of action potential (AP)-dependent and AP-independent inhibitory events by subtracting the event rate in TTX from that in control solution. We found that both rates were four orders of magnitude higher for fast events than for slow events (AP-dependent, 17.2 ± 7.2/sec vs 5.4 × 10⁻³ ± 2.2 × 10⁻³/sec; AP independent, 14.2 ± 2.1/sec vs 4.3 × 10⁻³ ± 2.5 × 10⁻³/sec; n = 7 cells; all recordings at 35°C). The difference in AP-dependent spontaneous rates is consistent with fast and slow sIPSCs arising from two different groups of interneurons. Also, the occurrence of slow mIPSCs argues against a role for presynaptic firing properties (e.g., bursting in interneurons) in setting the time course of GABAA,slow.
Fast sIPSCs arise somatically
In a previous study it was shown that fast and slow evoked IPSCs arise from synapses that are segregated anatomically (Pearce, 1993). Using focal applications of bicuculline applied under direct visual control, we tried to ascertain whether the two populations of sIPSCs also arise from anatomically segregated synapses. Although the low rate of occurrence of slow sIPSCs precluded our using this technique to determine the location of synapses giving rise to this population of sIPSCs, we found that the majority of fast sIPSCs arises from terminals on or near the soma (Fig. 8). A short bicuculline puff (10 mm at 20 psi for 10 msec) at the cell body transiently reduced the peak amplitude of the fast sIPSCs by 56% (control, 57.0 ± 1.6 pA; bicuculline, 25.1 ± 2.0 pA), whereas the same puff at 55 μm from the cell body caused a 46% reduction (30.7 ± 1.5 pA), at 110 μm caused a 28% reduction (41.3 ± 2.5), and at 220 μm reduced the amplitude by <3% (55.4 ± 3.3 pA) (Fig. 8B). Because of leakage from the puffer pipette, the baseline sIPSC amplitude also was reduced in a spatially restricted manner, similar to the effect on sIPSCs immediately after the puff (Fig. 8B). Similar results were obtained in four other cells. In all cases, maximal block of sIPSCs occurred at the cell body, and at >200 μm the sIPSCs were blocked by <5%.
Fig. 8.
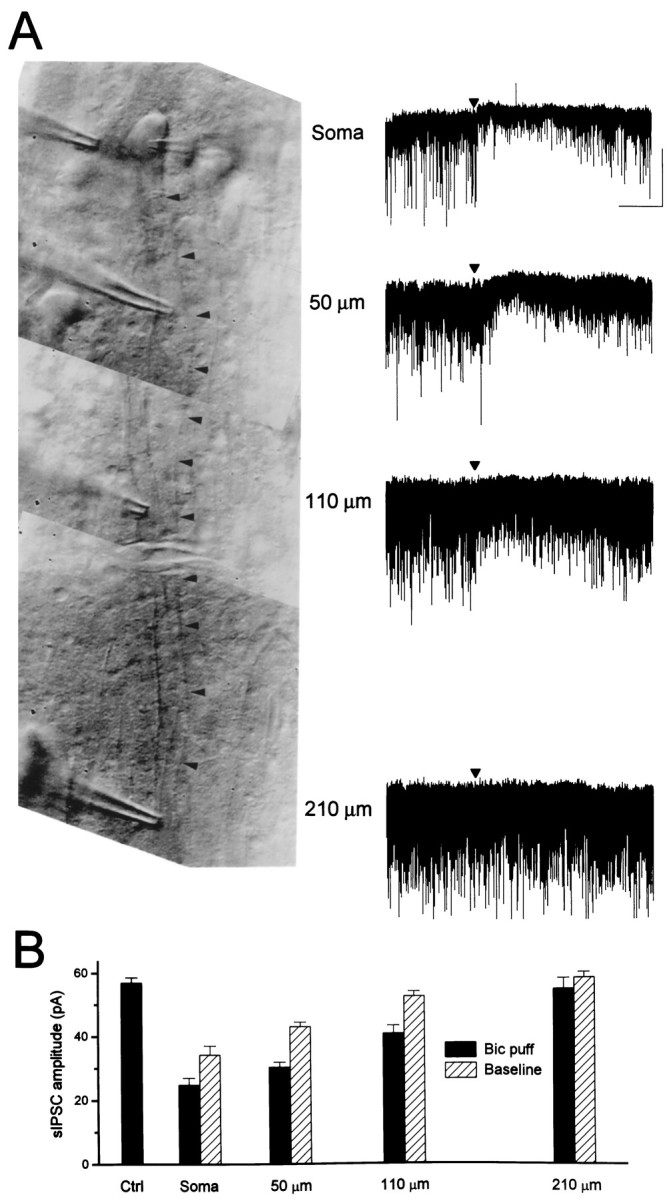
Fast sIPSCs arise close to the soma.A, Composite photomicrograph (left) of a CA1 pyramidal cell showing the four positions at which bicuculline was puffed onto the cell body or apical dendrite (marked byarrowheads). The recording pipette can be seen entering the field of view from the right. Sample traces are illustrated for each puffer pipette position (right column). The time of the puff is indicated by thearrowhead; recording was at 35°C. Calibration: 2 sec, 100 pA. B, Summary data for the cell illustrated inA. Shown are sIPSC amplitudes without the puffer pipette near the cell (Ctrl) and averaged 2 sec after the bicuculline puff at four positions relative to the cell (black bars). Because of leakage from the puffer pipette, the baseline sIPSC amplitude was reduced in a spatially restricted manner (striped bars) also, similar to the effect on sIPSCs immediately after the puff.
The lack of effect after dendritic application of bicuculline does not necessarily indicate that no fast inhibitory synapses are located in the dendrites because, compared with the soma, a relatively smaller membrane area will be affected by a focal application. However, these results do establish that the spatial resolution of the technique is at least ∼100 μm. The finding that the mean amplitude of sIPSCs was reduced by 56% after somatic application of bicuculline thus establishes a lower limit for the spatial restriction of fast synapses, i.e., ≤44% of fast synapses are remote from the soma. If the concentration of bicuculline achieved by puff application was sufficient to block somatic IPSCs only partially, then the percentage of remote synapses is <44%. These data are further evidence that fast sIPSCs correspond to GABAA,fast and that the interneurons giving rise to kinetically distinct IPSCs have distinct projection patterns.
Furosemide selectively modulates fast and slow sIPSCs
The data presented above show that two classes of synapses give rise to GABAA,fast and GABAA,slow and strongly suggest that these synapses arise from distinct groups of interneurons. We will now present evidence that the receptors at these two classes of synapses have distinct pharmacological properties.
Furosemide is a subtype-specific antagonist of GABAAreceptors (Tia et al., 1996; Wafford et al., 1996) that was shown previously to reduce the amplitude of evoked GABAA,fast(80% at 0.6 mm), with little effect on the amplitude of GABAA,slow (Pearce, 1993). We found that the fast and slow sIPSCs similarly exhibit a differential sensitivity to furosemide (Fig.9). Furosemide (0.6 mm) reduced the amplitude of the fast sIPSCs without affecting the amplitude of the slow sIPSCs, whereas bicuculline (10 μm) completely blocked both populations of sIPSCs (Fig. 9A; data were recorded at 24°C).
Fig. 9.
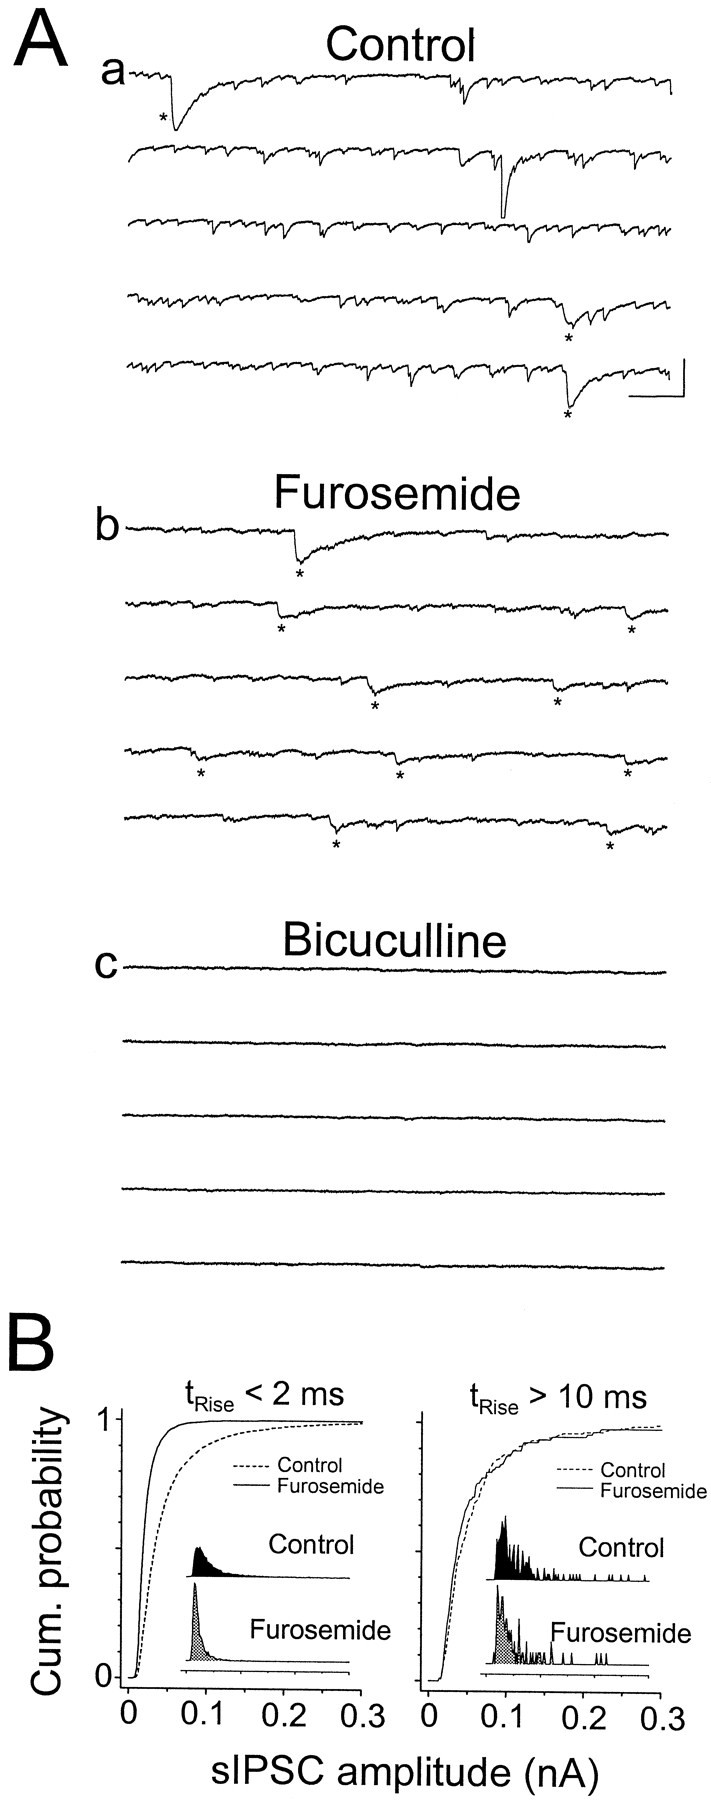
Furosemide selectively blocks fast sIPSCs.A, sIPSCs recorded from a cell at 24°C in control solution (a), 0.6 mm furosemide (b), and 0.6 mm furosemide plus 10 μm bicuculline (c). The effect of bicuculline was reversible for both the fast and slow events. Traces are consecutive within each panel. Slow sIPSCs are indicated withasterisks. Calibration: 200 msec, 200 pA.B, Cumulative amplitude distributions for fast-rising sIPSCs (left) and slow-rising sIPSCs (right) in control solution (dashed lines) and 0.6 mm furosemide (solid lines). Insets show raw amplitude histograms, normalized by their area.
To quantify the blocking effect of furosemide, we compared the amplitude distributions of the two classes of spontaneous IPSCs with and without the drug. Because the rising phases of slow sIPSCs are much less likely to be contaminated by fast sIPSCs than are the decay phases, it is easier to discriminate unambiguously between individual fast and slow events by classifying sIPSCs on the basis of rise time alone. However, as noted above (see Fig. 6), there was significant overlap in rise times between the two populations. We chose, therefore, to compare the fastest rising of the fast sIPSCs and the slowest of the slow sIPSCs. In the cell illustrated in Figure 9, furosemide blocked the fastest sIPSCs (trise < 2 msec) by 53%, with no effect on the slowest sIPSCs (trise > 10 msec; Fig. 9B). In five cells, 0.6 mmfurosemide blocked the fast sIPSCs by −48.5 ± 9.1%, with no consistent effect on the amplitude of the slowest sIPSCs (+4.65 ± 17.06%; control, n = 75 events; furosemide,n = 124 events). Furosemide also appeared to slow the kinetics of both populations of sIPSCs. For example, in this cell, furosemide increased the average rise time of the slow sIPSCs by >40% (control, 5 msec; furosemide, 7.2 msec) and nearly doubled the decay time (control, 95 msec; furosemide, 172 msec). Similar effects were observed in the other four cells. The effect of furosemide on the kinetics of fast sIPSCs was variable, possibly because of a presynaptic component to the effect (see below).
Furosemide blocks fast mIPSCs
To evaluate the relative contributions of presynaptic and postsynaptic actions of furosemide on fast sIPSCs, and presumably also on evoked GABAA,fast current, we tested its effect on fast mIPSCs. If we assume that mIPSCs recorded in the presence of TTX are the responses to single quanta of neurotransmitter, presynaptic drug effects would be manifested only in changes in mIPSC frequency, whereas postsynaptic drug effects would be manifested in changes in mIPSC amplitude [Katz (1962); but see Vautrin and Barker (1994)]. In seven cells we found that, in the presence of TTX, furosemide (0.6 mm) reduced mIPSC amplitude by 36.9 ± 4.1% (Fig.10) while reducing mIPSC frequency by 12.9 ± 5.7%. Unlike the case for fast sIPSCs, furosemide consistently slowed the decay of fast mIPSCs. However, when we attempted to quantify these results, we found that the particular fit parameter that was affected was variable. The results were much more consistent with the weighted decay time constant (τdec,Wt; see Materials and Methods). τdec,Wt increased from 8.30 ± 0.89 msec in control to 12.9 ± 1.4 msec in furosemide (n = 5;p < 0.05). Furosemide had no effect on the rise time of fast mIPSCs (control, 0.44 ± 0.12 msec; furosemide, 0.43 ± 0.01 msec). The mIPSC rates in the other two cells were too high to analyze the rise and decay kinetics reliably. (The low frequency of slow mIPSCs precluded an analysis of furosemide effects on these events. It seems unlikely, however, that slow mIPSCs would be blocked when slow sIPSCs were not.)
Fig. 10.

Furosemide blocks miniature IPSCs. Shown is a time series plot of normalized mIPSC amplitude (A) and cumulative amplitude distribution (B) for a cell exposed to 0.6 mmfurosemide in the presence of 1 μm TTX.Insets show raw amplitude histograms, normalized by their area. Furosemide reduced mIPSC amplitude, with a small effect on mIPSC frequency (data not shown). Recording was at 35°C.
The discrepancy in blocking potency between evoked and miniature IPSCs and the small reduction in mIPSC frequency suggest that furosemide reduces presynaptic release probability. More important to the issue at hand, however, is that furosemide appears to have a potent postsynaptic effect, as well. This suggests that the receptors underlying GABAA,fast and GABAA,slow have different pharmacological properties and thus are likely to be structurally distinct, differing, for example, in their subunit composition.
Furosemide blocks the responses of excised GABAA receptors
To confirm that furosemide was acting directly on the postsynaptic receptors, we investigated its effect on GABAA receptors excised from the somata of pyramidal cells. We tested the responses of excised receptors in outside-out patches to brief pulses (2.6 ± 0.2 msec) of 1 mm GABA to simulate synaptic transmitter transients. All of these recordings were performed at 24°C and −60 mV. Currents in response to these applications of agonist were qualitatively similar to fast IPSCs, with rapid rates of rise (t10–90% = 1.3 ± 0.1 msec) and biexponential decays [23.4 ± 2.1 msec (57 ± 3%) and 107 ± 6 msec; n = 21]. As in other preparations, the excised responses were consistently slower to decay than the fast IPSCs (Puia et al., 1994; Galarreta and Hestrin, 1997).
Application of 0.6 mm furosemide reduced the peak response to brief pulses of GABA by 47.0 ± 5.8% (n = 6; Fig. 11A,B), an effect slightly larger than its effect on mIPSCs recorded in these cells (Fig. 10). Although we did not investigate the mechanism of block in detail, two observations suggest that furosemide may be acting as an open-channel blocker: there was an increase in channel flicker (Fig.11C) and a decrease in deactivation rate (Fig.11A) in the presence of furosemide. We quantified the latter effect by comparing the weighted time constant (τdec,Wt) in the presence and absence of furosemide (as was the case for mIPSCs, the effects on the individual fit parameters were variable). Furosemide prolonged τdec,Wt from 44.9 ± 8.9 to 79.0 ± 10.9 msec (p < 0.005), a slightly larger effect than was the case for mIPSCs. The rise times of the responses also were slowed by furosemide (control, 1.41 ± 0.36 msec; furosemide, 2.02 ± 0.33 msec; p < 0.05). Further elucidation of the mechanism of block awaits a more complete analysis, but these data confirm that part of the blocking effect of furosemide is attributable to an interaction with the postsynaptic receptors.
Fig. 11.

Furosemide blocks excised patch responses.A, Responses recorded from an outside-out patch excised from the cell body of a CA1 pyramidal cell in response to 1 mm GABA in the absence and presence of furosemide (0.6 mm). Asterisks in a andb refer to the data in C. Calibration: 100 msec, 25 pA. Inset, 1 msec. B, Time series plot of the peak responses for the experiment inA. Furosemide rapidly and reversibly blocked the response by 48%. The dotted line is an exponential fit to the baseline to compute accurately the percentage of block in the presence of rundown. a, b, and c refer to the traces in A. C, Data from the tails of the responses in B are replotted on an expanded scale to show single channel behavior. Calibration: 10 msec, 2 pA.
DISCUSSION
We have presented evidence that the two types of GABAA-mediated inhibitory responses observed in hippocampal CA1 pyramidal neurons, GABAA,fast and GABAA,slow, are both synaptic in origin. Our data suggest further that the synaptic terminals generating these responses arise from distinct pools of interneurons that differ in their spontaneous firing rates and that these synapses incorporate structurally distinct postsynaptic receptors.
GABAA,slow is a synaptic current
Several results from previous studies have called into question the synaptic basis of the slow evoked GABAA current. Primary among these was a failure to observe corresponding populations of slow miniature and spontaneous IPSCs. In addition, relatively large stimuli were required to evoke slow responses (Pearce, 1993), and GABA uptake inhibitors enhanced the slow component of a mixed (biexponential) IPSC in CA1 neurons (Roepstorff and Lambert, 1994). These results suggested that the slow evoked IPSC might be an artifact of gross electrical stimulation, for example, attributable to transmitter spillover from the synaptic cleft to extrasynaptic receptors as a consequence of the synchronous activation of large numbers of presynaptic fibers.
In our recordings from CA1 neurons we observed minimally evoked GABAA,fast and GABAA,slow responses (see Fig.3), as well as two kinetically distinct populations of spontaneous and miniature IPSCs (see Fig. 6). The two populations of spontaneous events have kinetic (see Fig. 5, Table 1), anatomical (see Fig. 8), and pharmacological (see Figs. 9, 10) properties strikingly similar to the evoked GABAA,fast and GABAA,slow currents. These observations indicate that both GABAA,fast and GABAA,slow are synaptic in origin and that the evoked currents accurately reflect the responses of the postsynaptic neurons to physiologically appropriate stimuli.
The reason that previous studies of spontaneous and miniature IPSCs in the hippocampus have reported only a single homogenous population of fast-rising, fast-decaying events (Collingridge et al., 1984; Edwards et al., 1990; Mody et al., 1991; Otis and Mody, 1992; De Koninck and Mody, 1994) is very likely the extremely low rate of occurrence of the slow events, even at near-physiological temperatures. Also, both rise and decay kinetics must be examined to distinguish the second population of events, because analyses that are based on one kinetic parameter alone yield single, continuous populations of events (see Fig. 6). Furthermore, some studies deliberately excluded slowly rising events from analysis to operate on a homogenous population (De Koninck and Mody, 1994).
Different interneuron types generate fast and slow IPSCs
Several observations indicate that the fast and slow GABAA responses arise from distinct pools of interneurons. First, GABAA,fast and GABAA,slow responses, including “minimal” or all-or-none responses, can be evoked selectively by electrical stimuli applied to different locations (see Figs. 1, 3). Also, the synapses that produce the currents are segregated spatially (see Fig. 8) (Pearce, 1993). Although these observations alone do not preclude the possibility that multiple axonal projections of a single interneuron type produce both responses, anatomical studies have revealed several classes of interneurons that are distinguished by their cell body locations and lamina-specific axonal projections (Freund and Buzsáki, 1996). Furthermore, stimulating single interneurons in stratum lacunosum-moleculare elicits IPSCs with slower rise and decay kinetics than those evoked by stimulating single cells in stratum pyramidale or oriens (Ouardouz and Lacaille, 1997). Thus, it is reasonable to expect that the anatomically segregated responses are produced by different interneuron classes.
The spontaneous rates for the fast and slow events differed by four orders of magnitude, consistent with the synapses arising from two groups of interneurons with different spontaneous firing rates. It is also possible that the difference in IPSC rates arises because of differences in numbers of synapses or because selective electrotonic filtering of the slow events reduced their measured amplitudes below noise level. However, we found that the maximum evoked amplitudes of GABAA,fast and GABAA,slow differed by <10-fold (data not shown), implying that selective dendritic filtering or differences in the numbers of synapses cannot account for the difference in rates. In addition, the total number of inhibitory synapses contacting any one pyramidal cell is probably in the hundreds (Gottlieb and Cowan, 1972; Buhl et al., 1994a), so it is not physically possible for there to be 104 more synapses underlying fast IPSCs than slow IPSCs.
The spatial restrictions of the axonal projections and the level of spontaneous firing activity of different classes of interneurons provide some clues to the identity of the cells underlying GABAA,fast and GABAA,slow. Basket cells are the most likely candidates to underlie GABAA,fast, because they project to stratum pyramidale and proximal stratum radiatum exclusively (Lorente de No, 1934; Gulyas et al., 1993; Buhl et al., 1994a,b; Sik et al., 1995). Axo-axonic, bistratified, and horizontal trilaminar cells also project to somatic and perisomatic regions and thus also may contribute to GABAA,fast. All of these cell types have been reported to exhibit spontaneous firing activity (Schwartzkroin and Mathers, 1978; Ashwood et al., 1984;Lacaille et al., 1987; Buhl et al., 1994a,b, 1996). Interneurons in stratum lacunosum-moleculare are likely to underlie GABAA,slow, because they project to dendritic regions exclusively and exhibit no spontaneous activity (Williams et al., 1994). Consistent with this, stimulation of single SL-M interneurons in the slice elicits slowly rising and decaying unitary IPSCs in pyramidal cells (Ouardouz and Lacaille, 1997).
Why are the time courses of GABAA,fast and GABAA,slow different?
The differential sensitivity of GABAA,fast and GABAA,slow to furosemide (see Figs. 9-11) and the atypical proconvulsant benzodiazepine 4′-chlorodiazepam (Banks and Pearce, 1996) suggests that the receptors underlying these two currents are structurally distinct. It does not necessarily follow, however, that the decay kinetics of the two currents differ because the two types of receptors have different binding or gating kinetics. Delayed clamp experiments demonstrated that the conductance underlying GABAA,slow has a slow decay component and that the current is not prolonged simply because the synapses are electrotonically remote (Pearce, 1993). However, it is still possible that the dendritic IPSC is slower to decay because transmitter is present in the synaptic cleft for an extended period of time. The observation that GABA uptake inhibitors prolonged the slow decay phase of a biphasic IPSC in CA1 pyramidal cells (Roepstorff and Lambert, 1994) is consistent with this hypothesis. At some central glutamatergic synapses the prolonged presence of transmitter has been shown to underlie a slow decay phase of the resulting postsynaptic current (Trussell et al., 1993; Barbour et al., 1994; Rossi et al., 1995; Takahashi et al., 1995; Otis et al., 1996). However, these synapses have morphological specializations that limit transmitter diffusion out of the synaptic cleft (Morest and Jean-Baptiste, 1975; Mugnaini et al., 1994), and such specialized synapses have not been reported in hippocampus (Freund and Buzsáki, 1996).
It should be noted that the delayed clamp experiments of Pearce (1993)did not exclude the possibility that dendritic filtering does obscure a rapid rising phase and initial decay phase of GABAA,slowand that the current is qualitatively similar to excised patch responses from the somata of these cells (see Fig. 11) and recorded in other preparations (Puia et al., 1994; Verdoorn, 1994; Jones and Westbrook, 1995). It may be possible to resolve this question by using a recently developed analysis of the delayed clamp experiment (Hausser and Roth, 1997).
Receptor subtypes mediating furosemide-sensitive currents in CA1
We have shown that receptors mediating fast IPSCs and excised patch responses are sensitive to furosemide but that receptors mediating slow IPSCs are not (see Figs. 9-11). Furosemide is a selective blocker of α4- and α6-containing GABAA receptors at the concentration used here (0.6 mm) (Wafford et al., 1996). Although the α6subunit is expressed only in cerebellum (Laurie et al., 1992), α4 is expressed in CA1, suggesting that both the receptors underlying fast IPSCs and receptors excised from pyramidal cell somata are likely be composed of α4βxγx.
Functional implications of kinetically distinct GABAAinhibitory circuits
The properties of GABAA,fast and GABAA,slow are consistent with distinct functional roles for these two inputs. The somatic current GABAA,fastcontrols the spike output of pyramidal cells in response to summed excitation at the soma (Pearce, 1993; Miles et al., 1996), whereas the dendritic current GABAA,slow acts locally, controlling the level of dendritic polarization and thereby modulating the efficacy of specific excitatory inputs in the dendrites of these cells (Davies et al., 1991; Mott and Lewis, 1991; Kanter et al., 1996; Miles et al., 1996; Kapur et al., 1997). Their kinetics also suggest different roles in temporal patterning in hippocampal circuits, for example, with GABAA,slow underlying theta (3–8 Hz) and GABAA,fast underlying gamma (20–80 Hz) oscillations that are thought to play separate functional roles in memory and arousal (Gray, 1994; Huerta and Lisman, 1995; Vinogradova, 1995). Further characterization of the properties of these currents and other elements of cortical inhibitory circuits will improve our understanding of how these circuits contribute to specific behaviors and will permit more rational development of targeted therapeutic interventions in the brain.
Footnotes
This work was supported by National Institutes of Health Grant NS01548 (to R.A.P.) and the Department of Anesthesiology, University of Wisconsin–Madison. We thank Lew Haberly for valuable comments on this manuscript and Phil Shils for technical support.
Correspondence should be addressed to Dr. Matthew I. Banks, Department of Anesthesiology, University of Wisconsin, 43 Bardeen Labs, 1300 University Avenue, Madison, WI 53706.
REFERENCES
- 1.Ashwood TJ, Lancaster B, Wheal HV. In vivo and in vitro studies on putative interneurones in the rat hippocampus: possible mediators of feed-forward inhibition. Brain Res. 1984;293:279–291. doi: 10.1016/0006-8993(84)91235-6. [DOI] [PubMed] [Google Scholar]
- 2.Banks MI, Pearce RA. Fast and slow spontaneous IPSCs in CA1 pyramidal cells. Soc Neurosci Abstr. 1996;22:810. [Google Scholar]
- 3.Barbour B, Keller BU, Llano I, Marty A. Prolonged presence of glutamate during excitatory synaptic transmission to cerebellar Purkinje cells. Neuron. 1994;12:1331–1343. doi: 10.1016/0896-6273(94)90448-0. [DOI] [PubMed] [Google Scholar]
- 4.Buhl EH, Halasy K, Somogyi P. Diverse sources of hippocampal unitary inhibitory postsynaptic potentials and the number of synaptic release sites. Nature. 1994a;368:823–827. doi: 10.1038/368823a0. [DOI] [PubMed] [Google Scholar]
- 5.Buhl EH, Han ZS, Lorinczi Z, Stezhka VV, Karnup SV, Somogyi P. Physiological properties of anatomically identified axo-axonic cells in the rat hippocampus. J Neurophysiol. 1994b;71:1289–1307. doi: 10.1152/jn.1994.71.4.1289. [DOI] [PubMed] [Google Scholar]
- 6.Buhl EH, Szilagyi T, Halasy K, Somogyi P. Physiological properties of anatomically identified basket and bistratified cells in the CA1 area of the rat hippocampus in vitro. Hippocampus. 1996;6:294–305. doi: 10.1002/(SICI)1098-1063(1996)6:3<294::AID-HIPO7>3.0.CO;2-N. [DOI] [PubMed] [Google Scholar]
- 7.Clements JD, Westbrook GL. Activation kinetics reveal the number of glutamate and glycine binding sites on the N-methyl-d-aspartate receptor. Neuron. 1991;7:605–613. doi: 10.1016/0896-6273(91)90373-8. [DOI] [PubMed] [Google Scholar]
- 8.Collingridge GL, Gage PW, Robertson B. Inhibitory post-synaptic currents in rat hippocampal CA1 neurones. J Physiol (Lond) 1984;356:551–564. doi: 10.1113/jphysiol.1984.sp015482. [DOI] [PMC free article] [PubMed] [Google Scholar]
- 9.Davies CH, Starkey SJ, Pozza MF, Collingridge GL. GABA autoreceptors regulate the induction of LTP. Nature. 1991;349:609–611. doi: 10.1038/349609a0. [DOI] [PubMed] [Google Scholar]
- 10.De Koninck Y, Mody I. Noise analysis of miniature IPSCs in adult rat brain slices: properties and modulation of synaptic GABAA receptor channels. J Neurophysiol. 1994;71:1318–1335. doi: 10.1152/jn.1994.71.4.1318. [DOI] [PubMed] [Google Scholar]
- 11.Edwards FA, Konnerth A, Sakmann B, Takahashi T. A thin slice preparation for patch-clamp recordings from neurones of the mammalian central nervous system. Pflügers Arch. 1989;414:600–612. doi: 10.1007/BF00580998. [DOI] [PubMed] [Google Scholar]
- 12.Edwards FA, Konnerth A, Sakmann B. Quantal analysis of inhibitory synaptic transmission in the dentate gyrus of rat hippocampal slices: a patch-clamp study. J Physiol (Lond) 1990;430:213–249. doi: 10.1113/jphysiol.1990.sp018289. [DOI] [PMC free article] [PubMed] [Google Scholar]
- 13.Franke C, Hatt H, Dudel J. Liquid filament switch for ultra-fast exchanges of solutions at excised patches of synaptic membrane of crayfish muscle. Neurosci Lett. 1987;77:199–204. doi: 10.1016/0304-3940(87)90586-6. [DOI] [PubMed] [Google Scholar]
- 14.Freund TF, Buzsáki G. Interneurons of the hippocampus. Hippocampus. 1996;6:347–470. doi: 10.1002/(SICI)1098-1063(1996)6:4<347::AID-HIPO1>3.0.CO;2-I. [DOI] [PubMed] [Google Scholar]
- 15.Galarreta M, Hestrin S. Properties of GABAA receptors underlying inhibitory synaptic currents in neocortical pyramidal neurons. J Neurosci. 1997;17:7220–7227. doi: 10.1523/JNEUROSCI.17-19-07220.1997. [DOI] [PMC free article] [PubMed] [Google Scholar]
- 16.Gottlieb DI, Cowan WM. On the distribution of axonal terminals containing spheroidal and flattened synaptic vesicles in the hippocampus and dentate gyrus of the rat and cat. Z Zellforsch Mikrosk Anat. 1972;129:413–429. doi: 10.1007/BF00307297. [DOI] [PubMed] [Google Scholar]
- 17.Gray CM. Synchronous oscillations in neuronal systems: mechanisms and functions. [review]. J Comput Neurosci. 1994;1:11–38. doi: 10.1007/BF00962716. [DOI] [PubMed] [Google Scholar]
- 18.Gulyas AI, Miles R, Hajos N, Freund TF. Precision and variability in postsynaptic target selection of inhibitory cells in the hippocampal CA3 region. Eur J Neurosci. 1993;5:1729–1751. doi: 10.1111/j.1460-9568.1993.tb00240.x. [DOI] [PubMed] [Google Scholar]
- 19.Hajos N, Mody I. Synaptic communication among hippocampal interneurons: properties of spontaneous IPSCs in morphologically identified cells. J Neurosci. 1997;17:8427–8442. doi: 10.1523/JNEUROSCI.17-21-08427.1997. [DOI] [PMC free article] [PubMed] [Google Scholar]
- 20.Hamill OP, Marty A, Neher E, Sakmann B, Sigworth FJ. Improved patch-clamp techniques for high-resolution current recording from cells and cell-free membrane patches. Pflügers Arch. 1981;391:85–100. doi: 10.1007/BF00656997. [DOI] [PubMed] [Google Scholar]
- 21.Hausser M, Roth A. Estimating the time course of the excitatory synaptic conductance in neocortical pyramidal cells using a novel voltage jump method. J Neurosci. 1997;17:7606–7625. doi: 10.1523/JNEUROSCI.17-20-07606.1997. [DOI] [PMC free article] [PubMed] [Google Scholar]
- 22.Hille B. Ionic channels of excitable membranes. Sinauer; Sunderland, MA: 1992. [Google Scholar]
- 23.Huerta PT, Lisman JE. Bidirectional synaptic plasticity induced by a single burst during cholinergic theta oscillation in CA1 in vitro. Neuron. 1995;15:1053–1063. doi: 10.1016/0896-6273(95)90094-2. [DOI] [PubMed] [Google Scholar]
- 24.Jones MV, Westbrook GL. Desensitized states prolong GABAA channel responses to brief agonist pulses. Neuron. 1995;15:181–191. doi: 10.1016/0896-6273(95)90075-6. [DOI] [PubMed] [Google Scholar]
- 25.Kanter ED, Kapur A, Haberly LB. A dendritic GABAA-mediated IPSP regulates facilitation of NMDA-mediated responses to burst stimulation of afferent fibers in piriform cortex. J Neurosci. 1996;16:307–312. doi: 10.1523/JNEUROSCI.16-01-00307.1996. [DOI] [PMC free article] [PubMed] [Google Scholar]
- 26.Kapur A, Lytton WW, Ketchum KL, Haberly LB. Regulation of the NMDA component of EPSPs by different components of postsynaptic GABAergic inhibition: a computer simulation analysis in piriform cortex. J Neurophysiol. 1997;78:2546–2559. doi: 10.1152/jn.1997.78.5.2546. [DOI] [PubMed] [Google Scholar]
- 27.Katz B. The transmission of impulses from nerve to muscle, and the subcellular unit of synaptic action. Proc R Soc Lond [Biol] 1962;155:455–479. [Google Scholar]
- 28.Lacaille JC, Mueller AL, Kunkel DD, Schwartzkroin PA. Local circuit interactions between oriens/alveus interneurons and CA1 pyramidal cells in hippocampal slices: electrophysiology and morphology. J Neurosci. 1987;7:1979–1993. doi: 10.1523/JNEUROSCI.07-07-01979.1987. [DOI] [PMC free article] [PubMed] [Google Scholar]
- 29.Lambert JD, Fueta Y, Roepstorff A, Andreasen M. Analysis of the kinetics of synaptic inhibition points to a reduction in GABA release in area CA1 of the genetically epileptic mouse, el. Epilepsy Res. 1996;26:15–23. doi: 10.1016/s0920-1211(96)00035-6. [DOI] [PubMed] [Google Scholar]
- 30.Laurie DJ, Seeburg PH, Wisden W. The distribution of 13 GABAA receptor subunit mRNAs in the rat brain. II. Olfactory bulb and cerebellum. J Neurosci. 1992;12:1063–1076. doi: 10.1523/JNEUROSCI.12-03-01063.1992. [DOI] [PMC free article] [PubMed] [Google Scholar]
- 31.Lorente de No R. Studies on the structure of the cerebral cortex. II. Continuation of the study of the ammonic system. J Psychol Neurol. 1934;46:113–177. [Google Scholar]
- 32.Maconochie DJ, Knight DE. A method for making solution changes in the sub-millisecond range at the tip of a patch pipette. Pflügers Arch. 1989;414:589–596. doi: 10.1007/BF00580996. [DOI] [PubMed] [Google Scholar]
- 33.Miles R, Toth K, Gulyas AI, Hajos N, Freund TF. Differences between somatic and dendritic inhibition in the hippocampus. Neuron. 1996;16:815–823. doi: 10.1016/s0896-6273(00)80101-4. [DOI] [PubMed] [Google Scholar]
- 34.Misgeld U, Deisz RA, Dodt HU, Lux HD. The role of chloride transport in postsynaptic inhibition of hippocampal neurons. Science. 1986;232:1413–1415. doi: 10.1126/science.2424084. [DOI] [PubMed] [Google Scholar]
- 35.Mody I, Tanelian DL, MacIver MB. Halothane enhances tonic neuronal inhibition by elevating intracellular calcium. Brain Res. 1991;538:319–323. doi: 10.1016/0006-8993(91)90447-4. [DOI] [PubMed] [Google Scholar]
- 36.Morest KK, Jean-Baptiste M. Degeneration and phagocytosis of synaptic endings and axons in the medial trapezoid nucleus of the cat. J Comp Neurol. 1975;162:135–156. [Google Scholar]
- 37.Mott DD, Lewis DV. Facilitation of the induction of long-term potentiation by GABAB receptors. Science. 1991;252:1718–1720. doi: 10.1126/science.1675489. [DOI] [PubMed] [Google Scholar]
- 38.Mugnaini E, Floris A, Wright-Goss M. Extraordinary synapses of the unipolar brush cell: an electron microscopic study in the rat cerebellum. Synapse. 1994;16:284–311. doi: 10.1002/syn.890160406. [DOI] [PubMed] [Google Scholar]
- 39.Otis TS, Mody I. Modulation of decay kinetics and frequency of GABAA receptor-mediated spontaneous inhibitory postsynaptic currents in hippocampal neurons. Neuroscience. 1992;49:13–32. doi: 10.1016/0306-4522(92)90073-b. [DOI] [PubMed] [Google Scholar]
- 40.Otis TS, Wu YC, Trussell LO. Delayed clearance of transmitter and the role of glutamate transporters at synapses with multiple release sites. J Neurosci. 1996;16:1634–1644. doi: 10.1523/JNEUROSCI.16-05-01634.1996. [DOI] [PMC free article] [PubMed] [Google Scholar]
- 41.Ouardouz M, Lacaille J-C. Properties of unitary IPSCs in hippocampal pyramidal cells originating from different types of interneurons in young rats. J Neurophysiol. 1997;77:1939–1949. doi: 10.1152/jn.1997.77.4.1939. [DOI] [PubMed] [Google Scholar]
- 42.Pearce RA. Physiological evidence for two distinct GABAA responses in rat hippocampus. Neuron. 1993;10:189–200. doi: 10.1016/0896-6273(93)90310-n. [DOI] [PubMed] [Google Scholar]
- 43.Pearce RA. Volatile anesthetic enhancement of paired-pulse depression investigated in the rat hippocampus in vitro. J Physiol (Lond) 1996;492:823–840. doi: 10.1113/jphysiol.1996.sp021349. [DOI] [PMC free article] [PubMed] [Google Scholar]
- 44.Puia G, Costa E, Vicini S. Functional diversity of GABA-activated Cl− currents in Purkinje versus granule neurons in rat cerebellar slices. Neuron. 1994;12:117–126. doi: 10.1016/0896-6273(94)90157-0. [DOI] [PubMed] [Google Scholar]
- 45.Raman IM, Trussell LO. The mechanism of α-amino-3-hydroxy-5-methyl-4-isoxazolepropionate receptor desensitization after removal of glutamate. Biophys J. 1995;68:137–146. doi: 10.1016/S0006-3495(95)80168-2. [DOI] [PMC free article] [PubMed] [Google Scholar]
- 46.Roepstorff A, Lambert JDC. Factors contributing to the decay of the stimulus-evoked IPSC in rat hippocampal CA1 neurons. J Neurophysiol. 1994;72:2911–2926. doi: 10.1152/jn.1994.72.6.2911. [DOI] [PubMed] [Google Scholar]
- 47.Ropert N, Miles R, Korn H. Characteristics of miniature inhibitory postsynaptic currents in CA1 pyramidal neurones of rat hippocampus. J Physiol (Lond) 1990;428:707–722. doi: 10.1113/jphysiol.1990.sp018236. [DOI] [PMC free article] [PubMed] [Google Scholar]
- 48.Rossi DJ, Alford S, Mugnaini E, Slater NT. Properties of transmission at a giant glutamatergic synapse in cerebellum: the mossy fiber–unipolar brush cell synapse. J Neurophysiol. 1995;74:24–42. doi: 10.1152/jn.1995.74.1.24. [DOI] [PubMed] [Google Scholar]
- 49.Schwartzkroin PA, Mathers LH. Physiological and morphological identification of a nonpyramidal hippocampal cell type. Brain Res. 1978;157:1–10. doi: 10.1016/0006-8993(78)90991-5. [DOI] [PubMed] [Google Scholar]
- 50.Sik A, Penttonen M, Ylinen A, Buzsáki G. Hippocampal CA1 interneurons: an in vivo intracellular labeling study. J Neurosci. 1995;15:6651–6665. doi: 10.1523/JNEUROSCI.15-10-06651.1995. [DOI] [PMC free article] [PubMed] [Google Scholar]
- 51.Takahashi M, Kovalchuk Y, Attwell D. Pre- and postsynaptic determinants of EPSC waveform at cerebellar climbing fiber and parallel fiber to Purkinje cell synapses. J Neurosci. 1995;15:5693–5702. doi: 10.1523/JNEUROSCI.15-08-05693.1995. [DOI] [PMC free article] [PubMed] [Google Scholar]
- 52.Tia S, Wang JF, Kotchabhakdi N, Vicini S. Developmental changes of inhibitory synaptic currents in cerebellar granule neurons—role of GABAA receptor α-6 subunit. J Neurosci. 1996;16:3630–3640. doi: 10.1523/JNEUROSCI.16-11-03630.1996. [DOI] [PMC free article] [PubMed] [Google Scholar]
- 53.Trussell LO, Zhang S, Raman IM. Desensitization of AMPA receptors upon multiquantal neurotransmitter release. Neuron. 1993;10:1185–1196. doi: 10.1016/0896-6273(93)90066-z. [DOI] [PubMed] [Google Scholar]
- 54.Vautrin J, Barker JL. Skewed miniatures test the quantal hypothesis. Comments Theor Biol. 1994;3:309–338. [Google Scholar]
- 55.Verdoorn TA. Formation of heteromeric gamma-aminob tyric acid type A receptors containing two different alpha subunits. Mol Pharmacol. 1994;45:475–480. [PubMed] [Google Scholar]
- 56.Vinogradova OS. Expression, control, and probable functional significance of the neuronal theta rhythm [review]. Prog Neurobiol. 1995;45:523–583. doi: 10.1016/0301-0082(94)00051-i. [DOI] [PubMed] [Google Scholar]
- 57.Wafford KA, Thompson SA, Thomas D, Sikela J, Wilcox AS, Whiting PJ. Functional characterization of human gamma-aminobutyric acid (a) receptors containing the alpha-4 subunit. Mol Pharmacol. 1996;50:670–678. [PubMed] [Google Scholar]
- 58.Williams S, Samulack DD, Beaulieu C, Lacaille JC. Membrane properties and synaptic responses of interneurons located near the stratum lacunosum-moleculare/radiatum border of area CA1 in whole-cell recordings from rat hippocampal slices. J Neurophysiol. 1994;71:2217–2235. doi: 10.1152/jn.1994.71.6.2217. [DOI] [PubMed] [Google Scholar]