Abstract
We examined the functional organization of the vagal nuclei of the rat embryo during morphogenesis, using multiple-site optical recording with a voltage-sensitive dye. Slice preparations with vagus nerve fibers were dissected from 13- to 16-d-old embryonic (E13–E16) rat brainstems, and they were stained with the dye. Electrical activity in response to vagal stimulation was recorded optically from many sites. In the E13–E14 preparations, two types of spike-like optical signals were recorded: one was a narrow signal (type I), and the other was a broader signal (type II). Comparison with the morphology revealed by DiI labeling suggests that the type I signal response area corresponds to the nucleus of the tractus solitarius, and the type II signal response area corresponds to the dorsal motor nucleus of the vagus nerve. In the E15–E16 preparations, type I signals were followed by a slow signal related to glutamate-mediated excitatory postsynaptic potentials, suggesting that synaptic function is organized in the nucleus of the tractus solitarius by the 15-d-old embryonic stage. In the E14 preparation, a small, slow signal was evoked only in Mg2+-free solution, implying that postsynaptic function related to NMDA receptors emerges, in latent form, at the 14-d-old embryonic stage. In the E15 and E16 preparations, although the nucleus ambiguus is identified morphologically, no neural response-related optical signal was observed there, indicating that the embryonic organization of morphology and physiological function is not necessarily temporally coincident. We have mapped the dynamic spatiotemporal patterns of the evoked optical signals and have outlined the early phase of the functional organization of the cranial nuclei related to the vagus.
Keywords: optical mapping, brainstem, vagal nuclei, development, synaptic activity, voltage-sensitive dye
Ontogenetic approaches to the emergence of spatiotemporal patterns of electrical activity in neural circuits could be a useful and rational strategy to study the functional organization and architecture of the extremely complex CNSs of mammals. Electrophysiological experiments on early embryonic CNSs of mammals, however, are often difficult or impossible because of the small size and fragility of the young embryonic cells. Thus, little is known about the ontogenesis and early embryonic development of the functional organization and architecture in the mammalian CNS.
Optical techniques using fast voltage-sensitive dyes have made it possible to monitor electrical activities in small cells that are difficult or impossible to access by traditional electrophysiological means and also to facilitate the simultaneous recording of electrical activity from multiple sites in living systems such as CNSs (Salzberg et al., 1977; Cohen and Salzberg, 1978; Grinvald et al., 1988;Salzberg, 1983, 1989; Kamino, 1990). A particularly important application of this technique using photodiodes involves the analysis of the components of presynaptic and postsynaptic potentials based on the analysis of the shapes of the signal wave (Grinvald et al., 1982;Komuro et al., 1991; Momose-Sato et al., 1994).
Our previous studies have established the feasibility of using optical techniques to record the electrical activity in brainstem preparations isolated from early developing embryos; using such optical techniques, we have investigated the onset and early development of action potential activity evoked by vagus, or glossopharyngeal stimulation in young embryonic chick brainstems during early developmental stages (Kamino et al., 1989b, 1990; Momose-Sato et al., 1991, 1994; Sato et al., 1995), and we found that distinct glutamate-mediated EPSPs are generated within the nucleus of the tractus solitarius in 7-d-old embryonic chick brainstems (Komuro et al., 1991; Momose-Sato et al., 1991, 1994). In addition, in experiments using two antagonists,DL-2-amino-5-phosphonovaleric acid (APV) and 6-cyano-7-nitroquinoxaline-2,3-dione (CNQX) for EPSP-related slow optical signals, we have identified NMDA and non-NMDA receptor-related phases (Komuro et al., 1991; Momose-Sato et al., 1994). Subsequently we reported the early developmental characteristics of the Mg2+-sensitive components of the slow signals (Momose-Sato et al., 1994). We have also found, recently, that the glutamatergic EPSP-related slow optical signal is reduced by GABA (Momose-Sato et al., 1995a) and by glycine at high concentration (Sato et al., 1996b).
Throughout those investigations, inevitably, we have noted the embryogenesis of the electrical activity and functional organization in mammalian CNSs. Here we address some aspects of the electrical activity that occurs in response to vagus stimulations in the earlier embryonic rat brainstem. Using a 1020-element photodiode array recording system that has been developed recently (Hirota et al., 1995), together with a 128-element photodiode array system, we first began to monitor electrical activity evoked by vagal stimulation in the brainstem preparation with the goal of exploring the spatiotemporal patterning of the neural responses and then traced the embryonic functional organization of the vagus related nuclei.
Preliminary results have been presented previously in abstract form (Sato et al., 1996a).
MATERIALS AND METHODS
Preparations. In the present experiments, we used 13- to 16-d-old embryonic (E13–E16; n = 118) rat brainstem slice preparations (the date of mating was designated embryonic day 0). Wistar rats of 13–16 d gestation were anesthetized deeply with ether, and fetuses were removed surgically. The brainstems with vagus nerve fibers were dissected from the embryos. The isolated brainstem preparation was attached to the silicone (KE 106LTV; Shin-etsu Chemical Co., Tokyo, Japan) bottom of a simple chamber by pinning it with tungsten wires. The preparation was kept in a bathing solution with the following composition (in mm): NaCl, 149; KCl, 5.4; CaCl2, 1.8; MgCl2, 0.5; glucose, 10; and Tris-HCl buffer, pH 7.4, 10. The solution was equilibrated with oxygen. The pia mater attached to the brainstem was carefully removed in the bathing solution under a dissecting microscope. Slices were then prepared, with the right and/or left vagus nerve fibers attached, by sectioning the embryonic brainstem transversely at the level of the root of the vagus nerve. The thickness of the slice was ∼1000–1500 μm.
Voltage-sensitive dye staining. The isolated slice preparation was stained by incubating it for 15–20 min in a Ringer’s solution containing 0.2 mg/ml voltage-sensitive merocyanine–rhodanine dye NK2761 (Nippon Kankoh Shikiso Kenkyusho, Okayama, Japan) (Kamino et al., 1981, 1989a; Salzberg et al., 1983; Kamino, 1991; Momose-Sato et al., 1995b), and the excess (unbound) dye was washed away with dye-free Ringer’s solution before recording. This merocyanine–rhodanine dye has been established to be particularly useful in embryonic nervous and cardiac tissues (Kamino, 1990,1991). Furthermore, it has been confirmed that the immature cellular–interstitial structure of the early embryonic brainstem preparations allows the dye to diffuse readily from the surface to the interior regions (Sato et al., 1995).
Electrical stimulation. For preparations in which the vagus nerve was stimulated, the cut end of the nerve was drawn into a microsuction electrode fabricated from TERUMO hematocrit tubing (VC-HO75P; TERUMO Co., Tokyo, Japan), which had been hand-pulled to a fine tip (∼100 μm internal diameter) over a low-temperature flame. Positive (depolarizing) square current pulses (8.0 μA/5.0 msec), which evoked maximum responses, were applied to the right or left vagus nerve.
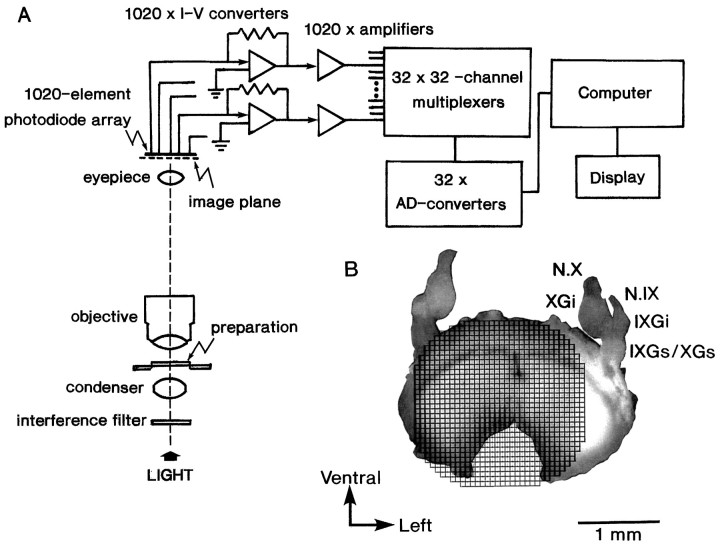
Optical recording. Light from a 300 W tungsten–halogen lamp (type JC-24V/300W; Kondo Philips Ltd., Tokyo, Japan) was collimated, rendered quasimonochromatic with a heat filter (32.5B-76; Olympus Optical Co., Tokyo, Japan) and an interference filter having a transmission maximum at 703 ± 15 nm (Asahi Spectra Co., Tokyo, Japan), and focused on the preparation by means of a bright field condenser with a numerical aperture (NA) matched to that of the microscope objective (S plan Apo, 10×, 0.4 NA). The objective and photographic eyepiece (2.5×) projected a real image of the preparation (magnification, 25×) onto a multielement silicon photodiode matrix array mounted on an Olympus Vanox microscope (type AHB-L-1). In the present experiments, we used two optical recording systems. One is a 1020-site optical recording system with a 34 × 34-element silicon photodiode array (Hamamatsu Photonics, Hamamatsu, Japan), which had been constructed recently in this laboratory (Hirota et al., 1995). In Figure 1A, the schematic diagram of the system is illustrated. In this system, each pixel (element) of the array detected light transmitted by a square region (54 × 54 μm2) of the preparation. An example of the relative position of the photodiode array on the image of the preparation is shown in Figure 1B. The outputs from 1020 elements were fed into amplifiers via current-to-voltage converters and then passed to 32 sets of 32-channel analog multiplexers. Each output from the 32-channel multiplexers was fed into a subranging type analog-to-digital (AD) converter system with a resolution of 18 bits and was sent to a computer (LSI-11/73 system; Digital Equipment Co., Tewksbury, MA). The AD converter was designed originally in this laboratory (Hirota et al., 1995). Another recording system is a 128-channel multiple-site optical recording system using a 12 × 12-element silicon photodiode array (MD-144–4PV; Centronic Ltd., Croydon, UK). This system has been described in detail elsewhere (Komuro et al., 1991; Momose-Sato et al., 1991, 1994) (for review, seeKamino, 1990, 1991). In this system, each pixel of the array detected light from a square region (56 × 56 μm2) of the preparation. The output of each detector in the diode array was passed to an amplifier (AC coupling = 3 sec) via a current-to-voltage converter. The amplified outputs from 127 elements of the detector were first recorded simultaneously on a 128-channel recording system (RP-890 series; NF Electronic Instruments, Yokohama, Japan) and then were passed to a computer (LSI-11/73 system, Digital Equipment). The 128-channel data recording system is composed of a main processor (RP-891), eight input–output processors (RP-893), a 64,000 word wave memory (RP-892), and a videotape recorder. The time resolution of these systems was ≃1 msec. The recordings were made in a single sweep (for additional details, also see Fig. 1 legend). The optical measurement was performed in a still chamber without continuous perfusion with Ringer’s solution, at room temperature, 26–28°C. The incident light was turned off except during the measuring period. Under these conditions, the evoked optical signals can often be detected continuously for >30 min. In some experiments, we performed measurements with continuous perfusion (∼5 ml/min), and there was no difference between data with and without perfusion.
Fig. 1.
Schematic drawing of the simultaneous 1020-site optical recording system. A, The preparation chamber is mounted on the stage of an Olympus Vanox microscope (type AHB-L-1). Bright-field illumination is provided by a 300 W tungsten–halogen lamp (type JC-24V/300W, Kondo-Philips) driven by a stable DC power supply. Incident light is collimated, passed through a 703 ± 15 nm interference filter (Asahi Spectra), and focused on the preparation by means of a bright-field condenser with an NA matched to that of the microscope objective (S plan Apo, 10×, 0.4 NA). The objective and photographic eyepieces project a magnified real image of the preparation onto a 34 × 34-element silicon photodiode array. The outputs from 1020 elements are fed into individual current-to-voltage converters followed by individual amplifiers. The amplified outputs are then fed into 32 sets of 32-channel analog multiplexers via individual RC low-pass filters. Each output of the 32 analog-to-digital conversion systems is digitally multiplexed and is sent to a specially designed interface in the computer system (LSI 11/73 system, Digital Equipment) using a fiber-optic transmission system. The time resolution of this system is 1024 samples/sec for each element. B, Example of the relative positions of the image of the brainstem slice preparation dissected from a 16-d-old rat embryo and the 1020-element photodiode array grids. N.IX, Glossopharyngeal nerve;N.X, vagus nerve; IXGs, superior glossopharyngeal ganglion; IXGi, inferior glossopharyngeal ganglion; XGs, superior vagal ganglion;XGi, inferior vagal ganglion.
DiI labeling. The 1,1′-dioctadecyl-3,3,3′,3′-tetramethylindocarbocyanine perchlorate (DiI) labeling method that we have used was essentially similar to that described by Godement et al. (1987). Embryos used for DiI labeling studies were fixed with 4% paraformaldehyde in 0.1 mphosphate buffer, pH 7.4. A small crystal of the fluorescent neuronal tracer DiI (Molecular Probes, Eugene, OR) was placed in the region of the nodose ganglion. Brainstem slice preparations with DiI placements were stored in 4% paraformaldehyde for 2–8 weeks at room temperature. The brainstem dissected free from surrounding tissue was embedded in 3% gelatin and was sectioned in the transverse plane at a thickness of 50 μm on a vibratome (microslicer DTK-2000; Dosaka EM, Kyoto, Japan). Wet-mounted sections were examined with an epifluorescence microscope (Fluophot; Nikon Co. Tokyo, Japan) equipped with a rhodamine filter set (excitation, 520–550 nm; emission, >570 nm).
RESULTS
Optical signals in response to vagal stimulus
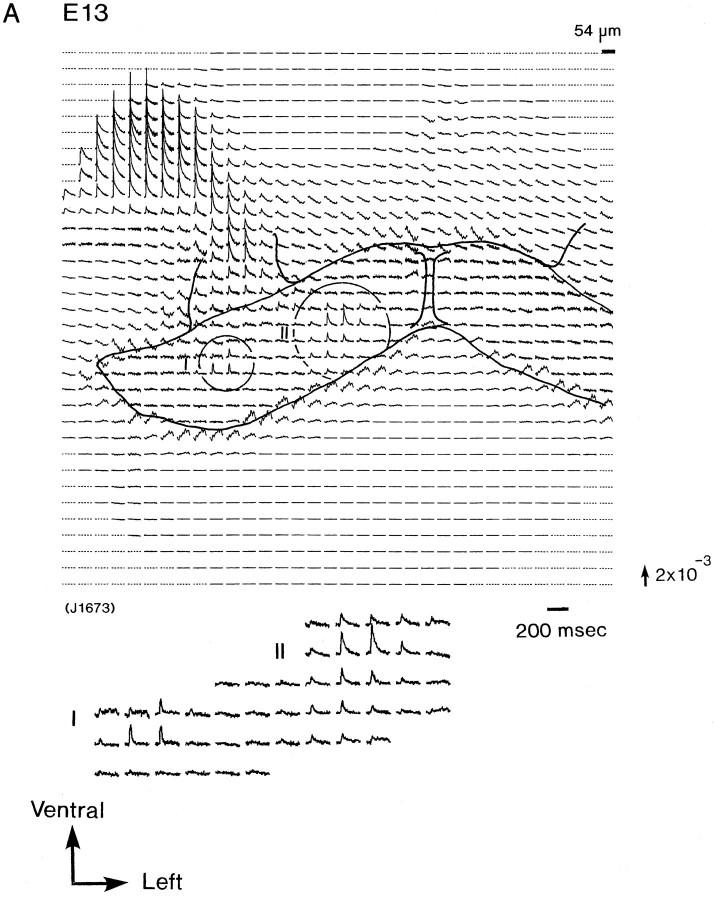
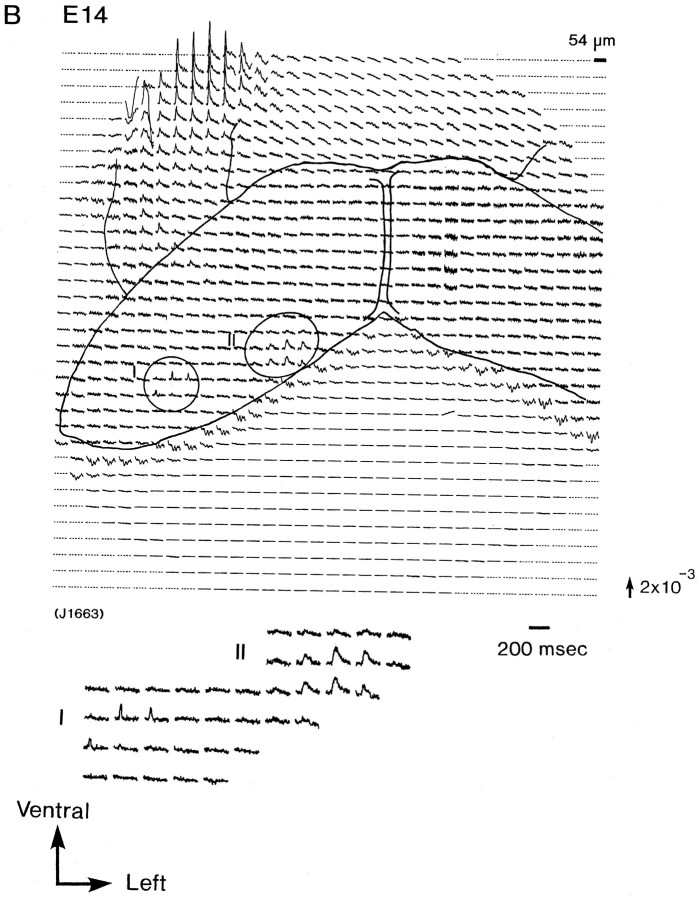
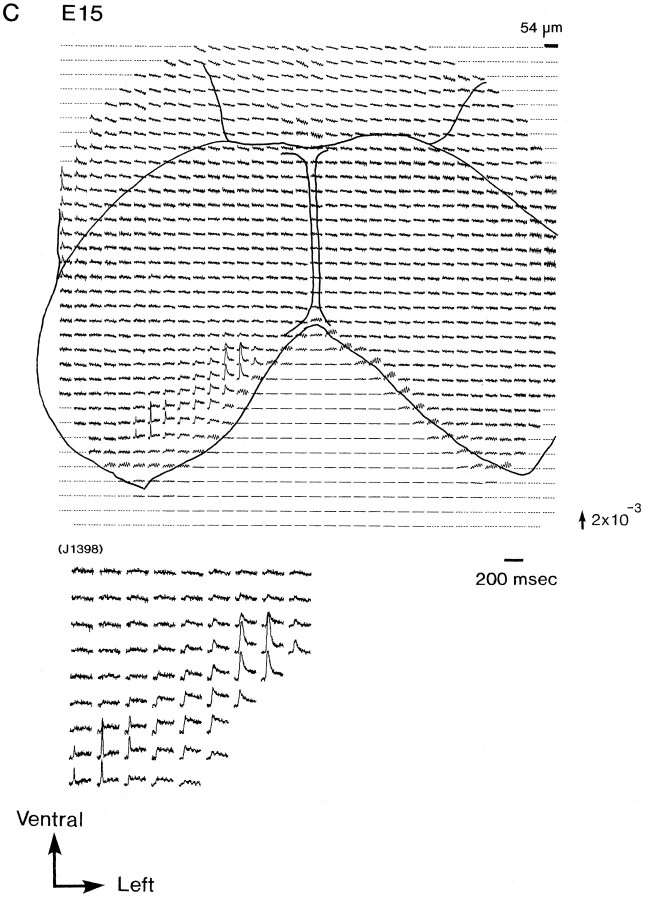
Figure 2 illustrates a series of multiple-site optical recordings of neural activities in response to vagal stimulations in E13–E16 rat brainstem preparations. The electrical activities were evoked by a brief depolarizing square current (8 μA/5.0 msec), which gave the maximum response, applied to the right vagus nerve, and they were optically recorded simultaneously from many sites of the preparation, using a 1020-element photodiode array in a single sweep without averaging. We detected the optical signals with a signal-to-noise ratio of >30. There was essentially no deterioration of the optical signal, either from photobleaching or photodynamic damage, over a 30 min. On each recording, the relative position of the photodiode array on the image of the preparation is drawn. Each photodiode element detected optical signals from a 54 × 54 μm2 area in the preparation.
Fig. 2.
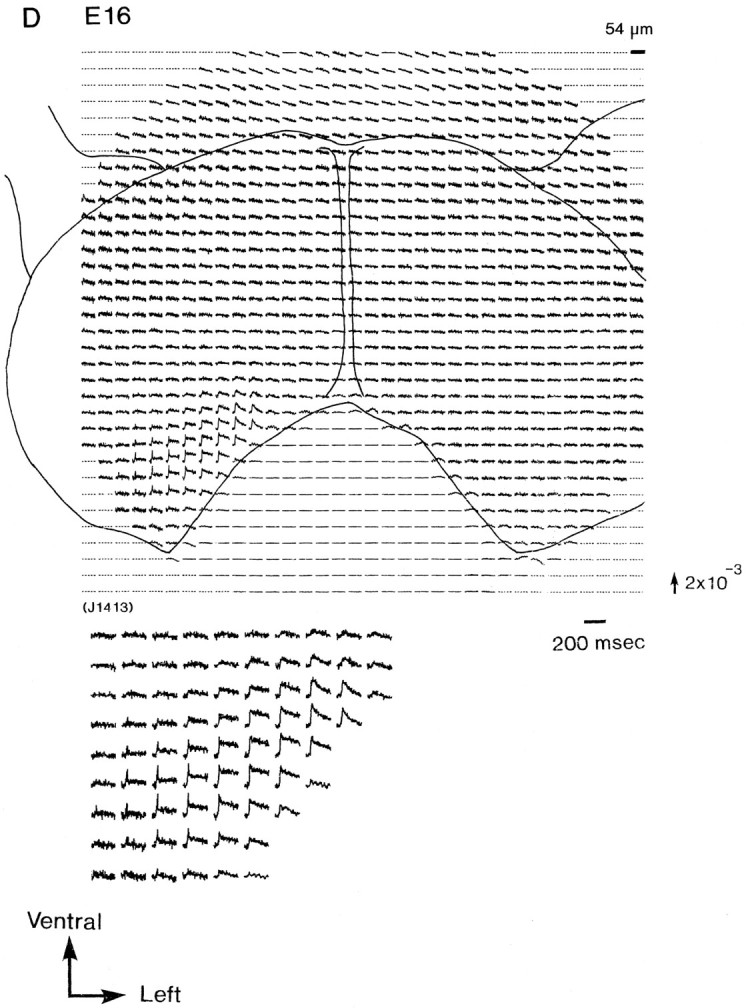
Simultaneous multisite optical recordings of neural responses. The optical signals were evoked by vagal stimulation, and they were recorded from E13 (A), E14 (B), E15 (C), and E16 (D) slice preparations, using the 1020-element photodiode array. The insets at thebottom left of each recording show the enlarged traces of the evoked optical signals. These signals were obtained in a single sweep. The direction of the arrow to theright of the recordings indicates a decrease in transmitted light intensity (increase in absorption), and the length of the arrow represents the stated value of the fractional change (the change in the light intensity divided by DC background intensity).
E13 and E14 preparations
The present 1020-site optical recording system can detect the signals from a large area in the brainstem preparation. Therefore, we have been able to identify more easily the relative location of the response area(s). First, in the recordings obtained from E13 and E14 preparations (Fig. 2A,B), two response areas that were spatially separated were discriminated in the dorsal portion of the preparation: one (response area I, labeled area I) was located on the dorsolateral portion, and the other (response area II, labeled area II) was located on the dorsomedial portion on the stimulated side of the preparation. Similar results were obtained in three preparations of E13 and in 24 preparations of E14. Although the signals detected from the two areas were simple in shape, a definite difference was observed in the waveforms of the signals from areas I and II. Area I exhibited shorter-duration signals (mean ± SD of half-width, 9.1 ± 0.9 msec; n = 10; labeled type I), and area II displayed longer-duration signals (22.9 ± 5.0 msec half-width;n = 10; labeled type II). This difference in the waveform exhibited in the two response areas (areas I and II) may have significant physiological and anatomical implications (see Discussion).
When tetrodotoxin (TTX; 20 μm) was applied to the bathing solution, the signals (types I and II) were completely blocked. This result indicates that these signals were the results of action potentials and/or the terminal depolarization. In the part of the nodose ganglion and the root of the vagus nerve, electrotonic potential-related signals, which were not blocked by TTX, were detected.
E15 and E16 preparations
In E15 and E16 preparations (Fig. 2C,D), another type of signal (type III), composed of two components, a first, fast signal component that appeared to correspond to a type I or II signal and a second, delayed slow component, was detected. Type I and type II signals were detected from the right and left marginal zones of the response area, respectively. On the other hand, type III signals were detected from the boundary (overlapping) area of areas I and II. Both the fast and slow signals in type III signals were wavelength-dependent, in the same manner as the action spectra of the used merocyanine–rhodanine dye (Momose-Sato et al., 1995b). This result indicates that they originate from evoked membrane potential changes. Similar results were obtained from 24 preparations of E15 and 34 preparations of E16.
For type III signal, two subtypes (types IIIa and IIIb) could be distinguished. Type IIIa signals appeared to be composed of a type I signal and a slow signal, and type IIIb signals were composed of a type II signal and a slow signal. In Figure 3, types I, II, and III (a and b) signals are displayed on an expanded time base. This issue will be taken up again in Discussion.
Fig. 3.
Four types of the evoked signals. Type I and type II were selected from the 1020-element photodiode array optical recording in an E14 preparation, and type IIIa and type IIIb were from an E16 preparation. See Results for additional details.
Slow signals
Electrophysiologically, four separate events related to synaptic transmission are identified: (1) the presynaptic action potential, (2) the Ca2+ current in the presynaptic nerve terminal, (3) the synaptic potential in the postsynaptic cell, and (4) the spike in the postsynaptic neuron.
Previously, we have reported that the signals that are composed of fast and slow components, which were similar to type III signals, are observed in the early embryonic chick brainstem preparations, and that the slow optical signals correspond to glutamatergic excitatory postsynaptic potentials (Komuro et al., 1991; Momose-Sato et al., 1994;Sato et al., 1995). In the present study, we also examined some characteristics of the slow signal.
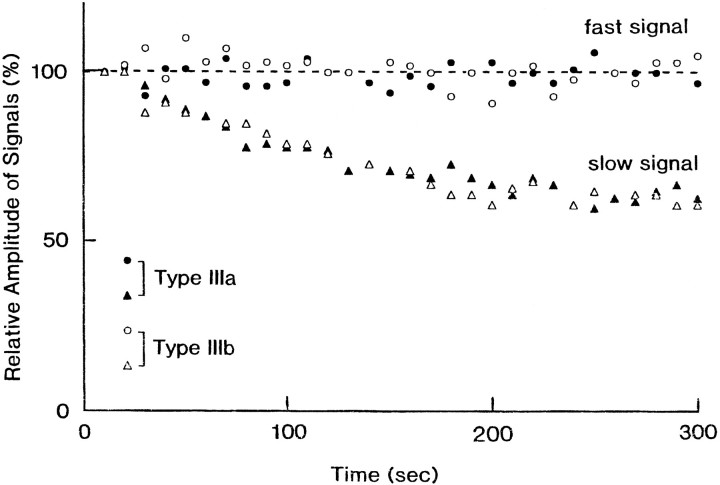
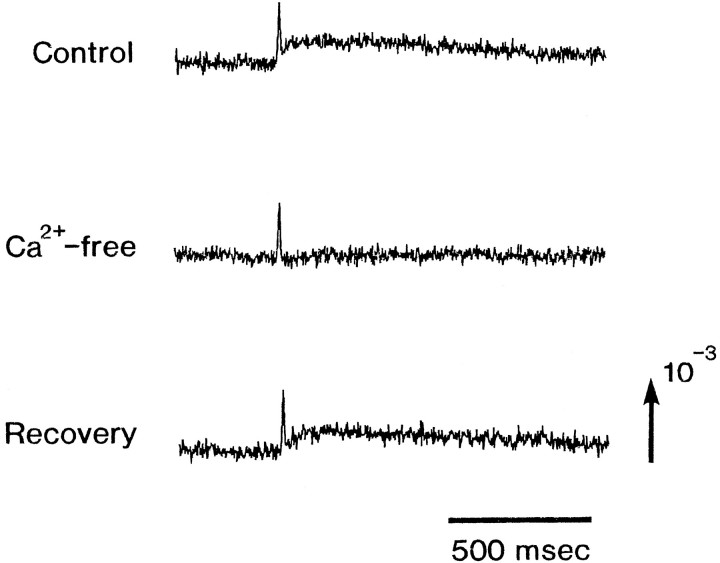
Figure 4 shows the effects of repetitive stimulation on type IIIa and IIIb signals detected from an E16 preparation. In both type IIIa and IIIb signals, the amplitudes of the slow optical signals were decreased exponentially with repetitive stimulation (0.1 Hz) applied to the vagus nerve. Although the plots were scattered, the fast spike-like signals appeared not to be affected. This effect seems to reflect synaptic fatigue, and if so, it argues that the slow signal is related to the postsynaptic potential. As shown in Figure 5, the slow signals were also eliminated in Ca2+-free Ringer’s solution and were blocked by either Cd2+ or Mn2+ (data not shown), supporting the idea that the slow signal represents the postsynaptic potential.
Fig. 4.
The decrease in the slow optical signal amplitude with repetitive stimulation. The measurements were made on an E16 preparation. Square current pulses of 8 μA/5.0 msec and 0.1 Hz were applied to the right vagus nerve. The relative amplitudes of the fast and slow signals in type IIIa and type IIIb are plotted against time in seconds. Closed circles, Fast signals in type IIIa;closed triangles, slow signals in type IIIa; open circles, fast signals in type IIIb; open triangles, slow signals in type IIIb.
Fig. 5.
Optical signals detected in control and Ca2+-free bathing solution. In Ca2+-free Ringer’s solution, CaCl2 was replaced by MgCl2. The recording was made 15 min after the replacement of Ca2+ with Mg2+. Similarly, the recovery experiment was made 15 min after replacement of the Ca2+-free Ringer’s solution with normal Ringer’s solution. Note that the slow signal was eliminated in the Ca2+-free Ringer’s solution.
APV and CNQX sensitivity
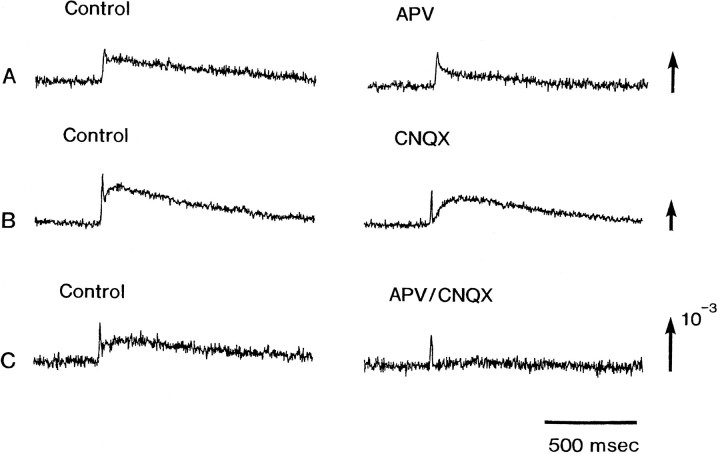
It is well known that APV is an NMDA receptor antagonist (Nelson et al., 1986) and that CNQX is a non-NMDA receptor antagonist (Yamada et al., 1989). Accordingly, we tested the effects of APV and CNQX on the slow signal. The later phase of the slow signals (both in type IIIa and IIIb signals) was reduced by APV (200 μm), and the initial phase was reduced by CNQX (5 μm). Each example is shown in Figure 6, A(top traces) and B (middle traces). When APV was added together with CNQX, the slow signals were eliminated completely (Fig. 6C, bottom traces). These results suggest that the slow signal displays the glutamate-mediated excitatory postsynaptic potential, that the initial phase of the slow signal was mainly attributable to non-NMDA receptors, and that the later phase was attributable to NMDA receptors.
Fig. 6.
The effects of APV and CNQX on the postsynaptic slow signals. The data were obtained from three different E16 preparations. A was obtained in the APV (200 μm)-containing bathing solution; B was in the CNQX (5 μm)-containing solution, and Cwas made in the presence of APV (190 μm) together with CNQX (5 μm). The recordings were made ∼15 min after application of the drugs.
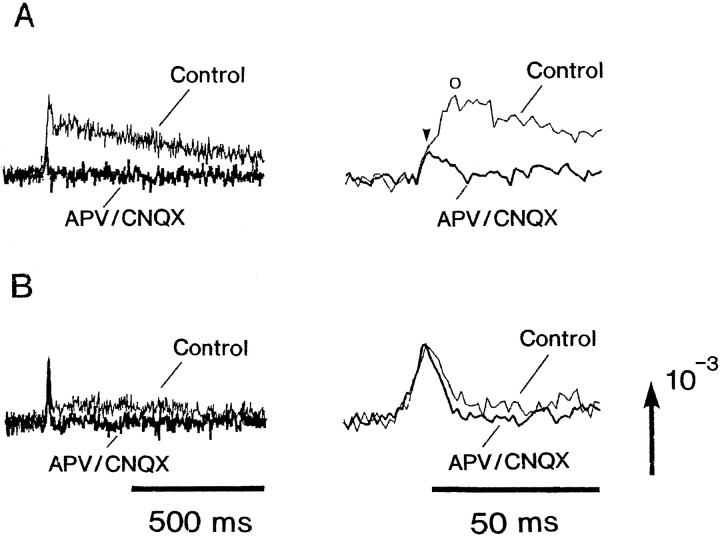
In the recordings shown in Figure 6, B and C, during the application of CNQX and the application of APV and CNQX, the fast optical signals were also reduced. To clarify this event, we made additional experiments. The obtained results are illustrated in Figure7. In type IIIa signal, of which the slow signal was relatively large (Fig. 7A), the fast signal was reduced during the application of APV together with CNQX, whereas in type IIIa signal, of which the slow signal was relatively small, the fast signal was not affected, although the slow signal was reduced. Furthermore, on the right traces, the expanded time base makes it clear that the fast signal associated with the larger slow signal contains the presynaptic action potential (Fig. 7A,arrowhead) and the firing in the postsynaptic neurons (Fig.7A, open circle), whereas the fast signal associated with the smaller slow signal contains the presynaptic action potential alone. These results indicate that type IIIa signal should be classified further into two subtypes, type IIIa(1) and type IIIa(2), and that in type IIIa(1) signals, the fast signal contains the presynaptic and postsynaptic action potential-related components (also see Fig. 16). Indeed, in type IIIa(1) signals, it was often observed that the fast signals were partly reduced by the repetitive stimuli and in a Ca2+-free Ringer’s solution.
Fig. 7.
Illustrations that might account for the case in which the fast signal in type IIIa contains the presynaptic and postsynaptic action potential components. In A, both the fast and slow signals were reduced in the presence of APV together with CNQX. The enlargements of the signals are shown on theright. This expanded time base reveals that the presynaptic and postsynaptic action potentials are overlapped. In such a case, the slow signals were often relatively large. InB, the fast signal is not altered in the presence of APV and CNQX. In this case, the slow signal was often small. Thin traces are control in normal Ringer’s solution; thick traces are recordings made in APV (190 μm)- and CNQX (5 μm)-containing solution.
Fig. 16.
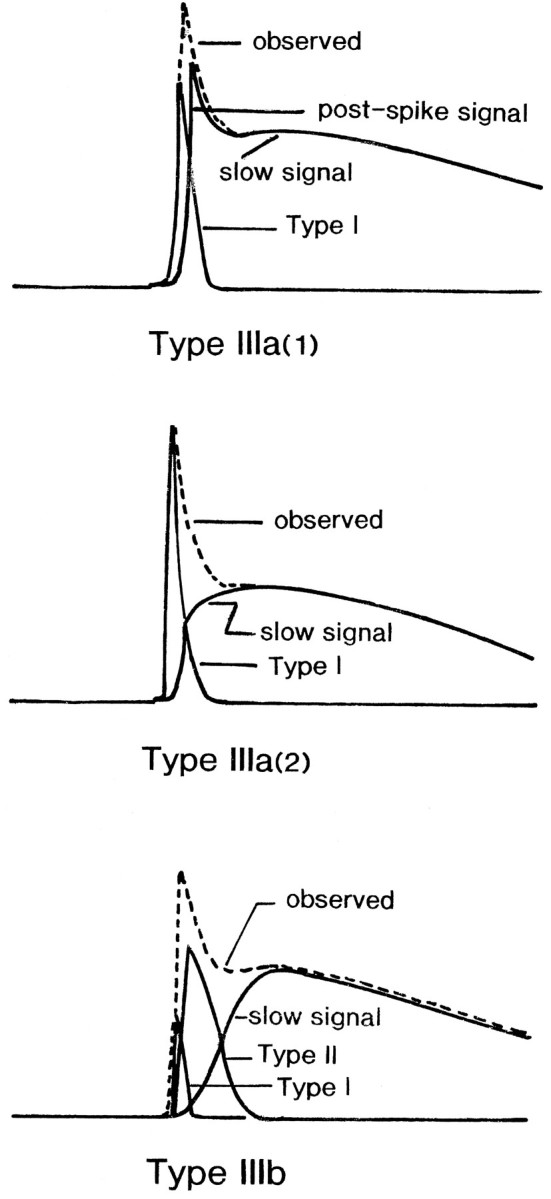
Schematic representation of plausible origins of the different components of type IIIa(1), type IIIa(2), and type IIIb signals evoked by vagal stimulation. The dashed linesindicate the observed signals; the solid lines show type I, type II, and slow signals. See Discussion for additional details.
Mg2+ sensitivity
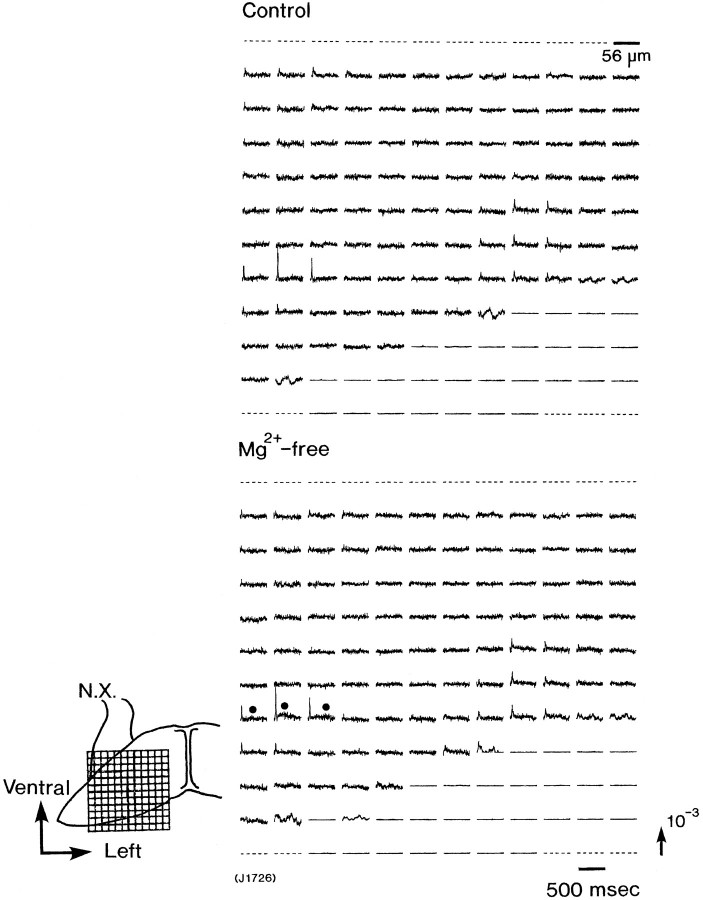
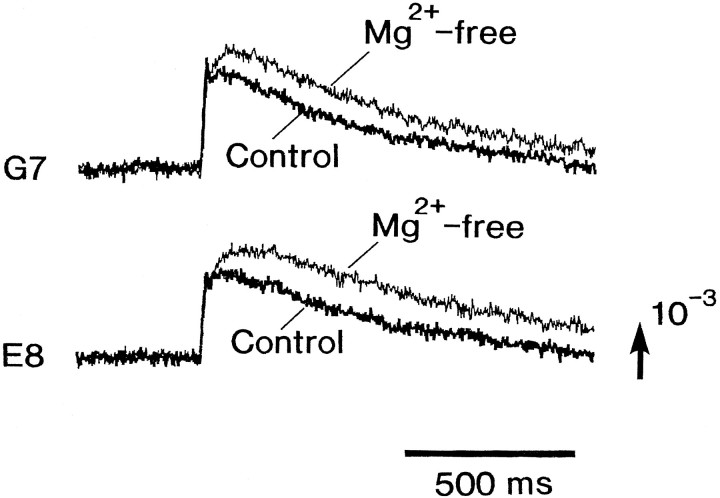
According to the idea that Mg2+ block is a key characteristic of NMDA receptors, we also examined the effects of Mg2+ on the slow signal. Figure8 shows an example of optical recording obtained from an E14 preparation in Mg2+-free Ringer’s solution. In normal Ringer’s solution containing 0.5 mm Mg2+, explicitly, only type I signals were detected in area I. Whereas, when Mg2+ was removed from the Ringer’s solution, in area I, small slow signals accompanied by type I signal were evoked (Fig. 8, solid circles). Such slow signals were not elicited in area II in Mg2+-free Ringer’s solution. Figure9 shows the enhancement of the amplitude of the slow signals observed in an E16 preparation in Mg2+-free Ringer’s solution.
Fig. 8.
Appearance of the slow signal in Mg2+-free bathing solution. The signals were obtained from an E14 preparation; in normal Ringer’s solution, no slow optical signal was observed (in the top recording), and in the Mg2+-free solution, small slow signals were detected (solid circles in the bottomrecording). These recordings were made by using the 128-element photodiode array.
Fig. 9.
Enhancement of the slow signal in Mg2+-free bathing solution. The signals were recorded from an E16 preparation in normal Ringer’s solution (thick traces) and in Mg2+-free solution (thin traces). The signals from two sites (G7, E8) were selected from the 128-element photodiode array recording. Note that the fast signals were not altered.
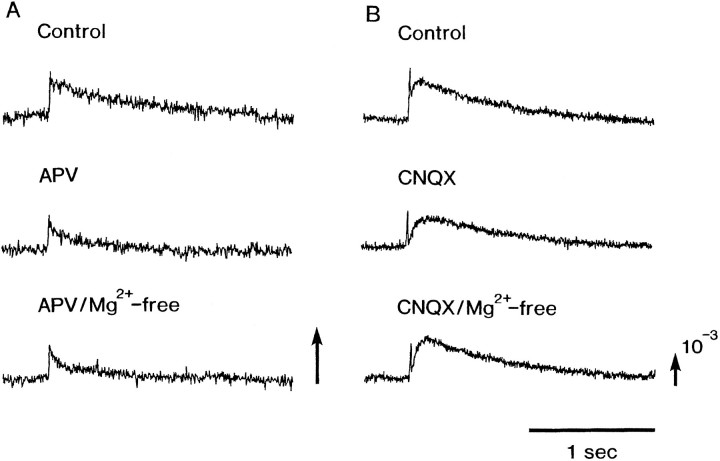
In the Mg2+-free experiment, one may provide a comment that magnesium not only affects NMDA receptors but also the transmitter release in being competitive to calcium. Thus we examined the effect of APV and CNQX on the Mg2+ sensitivity. The slow signals that were induced in the E14 preparations in the Mg2+-free solution were blocked in the presence of APV. Furthermore, in the E15 and E16 preparations, the slow signals were not enhanced in the Mg2+-free solution in the presence of APV, but the slow signal was enhanced in the presence of CNQX (Fig. 10). Therefore, we concluded that most of the Mg2+-sensitive component of the slow signal is attributable to NMDA receptors.
Fig. 10.
Evoked slow optical signals typical of those that appeared in APV-containing Ringer’s solution and APV-containing Mg2+-free Ringer’s solution (A) and in CNQX-containing Ringer’s solution and CNQX-containing Mg2+-free Ringer’s solution (B). The optical recordings were made in two different E16 preparations.
Contour line mapping of optical signals
As may be seen in the original recordings shown in Figure 2, there were regional differences in the amplitudes of the evoked optical signals. Thus, we measured the amplitudes of all of the detected spike-like signals (type I and type II) and slow signals shown in Figure 2, and we constructed contour line maps of the signal amplitudes in normal Ringer’s solution using an interpolation method.
In Figure 11A, the maps that were constructed with the data obtained from the E13–E16 preparations are illustrated. In the maps for the E13 and E14 preparations, two circular (or nearly circular) response areas (areas I and II) were observed. The two areas are spatially disjointed. The amplitudes of type I and type II signals were distributed in a quasiconcentric circular pattern within areas I and II, respectively. In the preparations of the E15 and E16, both areas I and II expanded together with an increase in the amplitudes of the signals. Furthermore, in E15 and E16 preparations, the contour lines of the amplitude of the slow signals partly overlapped areas I and II. This profile in E15 and E16 confused us in the specification of areas I and II. This problem will be considered further in Discussion.
Fig. 11.
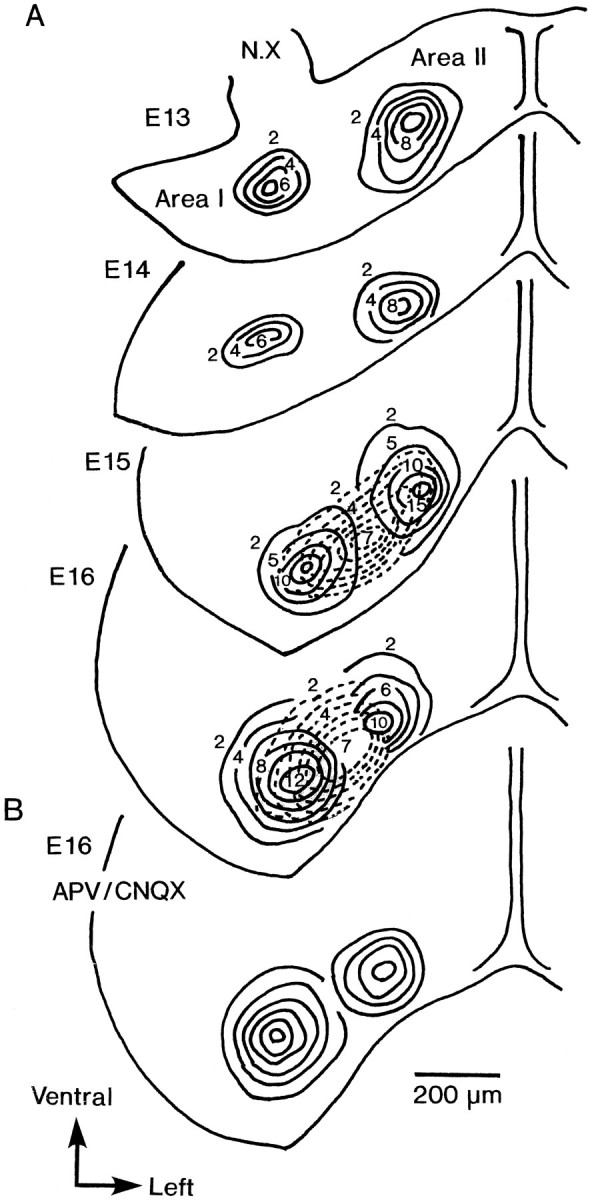
Contour line maps of the amplitude of the optical signals. The data were obtained from E13–E16 preparations, corresponding to the recordings shown in Figure 2(A–D). Solid lines are used for type I and type II fast signals; dotted lines are for the slow signals. In B, the map constructed from the signals obtained in APV and CNQX containing solution is shown. The control for this map is E16 map shown inA.
In addition, Figure 11B illustrates the contour line map for the optical signals recorded from the E16 preparation in a Ringer’s solution containing APV and CNQX. In this map, areas I and II are outlined clearly and are similar to areas I and II traced in the E13 and E14 preparations. Nonetheless, in comparison with E13 and E14, areas I and II in the E15 and E16 preparations were closely apposed, and their boundary was somewhat ambiguous.
Figure 12 summarizes preparation-to-preparation variation in the relative location and size of areas I and II in E13 (n = 3), E14 (n = 4), E15 (n = 4), and E16 (n = 4) preparations. The variation of the areas of the slow signals is also drawn for E15 and E16 preparations. In Figure 12, the spacing between the centers of areas I and II appeared to decrease with embryonic age.
Fig. 12.
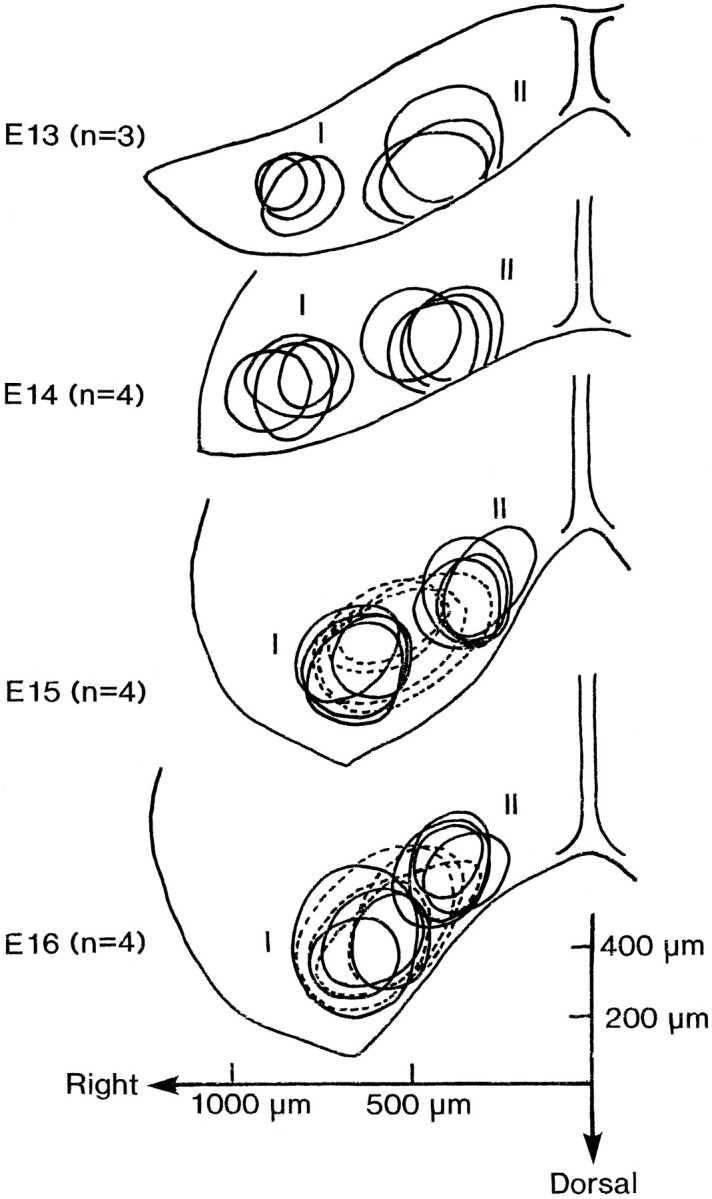
Interpreparation variation of the relative location and size of the areas in which optical signals were evoked. These illustrations were drawn by superimposing traces from several preparations observed at each stated stage. The relative size of the areas was evaluated approximately from the signals of which the amplitudes (fractional change) were larger than 2 × 10⁻⁴. Solid lines are used for type I and type II signals; dotted lines are for slow signals. The shapes of the preparations are represented by the averaged anatomical outlines of the preparations at each stage.
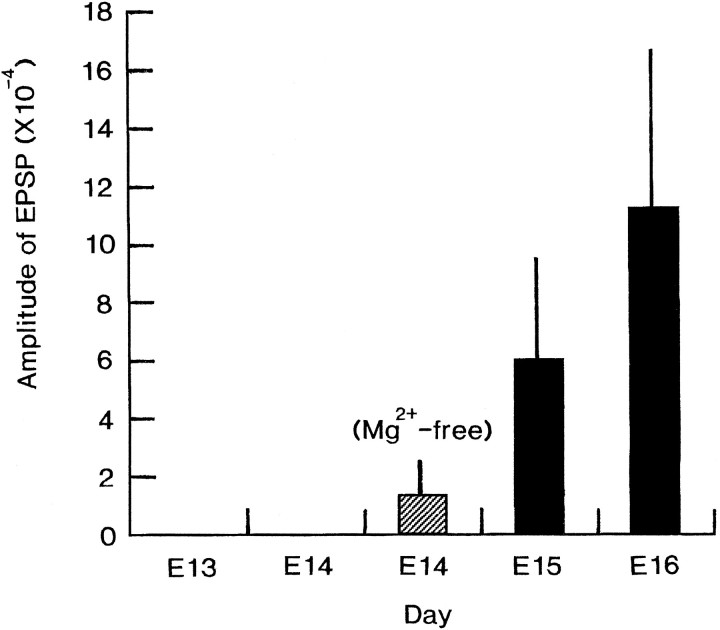
To see the developmental change of the slow signal quantitatively, we measured the peak amplitudes of the slow signal in E13–E16 brainstem preparations (n = 89). Table1 gives the amplitude of the largest slow signal detected in each preparation. In this table, although there is some variation between the preparations, it is indicated obviously that the size of the slow signal increased gradually, as development proceeded. This profile is shown more clearly in Figure13, where the mean and SD calculated for each developmental stage are given.
Table 1.
Maximum amplitude of the EPSPs evoked by the vagus nerve stimulation
| E13 | E14 | E15 | E16 | |||||
|---|---|---|---|---|---|---|---|---|
| Preparation reference | Size of EPSP (×10−4) | Preparation reference | Size of EPSP (×10−4) | Size of EPSP (×10−4) (Mg2+ free) | Preparation reference | Size of EPSP (×10−4) | Preparation reference | Size of EPSP (×10−4) |
| J1673 | ND | J1393 | ND | J1398R | 7.6 | J1391 | 3.6 | |
| J1674 | ND | J1394 | ND | J1398L | 12.4 | J1406 | 12.4 | |
| J1675 | ND | J1395 | ND | J1543 | 3.2 | J1412 | 6.6 | |
| J1396 | ND | J1545 | 11.0 | J1413 | 8.4 | |||
| J1409 | ND | J1547 | 4.0 | J1414 | 12.0 | |||
| J1410 | ND | J1548 | 3.4 | J1558 | 10.8 | |||
| J1411 | ND | J1551 | 5.4 | J1559 | 20.0 | |||
| J1571 | ND | J1552 | 3.2 | J1560 | 20.8 | |||
| J1572 | ND | J1553 | 3.0 | J1561 | 9.0 | |||
| J1648 | ND | J1568 | 15.2 | J1626 | 8.0 | |||
| J1649 | ND | J1569 | 4.0 | J1627 | 16.0 | |||
| J1663 | ND | J1570 | 5.4 | J1628 | 10.2 | |||
| J1664 | ND | J1630 | 4.0 | J1629 | 13.8 | |||
| J1676 | ND | J1631 | 3.6 | J1642 | 6.5 | |||
| J1677 | ND | J1632 | 2.2 | J1643 | 20.4 | |||
| J1678 | ND | J1766 | 4.0 | J1645 | 6.2 | |||
| J1679 | ND | J1767 | 5.6 | J1646 | 10.0 | |||
| J1680 | ND | J1770 | 8.5 | J1660 | 5.6 | |||
| J1725 | ND | J1771 | 5.9 | J1667 | 23.0 | |||
| J1706 | ND | 2.6 | J1783 | 4.9 | J1668 | 7.4 | ||
| J1723 | ND | 2.0 | J1784 | 12.8 | J1669 | 10.2 | ||
| J1724 | ND | ND | J1812 | 4.8 | J1692 | 13.4 | ||
| J1726 | ND | 2.0 | J1830 | 4.2 | J1694 | 13.3 | ||
| J1727 | ND | ND | J1831 | 5.6 | J1695 | 7.8 | ||
| J1832 | 3.0 | J1696 | 12.6 | |||||
| J1697 | 13.2 | |||||||
| J1698 | 7.6 | |||||||
| J1714 | 8.0 | |||||||
| J1715 | 8.8 | |||||||
| J1717 | 7.0 | |||||||
| J1732 | 7.6 | |||||||
| J1739 | 10.6 | |||||||
| J1861 | 5.6 | |||||||
| J1862 | 25.6 | |||||||
Left columns give the preparation reference. Right columns give the amplitude of the largest slow signal detected from each preparation. The values are expressed as a fractional change (stated value × 10−4). ND, Not determined; R and L, right and left sides of the preparation, respectively.
Fig. 13.
Developmental changes in the amplitude of the slow signals. Based on the data shown in Table 1, mean + SD of the maximum amplitude of the slow signal were calculated for each developmental stage.
Comparison with morphology
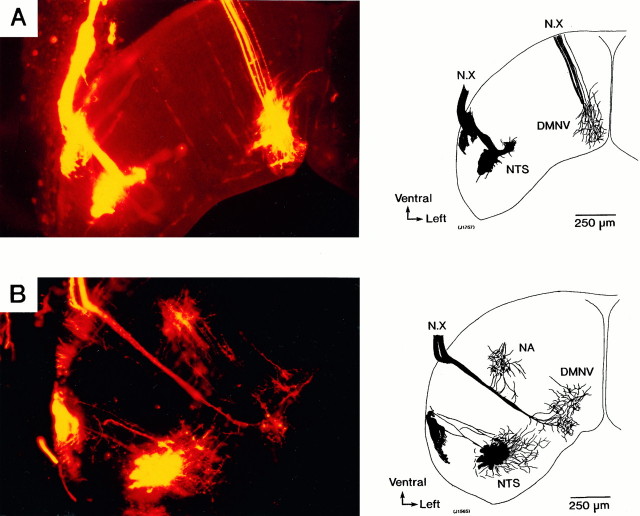
Figure 14 shows the pathways of the vagus nerve into the embryonic rat brainstem. These photographic views were obtained from E14 and E15 preparations in which the vagus nerves were labeled with a carbocyanine dye, DiI. In the photograph obtained from the E15 preparation (Fig. 14B), three neural populations linked to the vagus nerve were identified, and it is likely that they indicate the relative positions of three cranial nerve nuclei related to the vagus nerve, viz, the nucleus of the tractus solitarius, the dorsal motor nucleus of the vagus nerve, and the nucleus ambiguus. In contrast, in the E14 preparation (Fig.14A), two neural populations, corresponding to the nucleus of the tractus solitarius and the dorsal motor nucleus of the vagus nerve, were observed, but the population corresponding to the nucleus ambiguus was missing.
Fig. 14.
Morphological views of the vagus nerve pathways into the brainstem. The photographs were obtained using a carbocyanine dye (DiI) fluorescence labeling method. A was made with an E14 preparation, and B was made with an E15 preparation. In B, the nucleus of the tractus solitarius (NTS), the dorsal motor nucleus of the vagus nerve (DMNV), and the nucleus ambiguus (NA) can be identified. However, in A, the nucleus ambiguus is missing. Right, Drawings traced from the photographs.
Although the morphological views and the optical recordings are not superimposed tightly because of the difference in the thickness of the preparations, in comparison with the optical response areas with the photographic profile, it is likely that areas I and II are correlated to the nucleus of the tractus solitarius and the dorsal motor nucleus of the vagus nerve, respectively. However, in E15–E16 brainstem preparations, although the nucleus ambiguus was observed morphologically, no optical responses have been detected from the area corresponding to the nucleus ambiguus, suggesting that the nucleus ambiguus is not yet functionally organized at these embryonic stages.
Spatiotemporal activity mapping
To examine more closely the dynamic pattern of the neural responses, we made spatiotemporal activity maps. Figure15, A and B, illustrates the images of the time sequences of the optical responses recorded from E14 and E15 preparations in normal Ringer’s solution. In such a pseudocolor imaging display, it is difficult and often impossible to identify the presynaptic and postsynaptic activity components. So, in these figures, the imaging maps are compared with the corresponding optical waveforms obtained simultaneously from three sites of the preparations.
Fig. 15.
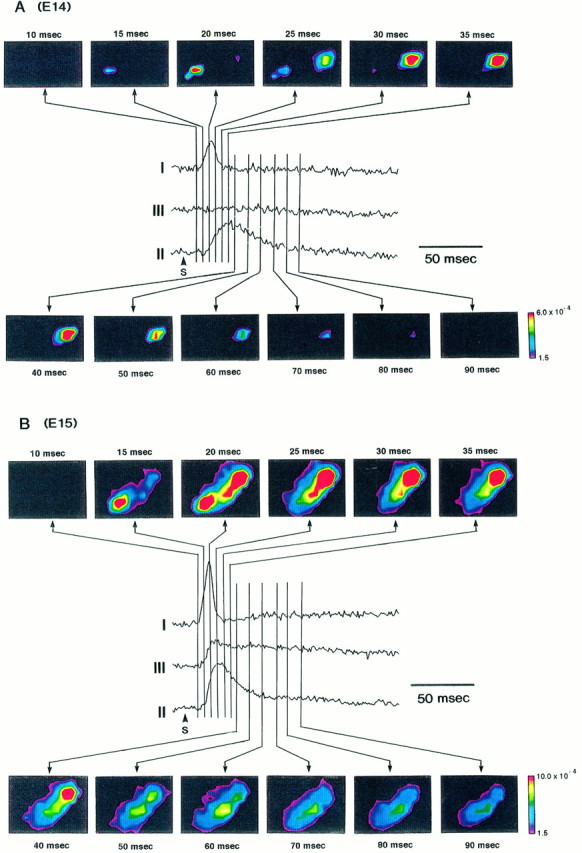
Spatiotemporal activity mappings. The time lapse imaging representations of the neural response in E14 (A) and E15 (B) preparations are shown. The images are compared with the signals obtained from three sites of the preparations. I andII were recorded from areas I and II, respectively.III was recorded from the midarea between areas I and II. Color imagings were constructed from the optical recording signals using an interpolation method of Transform (Fortner Research LLC, Sterling, VA).
In Figure 15A, the time courses of the appearance of two response areas (areas I and II) in an E14 preparation are depicted clearly. The neural response in area I was first visible in the frame at 15 msec (strictly speaking, during 10–15 msec); it reached its maximum spatial extent by the frame at 20 msec and then disappeared in the frame at 35 msec. On the other hand, the neural activity in area II appeared in the frame at 20 msec; it reached its maximum spatial extent by the frame at 35 msec and then disappeared in the frame at 90 msec. In these imaging maps, it is shown that there are differences between the time sequences in areas I and II; the neural activity invades first into area I, and ∼5 msec later it appears to reach area II. The activity duration in area II was longer than that in area I, suggesting differences in conduction between type I and type II signals. However, because it is difficult to measure the effective distance from the stimulated site to the response areas exactly, it was a formidable task to calculate the conduction velocity unequivocally.
In Figure 15B, in addition to the fast responses in areas I and II, the slow optical signals related to the postsynaptic potentials are imaged. Again in this map, the response appeared first in area I and then, somewhat later, in area II. The activity duration in area I was shorter than that in area II, and in the frames at 70, 80, and 90 msec, only the slow signals were visible in the overlapped area of areas I and II.
DISCUSSION
The present work attempts to trace the initial emergence of systemic functional organization of the vagus-related nuclei in the embryonic rat brainstem. This investigation has been made possible, for the first time, by using multiple-site optical recordings of neural response activities.
In the present experiments, electrical stimuli were applied to the vagus nerve with a microsuction electrode. For this experimental protocol, first we are reminded of the following basic features.
(1) The vagus nerve bundle contains both motor and sensory nerve fibers. Thus, the stimulation applied to the vagus nerve was simultaneously orthodromic for the sensory nerve fibers and antidromic for the motor nerve fibers. Unfortunately, at present at least, it is a formidable task to separate the motor and sensory nerve fibers surgically, because the earlier embryonic nerve fibers are very thin and fragile.
(2) In the optical recording system that we have been using, each element of the photodiode array detects coherent optical signals from many neurons and processes from an area tens of micrometers on a side. Thus, signal size is proportional to the magnitude of the membrane potential changes in each cell and process and to the number and membrane area of these elements within the field viewed by one photodiode (Obaid et al., 1985; Orbach et al., 1985; Kamino et al., 1989a).
As shown in Figure 2, A and B, in the E13 and E14 preparations, the two types of the fast spike-like signals, type I and type II signals, were identified, and type I and type II signals were detected from areas I and II, respectively. By comparison with anatomical information (e.g., for an atlas, see Altman and Bayer, 1995) and the DiI labeling of the vagus nerve fibers (Fig. 14), area I was likely identified as the nucleus of the tractus solitarius, and area II was likely identified as the dorsal motor nucleus of the vagus nerve. It is, thus, reasonable to interpret type I signals as corresponding to the orthodromic action potentials evoked in the terminals of the sensory nerves and type II signals as reflecting the antidromic action potentials evoked in the somata of the motoneurons.
Type I and type II signals were characterized as shorter- and longer-duration signals, respectively. Although we do not have any experimental results, because it has not been possible to use voltage- and/or patch-clamp techniques in young embryonic preparations, this difference in the shapes of the two type signals may be attributable to a difference in ion channel mechanisms. Furthermore, the longer duration of type II signals may be attributable to the dispersion of conduction velocities in the population of motoneuron fibers.
As can be seen in the time sequence shown in Figure 15, there was a difference in latency between type I and type II signals. Although it is difficult to estimate this result unequivocally, the conduction velocity of the orthodromic action potential in the sensory nerve fibers appears to be larger than that of the antidromic action potential in the motor nerve fibers. It is suggested that there are differences in the factors determining conduction velocity, such as nerve fiber diameter, membrane resistance, membrane capacitance, and myelination between the sensory and motor nerve fibers contained in the vagus nerve bundle, in the 13–16 d embryonic stages.
Slow signals
The slow optical signals were first detected in the E15 preparations. Similarly in the case of the embryonic chick brainstem, the slow signal showed a decrease in amplitude with repetitive stimulation (Fig. 4); the result shows that embryonic synapses fatigue very readily. Landmesser and Pilar (1972) also reported rapid fatigue in the embryonic chick ciliary ganglion. In addition, the slow signals were reduced or blocked in Ca2+-free Ringer’s solution (Fig. 5) and blocked by Cd2+ and Mn2+. From these interventions, we conclude that the slow optical signals are related to postsynaptic potentials.
The fast spike-like optical signals accompanying the slow signal were classified as either type IIIa or type IIIb. As mentioned in Results, type IIIa signal was classified further into type IIIa(1) and type IIIa(2). Considering that the signal related to the postsynaptic potential is evoked within the nucleus of the tractus solitarius, we suppose (1) that type IIIa(1) signal is composed of type I signal and the slow signal together with the postsynaptic firing signal; (2) that type IIIa(2) signal is composed of type I signal and the slow signal; and (3) that type IIIb signal is composed of type I signal, type II signal, and the slow signal, as illustrated schematically in Figure16.
Because the slow signal is very slow (∼1 sec duration) compared with intracellular EPSP electrode recordings by others in adult, juvenile, older embryos and cultured neuron preparations, there may be some concerns that the slow signal contains additional components, such as polysynaptic EPSPs. In a few experiments we increased the microscope magnification, and we could not discern significant differences in the duration of the slow signals. Therefore, in the range of the microscope magnifications used in the present experiment, the possibility of detecting the variable delays in the signals among the multiple neurons within the receptive field by one detector appears not to have been considered. Thus, we interpret the long duration of the slow signal as attributable to slow synaptic transmission in the embryonic preparation. On the other hand, the slow optical signal resembles the glial signal that was recorded from skate cerebellar slices (Konnerth et al., 1987). However, the slow signal was detected from a preparation stained with an oxonol dye (RH 482), which is relatively insensitive to glial cell membrane potential changes (Konnerth et al., 1987). Therefore, the possibility was ruled out that the slow signal was glial in origin.
In the E15 and E16 preparations, it seems likely that the slow signals were concentrated in the overlapping zone of areas I (corresponding to the nucleus of the tractus solitarius) and II (corresponding to the dorsal motor nucleus of the vagus nerve). In the lateral part of area I, the slow signals were not significantly identified. A possible explanation for this result is that the synaptic function has not yet been completed at the lateral zone of the nucleus tractus solitarius in these developmental stages.
The result that the slow signals were first detected in the E15 preparations suggests that the synaptic function is organized in the nucleus of the tractus solitarius of the embryonic rat initially around the 15-d-old embryonic stage; this may be regarded as the embryogenetic expression (origin) of synaptic transmission.
As in the case observed in embryonic chick brainstems, the slow optical signals were inhibited by APV and CNQX. We therefore interpret the slow optical signal as reflecting the glutamate-mediated (glutamatergic) excitatory postsynaptic potential. Furthermore, it is likely that NMDA and non-NMDA receptors emerged functionally at the 15-d-old embryonic nucleus of the tractus solitarius.
Mg2+ block is a key characteristic of NMDA receptors, as shown by Nowak et al. (1984). From the observation that, in the E14 preparation, the slow signal, which was not detectable in normal Ringer’s solution, was evoked in Mg2+-free Ringer’s solution, we suggest that postsynaptic function related to NMDA receptors emerges, in latent form, within the nucleus of the tractus solitarius at the 14-d-old embryonic stage. In addition, this experiment suggests that glutamate releasing activity in the terminals of the sensory nerves has already been initiated within the nucleus of the tractus solitarius at this embryonic stage. In other embryonic preparations, it has also been reported that NMDA-mediated synaptic function is present 1–2 d before the formation of non-NMDA-mediated synaptic connections (Lee et al., 1988; Ziskind-Conhaim, 1990).
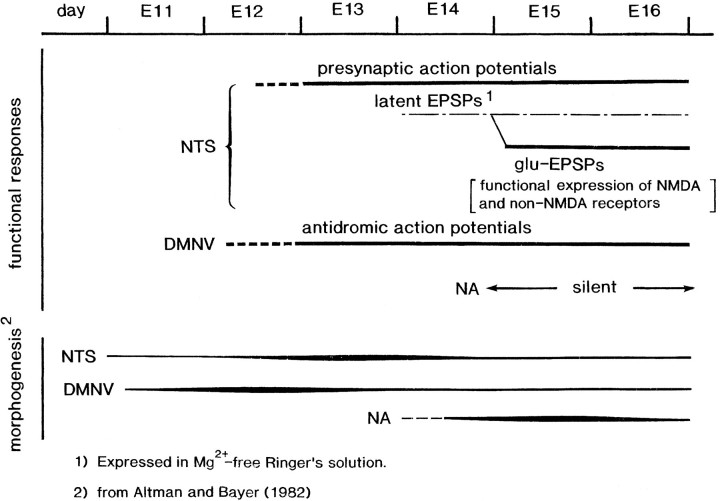
With morphogenesis studies, Altman and Bayer (1982) have reported that the neurons of the nucleus of the tractus solitarius are produced between days E12 and E15 with a peak on day E13, and that the neurons of the nucleus ambiguus are produced relatively late, with a peak on day E15. Also, Altman and Bayer (1982) have shown that the neurons of the dorsal motor nucleus of the vagus nerve are produced with a peak on day E12. In Figure 17, the sequence of embryonic expressions of neural responses within the vagal-related nuclei is summarized, compared with the morphogenesis.
Fig. 17.
Summary of sequence of event in the initial embryonic emergence of the neural responses in the rat vagus-related nuclei. The functional events are compared with morphogenesis of the nuclei (Altman and Bayer, 1982). See Discussion for additional details.
Finally, considering the common evidence between the rat and the chick, the basic profiles in the embryogenetic expression of functional organization of the vagal nuclei are summarized as follows: (1) the neurons that constitute the vagal nuclei are functionally arranged in a hierarchical pattern; the activity is largest in the central part of the vagal nuclei; (2) although the central parts of the motor and sensory nuclei are separated spatially, the nuclei are overlapped; this evidence is one illustration of failure in a morphological and anatomical context; (3) in the nucleus of the tractus solitarius, the synaptic function is latently generated 1 d before the expression of the glutamate-mediated EPSPs, and the onset of synaptic function is regulated by extracellular Mg2+; and (4) in the nucleus of the tractus solitarius, the ontogenetic expression of the EPSPs includes NMDA and non-NMDA-receptor functions. Furthermore, as shown typically in the nucleus ambiguus, the embryonic organization of morphology and physiology/function is not necessarily temporally coincident.
Footnotes
This work was supported in part by grants from the Ministry of Education, Science and Culture, Japan, and Funds from the Uehara Memorial Life Science Foundation, the Research Aid of the Inoue Foundation for Science, and the Esso Research Grants for Woman-Scientists (to Y.M.-S.). We thank Larry Cohen and Brian Salzberg for their thoughtful reading of this manuscript and for helpful comments. We are grateful to Narishige Scientific Instrument Laboratory for construction of several special apparatuses for the equipment and Emi Bandai for her assistance in preparing this manuscript.
Correspondence should be addressed to Kohtaro Kamino, Department of Physiology, Tokyo Medical and Dental University School of Medicine, 1-5-45 Yushima, Bunkyo-ku, Tokyo 113, Japan.
Dr. Hirota’s Present address: Department of Physiology, Shimane Medical University, Izumo-shi, Shimane 693, Japan.
REFERENCES
- 1.Altman J, Bayer SA. Development of the cranial nerve ganglia and related nuclei in the rat. Springer; Berlin: 1982. [DOI] [PubMed] [Google Scholar]
- 2.Altman J, Bayer SA. Atlas of prenatal rat brain development. CRC; Boca Raton, FL: 1995. [Google Scholar]
- 3.Cohen LB, Salzberg BM. Optical measurement of membrane potential. Rev Physiol Biochem Pharmacol. 1978;83:35–88. doi: 10.1007/3-540-08907-1_2. [DOI] [PubMed] [Google Scholar]
- 4.Godement P, Vanselow J, Thanos S, Bonhoeffer F. A study in developing visual systems with a new method of staining neurones and their processes in fixed tissue. Development. 1987;101:697–713. doi: 10.1242/dev.101.4.697. [DOI] [PubMed] [Google Scholar]
- 5.Grinvald A, Manker A, Segal M. Visualization of the spread of electrical activity in rat hippocampal slices by voltage-sensitive optical probes. J Physiol (Lond) 1982;333:269–291. doi: 10.1113/jphysiol.1982.sp014453. [DOI] [PMC free article] [PubMed] [Google Scholar]
- 6.Grinvald A, Frostig RD, Lieke E, Hildesheim R. Optical imaging of neuronal activity. Physiol Rev. 1988;68:1285–1366. doi: 10.1152/physrev.1988.68.4.1285. [DOI] [PubMed] [Google Scholar]
- 7.Hirota A, Sato K, Momose-Sato Y, Sakai T, Kamino K. A new simultaneous 1020-site optical recording system for monitoring neural activity using voltage-sensitive dyes. J Neurosci Methods. 1995;56:187–194. doi: 10.1016/0165-0270(94)00123-x. [DOI] [PubMed] [Google Scholar]
- 8.Kamino K. Optical studies of early developing cardiac and neural activities using voltage-sensitive dyes. Jpn J Physiol. 1990;40:443–461. doi: 10.2170/jjphysiol.40.443. [DOI] [PubMed] [Google Scholar]
- 9.Kamino K. Optical approaches to ontogeny of electrical activity and related functional organization during early heart development. Physiol Rev. 1991;71:53–91. doi: 10.1152/physrev.1991.71.1.53. [DOI] [PubMed] [Google Scholar]
- 10.Kamino K, Hirota A, Fujii S. Localization of pacemaking activity in early embryonic heart monitored using voltage-sensitive dye. Nature. 1981;290:595–597. doi: 10.1038/290595a0. [DOI] [PubMed] [Google Scholar]
- 11.Kamino K, Hirota A, Komuro H. Optical indications of electrical activity and excitation-contraction coupling in the early embryonic heart. Adv Biophys. 1989a;25:45–93. doi: 10.1016/0065-227x(89)90004-x. [DOI] [PubMed] [Google Scholar]
- 12.Kamino K, Katoh Y, Komuro H, Sato K. Multiple-site optical recording of neural activity evoked by vagus nerve stimulation in the embryonic chick brain stem. J Physiol (Lond) 1989b;409:263–283. doi: 10.1113/jphysiol.1989.sp017496. [DOI] [PMC free article] [PubMed] [Google Scholar]
- 13.Kamino K, Komuro H, Sakai T, Sato K. Optical assessment of spatially ordered patterns of neural response to vagal stimulation in the early embryonic chick brainstem. Neurosci Res. 1990;8:255–271. doi: 10.1016/0168-0102(90)90032-a. [DOI] [PubMed] [Google Scholar]
- 14.Komuro H, Sakai T, Momose-Sato Y, Hirota A, Kamino K. Optical detection of postsynaptic potentials evoked by vagal stimulation in the early embryonic chick brain stem slice. J Physiol (Lond) 1991;442:631–648. doi: 10.1113/jphysiol.1991.sp018812. [DOI] [PMC free article] [PubMed] [Google Scholar]
- 15.Konnerth A, Obaid AL, Salzberg BM. Optical recording of electrical activity from parallel fibers and other cell types in skate cerebellar slices in vitro. J Physiol (Lond) 1987;393:681–702. doi: 10.1113/jphysiol.1987.sp016848. [DOI] [PMC free article] [PubMed] [Google Scholar]
- 16.Landmesser L, Pilar G. The onset and development of transmission in the chick ciliary ganglion. J Physiol (Lond) 1972;222:691–713. doi: 10.1113/jphysiol.1972.sp009822. [DOI] [PMC free article] [PubMed] [Google Scholar]
- 17.Lee MT, Koebbe MJ, O’Donovan MJ. The development of sensorimotor synaptic connections in the lumbosacral cord of the chick embryo. J Neurosci. 1988;8:2530–2543. doi: 10.1523/JNEUROSCI.08-07-02530.1988. [DOI] [PMC free article] [PubMed] [Google Scholar]
- 18.Momose-Sato Y, Sakai T, Komuro H, Hirota A, Kamino K. Optical mapping of the early development of the response pattern to vagal stimulation in embryonic chick brain stem. J Physiol (Lond) 1991;442:649–668. doi: 10.1113/jphysiol.1991.sp018813. [DOI] [PMC free article] [PubMed] [Google Scholar]
- 19.Momose-Sato Y, Sakai T, Hirota A, Sato K, Kamino K. Optical mapping of early embryonic expressions of Mg2+-/APV-sensitive components of vagal glutaminergic EPSPs in the chick brainstem. J Neurosci. 1994;14:7572–7584. doi: 10.1523/JNEUROSCI.14-12-07572.1994. [DOI] [PMC free article] [PubMed] [Google Scholar]
- 20.Momose-Sato Y, Sato K, Sakai T, Hirota A, Kamino K. A novel γ-aminobutyric acid response in the embryonic brainstem as revealed by voltage-sensitive dye recording. Neurosci Lett. 1995a;191:193–196. doi: 10.1016/0304-3940(95)11590-s. [DOI] [PubMed] [Google Scholar]
- 21.Momose-Sato Y, Sato K, Sakai T, Hirota A, Matsutani K, Kamino K. Evaluation of optimal voltage-sensitive dyes for optical monitoring of embryonic neural activity. J Membr Biol. 1995b;144:167–176. doi: 10.1007/BF00232802. [DOI] [PubMed] [Google Scholar]
- 22.Nelson PG, Pun RYK, Westbrook GL. Synaptic excitation in cultures of mouse spinal cord neurones: receptor pharmacology and behaviour of synaptic currents. J Physiol (Lond) 1986;372:169–190. doi: 10.1113/jphysiol.1986.sp016003. [DOI] [PMC free article] [PubMed] [Google Scholar]
- 23.Nowak L, Bregestovski P, Ascher P, Herbet A, Prochiantz A. Magnesium gates glutamate-activated channels in mouse central neurones. Nature. 1984;307:462–465. doi: 10.1038/307462a0. [DOI] [PubMed] [Google Scholar]
- 24.Obaid AL, Orkand RK, Gainer H, Salzberg BM. Active calcium responses recorded optically from nerve terminals of the frog neurohypophysis. J Gen Physiol. 1985;85:481–489. doi: 10.1085/jgp.85.4.481. [DOI] [PMC free article] [PubMed] [Google Scholar]
- 25.Orbach HS, Cohen LB, Grinvald A. Optical mapping of electrical activity in rat somatosensory and visual cortex. J Neurosci. 1985;5:1886–1895. doi: 10.1523/JNEUROSCI.05-07-01886.1985. [DOI] [PMC free article] [PubMed] [Google Scholar]
- 26.Salzberg BM. Optical recording of electrical activity in neurons using molecular probes. In: Barker JL, McKelvy JF, editors. Current methods in cellular neurobiology, Vol 3. Electrophysiological techniques. Wiley; New York: 1983. pp. 139–187. [Google Scholar]
- 27.Salzberg BM. Optical recording of voltage changes in nerve terminals and in fine neural processes. Annu Rev Physiol. 1989;51:507–526. doi: 10.1146/annurev.ph.51.030189.002451. [DOI] [PubMed] [Google Scholar]
- 28.Salzberg BM, Grinvald A, Cohen LB, Davila HV, Ross WN. Optical recording of neuronal activity in an invertebrate central nervous system: simultaneous monitoring of several neurons. J Neurophysiol. 1977;40:1281–1291. doi: 10.1152/jn.1977.40.6.1281. [DOI] [PubMed] [Google Scholar]
- 29.Salzberg BM, Obaid AL, Senseman DM, Gainer H. Optical recording of action potentials from vertebrate nerve terminals using potentiometric probes provides evidence for sodium and calcium components. Nature. 1983;306:36–40. doi: 10.1038/306036a0. [DOI] [PubMed] [Google Scholar]
- 30.Sato K, Momose-Sato Y, Sakai T, Hirota A, Kamino K. Responses to glossopharyngeal stimulus in the early embryonic chick brainstem: spatiotemporal patterns in three dimensions from repeated multiple-site optical recording of electrical activity. J Neurosci. 1995;15:2123–2140. doi: 10.1523/JNEUROSCI.15-03-02123.1995. [DOI] [PMC free article] [PubMed] [Google Scholar]
- 31.Sato K, Momose-Sato Y, Arai Y, Sakai T, Hirota A, Kamino K. Optical mapping of vagal responses in the embryonic rat brainstem slice preparation. Neurosci Res [Suppl] 1996a;20:S40. [Google Scholar]
- 32.Sato K, Momose-Sato Y, Hirota A, Sakai T, Kamino K. Optical studies of the biphasic modulatory effects of glycine on excitatory postsynaptic potentials in the chick brainstem and their embryogenesis. Neuroscience. 1996b;72:833–846. doi: 10.1016/0306-4522(95)00581-1. [DOI] [PubMed] [Google Scholar]
- 33.Yamada KA, Dubinsky JM, Rothman SM. Quantitative physiological characterization of a quinoxalinedione non-NMDA receptor antagonist. J Neurosci. 1989;9:3230–3236. doi: 10.1523/JNEUROSCI.09-09-03230.1989. [DOI] [PMC free article] [PubMed] [Google Scholar]
- 34.Ziskind-Conhaim L. NMDA receptors mediate poly- and monosynaptic potentials in motoneurons of rat embryos. J Neurosci. 1990;10:125–135. doi: 10.1523/JNEUROSCI.10-01-00125.1990. [DOI] [PMC free article] [PubMed] [Google Scholar]


