

Abstract
The paired phasic and tonic motor neurons supplying the extensor muscle in the crayfish leg were investigated to establish whether differences in synaptic structure could account for large differences in transmitter release at the neuromuscular junctions. Nerve terminals with transmitter release that had been assessed from recordings made with a focal “macro-patch” electrode were subsequently labeled, processed for electron microscopy, and reconstructed from serial sections.
At a frequency of 1 Hz, quantal contents of phasic terminals were 90–1300 times greater than those of tonic terminals when both were recorded at the same location. At higher frequencies, facilitation was pronounced at tonic, but not phasic, terminals.
Reconstructions of recording sites showed that both phasic and tonic terminals possessed many small synapses, usually with one or more structurally defined active zones. Mean synaptic contact area was larger for tonic terminals, and the number of individual synapses per length of nerve terminal was also larger. Active zones were not different in size for the two terminals.
At low frequencies, quantal emission per synapse is much greater for phasic terminals. The higher quantal content of phasic terminals and their synapses cannot reasonably be accounted for by more or larger synapses or active zones at the recording sites. Because structural features alone are not likely to produce the very large differences in quantal content of phasic and tonic terminals observed at low stimulation frequencies, it is likely that other properties of the nerve terminal are largely responsible for these differences.
Keywords: crayfish, quantal, synapse, ultrastructure, neuromuscular junction, active zone
Crustacean motor neurons are diverse in their physiology and morphology. A broad distinction between “tonic” and “phasic” motor neurons has been drawn (Kennedy and Takeda, 1965a,b; Atwood and Wojtowicz, 1986): tonic neurons continuously produce impulses during locomotion, whereas phasic neurons fire in brief bursts for occasional rapid movements. Synaptic physiology differs correspondingly: phasic motor neurons are specialized for rapid initial release of transmitter and generate large EPSPs in the innervated muscle fibers, whereas tonic motor neurons release less transmitter initially and generate smaller EPSPs that exhibit marked facilitation as impulse frequency increases (Hoyle and Wiersma, 1958; Bittner, 1968a; Bradacs et al., 1997).
Several muscles in the limbs of crustaceans receive a pair of excitatory neurons, one phasic and one tonic, which ramify together throughout the muscle and innervate the same muscle fibers (Wiersma, 1961; Lnenicka et al., 1986; Bradacs et al., 1997). In such cases, synapses made on the same postsynaptic element can be compared, physiologically and structurally. Observations on two of these muscles in the crayfish, the claw closer muscle and the extensor of the carpopodite in the leg, have provided structural comparisons of phasic and tonic nerve terminals. Paradoxically, phasic terminals are much thinner and contain fewer mitochondria, a smaller vesicle population, and a lower concentration of the neurotransmitter glutamate than tonic nerve terminals on the same muscle fiber (Lnenicka et al., 1986;Shupliakov et al., 1995; King et al., 1996).
These observations raise an interesting question: how do thin phasic nerve terminals, less well endowed with neurotransmitter, produce much larger EPSPs than thicker, more transmitter-rich tonic nerve terminals? Possibilities to be considered include numerical or structural differences in synapses or their active zones, and molecular or biophysical differences in the neurons. In the present study, we addressed the structural possibility by reconstructing nerve terminals from electron micrographs after recordings had been made from them to assess their neurotransmitter output (Wojtowicz et al., 1994; Cooper et al., 1995a). The reconstructions allowed us to count and measure all the individual synapses on a defined region of the nerve terminal, and thus to compare structural features associated with known transmitter output for the two types of nerve terminal.
MATERIALS AND METHODS
Animals. Freshwater crayfish, Procambarus clarkii, obtained from the Atchafalaya Biological Supply Company, were maintained in tanks of dechlorinated tap water at 12–15°C. Walking legs were removed at the point of autotomy to make the preparations. Dissection of the extensor muscle in the meropodite followed procedures described previously (Bradacs et al., 1997). The preparations were superfused with standard crayfish solution (modified van Harreveld’s solution) cooled to 11–13°C (Wojtowicz and Atwood, 1986).
Stimulation and recording. The exposed inner side of the extensor muscle was superfused for 2–3 min with crayfish solution containing 2 μm of 4-Di-2-Asp (4-(4-(diethylamino)styryl)-N-methylpyridinium iodide) to make the nerve terminals visible with fluorescence microscopy (Harrington and Atwood, 1995). The nerve terminals remain functional if the exciting illumination is used for brief periods (Cooper et al., 1995a). A “macro-patch” electrode (∼15 μm inner diameter) was positioned under visual control over selected nerve terminals. Locations were chosen such that synaptic currents generated by both the tonic and phasic terminals could be recorded without moving the electrode. The nerve bundle containing both the tonic and phasic axons was dissected out in the ischiopodite and drawn into a tightly fitting suction electrode for stimulation, using chlorided silver wires inside and outside the stimulation electrode. First the tonic axon, which has a larger diameter (Bradacs et al., 1997) and a lower stimulus threshold, was excited selectively by adjusting the amplitude or duration of the stimulus, and 500–600 sweeps were recorded at frequencies of 1, 2, 5, 10, and 20 Hz. After this the stimulus intensity was increased to recruit also the phasic axon, and 500–600 pulses were recorded at 1 Hz. At low frequencies, the quantal output from tonic terminals was generally very low (see Fig. 1), so that its contribution to the phasic excitatory synaptic currents (ESCs) was negligible. To avoid muscle contractions during the recordings, muscle fibers were prestretched. Excitatory synaptic currents were recorded on tape and computer for subsequent analysis.
Fig. 1.

Comparison of synaptic currents during stimulation of phasic and tonic axons. A1, Individual records of phasic (P) and tonic (T) responses at the same recording site during 1 Hz stimulation. A2, Averaged currents (500 stimuli) for phasic and tonic axons during 1 Hz stimulation.B1, Individual measurements (current-time integrals) of phasic responses (open circles) and tonic responses (filled circles) for a series of 500 stimuli delivered at 1 Hz. The regression line shows a characteristic slow decline in amplitude with time for the phasic responses. Most of the tonic responses were failures of release at this frequency.B2–4, Individual responses for 500 stimuli recorded during stimulation of the tonic axon at 2 Hz (B2), 5 Hz (B3), and 10 Hz (B4). Most of the responses at 2 Hz are failures or single quantal events; single quantal events are frequent at 5 Hz, whereas a significant number of multi-quantal events appear at 10 Hz.
Electron microscopy. The macro-patch electrode was dipped into a solution containing spherical polystyrene beads (0.5 μm diameter) (Duke Scientific Company) and then allowed to dry before being filled with the crayfish solution for recording. During the recording session, beads were deposited at the recording site on the surface of the muscles in a ring corresponding to the rim of the electrode (Cooper et al., 1995a). The beads marked the recording site, which could be identified during all stages of specimen preparation and also in electron micrographs (see Fig. 3) (Wojtowicz et al., 1994).
Fig. 3.
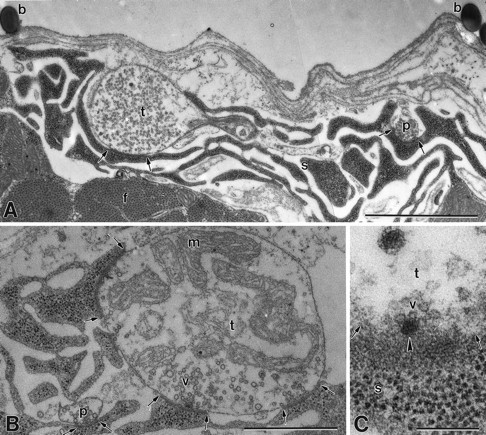
Electron micrographs of recorded specimens.A, Recording site labeled with polystyrene microspheres (b) left by the recording microelectrode on the muscle fiber surface. Phasic (p) and tonic (t) nerve terminals populated with clear spherical vesicles are surrounded by subsynaptic reticulum, and each shows a synaptic contact (between arrows). Myofibrils (f) are located below the terminal region. B, Terminals from the recorded area showing a phasic (p) terminal that is much smaller in size than its tonic (t) counterpart and has fewer synapses (between arrows). Note abundant mitochondria in tonic terminal. s, Subsynaptic reticulum;v, synaptic vesicles. C, Surface view of an active zone denoted by a dense bar (arrowhead) with several docked synaptic vesicles (v) in a tonic (t) nerve terminal. s, Subsynaptic reticulum. Magnification: A, 21,000×; B, 35,000×; C, 115,000×. Scale bars: A, 2 μm; B, 1 μm; C, 0.2 μm.
Fixation, embedding, and serial sectioning of specimens containing recording sites followed standard procedures (King et al., 1996). Micrographs were taken from serial sections and enlarged for measurements. The surface contact area of each synapse was calculated by measuring its linear dimension in each section in which it appeared, multiplying this by the thickness of the section, and summing the results for each section. Synaptic active zones (dense bodies) were counted, and their lengths were measured.
Data analysis. For the tonic axon, synaptic currents could usually be resolved into quantal components (see Fig. 2), and the number of quanta released by each impulse at the recording site could be determined with a high degree of certainty. Quantal contents at several frequencies were determined, as described by Cooper et al. (1995b). Quantal counts were analyzed by statistical procedures to determine whether they could be fitted by Poisson or binomial distributions, as described previously (Cooper et al., 1995a,b). For the phasic axon, the ESCs were too large and contained too many quantal units to be resolved accurately in this way. Quantal content was estimated by averaging the evoked ESCs and dividing this value by the average of the asynchronous “late” quantal units, which were resolved in the traces. No attempt was made to determine binomial parameters for phasic synapses.
Fig. 2.
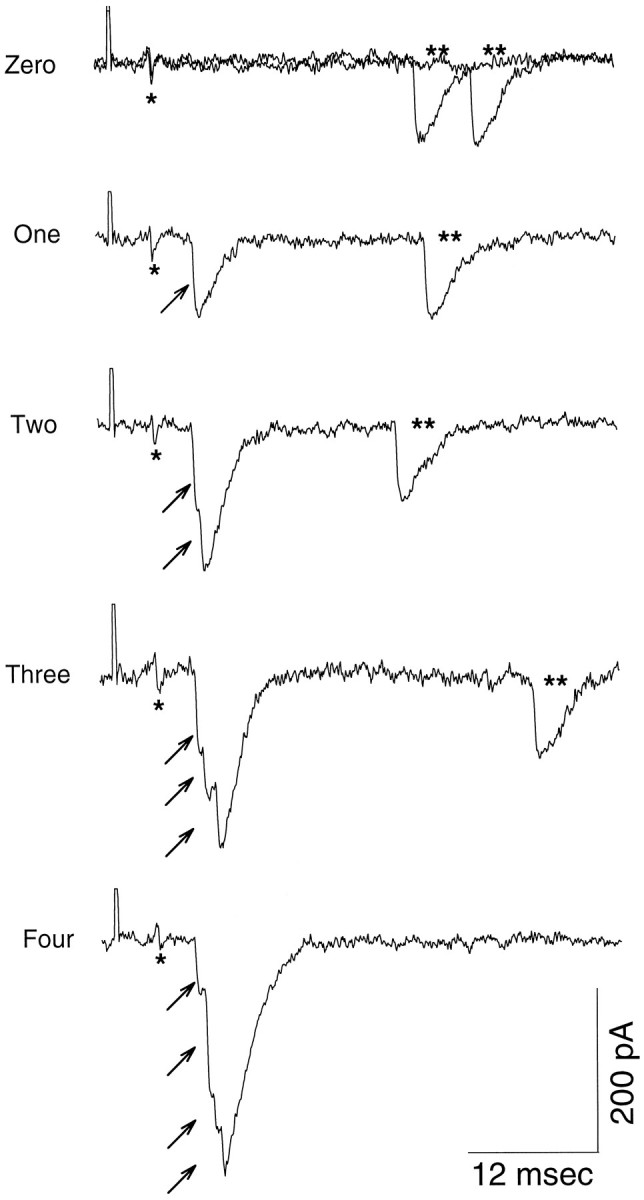
Synaptic currents recorded at a single site with stimulation of the tonic axon. Nerve terminal potentials are indicated by single asterisks, asynchronously released quantal units by double asterisks, and near-synchronously released quantal units by small arrows. Cases of zero, one, two, three, and four quanta released by nerve impulses during 10 Hz stimulation are illustrated. Individual quantal components are well resolved.
RESULTS
Properties of transmitter release
Recordings of synaptic currents were made with a macro-patch electrode at selected sites where phasic and tonic nerve endings were closely apposed (Figs. 1,2). Separate stimulation of the two axons in the motor nerve produced synaptic currents of very different properties. Synaptic currents generated by the phasic axon were many times larger than those of the tonic axon; responses of the latter were small at low frequencies, but facilitated greatly at higher frequencies (Bradacs et al., 1997).
When the tonic axon was activated at low frequencies, many impulses failed to produce a response, although the nerve terminal potential was always recorded. When synaptic currents did occur, they appeared to be single quantal units (Figs. 1, 2). As the frequency of stimulation was increased, the percentage of failures diminished, and a few multi-quantal responses occurred. Almost always it was possible to count the number of quantal units in each response by observing the inflections on the rising phase of the recorded current (Fig. 2). Variation in quantal unit size occurred, as in previously studied synapses (Wojtowicz and Atwood, 1986; Wojtowicz et al., 1994). Therefore, quantal content was determined by counting all the quanta released by a series of impulses and calculating the mean number of quanta released per impulse (Cooper et al., 1995b). As expected (Dudel and Kuffler, 1961), quantal content increased with frequency (Fig. 1, Table 1).
Table 1.
Quantal analysis of synaptic currents for the tonic axon at three recording sites
| Distributions | n andp | m | |||||
|---|---|---|---|---|---|---|---|
| Freq. | Event | Obs. | Theoretical | AIC (n=) (p =) | Bootstrap ( ± SE) ( ± SE) | ||
| Experiment 1 | |||||||
| 1 Hz | 0 | 488 | 488 | Poisson | 0.024 | ||
| 1 | 12 | 12 | |||||
| 2 Hz | 0 | 484 | 484 | Poisson | 0.032 | ||
| 1 | 16 | 16 | |||||
| 5 Hz | 0 | 476 | 477 | ||||
| 1 | 23 | 23 | Uniform binomial | 1 | 0.05 | ||
| 2 | 1 | 0 | 0.046 | ||||
| 10 Hz | 0 | 516 | 516 | ||||
| 1 | 79 | 79 | Uniform binomial | 5 | 0.148 | ||
| 2 | 5 | 5 | 0.0297 | ||||
| 20 Hz | 0 | 329 | 329 | ||||
| 1 | 218 | 216 | 5 | 3.68 ± 1.5 | 0.548 | ||
| 2 | 48 | 49 | Nonuniform binomial | 0.08 | 0.159 ± 0.032 | ||
| 3 | 5 | 5 | |||||
| Experiment 2 | |||||||
| 1 Hz | 0 | 493 | 493 | Poisson | 0.192 | ||
| 1 | 95 | 95 | |||||
| 2 | 10 | 10 | |||||
| 2 Hz | 0 | 466 | 462 | Poisson | 0.257 | ||
| 1 | 117 | 120 | |||||
| 2 | 14 | 16 | |||||
| 3 | 3 | 2 | |||||
| 5 Hz | 0 | 356 | 356 | ||||
| 1 | 188 | 186 | Poisson | 0.52 | |||
| 2 | 45 | 48 | |||||
| 3 | 10 | 8 | |||||
| 4 | 1 | 1 | |||||
| 10 Hz | 0 | 111 | 110 | ||||
| 1 | 178 | 180 | Nonuniform binomial | 8 | 10.0 ± 4.47 | 1.396 | |
| 2 | 138 | 132 | 0.175 | 0.157 ± 0.048 | |||
| 3 | 51 | 57 | |||||
| 4 | 19 | 16 | |||||
| 5 | 3 | 4 | |||||
| Experiment 3 | |||||||
| 1 Hz | 0 | 494 | 494 | Poisson | 0.004 | ||
| 1 | 2 | 2 | |||||
| 2 Hz | 0 | 497 | 497 | Poisson | 0.006 | ||
| 1 | 3 | 3 | |||||
| 5 Hz | 0 | 494 | 494 | ||||
| 1 | 6 | 6 | Poisson | 0.012 | |||
| 10 Hz | 0 | 469 | 467 | ||||
| 1 | 28 | 31 | Poisson | 0.064 | |||
| 2 | 2 | 1 | |||||
| 20 Hz | 0 | 304 | 304 | ||||
| 1 | 152 | 151 | |||||
| 2 | 37 | 37 | Poisson | 0.494 | |||
| 3 | 7 | 7 | |||||
Results of quantal analysis of synaptic currents for the tonic axon at three recording sites. Freq., stimulation frequency; Event, number of quantal units counted per stimulus; Obs., observed number of each event; Theoretical, best-fitted distributions; n andp, binomial parameters for best-fitted binomial distributions according to the Akaike Information Criterion (AIC); and , mean values of binomial parameters resulting from the Bootstrap method; m, calculated value for mean quantal content.
From counts of the number of impulses releasing different numbers of quanta, statistical calculations were made to determine whether the observed distributions could be best fitted by Poisson, uniform binomial, or nonuniform binomial distributions (Wojtowicz et al., 1991,1994; Cooper et al., 1995a,b). Results from three sites that were subsequently reconstructed from electron micrographs are given in Table1. Quantal contents for these sites (and others not included) were always <1 at frequencies below 10 Hz. At some sites, quantal content became >1 at 10 Hz, but at most, quantal contents of 1 or more were attained at frequencies of 20–40 Hz. At low frequencies (0–5 Hz), the observed distributions were best fitted by Poisson distributions. At frequencies of 5 Hz and above, some of the sites became binomial, with estimates of 1–10 for n in the binomial distributions (Table 1). Site 3 remained best fitted by Poisson distributions even at 20 Hz. Higher frequencies were not investigated because of the risk of nonstationarity attributable to movement.
Activation of the phasic axon at low frequencies generated much larger synaptic currents at the same sites, with no failures of transmission (Fig. 1). The responses were multi-quantal, and it was not possible to count reliably the number of quanta in each response. Maintained stimulation at low frequency generally produced a slowly developing decrease in the evoked current (Fig. 1); such decline did not occur at the terminals of the tonic axon. Estimates of quantal content for phasic terminals were obtained by taking the ratio of the averaged evoked response to the averaged “late quantal events” seen in the tail of emission of unitary events after evoked release (Erulkar and Rahamimoff, 1978; Kita et al., 1981; Ravin et al., 1997). These estimates of quantal content ranged from 5.2 to 18.0 at the three sites selected for ultrastructural analysis (Table2). At other sites not included in the present analysis, values of quantal content ranged from 8.3 to 15.2. The ratios of phasic to tonic quantal content at the selected sites ranged from 94 to 1300 (Table 2). There is clearly a large difference in quantal content at the same recording site in these examples. Response amplitude for the phasic axon initially grew slightly at higher frequencies (cf. Bradacs et al., 1997), but the rate of depression also increased with continuing stimulation, and the responses were not analyzed further in the present study.
Table 2.
Quantal content comparison (1 Hz) for phasic and tonic axons at three recording sites
| Phasic (P) | Tonic (T) | Ratio P/T | |
|---|---|---|---|
| Experiment 1 | 7.0 | 0.024 | 292 |
| Experiment 2 | 18.0 | 0.192 | 94 |
| Experiment 3 | 5.2 | 0.004 | 1300 |
Ultrastructure of nerve terminals
Recording sites were labeled with polystyrene microspheres deposited around the perimeter of the site by the recording electrode (Fig. 3). The nerve terminals usually retained their integrity, and individual synapses could be identified and measured. Electron-dense, uniformly separated pre- and postsynaptic membranes identified individual synapses, whereas electron-dense presynaptic projections (dense bodies) marked the active zones (Jahromi and Atwood, 1974). However, the recording and preparative procedures caused some degradation in the fine structure of the terminals, as was evident from comparisons with the same terminals adjacent to the recording site. In particular, the phasic terminal, which in many locations was very thin, was sometimes damaged within the recording site. Three successful reconstructions of recording sites were completed (out of six attempted), but in one of these the structural data from the phasic terminal were not complete because of damage, and data were collected from the same terminal just outside the recording site so that comparison with the tonic axon in this region could be completed.
Reconstructions illustrate the general morphological differences between phasic and tonic terminals (Fig.4). Larger varicosities and more numerous synapses per unit length distinguished the tonic terminals. These features have also been documented in previous observations with light and electron microscopy (King et al., 1996; Bradacs et al., 1997). General comparison of the size and complexity of the individual synapses indicated no major differences between the two terminals (Fig.4A,B). Most synapses of both terminals had a single active zone (defined by electron-dense material and associated docked vesicles at the presynaptic membrane). Synapses with no active zone, or with two or more, also occurred on both terminals, but generally were in the minority. At one of the sites (Table3, Site 2A), the tonic axon in the recorded area had a higher percentage of “complex” synapses (two active zones) than observed elsewhere; this site also had the highest quantal content (Table 1). However, the percentage of “blank” synapses (no active zones) was also high at this site.
Fig. 4.
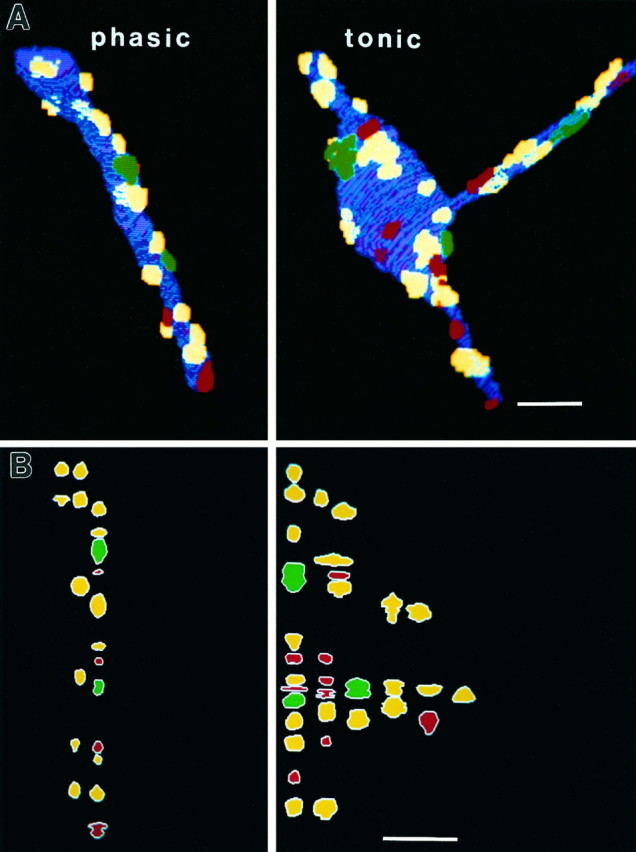
A, Three-dimensional reconstructions of terminals at a recording site, illustrating terminal morphology of tonic (t) and phasic (p) axons, and individual synapses of varying complexity (no active zones, red; one active zone,yellow; two active zones, green). Scale bar, 2.5 μm. B, Two-dimensional representation of individual synapses at the recording site, illustrating relative size and synaptic complexity for the two axons. (Color coding is the same as in A). There are more individual synapses on the terminal of the tonic axon, but no obvious superiority in synaptic size or complexity for either axon at this site. Scale bar, 2.5 μm.
Table 3.
Quantitative morphometric comparison of phasic and tonic terminals at three recording sites
| Site 1 | Site 2A | Site 2B | Site 3 | ||||
|---|---|---|---|---|---|---|---|
| Phasic | Tonic | Tonic | Phasic | Tonic | Phasic | Tonic | |
| Nerve terminals | |||||||
| Total length sectioned (μm) | 15.90 | 24.60 | 6.83 | 26.02 | 23.77 | 28.25 | 10.5 |
| Total volume (μm3) | 13.35 | 46.25 | 15.85 | 5.80 | 17.66 | 7.4 | 39.09 |
| Volume per μm of terminal (μm3) | 0.84 | 1.88 | 2.32 | 0.22 | 0.74 | 0.26 | 3.72 |
| Synapses | |||||||
| Total number | 20 | 35 | 32 | 19 | 64 | 48 | 37 |
| Number per μm of terminal | 1.26 | 1.42 | 4.69 | 0.73 | 2.69 | 1.70 | 3.52 |
| Total area (μm2) | 3.57 | 5.68 | 6.88 | 3.65 | 15.23 | 6.09 | 13.31 |
| Area per μm3 or terminal (μ2) | 0.27 | 0.12 | 0.43 | 0.63 | 0.86 | 0.82 | 0.34 |
| Mean area (μm2) | 0.18 ± 0.02 | 0.31 ± 0.02 | 0.21 ± 0.03 | 0.19 ± 0.04 | 0.24 ± 0.03 | 0.13 ± 0.01 | 0.36 ± 0.02 |
| (x ± SE) | |||||||
| Dense bars of active zones | |||||||
| Total number | 19 | 29 | 26 | 16 | 62 | 56 | 43 |
| Number per synapse | 0.95 | 0.83 | 0.81 | 0.84 | 0.97 | 1.17 | 1.16 |
| Number per μm of terminal | 1.19 | 1.18 | 3.81 | 0.61 | 2.61 | 1.98 | 4.10 |
| Total length (μm) | 1.50 | 2.36 | 2.06 | 1.55 | 3.94 | 3.48 | 2.58 |
| Length per μm of terminal | 0.09 | 0.10 | 0.30 | 0.06 | 0.17 | 0.12 | 0.25 |
| Length per μm2 or synapse (μm) | 0.42 | 0.42 | 0.30 | 0.42 | 0.26 | 0.57 | 0.19 |
| Mean length of dense bars (μm) | 0.08 ± 0.003 | 0.08 ± 0.002 | 0.08 ± 0.02 | 0.10 (1 db) | 0.08 ± 0.02 | 0.06 ± 0.02 | 0.06 |
| (x ± SE) | 0 | ||||||
| Number of fully sectioned synapses | 14 | 24 | 14 | 18 | 57 | 48 | 37 |
| % of fully sectioned synapses with | |||||||
| 0 dense bars | 14.29 | 20.83 | 50.00 | 22.20 | 17.50 | 20.8 | 8.1 |
| 1 dense bar | 71.42 | 70.83 | 21.43 | 66.70 | 79.00 | 50.0 | 70.2 |
| 2 dense bars | 14.29 | 8.33 | 28.57 | 11.10 | 3.50 | 20.8 | 18.9 |
| 3 dense bars | 0.00 | 0.00 | 0.00 | 0.00 | 0.00 | 8.3 | 2.7 |
Incomplete data for the phasic axon were available at the recording Site 2 because of loss of terminal structures; the data for the tonic axon only are presented as Site 2A. Data for the same terminal collected just outside the recording site are presented as Site 2B to allow a comparison to be made between the two axons for the same muscle fiber.
Morphometric data for the three reconstructed sites (Table 3) illustrate the major features of the two terminal types. The number of synapses per unit length of terminal was consistently higher for the tonic axon. At one site (Site 3), the number of synapses in the recording site was larger for the phasic axon, but this was attributable to the presence of two branches of the phasic axon in this region. The number of synapses per unit length of terminal was larger for the tonic axon, here as elsewhere. The number of active zones per synapse was quite similar for the two axons, although the phasic axon had overall slightly more complex synapses with two or more active zones. This observation was made also in a previous morphometric study (King et al., 1996). Synaptic contact area was variable (Fig.4B), but the mean value was larger for the tonic terminals (Table 3). Active zone lengths were essentially the same for both terminals. Thus, for the recording sites sampled, there were no qualitative differences that stood out in comparisons of the two terminal types; rather, the differences were quantitative and relatively minor.
DISCUSSION
The present study compared, at the same recording sites on identified postsynaptic targets, the physiological and morphological parameters of two identifiable neurons known from previous studies to be physiologically different (Bradacs et al., 1997). An earlier morphological study of these neurons (King et al., 1996) had suggested that ultrastructural differences may not be able to account for the physiological ones. The present study confirms this view and indicates clearly that additional factors must be considered in attempting to explain physiological differences among synapses of different neurons.
For crustacean motor neurons, many studies have shown that there are differences in the rate of quantal release among endings of a single tonic-type neuron (crab opener–stretcher neuron: Atwood, 1967; Atwood and Bittner, 1971; Sherman and Atwood, 1972; crayfish opener motor neuron: Bittner, 1968a,b; Cooper et al., 1995a; lobster accessory flexor motor neuron: Frank, 1973; Walrond et al., 1993). Ultrastructural work on these neurons has consistently yielded structural correlates for synaptic strength. Crustacean synapses are readily distinguished in electron micrographs on the basis of their heavily stained, uniformly spaced pre- and postsynaptic membranes, and the dense bodies of the active zones are also clearly identifiable. Synapses of terminals releasing relatively large amounts of transmitter show more numerous active zones and more complex synapses with multiple active zones (Atwood and Marin, 1983; Cooper et al., 1996) and longer active zones (Atwood and Marin, 1983; Walrond et al., 1993). More numerous active zones at a single synapse could provide the conditions for lateral interaction among them (Cooper et al., 1996), whereas larger active zones may provide more calcium channels at or near sites of vesicle docking (Walrond and Reese, 1985; Walrond et al., 1993). Structural influences on transmitter release can be readily envisioned from these results.
The present study shows that such arguments, developed from comparisons of different terminals of the same neuron, cannot be easily extended to comparisons between different neurons. Synaptic size, active zone size, synaptic complexity, and the number of individual synapses at a recording site are not sufficiently different to account for a 50- to 1500-fold difference in quantal content at the recording sites. In fact, two of these measures (synapse size and number of synapses per length of terminal) were inversely related to quantal content for phasic and tonic terminals in the present study.
We can also rule out several other possible explanations for the differences in quantal content at low frequencies. Transmitter availability, judged from quantitative assessments of intraterminal glutamate, is less at phasic than at tonic terminals (Shupliakov et al., 1995). Vesicles are not markedly more plentiful at phasic synapses (King et al., 1996); some studies have shown them to be less plentiful (Atwood and Johnston, 1968; Atwood and Jahromi, 1978). Nerve terminal action potentials can be consistently recorded extracellularly at both phasic and tonic terminals (Figs. 1, 2), although some previous studies have suggested that some of the terminals of the motor axon of the crayfish opener muscle, a tonic-type neuron, are not fully excitable (Dudel, 1981). Intracellular recording of action potentials from paired phasic and tonic motor axons in a crab (Pachygrapsus) have shown that the action potentials are similar in amplitude and duration (Stephens et al., 1983; Stephens, 1992). Although it is possible that the action potentials differ in the fine terminals (where they have not been recorded with intracellular electrodes), they do not appear to be different in duration in extracellular recordings at these locations.
Because in all likelihood the above factors cannot account for the large difference in low-frequency transmitter release, an explanation must be sought in other aspects of synaptic transmission. Calcium channels, and the factors that regulate them, may differ in the two terminal types. Preliminary evidence for more calcium entry in phasic terminals has been obtained (Msghina et al., 1995), which suggests a higher probability for calcium channel opening, or more available calcium channels, at phasic synapses. Preferential location of more calcium channels near docked vesicles (Walrond and Reese, 1985) is another interesting possibility. In addition, there is evidence that at least one synaptically active regulatory molecule may differ in its expression in phasic and tonic terminals (Atwood et al., 1995). Other molecules of the vesicle docking and release complex (Bennett and Scheller, 1994; Südhof, 1995) have not been assessed quantitatively. Additional indirect evidence of a role for calcium channels comes from studies in which calcium currents of crustacean neurons are altered by neuronal activity in a way that correlates with activity-induced changes in synaptic transmission: evoked transmitter release (Lnenicka and Atwood, 1985) and one type of calcium current are both adaptively downregulated in phasic neurons subjected to more than the normal amount of electrical activity (Hong and Lnenicka, 1995,1997).
The fact that terminals of such different properties occur together on the same postsynaptic target strongly indicates that presynaptic influences are important in establishing and regulating synaptic phenotype. Neuronal activity level is one presynaptic influence that is thought to determine both synaptic phenotype (Lnenicka and Atwood, 1988) and terminal morphology (Lnenicka et al., 1986) in phasic and tonic crustacean neurons. In contrast, when different endings of the same motor neuron innervate separate postsynaptic targets, retrograde influences from the latter are likely to play a major role in determining synaptic phenotype (Frank, 1973; Davis and Murphey, 1994).
The tonic axon of the leg extensor muscle is unusual among crustacean motor neurons in its very low quantal content at frequencies below 20 Hz (Bradacs et al., 1997). This leads to typical Poisson distributions at low frequencies (Table 1). At higher frequencies, binomial distributions become the best fits for some sites, suggesting the emergence of a few synapses that transmit more reliably. Values for binomial n remain much smaller than the total number of available synapses, but n increases with frequency in this neuron, as in the crayfish opener motor neuron (Wojtowicz et al., 1994). These observations are in accordance with the hypothesis that binomial n represents the number of active synapses or performing active zones (Zucker, 1973; Schikorski and Stevens, 1997), and that in the crayfish tonic neurons more synapses are recruited to observable activity as the frequency increases. By contrast, in the phasic neuron, a greater percentage of the available synapses are active at low frequencies, contributing to the observed (often large) values for quantal content. Optical studies of active synapses with the fluorescent dye FM1–43 lend support this general hypothesis (Msghina et al., 1995; Quigley et al., 1996).
The observations on synaptic diversity and its morphological correlates, which have a long history in crustacean (Atwood, 1967;Jahromi and Atwood, 1974) and amphibian (Nudell and Grinnell, 1983;Robitaille and Tremblay, 1987) motor neurons, is now paralleled by an increasing number of studies on mammalian central neurons (Pierce and Mendel, 1993; Harris and Sultan, 1995; Murthy et al., 1997; Schikorski and Stevens, 1997; Turner et al., 1997). Some of the same general structure–function relationships are being found, including heterogeneity of release properties and correlation between active zone structural features and release properties. The present observations, together with previous ones on phasic and tonic crustacean neurons, emphasize that the structure–function relationships can be altered from one neuron to another, even when two neurons innervate the same postsynaptic targets.
Footnotes
This work was supported by grants from the Medical Research Council of Canada (H.L.A.) and Natural Sciences and Engineering Research Council of Canada (C.K.G.) and the Faculty of Medicine, University of Toronto (M.M.). Contributions of Dr. Leo Marin and Joanne Pearce to electron microscopy, and Marianne Hegström-Wojtowicz to manuscript preparations were important for completion of this work.
Correspondence should be addressed to Dr. Harold L. Atwood, Department of Physiology, Medical Sciences Building, University of Toronto, Toronto, Ontario, Canada M5S 1A8.
Dr. Msghina’s present address: Department of Physiology and Pharmacology, Karolinska Institutet, S-171 77, Stockholm, Sweden.
REFERENCES
- 1.Atwood HL. Variation in physiological properties of crustacean motor synapses. Nature. 1967;215:57–58. doi: 10.1038/215057a0. [DOI] [PubMed] [Google Scholar]
- 2.Atwood HL, Bittner GD. Matching of excitatory and inhibitory inputs to crustacean muscle fibers. J Neurophysiol. 1971;34:157–170. doi: 10.1152/jn.1971.34.1.157. [DOI] [PubMed] [Google Scholar]
- 3.Atwood HL, Jahromi SS. Fast-axon synapses of a crab leg muscle. J Neurobiol. 1978;9:1–15. doi: 10.1002/neu.480090102. [DOI] [PubMed] [Google Scholar]
- 4.Atwood HL, Johnston HS. Neuromuscular synapses of a crab motor axon. J Exp Zool. 1968;167:457–470. [Google Scholar]
- 5.Atwood HL, Marin L. Ultrastructure of synapses with different transmitter-releasing characteristics on motor axon terminals of a crab, Hyas areneas. Cell Tissue Res. 1983;231:103–115. doi: 10.1007/BF00215778. [DOI] [PubMed] [Google Scholar]
- 6.Atwood HL, Wojtowicz JM. Short-term and long-term plasticity and physiological differentiation of crustacean motor synapses. Int Rev Neurobiol. 1986;28:275–362. doi: 10.1016/s0074-7742(08)60111-7. [DOI] [PubMed] [Google Scholar]
- 7.Atwood HL, Parnas I, Wiersma CAG. Inhibition in crustacean phasic neuromuscular systems. Comp Biochem Physiol. 1967;20:163–177. [Google Scholar]
- 8.Atwood HL, Msghina M, Lindemeier H, Pongs O. Homologue of Drosophila neural protein frequenin selectively expressed in crustacean phasic motor terminals. Soc Neurosci Abstr. 1995;21:709.6. [Google Scholar]
- 9.Bennett MK, Scheller RH. A molecular description of synaptic vesicle membrane trafficking. Annu Rev Biochem. 1994;63:63–100. doi: 10.1146/annurev.bi.63.070194.000431. [DOI] [PubMed] [Google Scholar]
- 10.Bittner GD. Differentiation of nerve terminals in the crayfish opener muscle and its functional significance. J Gen Physiol. 1968a;51:731–758. doi: 10.1085/jgp.51.6.731. [DOI] [PMC free article] [PubMed] [Google Scholar]
- 11.Bittner GD. The differentiation of crayfish muscle fibers during development. J Exp Zool. 1968b;167:439–456. [Google Scholar]
- 12.Bradacs H, Cooper RL, Msghina M, Atwood HL. Differential physiology and morphology of phasic and tonic motor axons in a crayfish limb extensor muscle. J Exp Biol. 1997;200:677–691. doi: 10.1242/jeb.200.4.677. [DOI] [PubMed] [Google Scholar]
- 13.Cooper RL, Marin L, Atwood HL. Synaptic differentiation of a single motor neuron: conjoint definition of transmitter release, presynaptic calcium signals, and ultrastructure. J Neurosci. 1995a;15:4209–4222. doi: 10.1523/JNEUROSCI.15-06-04209.1995. [DOI] [PMC free article] [PubMed] [Google Scholar]
- 14.Cooper RL, Stewart BA, Wojtowicz JM, Wang S, Atwood HL. Quantal measurement and analysis methods compared for crayfish and Drosophila neuromuscular junctions, and rat hippocampus. J Neurosci Methods. 1995b;61:67–78. doi: 10.1016/0165-0270(95)00024-o. [DOI] [PubMed] [Google Scholar]
- 15.Cooper RL, Winslow JL, Govind CK, Atwood HL. Synaptic structural complexity as a factor enhancing probability of calcium-mediated transmitter release. J Neurophysiol. 1996;75:2451–2466. doi: 10.1152/jn.1996.75.6.2451. [DOI] [PubMed] [Google Scholar]
- 16.Davis GW, Murphey RK. Retrograde signaling and the development of transmitter release properties in the invertebrate nervous system. J Neurobiol. 1994;25:740–756. doi: 10.1002/neu.480250612. [DOI] [PubMed] [Google Scholar]
- 17.Dudel J. The effect of reduced calcium on quantal unit current and release at the crayfish neuromuscular junction. Pflügers Arch. 1981;391:35–40. doi: 10.1007/BF00580691. [DOI] [PubMed] [Google Scholar]
- 18.Dudel J, Kuffler SW. The quantal nature of transmission and spontaneous miniature potentials at the crayfish neuromuscular junction. J Physiol (Lond) 1961;155:514–529. doi: 10.1113/jphysiol.1961.sp006644. [DOI] [PMC free article] [PubMed] [Google Scholar]
- 19.Erulkar SD, Rahamimoff R. The role of calcium ions in tetanic and post-tetanic increase of miniature end-plate potential frequency. J Physiol (Lond) 1978;278:501–511. doi: 10.1113/jphysiol.1978.sp012320. [DOI] [PMC free article] [PubMed] [Google Scholar]
- 20.Frank E. Matching of facilitation at the neuromuscular junction of the lobster: a possible case for influence of muscle on nerve. J Physiol (Lond) 1973;233:635–658. doi: 10.1113/jphysiol.1973.sp010327. [DOI] [PMC free article] [PubMed] [Google Scholar]
- 21.Harrington CC, Atwood HL. “Satellite cells” and nerve terminals in the crayfish opener muscle visualized with fluorescent dyes. J Comp Neurol. 1995;361:441–450. doi: 10.1002/cne.903610308. [DOI] [PubMed] [Google Scholar]
- 22.Harris KM, Sultan P. Variation in the number, location and size of synaptic vesicles provides an anatomical basis for the nonuniform probability of release at hippocampal CA1 synapses. Neuropharmacology. 1995;34:1387–1395. doi: 10.1016/0028-3908(95)00142-s. [DOI] [PubMed] [Google Scholar]
- 23.Hong SJ, Lnenicka GA. Activity-dependent reduction in voltage-dependent calcium current in a crayfish motoneuron. J Neurosci. 1995;15:3539–3547. doi: 10.1523/JNEUROSCI.15-05-03539.1995. [DOI] [PMC free article] [PubMed] [Google Scholar]
- 24.Hong SJ, Lnenicka GA. Characterization of a P-type calcium current in a crayfish motoneuron and its selective modulation by impulse activity. J Neurophysiol. 1997;77:76–85. doi: 10.1152/jn.1997.77.1.76. [DOI] [PubMed] [Google Scholar]
- 25.Hoyle G, Wiersma CAG. Excitation at neuromuscular junctions in crustacea. J Physiol (Lond) 1958;143:403–425. doi: 10.1113/jphysiol.1958.sp006068. [DOI] [PMC free article] [PubMed] [Google Scholar]
- 26.Jahromi SS, Atwood HL. Three-dimensional ultrastructure of the crayfish neuromuscular apparatus. J Cell Biol. 1974;63:599–613. doi: 10.1083/jcb.63.2.599. [DOI] [PMC free article] [PubMed] [Google Scholar]
- 27.Kennedy D, Takeda K. Reflex control of abdominal flexor muscles in the crayfish. I. The twitch system. J Exp Biol. 1965a;43:211–227. [Google Scholar]
- 28.Kennedy D, Takeda K. Reflex control of abdominal flexor muscles in crayfish. II. The tonic system. J Exp Biol. 1965b;43:229–246. [Google Scholar]
- 29.King MJR, Atwood HL, Govind CK. Structural features of crayfish phasic and tonic neuromuscular junctions. J Comp Neurol. 1996;372:618–626. doi: 10.1002/(SICI)1096-9861(19960902)372:4<618::AID-CNE9>3.0.CO;2-7. [DOI] [PubMed] [Google Scholar]
- 30.Kita H, Narita K, Van der Kloot W. Tetanic stimulation increases the frequency of miniature end-plate potentials at the frog neuromuscular junction in Mn2+-, CO2+-, and Ni2+-saline solutions. Brain Res. 1981;205:111–121. doi: 10.1016/0006-8993(81)90723-x. [DOI] [PubMed] [Google Scholar]
- 31.Lnenicka GA, Atwood HL. Age-dependent long-term adaptation of crayfish phasic motor axon synapses to altered activity. J Neurosci. 1985;5:459–467. doi: 10.1523/JNEUROSCI.05-02-00459.1985. [DOI] [PMC free article] [PubMed] [Google Scholar]
- 32.Lnenicka GA, Atwood HL. Long-term changes in neuromuscular synapses with altered sensory input to a crayfish motoneuron. Exp Neurol. 1988;100:437–447. doi: 10.1016/0014-4886(88)90029-5. [DOI] [PubMed] [Google Scholar]
- 33.Lnenicka GA, Atwood HL, Marin L. Morphological transformation of synaptic terminals of a phasic motoneuron by long-term tonic stimulation. J Neurosci. 1986;6:2252–2258. doi: 10.1523/JNEUROSCI.06-08-02252.1986. [DOI] [PMC free article] [PubMed] [Google Scholar]
- 34.Msghina M, Charlton MP, Atwood HL. Differentiation of transmitter release properties and calcium transients in phasic and tonic motor nerve endings of crustacea. Soc Neurosci Abstr. 1995;21:138.15. [Google Scholar]
- 35.Murthy VN, Sejnowski TJ, Stevens CF. Heterogeneous release properties of visualized individual hippocampal synapses. Neuron. 1997;18:599–612. doi: 10.1016/s0896-6273(00)80301-3. [DOI] [PubMed] [Google Scholar]
- 36.Nudell BM, Grinnell AD. Regulation of synaptic position, size and strength in anuran skeletal muscle. J Neurosci. 1983;3:161–176. doi: 10.1523/JNEUROSCI.03-01-00161.1983. [DOI] [PMC free article] [PubMed] [Google Scholar]
- 37.Pierce JP, Mendel LM. Quantitative ultrastructure of Ia boutons in the ventral horn: scaling and positional relationships. J Neurosci. 1993;13:4748–4763. doi: 10.1523/JNEUROSCI.13-11-04748.1993. [DOI] [PMC free article] [PubMed] [Google Scholar]
- 38.Quigley PA, Cooper RL, Govind CK, Atwood HL. Recruitment of active synapses at the crayfish neuromuscular junction visualized with the fluorescent dye FM 1–43. Soc Neurosci Abstr. 1996;22:309.9. [Google Scholar]
- 39.Ravin R, Spira ME, Parnas H, Parnas I. Simultaneous measurement of intracellular Ca2+ and asynchronous transmitter release from the same crayfish bouton. J Physiol (Lond) 1997;501.2:251–262. doi: 10.1111/j.1469-7793.1997.tb00001.x. [DOI] [PMC free article] [PubMed] [Google Scholar]
- 40.Robitaille R, Tremblay JP. Incorporation of vesicular antigens into the presynaptic membrane during exocytosis at the frog neuromuscular junction: a light and electron microscopy immunochemical study. Neuroscience. 1987;21:619–629. doi: 10.1016/0306-4522(87)90147-3. [DOI] [PubMed] [Google Scholar]
- 41.Schikorski T, Stevens CF. Quantitative ultrastructural analysis of hippocampal excitatory synapses. J Neurosci. 1997;17:5858–5867. doi: 10.1523/JNEUROSCI.17-15-05858.1997. [DOI] [PMC free article] [PubMed] [Google Scholar]
- 42.Sherman RG, Atwood HL. Correlated electrophysiological and ultrastructural studies of a crustacean motor unit. J Gen Physiol. 1972;59:586–615. doi: 10.1085/jgp.59.5.586. [DOI] [PMC free article] [PubMed] [Google Scholar]
- 43.Shupliakov O, Atwood HL, Ottersen OP, Storm-Mathisen J, Brodin L. Presynaptic glutamate levels in tonic and phasic motor axons correlate with properties of synaptic release. J Neurosci. 1995;15:7168–7180. doi: 10.1523/JNEUROSCI.15-11-07168.1995. [DOI] [PMC free article] [PubMed] [Google Scholar]
- 44.Stephens PJ. Ethanol decreases the velocity of spike propagation along a fast motor axon. Alcohol. 1992;9:103–107. doi: 10.1016/0741-8329(92)90019-7. [DOI] [PubMed] [Google Scholar]
- 45.Stephens PJ, Frascella PA, Mindrebo N. Effects of ethanol and temperature on a crab motor axon action potential: a possible mechanism for peripheral spike generation. J Exp Biol. 1983;103:289–301. [Google Scholar]
- 46.Südhof TC. The synaptic vesicle cycle: a cascade of protein-protein interactions. Nature. 1995;375:645–653. doi: 10.1038/375645a0. [DOI] [PubMed] [Google Scholar]
- 47.Turner DA, Chen Y, Isaac JT, West M, Wheal HV. Excitatory synaptic site heterogeneity during paired pulse plasticity in CA1 pyramidal cells in rat hippocampus in vitro. J Physiol (Lond) 1997;500.2:441–461. doi: 10.1113/jphysiol.1997.sp022032. [DOI] [PMC free article] [PubMed] [Google Scholar]
- 48.Walrond JP, Reese TS. Structure of axon terminals and active zones at synapses on lizard twitch and tonic muscle fibers. J Neurosci. 1985;5:1118–1131. doi: 10.1523/JNEUROSCI.05-05-01118.1985. [DOI] [PMC free article] [PubMed] [Google Scholar]
- 49.Walrond JP, Govind CK, Heustis S. Two structural adaptations for regulating transmitter release at lobster neuromuscular synapses. J Neurosci. 1993;13:4831–4845. doi: 10.1523/JNEUROSCI.13-11-04831.1993. [DOI] [PMC free article] [PubMed] [Google Scholar]
- 50.Wiersma CAG. The neuromuscular system. In: Waterman TH, editor. The physiology of crustacea, Vol 2. Academic; New York: 1961. pp. 191–240. [Google Scholar]
- 51.Wojtowicz JM, Atwood HL. Long-term facilitation alters transmitter releasing properties at the crayfish neuromuscular junction. J Neurophysiol. 1986;55:484–498. doi: 10.1152/jn.1986.55.3.484. [DOI] [PubMed] [Google Scholar]
- 52.Wojtowicz JM, Smith BR, Atwood HL. Activity-dependent recruitment of silent synapses. Ann NY Acad Sci. 1991;627:169–179. doi: 10.1111/j.1749-6632.1991.tb25922.x. [DOI] [PubMed] [Google Scholar]
- 53.Wojtowicz JM, Marin L, Atwood HL. Activity-induced changes in synaptic release sites at the crayfish neuromuscular junction. J Neurosci. 1994;14:3688–3702. doi: 10.1523/JNEUROSCI.14-06-03688.1994. [DOI] [PMC free article] [PubMed] [Google Scholar]
- 54.Zucker RS. Changes in the statistics of transmitter release during facilitation. J Physiol (Lond) 1973;229:787–810. doi: 10.1113/jphysiol.1973.sp010167. [DOI] [PMC free article] [PubMed] [Google Scholar]