Abstract
We analyzed the magnitude and interneuronal correlation of the variability in the activity of single neurons that were recorded simultaneously using a multielectrode array in the primary motor cortex and parietal areas 2/5 in rhesus monkeys. The animals were trained to move their arms in one of eight directions as instructed by a visual target. The relationship between variability (SD) and mean of the discharge rate was described by a power function with a similar exponent (∼0.57), regardless of the cortical area or the behavioral condition. We examined whether the deviation from mean activity between target onset and the end of the movement was correlated on a trial-by-trial basis with variability in activity during the hold period before target onset. In both cortical areas, for about a quarter of the neurons, the neuronal noise of these two periods was positively correlated, whereas significant negative correlations were seldom observed. Overall, neurons with higher signal correlation (i.e., similar directional pattern) showed higher noise correlation in both cortical areas. On the other hand, when the data were divided according to the distance between the electrode tips from which the neurons were recorded, a consistent relationship between the signal and noise correlations was found only for pairs of neurons recorded through the same electrode. These results suggest that nearby neurons with similar directional tuning carry primarily redundant messages, whereas neurons in separate cortical columns perform more independent processing.
Keywords: directional tuning, motor cortex, noise correlation, parietal cortex, synchronized firing, rhesus monkey
The activity of single neurons is quite variable even when tested under the same conditions, and such “neuronal noise” is thought to limit the capacity of individual neurons to transmit information (Perkel and Bullock, 1969; Johnson, 1980; Tolhurst et al., 1983; Mainen and Sejnowski, 1995). The magnitude of neuronal noise (SD), taken primarily from the visual cortex, is comparable with the mean activity (Henry et al., 1973; Tomko and Crapper, 1974; Rose, 1979; Dean, 1981; Tolhurst et al., 1983; Vogels et al., 1989; Snowden et al., 1992; Britten et al., 1993; Softky and Koch, 1993; Gur et al., 1997). For motor cortical areas, although variability in neuronal activity during the period of movement preparation has been linked to changes in response times (Lecas et al., 1986; Riehle and Requin, 1993), quantitative characterization of neuronal noise has not been performed.
In most previous studies, the noise of individual neurons was measured separately, one neuron at a time, and, therefore, one could not determine whether the noise was correlated among a group of neurons. However, the correlated noise among multiple neurons can fundamentally affect the outcome of combining activity in a neuronal pool (Johnson, 1980; Gawne and Richmond, 1993; Shadlen et al., 1996;Lee et al., 1998). Although the similarity between the psychometric function of the animal and the neurometric functions for neurons in the visual cortex suggests that pooling is limited to a relatively small number of sensory neurons, the presence of correlated noise may increase the required size of the neuronal pool (Tolhurst et al., 1983;Britten et al., 1992; Zohary et al., 1994; Shadlen et al., 1996). In the motor cortex, the direction of an arm movement in space can be accurately predicted by a population vector that is the vector sum of preferred directions of individual neurons weighted according to their activities (Georgopoulos et al., 1983, 1986, 1988), and the size and pattern of the correlated noise also play an important role (Lee et al., 1998). Because it is likely that nearby neurons receive more common inputs than do those farther apart, it might be expected that correlated noise decreases with interneuronal distance (Braitenberg and Schüz, 1991; Zohary et al., 1994; Douglas et al., 1995). On the other hand, corticocortical connections in the visual cortex preferentially knit together columns with similar receptive field properties (Ts’o et al., 1986; Gilbert and Wiesel, 1989). Because similar focal concentrations of synaptic connections have been found in the motor cortex (DeFelipe et al., 1986; Shinoda and Kakei, 1989), neurons with similar directional tuning may display correlated noise even in separate cortical columns. In the present study, we characterized the magnitude and correlation of neuronal noise in the primary motor cortex and parietal areas 2/5 from neurons recorded in a wide range of interneuronal distances. The effects of firing patterns and noise stability on the correlated noise were also examined to understand the nature and possible roles of neuronal noise.
MATERIALS AND METHODS
Animal preparation. Animal care and surgical procedure have been described previously (Georgopoulos et al., 1982;Lurito et al., 1991). They conformed to the principles outlined in theGuide for the Care and Use of Laboratory Animals (National Institutes of Health publication no. 85–23, revised 1985).
Behavioral paradigms and data collection. Three adult rhesus monkeys performed reaching movements using a two-dimensional articulated manipulandum (Georgopoulos et al., 1982). Visual stimuli were displayed on a 14 inch computer screen located 57 cm in front of the animal. The animal controlled the position of a feedback cursor (circle of 0.3 cm radius) displayed on the screen by moving the manipulandum. The gain of the feedback cursor was set to one, and thex–y position of the manipulandum was sampled at 100 Hz with a spatial resolution of 0.125 mm. At the beginning of each trial, the animal was required to maintain the position of the feedback cursor within the central target (circle of 1 cm radius) for 1–3 sec. After this variable center hold time (CHT), one of eight peripheral targets located 8 cm from the central target (every 45°) was presented, instructing the direction of the required movement. For each neuron, each direction of movement was repeated four to five times in a pseudorandom order.
Single cell activity was recorded in the arm area of the motor cortex (area 4; two hemispheres) and parietal areas 2/5 (two hemispheres), using an array of seven electrodes the interelectrode spacing of which ranged from 0.33 to 4 mm (Lurito et al., 1991; Mountcastle et al., 1991; Lee et al., 1998). Each electrode was connected to a head stage, low-pass and 60 Hz notch filters, a gain amplifier, an equalizing bandpass filter, and a dual-amplitude window discriminator (Bak Electronics, Germantown, MD). The output of the amplifier was connected to a display oscilloscope (Tektronix 2232) and an audio monitor. Spike arrival times were stored at 1 μsec resolution. Occasionally, two neurons were isolated from the same electrode, and the data were accepted only when separation of the signal was clear as judged by the shapes of individual spikes. It is possible, however, that some nearly simultaneous spikes were missed when they produced temporally overlapping spikes recorded by the same electrode.
Data analysis. For a given neuron, two values were measured in each trial, namely, the discharge rate during the last second of the CHT and the discharge rate between the target onset and the end of the movement [total experimental time (TET)]. These two values are denoted as Ami,k andBmi,k, respectively, where irefers to a particular neuron, k represents the movement direction (k = 1, 2, … , 8 for the movements at 0, 45, … , 315° counterclockwise, where 0° indicates the rightward direction), and m indicates the number of trials within each movement direction (m = 1, 2, …, 5).
To quantify the variability of discharge rates, we defined the noise as the deviation from the mean discharge rate during each period. Thus, noise for the CHT was Ami,k −Ai,k, and that for the TET wasBmi,k − Bi,k, where Ai,k(Bi,k) indicates the mean discharge rate during the CHT (TET) for neuron i and the kth movement direction. We also calculated SDs for these two measures. For the CHT:
where Ai is the mean discharge rate during the CHT for neuron i, andNm refers to the number of repetitions for each movement direction (i.e., Nm = 4 or 5). For the TET, the SD was calculated separately for each movement direction:
For each neuron, the signal was defined as the mean discharge rate during the TET for each movement direction, i.e.,Bi,k. For a given pair of neurons (i and j), the signal correlation was defined as the correlation coefficient between the signals of the two neurons:
where:
For each neuron, noise stability was defined as the correlation coefficient of the noise between the CHT and TET:
For each pair of neurons, the noise correlation was defined as the correlation coefficient of the noise between the two neurons. For the CHT:
The noise correlation for the TET was defined similarly:
It should be noted that although each movement direction was repeated only four or five times, estimates of the noise and signal correlation were based on the data collected for eight movement directions, so that the number of trials contributing to these estimates was at least 32.
For hypothesis testing involving comparison of the above correlation coefficients, each correlation coefficient (r) was first converted into Fisher’s z transform for normalization of the distribution as follows (Snedecor and Cochran, 1989):
In previous studies of neuronal noise, the coefficient of variation (CV) has been used frequently to represent the amount of variability relative to the mean activity. The CV is the ratio between the SD and the mean (i.e., SD/M) for a given variable. In the present study, we calculated the CV for the discharge rate (rate CV) and the CV for the interspike intervals (interval CV) during the CHT. Because CV is a ratio, it was log-transformed to normalize its distribution for the purpose of statistical analysis. The SD was also log-transformed for the same purpose.
To examine the tendency of synchronized firing between a pair of neurons, we constructed cross-correlation histograms (CCH, or cross-correlograms) between spike trains during the CHT for all pairs of neurons that were recorded simultaneously. (Pairs of neurons recorded through the same electrode were excluded from the analysis because we could not ensure that synchronous spikes were always detected properly under these circumstances.) Only pairs of neurons in which the CCH was based on >200 spikes were considered for reliable results. A CCH shows the firing frequency of a neuron as a function of the time elapsed from the occurrence of a spike in another neuron (Perkel et al., 1967). Synchronized firing was taken as the area under the CCH between −10 and 10 msec after the average of the CCH between −100 and 100 msec was subtracted as the baseline (Fig.1). To assess statistical significance, we used a randomization test (Perkel et al., 1967; Manly, 1991) in which 500 additional CCHs were generated for each pair of neurons after randomly shuffling the trials from which the spike trains for two neurons were drawn (Fig. 1, thick solid line). The frequency with which the amount of synchronized firing in the original CCH was exceeded in these shuffled CCHs gave the p value for statistical significance.
Fig. 1.
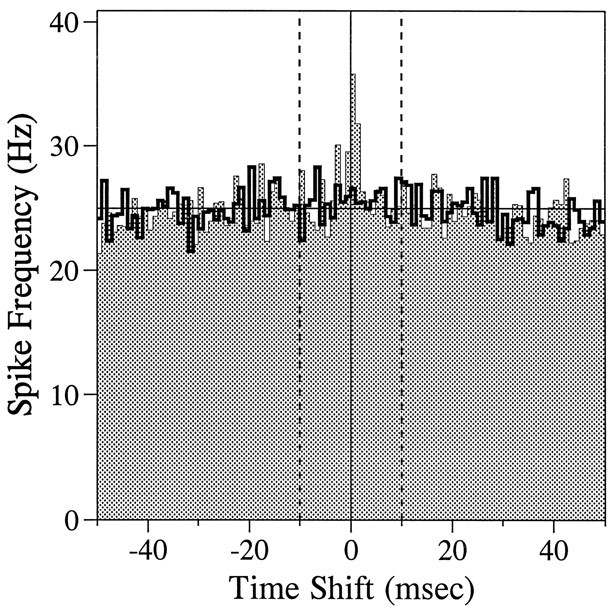
The CCH or cross-correlogram for a pair of neurons recorded in the motor cortex (shaded area). The histogram (thick solid line) represents an example of a shuffled CCH produced after the trials from which the two neurons were recorded were randomly shuffled. The degree of synchronized firing was measured as the area in the CCH between −10 and 10 msec (dotted vertical lines) after the baseline (thin solid horizontal line) was subtracted. In this example, none of the 500 shuffled CCHs produced greater synchronization than did the original CCH (i.e., p < 0.002).
A method of cell classification developed in our laboratory (Taira and Georgopoulos, 1993) was applied to classify neurons according to mean discharge rate, burst characteristics, and proportion of short interspike intervals. For the burst analysis, the method ofLegéndry and Salcman (1985) and Aldridge and Gilman (1991) was used. In this method, a series of short interspike intervals is defined as a burst if it includes at least two successive intervals (three spikes) less than one-half of the average in the whole spike train and if the probability of the occurrence of the burst in a random (Poisson) spike train was <0.001. For each burst, the burst index is calculated as the square root of the product of the surprise value (the negative logarithm of the probability of the burst occurrence) and the burst rate per 1000 spikes. Taira and Georgopoulos (1993) derived the following classification functions from a discriminant analysis performed on spike trains of 1925 cortical cells:
where C is the classification function, Xis the mean frequency of the discharge, Y is the percentage of interspike intervals <20 msec, and Z is the burst index. A neuron is classified into the group that yields the largest value in the classification function. These three types correspond to neurons with a low discharge rate and low bursting (type A), those with a low discharge rate and high bursting (type B), and those with a high discharge rate and low bursting (type C).
RESULTS
Variability of discharge rates
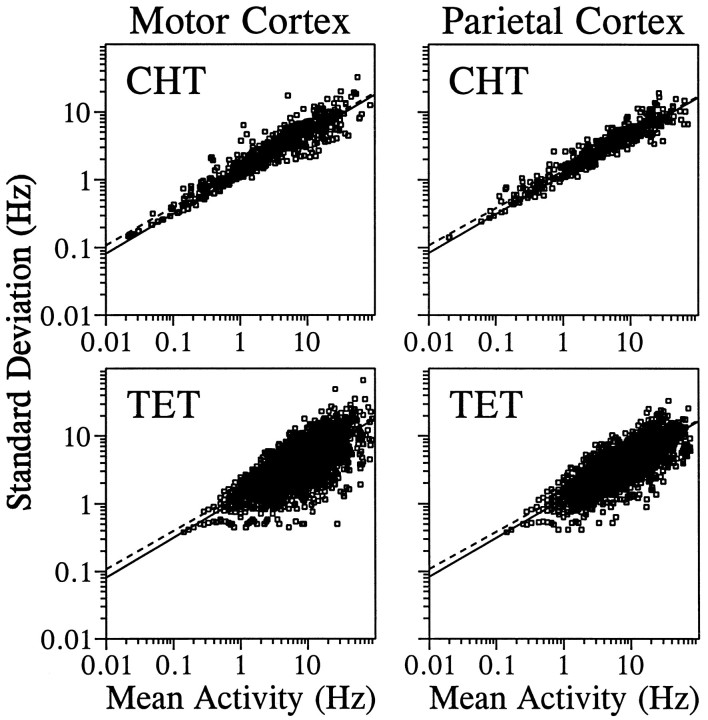
We recorded the impulse activity of 681 and 492 neurons from the primary motor cortex and parietal areas 2/5, respectively. We found that the relationship between the mean and the SD of discharge rates was fit well by power functions in both motor and parietal cortices for both CHT and TET (Fig. 2). The power functions that fit the actual data best and the correspondingr2 were:
In these equations, M represents the mean of discharge rates, respectively. The coefficients were obtained from a linear regression after all the variables were log-transformed. To obtain the relationship between the variance (instead of SD) of discharge rates and their means, both sides of the above equations can be squared, resulting in the exponent in these new equations ranging between 1.10 and 1.17. These results indicate that the relationship between the SD and mean of the discharge rates was quantitatively similar regardless of the cortical area and the behavioral condition.
Fig. 2.
Relationship between SD of discharge rate (y-axis) and mean discharge rate (x-axis) during the CHT (top) and the TET (bottom). Data are shown separately for the neurons in the motor cortex (left) and the parietal cortex (right). The best-fit power functions (see Results) for the CHT (dotted line) and the TET (solid line) are shown twice for each cortical area for the sake of comparison. Because each movement direction is treated separately for the discharge rates during the TET, but not for the CHT, there are eight times as many data points for the TET than for the CHT. Larger variability among the data points for the TET is probably attributable to a smaller number of trials contributing to each data point.
Because there was no hand movement during the CHT in almost all of the trials, random hand movements during the CHT were unlikely to be the cause of neuronal noise during the CHT. Although the activity of neurons in both motor and parietal areas has been shown to be affected by hand position, the variability in hand position during the CHT in the present study was also relatively small (<1 cm), and most neuronal noise during the CHT was not systematically related to such variability in hand position. We applied the following multiple linear regression model to examine the effects of the variability in hand position on the activity of each neuron during the last second of the CHT:
where b0 ∼ b2 are the regression coefficients, Xmk andYmk indicate the average horizontal and vertical hand positions, respectively, during the last second of the CHT, and emi,k is an error term. The number of neurons for which b0,b1, or b2 differed from zero in a statistically significant way was small in both the motor cortex (34 neurons, 5.0%) and the parietal cortex (30 neurons, 6.1%) and was not significantly different from binomial estimates based on the significance level used (5%).
Stability of neuronal noise
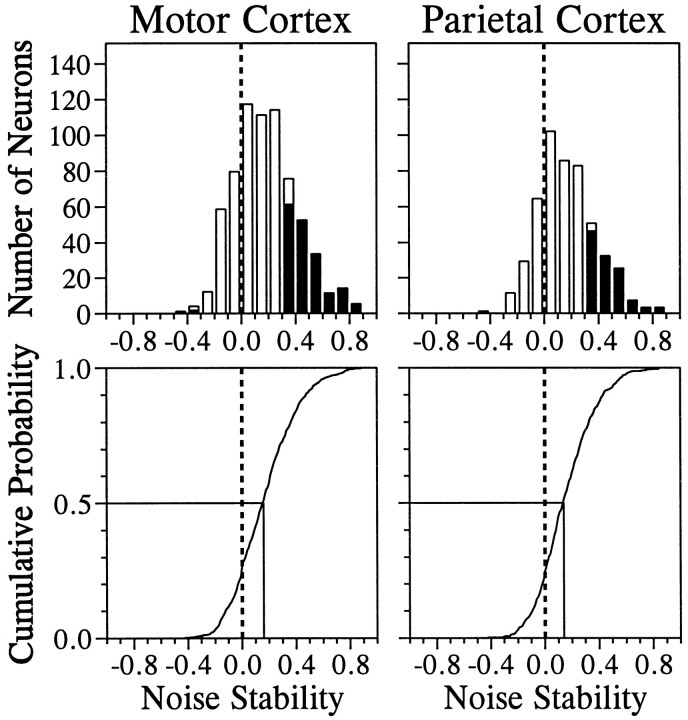
One important piece of information in understanding the nature of neuronal noise is the stability of neuronal noise over time (a time course). We measured the noise over two successive time intervals, and to evaluate stability of the neuronal noise during these two periods within individual trials, we determined whether trial-by-trial variability in the activity during the last second of the CHT was correlated with trial-by-trial variability during the TET. This measure of noise stability captures relatively slow fluctuations in the discharge rates within a single neuron over a period of several seconds and is different from the interneuronal noise correlation (see below). The distribution of correlation coefficients between these two periods displayed significant bias toward positive values (Fig.3). The median correlation coefficients for the motor and parietal cortices were 0.16 and 0.14, respectively. In the motor cortex, neuronal noise between these two periods showed statistically significant positive correlation in 179 neurons (26.2%) but showed significant negative correlation in only 3 neurons (0.4%). In the parietal cortex, 116 neurons (23.6%) and 1 neuron (0.2%) produced significant positive and negative correlation, respectively. Thus, these two cortical areas were similar in terms of stability of neuronal noise. The cumulative probability functions for this correlation coefficient were not statistically different between these two areas (Kolmogorov–Smirnov test, D+ = 0.044; p = 0.623). Thus, in both cortical areas, a substantial portion of the neurons examined displayed relatively low-frequency fluctuation in their discharge rates across two behaviorally distinct epochs.
Fig. 3.
Top, Distribution of correlation coefficients between noise during the CHT and that during the TET, or noise stability, for the primary motor cortex (left) and the parietal cortex (right). Filled areasindicate the neurons with statistically significant correlation (p < 0.05). Bottom, Cumulative probability for the same data.
Cortical neurons display various patterns in their spike trains, and distinct features in their firing patterns have been used to make inferences about their anatomical substrates (Steriade, 1978; Taira and Georgopoulos, 1993). To evaluate the possibility that neurons with different anatomical features may display different noise patterns, we classified the neurons examined in the present study according to the classification scheme developed by Taira and Georgopoulos (1993). One of these classes (type C), characterized by a relatively high discharge rate and low bursting, displayed a more stable noise pattern than did the other two classes (Table 1), suggesting that the stability of neuronal noise might be different among groups of neurons with different firing characteristics.
Table 1.
Comparison of noise stability (z transform) among different cell types (mean ± SEM)
| Type A | Type B | Type C | |
|---|---|---|---|
| Number of neurons | |||
| Motor | 147 (21.6%) | 505 (74.2%) | 29 (4.3%) |
| Parietal | 80 (16.3%) | 381 (77.4%) | 31 (6.3%) |
| Noise stability | |||
| Motor | 0.1879 ± 0.0225 | 0.1911 ± 0.0115 | 0.3382 ± 0.0720 |
| Parietal | 0.1805 ± 0.0267 | 0.1684 ± 0.0113 | 0.3095 ± 0.0670 |
Variability of interspike intervals
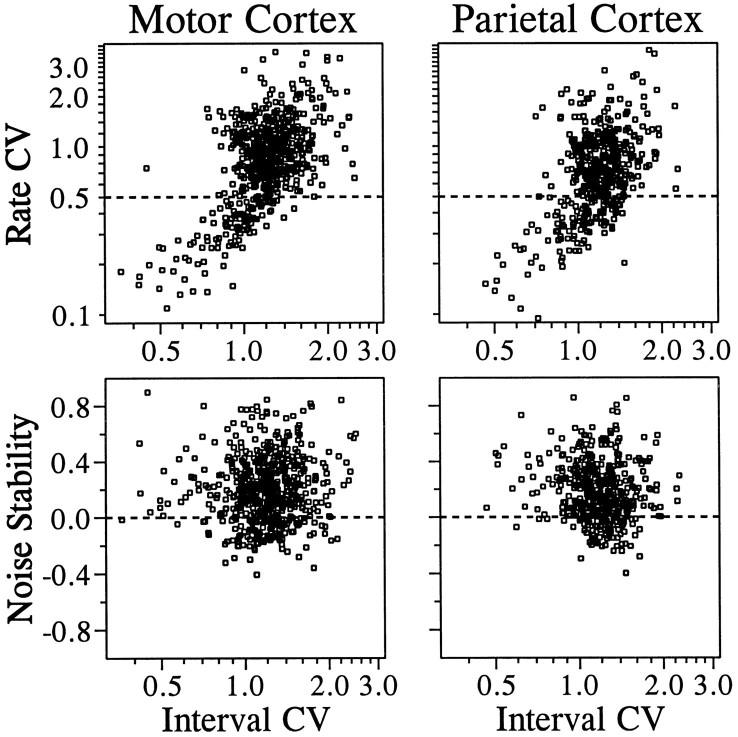
Our definition of neuronal noise is based on the rate of discharge estimated from a period of ∼1 sec. We examined whether such neuronal noise is related to the regularity of interspike intervals. If successive interspike intervals were statistically independent, the mean and SD of the discharge rate would be completely determined by the distribution of interspike intervals. This would not be the case if there was higher-order statistical structure in the spike trains. To examine this issue, we used the CV. Larger CVs indicate greater variability. For variability in discharge rate, we calculated the CV for the discharge rate during the last second of the CHT (rate CV). Similarly, the CV for interspike intervals during the same period was also calculated (interval CV). For this analysis, only neurons that contributed >20 interspike intervals were considered, because small numbers of spikes could result in unreliable outcomes. These two CVs were significantly correlated in both cortical areas. The correlation coefficients between the log-transformed CVs (see Materials and Methods) were 0.5840 (n = 598) for the motor cortex and 0.5008 (n = 445) for the parietal cortex (Fig.4). In both areas, these two variables were more strongly correlated among neurons with relatively small variability in their discharge rates. When the correlation coefficient was recalculated for neurons with rate CVs < 0.5 (Fig. 4,top, below the dotted line), it increased to 0.7706 (n = 115) and 0.6410 (n = 126) for the motor and parietal cortices, respectively. In contrast, when only neurons with rate CVs exceeding this criterion were considered (Fig. 4, top, above the dotted line), the corresponding correlation coefficients were reduced to 0.2491 (n = 483) and 0.1508 (n = 319), respectively. These results indicate that the amount of regularity in the interspike intervals is more strongly related to the variability of the discharge rate when the variability in the discharge rate is relatively small.
Fig. 4.
Top, Relationship between the rate CV and the interval CV during the same period for the primary motor cortex (left) and the parietal cortex (right). Bottom, Relationship between noise stability (correlation of noise between the CHT and the TET) and the interval CV.
For a random spike train (Poisson process), in which the variance of discharge rate is identical to its mean, the value of interval CV is one (Softky and Koch, 1993), and a value of interval CV larger than one is an indication of a multistate neuron (Wilbur and Rinzel, 1983). For neurons with a rate CV < 0.5, the percentages of neurons with an interval CV larger than one were 35 and 56% for the motor and parietal cortices, respectively, whereas for those with a rate CV > 0.5, the corresponding values were 84 and 87%. These results suggest that relatively large values of rate CV are the result of switching between multiple states with different mean discharge rates.
Next, we examined whether noise stability is affected by the relative amount of variability in the discharge rates or the regularity of interspike intervals. The rate CV during the CHT did not have significant effects on noise stability. The correlation coefficient between the log-transform of the rate CV and the z transform of noise stability was −0.0411 and −0.0540 for the motor and parietal cortices, respectively. On the other hand, the log-transform of the interval CV showed a small but significant negative correlation with noise stability in the parietal cortex (r = −0.1359;p < 0.05), whereas a weak positive correlation in the motor cortex was not statistically significant (r = 0.0389; Fig. 4, bottom). These results suggest that the noise stability is not influenced in any major way by either the variability in the discharge rates or the regularity in the interspike intervals.
Relationship between signal correlation and noise correlation
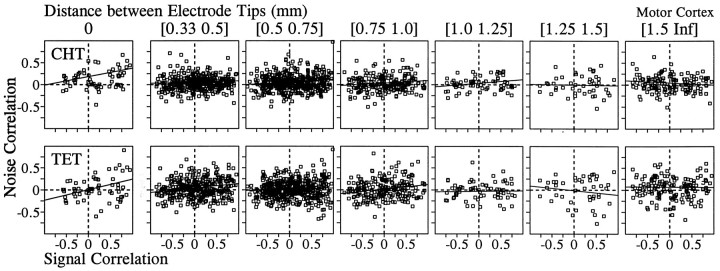
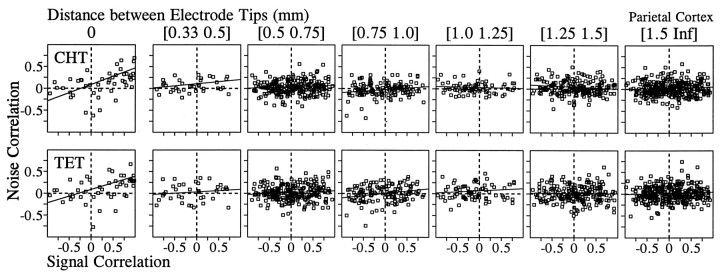
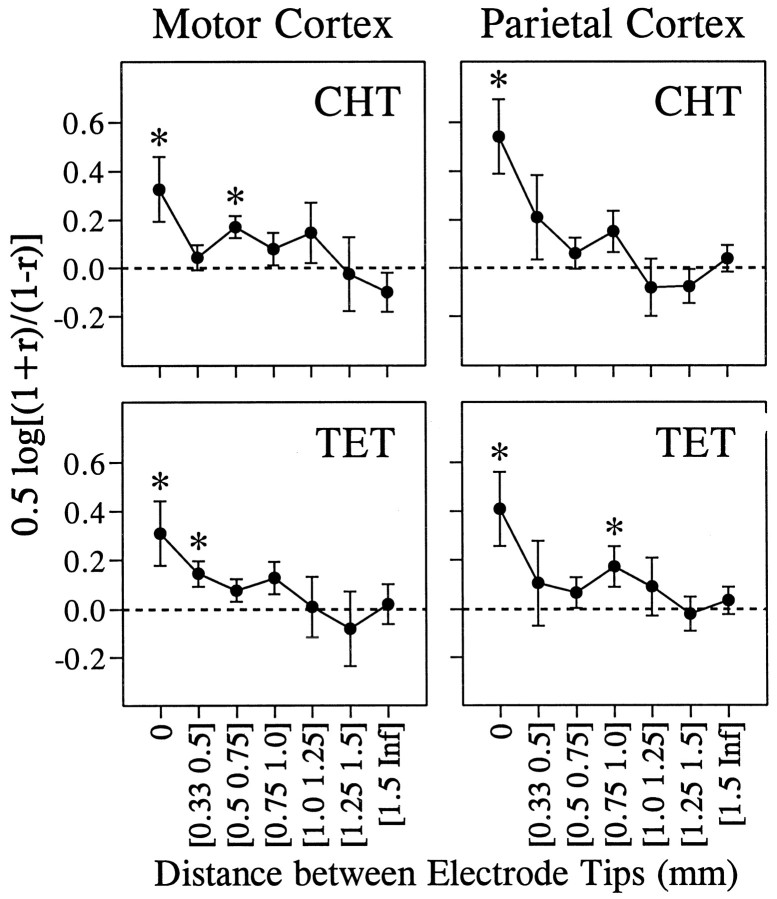
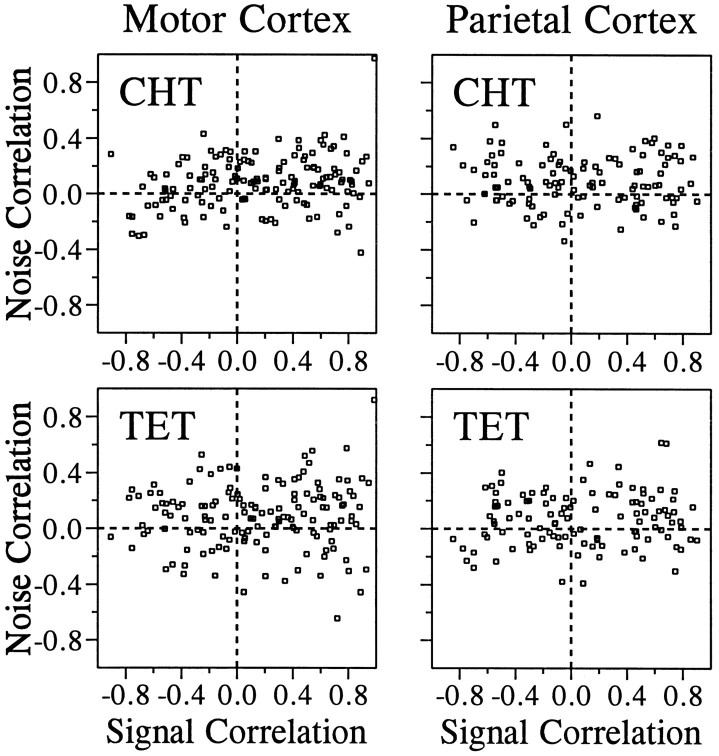
Our analysis of the correlated noise was based on 1416 and 1087 pairs of neurons that were recorded simultaneously in the primary motor cortex and parietal areas 2/5, respectively. The value of noise correlation varied widely, and there was a slight bias toward positive correlation in the distribution of noise correlation in both areas. The mean values for the z transforms of the noise correlation were statistically different from zero in both areas for both the CHT and the TET (t test, p < 0.05; Table2). In addition, there was a weak but statistically significant correlation between signal correlation and noise correlation. The correlation coefficient between the ztransforms of signal correlation and noise correlation is shown in Table 3 for different cortical areas and behavioral conditions (CHT and TET). We subdivided these data according to the distance between electrode tips from which pairs of neurons were recorded to examine whether spatial proximity between two neurons affects the relationship between the signal correlation and the noise correlation. The numbers of pairs that were recorded through the same electrode were 60 and 46 for the two areas, respectively, and they formed a separate group in this analysis. For both cortical areas, the highest correlation between the signal correlation and the noise correlation was found for neurons that were recorded through the same electrodes (Figs.5-7), and there was a tendency for such correlation to decrease gradually as the distance between the electrodes increased (Fig. 7). This was true whether the noise correlation was obtained from the CHT or TET.
Table 2.
Mean values for z transforms of the noise correlation for the CHT (TET)
| Motor cortex | Parietal cortex | |
|---|---|---|
| All neurons | ||
| 0.0409 (0.0198) | 0.0237 (0.0149) | |
| n = 1416 | n = 1087 | |
| Neurons with stable noise | ||
| −0.0111 (−0.0284) | 0.0320 (0.0127) | |
| n= 125 | n = 57 | |
| Neurons with peaks in CCH | ||
| 0.0912 (0.0960) | 0.0936 (0.0687) | |
| n = 147 | n = 118 | |
| Neurons without peaks in CCH | ||
| 0.0320 (0.0071) | 0.0136 (0.0000) | |
| n = 640 | n = 569 | |
Table 3.
Correlation coefficient between z transforms of the signal correlation and the noise correlation during the CHT (TET)
| Motor cortex | Parietal cortex | |
|---|---|---|
| All neurons | ||
| 0.0955 (0.1033) | 0.0984 (0.1062) | |
| n = 1416 | n = 1087 | |
| Neurons with stable noise | ||
| 0.0556 (−0.1686) | 0.3700 (0.2089) | |
| n= 125 | n = 57 | |
| Neurons with peaks in CCH | ||
| 0.3326 (0.1498) | −0.0111 (0.0911) | |
| n = 147 | n = 118 | |
| Neurons without peaks in CCH | ||
| 0.0001 (0.0266) | 0.0263 (0.0581) | |
| n = 640 | n = 569 | |
Fig. 5.
Relationship between the signal correlation and the noise correlation in the motor cortex during the CHT (top) and the TET (bottom). Pairs of neurons were divided into seven groups according to the distance between the electrode tips from which they were recorded. Thesolid line in each panel was determined by a linear regression. The correlation coefficients for these data are shown in Figure 7.
Fig. 6.
Relationship between the signal correlation and the noise correlation in parietal areas 2/5. The same conventions described in Figure 5 apply.
Fig. 7.
Effects of the distance between the electrode tips (x-axis) on the correlation coefficient between the signal correlation and the noise correlation during the CHT (top) and the TET (bottom) for the primary motor cortex (right) and the parietal cortex (left). The y-axis shows Fisher’sz transform ± SE for the correlation coefficient between the noise correlation and the signal correlation as shown in Figures 5 and 6. The asterisks indicate the correlation coefficients that were significantly different from zero (p < 0.05).
We examined the relationship between the signal correlation and the noise correlation separately for pairs of neurons of the same or different classes (Taira and Georgopoulos, 1993). Type C neurons were not included in this analysis because of the small sample size (Table1). In both cortical areas, the noise correlation was more closely correlated with the signal correlation during the CHT if both neurons in the pair were of type A, a type that was characterized by a low discharge rate and low bursting, but this was not the case during the TET (Table 4). These results suggest that if two neurons are both of type A, similarity in their directional signal is more likely because of either common inputs or reciprocal connections between them.
Table 4.
Effects of cell types on the correlation coefficient between the z transforms of the signal correlation and the noise correlation during the CHT (TET)
| A–A | B–B | A–B | |
|---|---|---|---|
| Motor cortex | 0.3059 (0.0160) | 0.1291 (0.1157) | 0.0459 (0.0815) |
| n = 73 | n = 812 | n = 417 | |
| Parietal cortex | 0.4289 (−0.0488) | 0.0620 (0.0431) | 0.0971 (0.1769) |
| n = 34 | n = 662 | n = 260 |
Effects of noise stability on correlated noise
Neurons differed substantially in their amount of noise stability (Fig. 3), and we therefore considered the possibility that the amount of noise correlation is related to noise stability in the neurons in a given pair. To test this possibility, we screened pairs of neurons in which both neurons displayed statistically significant noise stability, i.e., significant correlation in neuronal noise between the CHT and TET. Mean values of the ztransforms of the noise correlation for these neurons were not statistically different from the corresponding values of the entire sample (Table 2). These results suggest that the amount of correlated noise is independent of stability of neuronal noise. We also calculated the correlation coefficient between the z transforms of the signal correlation and the noise correlation for those pairs of neurons that displayed significant noise stability (Fig.8). There was significant correlation between the signal correlation and the noise correlation in the parietal cortex only for the CHT (Table 3).
Fig. 8.
Effects of the signal correlation on the noise correlation during the CHT (top) or the TET (bottom) for the neurons with significant noise stability in the primary motor cortex (left) or the parietal cortex (right).
Effects of synchronized firing on the signal and noise correlation
To examine whether pairs of neurons with a tendency to fire synchronously show more similar directional tuning or higher noise correlation, we selected pairs of neurons that displayed statistically significant positive peaks at approximately zero time lag in the CCH (see Materials and Methods). The percentage of neuronal pairs with significant positive peaks was similar in the two cortical areas, 18.7 and 17.2% for the motor and parietal cortices, respectively (Table 2). The distribution of interelectrode distances for pairs of neurons with such functional connectivity did not differ significantly from the distribution of entire samples for either cortical area (Kolmogorov–Smirnov test; D+ = 0.0923 andp = 0.2037 for the motor cortex; D+= 0.0728 and p = 0.6318 for the parietal cortex). Finally, we examined whether neurons are more likely to show positive peaks in their CCHs if they belong to the same or specific classes, according to the scheme of Taira and Georgopoulos (1993), but we did not find any significant differences.
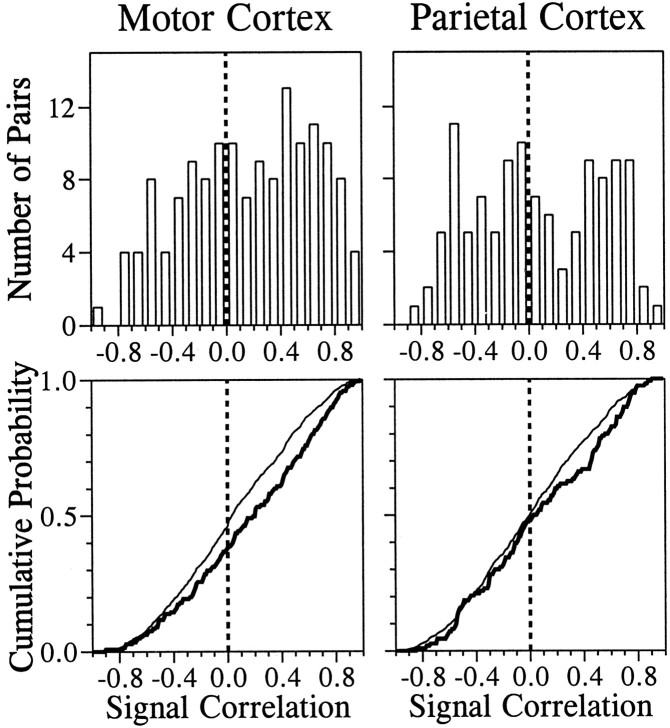
In both cortical areas, there were statistically significant differences between the distributions of signal correlation of all possible pairs and those with significant synchronized firing (Kolmogorov–Smirnov test, p < 0.05). These differences were caused by the fact that there were more pairs of neurons with relatively high signal correlation among those with synchronized firing than would be expected from the entire population (Fig. 9). Similarly, those pairs of neurons with synchronized firing in both areas displayed higher noise correlation during both the CHT and TET (Kolmogorov–Smirnov test,p < 0.01; Table 2).
Fig. 9.
Top, Distribution of the signal correlation between pairs of neurons with significant synchronized firing in the primary motor cortex (left) and the parietal cortex (right) is shown. These neurons were selected according to the criteria described in Materials and Methods (see also Fig. 1). Bottom, Thick linesshow the cumulative probability for the same data, and thin lines show the cumulative probability for the signal correlation between neurons without significant synchronized firing.
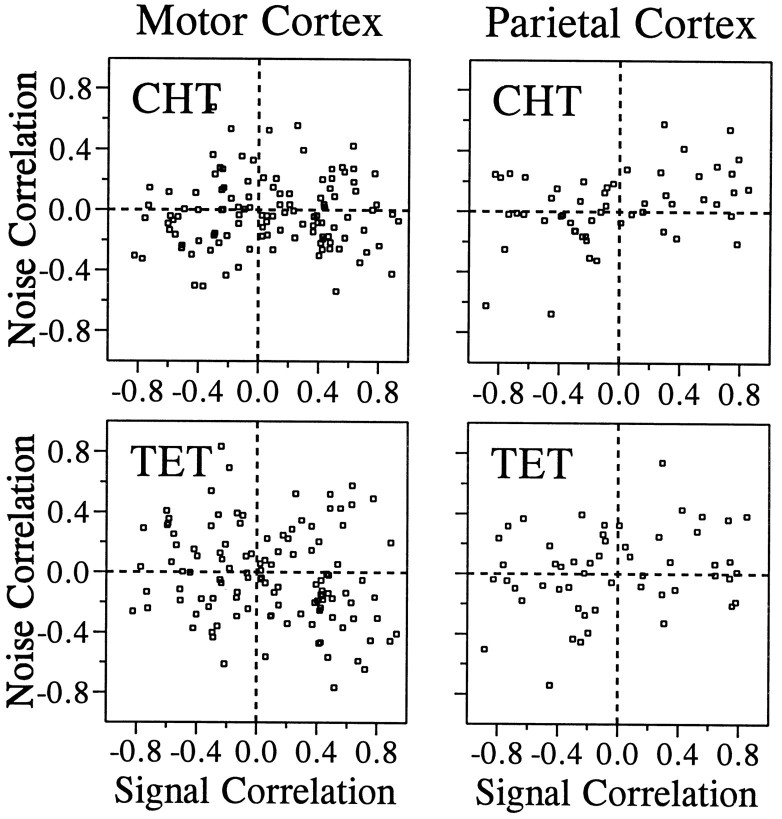
On the other hand, the relationship between the signal and the noise correlations for neurons with significant synchronized firing was similar to that for neurons without a tendency for synchronized firing, except for noise during the CHT in motor cortex (Fig.10, Table 3). For noise during the CHT in motor cortex, the correlation coefficient between the ztransforms of the signal correlation and the noise correlation for those neurons with synchronized firing (r = 0.3326;n = 147) was significantly higher than that for those without synchronized firing (r = 0.0001;n = 640). Even when a pair of neurons that showed extremely high correlation in both signal and noise was excluded from the analysis (Fig. 10, CHT, motor cortex, one data point in the top right corner), the correlation coefficient for neurons with synchronized firing (r = 0.1766; n = 146) was significantly different from those without synchronized firing at the 10% level (p = 0.055). Thus, although the degree of synchronized firing had minor effects on the relationship between the signal and the noise correlations in most cases, it may play a role in the motor cortex during the CHT.
Fig. 10.
Effects of the signal correlation on the noise correlation during the CHT (top) or the TET (bottom) for neurons with significant synchronized firing in the primary motor cortex (left) and the parietal cortex (right).
DISCUSSION
Sources of variability in activity of cortical neurons
To separate neuronal noise from the signal, it is necessary to control all variables that have systematic influences on the activity of neurons under consideration. Otherwise, one might obtain an overestimation or artifactual correlation of neuronal noise. Gur et al. (1997), for example, showed that small eye movements during fixation are responsible for a substantial portion of the response variability of neurons in the primary visual cortex. In the present study, because the hand was stationary during the CHT, the neuronal noise was not caused by random movements during the CHT. Alternatively, the neuronal noise might have been caused by the intertrial variability in the hand position (Evarts, 1969; Thach, 1978; Georgopoulos et al., 1984a; Ashe and Georgopoulos, 1994), but we showed with a multiple linear regression model that the variability in the hand position was not a significant factor in the neuronal noise during the CHT.
Activity in motor cortex during the TET is related to more than one movement parameter, including direction and amplitude (Fu et al., 1993; see also Georgopoulos, 1994). In the present study, neuronal noise during TET was calculated separately for each movement direction, thus eliminating from the noise the intertrial variability in neuronal activity related to movement direction. We did not attempt to relate the remaining variability in neural activity to other movement parameters, because the number of trials was too small for such analysis. However, the following observations suggest that a large proportion of the neuronal noise during the CHT and the TET shares a common origin. First, functions describing the relationship between SD and mean activity were similar in these two periods (Fig. 2). Second, variability in these two periods was often significantly correlated (Fig. 3). This is consistent with a recent optical imaging study that showed that the evoked response in the visual cortex is correlated with the preceding ongoing activity (Arieli et al., 1996). Finally, the effects of signal correlation and spatial proximity on noise correlation were similar (Figs. 5-7). The noise correlation was higher for neurons with similar directional tuning primarily when they were recorded through the same electrodes. To the extent that neuronal noise during TET is related to variability in the movement parameters, the relationship between signal correlation and noise correlation would have been similar regardless of the spatial proximity of the two neurons involved. These results suggest that the properties of neuronal noise remain relatively constant under these two different behavioral conditions.
Comparison across different areas
The two cortical areas examined in the present study, i.e., the primary motor cortex and parietal areas 2/5, were similar with respect to the relationship between variability and mean activity (Fig.2), noise stability (Fig. 3), and noise correlation (Figs. 5-7). Most previous studies on neuronal noise have been performed on the visual structures, and to our knowledge, no previous studies have provided quantitative characterization of neuronal noise in the cortical areas dealt with in the present study. Nevertheless, a power function with similar exponents seems to be a good descriptor of the variability across different structures (Werner and Mountcastle, 1965; Dean, 1981;Tolhurst et al., 1983; Vogels et al., 1989; Snowden et al., 1992;Hartveit and Heggelund, 1994; Gur et al., 1997). These results suggest that a common mechanism is responsible for the neuronal noise in these cortical areas. The issues on correlated noise can be addressed only with simultaneous recording of multiple neurons, and such data have been available only from a small number of studies (e.g., Gawne and Richmond, 1993; Zohary et al., 1994). Those other studies were performed using a single electrode, and therefore effects of spatial proximity on noise correlation could not be examined. In the middle temporal visual area (MT), Zohary et al. (1994) showed that neurons with similar preferred directions tend to have higher noise correlation. Our results suggest that such a linkage is manifested only for neurons in close proximity and not for neurons farther apart.
Effects of cell type
Using the procedure developed by Taira and Georgopoulos (1993), we classified neurons into three classes. It has been suggested that type A neurons correspond to pyramidal cells, whereas types B and C comprise both interneurons and pyramidal cells (Steriade, 1978; Taira and Georgopoulos, 1993). The issue of whether different classes of neurons display different patterns of noise has not been addressed in the past. In the present study, type C neurons (high discharge rates, low bursting) displayed more stable neuronal noise, suggesting that stable noise is related to the regulatory functions of inhibitory local circuits (Berman et al., 1992; Shadlen and Newsome, 1994). In addition, pairs of type A neurons (low discharge rates, low bursting) showed stronger effects of signal correlation on noise correlation during the hold period (CHT). These results were consistent regardless of the cortical area examined.
Effects of synchronized firing
The percentages of neuronal pairs that displayed statistically significant positive peaks in their CCH were similar in the two cortical areas examined in our study. In addition, in both areas, such neurons were more likely to have similar directional tuning as well as higher noise correlation, although the size of these effects was modest. Previous results from our laboratory have shown that neurons with similar preferred directions tend to have more synchronized firing in the motor cortex, based both on the waiting time probability density function (Georgopoulos et al., 1993) and on the CCH (Georgopoulos et al., 1994). The database used for the current study was different from that used in these earlier reports and therefore provides additional, and independent, evidence that similarity in directional tuning is an important factor determining functional neuronal connectivity.
In the inferior temporal areas (IT), it was shown that signal correlation was not significantly affected by the presence or absence of functional connectivity as revealed by the CCHs, although this conclusion was based on a relatively small sample size (Gawne and Richmond, 1993). These investigators did not report whether noise correlation was affected by functional connectivity. In the primary visual cortex, horizontal corticocortical connections preferentially connect the columns with similar receptive field properties (Gilbert and Wiesel, 1989), and the neurons in these columns are more likely to display positive peaks in their CCHs (Ts’o et al., 1986). Similarly, in the motor cortex, both pyramidal cells and thalamic inputs give rise to long-range collateralization with focal concentration of synaptic connections (DeFelipe et al., 1986; Shinoda and Kakei, 1989), and therefore either could provide the mechanisms for the functional connectivity revealed in the CCHs.
Functional significance of correlated noise
We showed that the noise correlation was increased when two neurons were recorded through the same electrode and had similar directional tuning (i.e., high signal correlation). Because it is difficult to assign all the spikes unequivocally to their proper sources when two neurons produce temporally overlapping spikes recorded by the same electrode, it is conceivable that neurons with similar directional tuning gave rise to artificially high noise correlation during the TET because of some uncertainty in spike sorting. However, such random misassignment of spikes would lower the noise correlation among these neurons. In addition, such idiosyncratic interaction of directional tuning and correlated noise is difficult to explain in the case of the noise during the CHT, and therefore we think it unlikely that these results are caused by technical problems in spike identification.
The effect of signal averaging in reducing noise depends on several factors, including the correlated noise and the way inputs are averaged (Johnson, 1980; Shadlen et al., 1996). If one assumes that the averaging occurs only within groups of neurons that share similar directional tuning, then the magnitude of the correlated noise sets an upper limit for the benefit of signal averaging (Britten et al., 1992;Zohary et al., 1994; Shadlen et al., 1996). On the other hand, if the averaging occurs among neurons with opposite preferred directions, correlated noise would be factored out by signal averaging (Johnson, 1980; Lee et al., 1998). Recently, we showed that accuracy in the estimation of directional signal in a pool of simultaneously recorded neurons was not affected by a manipulation that eliminated any correlated noise among these neurons (Lee et al., 1998). This is hardly surprising because on average the interneuronal correlation coefficient for neuronal noise was close to zero (Table 2).
Correlated noise must be a reflection of common or reciprocal inputs and cannot be attributed to the noise intrinsic to individual neurons. A question arises concerning the potential benefits for these neurons to carry messages redundant not only in their signals but also in their noise. One possible reason for several neurons to carry redundant messages may be to enhance the temporal resolution in coding a dynamic variable that can change rapidly (Stein, 1970; Knight, 1972). Introduction of time-varying signals may also affect some properties of neuronal noise, such as the relationship between the mean and variance of discharge rates (de Ruyter van Steveninck et al., 1997). Our results also indicate that neurons with similar directional tuning display primarily uncorrelated noise if they are not very close together, i.e., if they belong to separate cortical columns (Georgopoulos et al., 1984b; Amirikian and Georgopoulos, 1997). Although a common directional signal may still be responsible for similarity in directional tuning between the two neurons in different columns, the absence of correlated noise among these neurons with similar directional tuning suggests that local cortical circuitry performs independent processing unique to different cortical columns.
Footnotes
This study was supported by United States Public Health Service Grant 1-PSMH48185, the United States Department of Veterans Affairs, and the American Legion Chair in Brain Sciences.
Correspondence should be addressed to Dr. Apostolos P. Georgopoulos, Brain Sciences Center (11B), Veterans Administration Medical Center, One Veterans Drive, Minneapolis, MN 55417.
Dr. Lee’s present address: Department of Neurobiology and Anatomy, Wake Forest University School of Medicine, Medical Center Boulevard, Winston-Salem, NC 27157-1010.
Dr. Kruse’s present address: Department of Zoology and Neurobiology, Ruhr University Bochum, D-44780 Bochum, Germany.
REFERENCES
- 1.Aldridge JW, Gilman S. The temporal structure of spike trains in the primate basal ganglia: afferent regulation of bursting demonstrated with precentral cerebral ablation. Brain Res. 1991;543:123–138. doi: 10.1016/0006-8993(91)91055-6. [DOI] [PubMed] [Google Scholar]
- 2.Amirikian B, Georgopoulos AP. Motor cortical organization of preferred directions. Soc Neurosci Abstr. 1997;23:1555. [Google Scholar]
- 3.Arieli A, Sterkin A, Grinvald A, Aetsen A. Dynamics of ongoing activity: explanation of the large variability in evoked cortical responses. Science. 1996;273:1868–1871. doi: 10.1126/science.273.5283.1868. [DOI] [PubMed] [Google Scholar]
- 4.Ashe J, Georgopoulos AP. Movement parameters and neural activity in motor cortex and area 5. Cereb Cortex. 1994;6:590–600. doi: 10.1093/cercor/4.6.590. [DOI] [PubMed] [Google Scholar]
- 5.Berman NJ, Douglas RJ, Martin KAC. GABA-mediated inhibition in the neural networks of visual cortex. In: Mize RR, Marc RE, Sillito AM, editors. Progress in brain research. Elsevier; Amsterdam: 1992. pp. 443–476. [DOI] [PubMed] [Google Scholar]
- 6.Braitenberg V, Schüz A. Anatomy of the cortex: statistics and geometry. Springer; Berlin: 1991. [Google Scholar]
- 7.Britten KH, Shadlen MN, Newsome WT, Movshon JA. The analysis of visual motion: a comparison of neuronal and psychophysical performance. J Neurosci. 1992;12:4745–4765. doi: 10.1523/JNEUROSCI.12-12-04745.1992. [DOI] [PMC free article] [PubMed] [Google Scholar]
- 8.Britten KH, Shadlen MN, Newsome WT, Movshon JA. Responses of neurons in macaque MT to stochastic motion signals. Vis Neurosci. 1993;10:1157–1169. doi: 10.1017/s0952523800010269. [DOI] [PubMed] [Google Scholar]
- 9.Dean AF. The variability of discharge of simple cells in the cat striate cortex. Exp Brain Res. 1981;44:437–440. doi: 10.1007/BF00238837. [DOI] [PubMed] [Google Scholar]
- 10.DeFelipe J, Conley M, Jones EG. Long-range focal collateralization of axons arising from corticocortical cells in monkey sensory-motor cortex. J Neurosci. 1986;6:3749–3766. doi: 10.1523/JNEUROSCI.06-12-03749.1986. [DOI] [PMC free article] [PubMed] [Google Scholar]
- 11.de Ruyter van Steveninck RR, Lewen GD, Strong SP, Koberle R, Bialek W. Reproducibility and variability in neural spike trains. Science. 1997;275:1805–1808. doi: 10.1126/science.275.5307.1805. [DOI] [PubMed] [Google Scholar]
- 12.Douglas RJ, Koch C, Mahowald M, Martin KAC, Suarez HH. Recurrent excitation in neocortical circuits. Science. 1995;269:981–985. doi: 10.1126/science.7638624. [DOI] [PubMed] [Google Scholar]
- 13.Evarts EV. Activity of pyramidal tract neurons during postural fixation. J Neurophysiol. 1969;32:375–385. doi: 10.1152/jn.1969.32.3.375. [DOI] [PubMed] [Google Scholar]
- 14.Fu Q-G, Suarez JI, Ebner TJ. Neuronal specification of direction and distance during reaching movements in the superior precentral premotor area and primary motor cortex of monkeys. J Neurophysiol. 1993;70:2097–2116. doi: 10.1152/jn.1993.70.5.2097. [DOI] [PubMed] [Google Scholar]
- 15.Gawne TJ, Richmond BJ. How independent are the messages carried by adjacent inferior temporal cortical neurons? J Neurosci. 1993;13:2758–2771. doi: 10.1523/JNEUROSCI.13-07-02758.1993. [DOI] [PMC free article] [PubMed] [Google Scholar]
- 16.Georgopoulos AP. New concepts in generation of movement. Neuron. 1994;13:257–268. doi: 10.1016/0896-6273(94)90345-x. [DOI] [PubMed] [Google Scholar]
- 17.Georgopoulos AP, Kalaska JF, Caminiti R, Massey JT. On the relationships between the direction of two-dimensional arm movements and cell discharge in primate motor cortex. J Neurosci. 1982;2:1527–1537. doi: 10.1523/JNEUROSCI.02-11-01527.1982. [DOI] [PMC free article] [PubMed] [Google Scholar]
- 18.Georgopoulos AP, Caminiti R, Kalaska JF, Massey JT (1983) Spatial coding of movements: a hypothesis concerning the coding of movement direction by motor cortical populations. In: Neural coding of motor performance (Massion J, Paillard J, Shultz W, Wiesendanger M, eds). Exp Brain Res [Suppl] 7:327–336.
- 19.Georgopoulos AP, Caminiti R, Kalaska JF. Static spatial effects in motor cortex and area 5: quantitative relations in a two-dimensional space. Exp Brain Res. 1984a;54:446–454. doi: 10.1007/BF00235470. [DOI] [PubMed] [Google Scholar]
- 20.Georgopoulos AP, Kalaska JF, Crutcher MD, Caminiti R, Massey JT. The representation of movement direction in the motor cortex: single cell and population studies. In: Edelman GM, Gall WE, Cowan WM, editors. Dynamic aspects of neocortical function. Wiley; New York: 1984b. pp. 501–524. [Google Scholar]
- 21.Georgopoulos AP, Schwartz AB, Kettner RE. Neuronal population coding of movement direction. Science. 1986;233:1416–1419. doi: 10.1126/science.3749885. [DOI] [PubMed] [Google Scholar]
- 22.Georgopoulos AP, Kettner RE, Schwartz AB. Primate motor cortex and free arm movements to visual targets in three-dimensional space. II. Coding of the direction of movement by a neuronal population. J Neurosci. 1988;8:2928–2937. doi: 10.1523/JNEUROSCI.08-08-02928.1988. [DOI] [PMC free article] [PubMed] [Google Scholar]
- 23.Georgopoulos AP, Taira M, Lukashin A. Cognitive neurophysiology of the motor cortex. Science. 1993;260:47–52. doi: 10.1126/science.8465199. [DOI] [PubMed] [Google Scholar]
- 24.Georgopoulos AP, Taira M, Lukashin A. Measuring synaptic interactions: response. Science. 1994;263:1296–1297. doi: 10.1126/science.263.5151.1296. [DOI] [PubMed] [Google Scholar]
- 25.Gilbert CD, Wiesel TN. Columnar specificity of intrinsic horizontal and corticocortical connections in cat visual cortex. J Neurosci. 1989;9:2432–2442. doi: 10.1523/JNEUROSCI.09-07-02432.1989. [DOI] [PMC free article] [PubMed] [Google Scholar]
- 26.Gur M, Beylin A, Snodderly DM. Response variability of neurons in primary visual cortex (V1) of alert monkeys. J Neurosci. 1997;17:2914–2920. doi: 10.1523/JNEUROSCI.17-08-02914.1997. [DOI] [PMC free article] [PubMed] [Google Scholar]
- 27.Hartveit E, Heggelund P. Response variability of single cells in the dorsal lateral geniculate nucleus of the cat. Comparison with retinal input and effect of brain stem stimulation. J Neurophysiol. 1994;72:1278–1289. doi: 10.1152/jn.1994.72.3.1278. [DOI] [PubMed] [Google Scholar]
- 28.Henry GH, Bishop PO, Tupper RM, Dreher B. Orientation specificity and response variability of cells in the striate cortex. Vision Res. 1973;13:1771–1779. doi: 10.1016/0042-6989(73)90094-1. [DOI] [PubMed] [Google Scholar]
- 29.Johnson KO. Sensory discrimination: neural processes preceding discrimination decision. J Neurophysiol. 1980;43:1793–1815. doi: 10.1152/jn.1980.43.6.1793. [DOI] [PubMed] [Google Scholar]
- 30.Knight BW. Dynamics of encoding in a population of neurons. J Gen Physiol. 1972;59:734–766. doi: 10.1085/jgp.59.6.734. [DOI] [PMC free article] [PubMed] [Google Scholar]
- 31.Lecas JC, Requin J, Anger C, Vitton N. Changes in neuronal activity of the monkey precentral cortex during preparation for movement. J Neurophysiol. 1986;56:1680–1702. doi: 10.1152/jn.1986.56.6.1680. [DOI] [PubMed] [Google Scholar]
- 32. Lee D, Port NP, Kruse W, Georgopoulos AP. Neuronal population coding: multielectrode recordings in primate cerebral cortex. Neuronal ensembles: strategies for recording and decoding Eichenbaum H, Davis J. 1998. Wiley; New York, in press. [Google Scholar]
- 33.Legéndry CR, Salcman M. Bursts and recurrence of bursts in the spike trains of spontaneously active striate cortex neurons. J Neurophysiol. 1985;53:926–939. doi: 10.1152/jn.1985.53.4.926. [DOI] [PubMed] [Google Scholar]
- 34.Lurito JT, Georgakopoulos T, Georgopoulos AP. Cognitive spatial-motor processes. 7. The making of movements at an angle from a stimulus direction: studies of motor cortical activity at the single cell and population levels. Exp Brain Res. 1991;87:562–580. doi: 10.1007/BF00227082. [DOI] [PubMed] [Google Scholar]
- 35.Mainen ZF, Sejnowski T. Reliability of spike timing in neocortical neurons. Science. 1995;268:1503–1506. doi: 10.1126/science.7770778. [DOI] [PubMed] [Google Scholar]
- 36.Manly BF. Randomization and Monte-Carlo methods in biology. Chapman & Hall; New York: 1991. [Google Scholar]
- 37.Mountcastle VB, Reitboeck HJ, Poggio GF, Steinmetz MA. Adaptation of the Reitboeck method of multiple microelectrode recording to the neocortex of the waking monkey. J Neurosci Methods. 1991;36:77–84. doi: 10.1016/0165-0270(91)90140-u. [DOI] [PubMed] [Google Scholar]
- 38.Perkel DH, Bullock TH. Neural coding. Neurosci Res Symp Summ. 1969;3:405–527. [Google Scholar]
- 39.Perkel DH, Gerstein GL, Moore GP. Neuronal spike trains and stochastic point processes. II. Simultaneous spike trains. Biophys J. 1967;7:419–440. doi: 10.1016/S0006-3495(67)86597-4. [DOI] [PMC free article] [PubMed] [Google Scholar]
- 40.Riehle A, Requin J. The predictive value for performance speed of preparatory changes in neuronal activity of the monkey motor and premotor cortex. Behav Brain Res. 1993;53:35–49. doi: 10.1016/s0166-4328(05)80264-5. [DOI] [PubMed] [Google Scholar]
- 41.Rose D. An analysis of the variability of unit activity in the cat’s visual cortex. Exp Brain Res. 1979;37:595–604. doi: 10.1007/BF00236826. [DOI] [PubMed] [Google Scholar]
- 42.Shadlen MN, Newsome WT. Noise, neural codes and cortical organization. Curr Opin Neurobiol. 1994;4:569–579. doi: 10.1016/0959-4388(94)90059-0. [DOI] [PubMed] [Google Scholar]
- 43.Shadlen MN, Britten KH, Newsome WT, Movshon JA. A computational analysis of the relationship between neuronal and behavioral response to visual motion. J Neurosci. 1996;16:1486–1510. doi: 10.1523/JNEUROSCI.16-04-01486.1996. [DOI] [PMC free article] [PubMed] [Google Scholar]
- 44.Shinoda Y, Kakei S. Distribution of terminals of thalamocortical fibers originating from the ventrolateral nucleus of the cat thalamus. Neurosci Lett. 1989;96:163–167. doi: 10.1016/0304-3940(89)90051-7. [DOI] [PubMed] [Google Scholar]
- 45.Snedecor GW, Cochran WG. Statistical methods. Iowa State University; Ames, IA: 1989. [Google Scholar]
- 46.Snowden RJ, Treue S, Andersen RA. The response of neurons in areas V1 and MT of the alert rhesus monkey to moving random dot patterns. Exp Brain Res. 1992;88:389–400. doi: 10.1007/BF02259114. [DOI] [PubMed] [Google Scholar]
- 47.Softky WR, Koch C. The highly irregular firing of cortical cells is inconsistent with temporal integration of random EPSPs. J Neurosci. 1993;13:334–350. doi: 10.1523/JNEUROSCI.13-01-00334.1993. [DOI] [PMC free article] [PubMed] [Google Scholar]
- 48.Stein RB. The role of spike trains in transmitting and distorting sensory signals. In: Schmidt FO, editor. The neurosciences: second study program. Rockefeller University; New York: 1970. pp. 579–604. [Google Scholar]
- 49.Steriade M. Cortical long-axoned cells and putative interneurons during the sleep-waking cycle. Behav Brain Sci. 1978;3:465–514. [Google Scholar]
- 50.Taira M, Georgopoulos AP. Cortical cell types from spike trains. Neurosci Res. 1993;17:39–45. doi: 10.1016/0168-0102(93)90027-n. [DOI] [PubMed] [Google Scholar]
- 51.Thach WT. Correlation of neuronal discharge with pattern and force of muscular activity, joint position, and direction of intended next movement in motor cortex and cerebellum. J Neurophysiol. 1978;41:654–676. doi: 10.1152/jn.1978.41.3.654. [DOI] [PubMed] [Google Scholar]
- 52.Tolhurst DJ, Movshon JA, Dean AF. The statistical reliability of signals in single neurons in cat and monkey visual cortex. Vision Res. 1983;23:775–785. doi: 10.1016/0042-6989(83)90200-6. [DOI] [PubMed] [Google Scholar]
- 53.Tomko GJ, Crapper DR. Neuronal variability: non-stationary responses to identical visual stimuli. Brain Res. 1974;79:405–418. doi: 10.1016/0006-8993(74)90438-7. [DOI] [PubMed] [Google Scholar]
- 54.Ts’o D, Gilbert CD, Wiesel TN. Relationship between horizontal connections and functional architecture in cat striate cortex as revealed by cross-correlation analysis. J Neurosci. 1986;6:1160–1170. doi: 10.1523/JNEUROSCI.06-04-01160.1986. [DOI] [PMC free article] [PubMed] [Google Scholar]
- 55.Vogels R, Spileers W, Orban GA. The response variability of striate cortical neurons in the behaving monkey. Exp Brain Res. 1989;77:432–436. doi: 10.1007/BF00275002. [DOI] [PubMed] [Google Scholar]
- 56.Werner G, Mountcastle VB. Neural activity in mechanoreceptive cutaneous afferents: stimulus-response relations, Weber functions, and information transmission. J Neurophysiol. 1965;28:359–397. doi: 10.1152/jn.1965.28.2.359. [DOI] [PubMed] [Google Scholar]
- 57.Wilbur WJ, Rinzel J. A theoretical basis for large coefficient of variation and bimodality in neuronal interspike interval distributions. J Theor Biol. 1983;105:345–368. doi: 10.1016/s0022-5193(83)80013-7. [DOI] [PubMed] [Google Scholar]
- 58.Zohary E, Shadlen MN, Newsome WT. Correlated neuronal discharge rate and its implications for psychophysical performance. Nature. 1994;370:140–143. doi: 10.1038/370140a0. [DOI] [PubMed] [Google Scholar]


