Abstract
Mormyrid electric fish have species- and sex-typical electric organ discharges (EODs). One class of tuberous electroreceptors, the knollenorgans, plays a critical role in electric communication; one function is species recognition of EOD waveforms. In this paper, we describe cell types in the knollenorgan central pathway, which appear responsible for analysis of the temporal patterns of spikes encoded by the knollenorgans in response to EOD stimuli. Secondary sensory neurons in the nucleus of the electrosensory lateral line lobe (NELL) act as relays of peripheral responses. They fire a single phase-locked spike to an outside positive-going voltage step. Axons from the NELL project to the toral nucleus exterolateralis pars anterior (ELa). Immediately after they enter the ELa, they send collaterals to terminate on one to three ELa large cells and then continue in a lengthy neuronal pathway that traverses the ELa several times. After a path length of up to 5 mm, the NELL axon terminates on as many as 70 ELa small cells. Thus the large cells appear to be excited first, followed by the small cells, with the intervening length of the axon serving as a delay line. The large cells also respond with phase-locked spikes to voltage steps. Large cell axons extend for ∼1 mm and terminate on several small cells within the ELa. The terminals are known to be GABAergic inputs and are presumed inhibitory. We propose that small cells receive direct inhibition from large cells and delayed excitation from NELL axons. The small cells may act as anti-co-incidence detectors to analyze the temporal structure of the EOD waveform.
Keywords: mormyrid, electric fish, knollenorgan, electroreception, time-coding, delay line, co-incidence detector
Mormyrid electric fish communicate using pulse-type electric organ discharges (EODs), generated by an electric organ in the tail (Hopkins, 1986; Kramer, 1990; Moller, 1995). EODs can be species-, sex-, and individual-specific (Hopkins, 1981c;Hopkins and Bass, 1981; Crawford, 1992; Friedman and Hopkins, 1996). Fish can discriminate the species and sex of neighboring fish, apparently based on the temporal structure of the EOD waveform, although EODs may be less than 1 msec in duration (Hopkins, 1981c;Hopkins and Bass, 1981; Graff and Kramer, 1992). The EODs are detected by a specialized class of tuberous electroreceptors, called knollenorgans (Hopkins, 1981b, 1983; Moller and Szabo, 1981). In this paper, we describe anatomical and physiological specializations of cell types in the knollenorgan pathway and how these cells may be involved in temporal analysis of the EOD waveform.
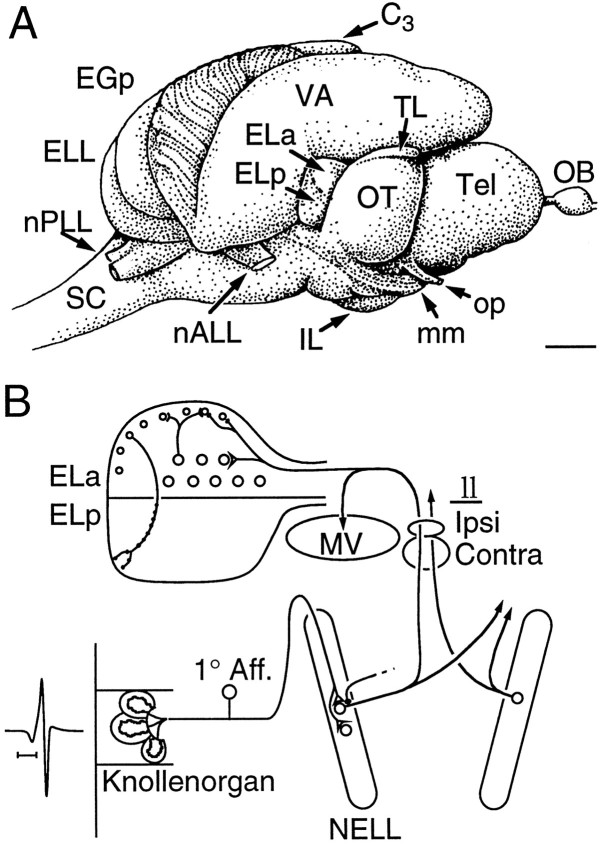
Figure 1 illustrates the knollenorgan pathway. Knollenorgans are scattered over the skin of the head and the dorsal and ventral midlines (Harder, 1968). Knollenorgan afferents are relayed through the nucleus of the electrosensory lateral line lobe (NELL), which in turn project up to the nucleus medialis ventralis (MV) and the nucleus exterolateralis pars anterior (ELa), where they end on two cell types, large cells and small cells (Bell and Szabo, 1986). ELa large cells terminate with calyceal, GABA-ergic synapses onto ELa small cells (Mugnaini and Maler, 1987a; Amagai et al., 1998), which in turn project to the nucleus exterolateralis pars posterior (ELp) (Haugedé-Carré, 1979).
Fig. 1.
Brain anatomy and summary of the knollenorgan pathway. A, Lateral view of brain of B. brachyistius. The nucleus exterolateralis sits between the valvula (VA) and the optic tectum (OT). The ELa is whiter than the ELp, because of its heavy myelin content. B, Summary of the knollenorgan pathway. Knollenorgan afferents project to the NELL, which in turn projects bilaterally to the ELa onto large and small cell types. The NELL also sends collaterals to the MV.C3, Cerebellar lobe 3; EGp, eminentia granularis pars posterior; ELa, nucleus exterolateralis pars anterior; ELL, electrosensory lateral line lobe; ELp, nucleus exterolateralis pars posterior; IL, inferior lobe; ll, lateral lemniscus; mm, meso-mesencephalic tract;MV, toral nucleus medialis ventralis;nALL, anterior lateral line nerve; NELLnucleus of the ELL; nPLL, posterior lateral line nerve;OB, olfactory bulb; op, optic nerve;SC, spinal cord; Tel, telencephalon;TL, torus longitudinalis; VA, valvula cerebelli. Scale bars: A, 1 mm; B, 250 μsec.
The primary afferents, NELL cells, and ELa large cells all have large, adendritic somata, heavily myelinated, thick axons, and large, mixed electrotonic and chemical synapses (Bell and Russell, 1978; Szabo et al., 1983; Mugnaini and Maler, 1987a,b; Bell and Grant, 1989; Hopkins et al., 1993; Amagai et al., 1998). Their responses are tightly phase-locked to the stimulus with little temporal variation (“jitter”; Amagai et al., 1998). They also can contain high levels of calcium-binding proteins (Friedman and Kawasaki, 1997). These specializations are characteristic of other sensory systems that encode the temporal structure of stimuli, so-called “time-coding pathways” (Carr, 1986, 1993). Early stages in these pathways encode temporal information using phase-locking, but higher stages typically convert to a different coding form, such as the presence or magnitude of firing in a subset of cells in a map, with an accompanying loss of the anatomical and physiological specializations.
Indeed, in the knollenorgan pathway, the ELa small cells lack these specializations (Mugnaini and Maler, 1987a). Because the ELa receives bilateral input from the NELL, small cells could make temporal comparisons between knollenorgan activity on the two sides of the body (Szabo et al., 1983). Hopkins and Bass (1981) proposed that recognition of EOD waveforms could be accomplished by comparing the difference in response latencies between different regions of the body surface presented with an EOD stimulus. Our results support the hypothesis that ELa small cells measure EOD duration by comparing delayed, excitatory input from an NELL cell with inhibitory input from an ELa large cell, with the two inputs having receptive fields on different parts of the body surface.
MATERIALS AND METHODS
This study used more than 50 individuals of two species of mormyrid fish, Brienomyrus brachyistius (Gill, 1862) andB. niger (Günther, 1866). Fish were imported from commercial fish dealers, housed in 400 l tanks, kept on a 12 hr light/dark cycle, and fed live blackworms. Water conductivity was maintained at ∼200–500 μS/cm. Some of the methods have been described before (Amagai et al., 1998).
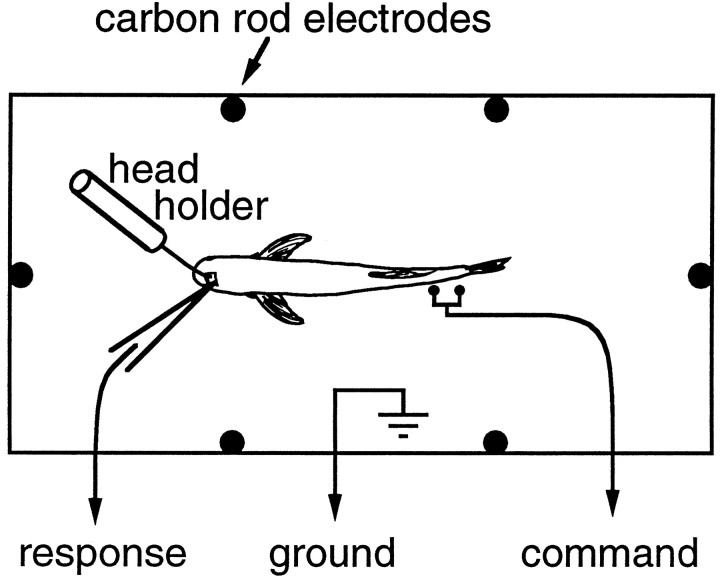
We paralyzed fish and eliminated the EOD with flaxedil (10–20 μl of 2 mg/ml), providing continuous aerated water for respiration. We glued a post to the skull to stabilize the head and opened a small hole over the nucleus exterolateralis (Fig. 2). During surgery, the fish was anesthetized with MS-222 (100–200 mg/l) and with 2% lidocaine applied to the surgical wound.
Fig. 2.
Experimental setup. Stimuli are delivered either transverse or head–tail through carbon rod electrodes. The head is steadied with a head holder glued to the skull. The health of the fish is monitored using a pair of electrodes next to the tail, which pick up the spinal volley that would normally cause an electric organ discharge.
Intracellular recording. We used thin-wall (0.75 mm inner diameter) borosilicate glass containing 2% biocytin dissolved in an artificial intracellular solution (“Rose” solution, in mm: 100 potassium acetate, 2 KCl, 1 MgCl2, 5 EGTA, 10 HEPES, and 20 KOH) (Rose and Fortune, 1996) (resistances 150–250 MΩ). In some experiments, we used 5% lucifer yellow in 0.1 m LiCl, 2% biocytin in 2m potassium acetate, or 2–3% neurobiotin in 3m KCl.
We positioned microelectrodes using a Burleigh inchworm microdrive (Burleigh Instruments, Fishers, NY) according to visual landmarks (Fig.1A). We confirmed electrode position by the short-latency responses of units to electrosensory stimuli. We aimed for 15–20 mV spikes and −30 mV resting potentials for the best fills.
Cellular responses were amplified (intracellular amplifier 707A, World Precision Instruments, Sarasota, FL), low-pass-filtered at 10 kHz, and digitized to computer disk at 20 kHz (AD1; Tucker-Davis Technologies, Gainesville, FL). Responses were analyzed off-line using custom written software. Latencies for action potentials and synaptic potentials were measured to the point of maximum slope.
After recording from a cell, we attempted to fill it with dye by passing positive-biased 2 Hz sinusoidal current. Large cell bodies could be faintly labeled after 15–30 sec of filling, but a good fill required >5 min.
Stimulus generation. We presented square pulse stimuli (0.02–30 msec duration) with different amplitudes (0.1–300 mV/cm in 5 dB steps) and geometries, using a Tucker-Davis AP2 array processor, DA1 digital-to-analog device, and a PA4 programmable attenuator. Stimuli were isolated using an audio transformer (Magnetek Triad, T-31X; frequency response, flat ± 3 dB from 12 Hz to 40 kHz) and were delivered into the tank using carbon electrodes (Fig. 1C). The positive electrode was on the fish’s left side (Fig. 2). We calibrated the electric field with the fish absent.
We measured the one-to-one firing threshold for NELL cells and ELa large cells in each polarity by stimulating at long durations at the lowest intensity that yielded one-to-one firing. Then we shortened the duration until the cell stopped firing, at which point we increased the intensity in 5 dB steps until it fired one-to-one. For some fibers, no response could be elicited for the shortest durations. Stimuli were generally delivered at four to five per second. For the sake of filling the cells with dye, we tried to characterize the cells in <2 min.
Tract tracing. We used broken-tipped microelectrodes (8–12 μm), filled with Mr 3000 or 10,000 biotinylated dextran amines [Molecular Probes, Eugene, OR; 7% in 0.7m KCl and 0.03% Triton X-100 (Aldrich, St. Louis, MO)]. We verified electrode placement in the ELa or the ELp using field potentials and injected dye with 0.7–1.3 μA of current for 1–5 min. We allowed 4–6 hr for the dye to transport.
Histology. Before perfusion, we deeply anesthetized fish with 0.05–0.1% MS-222. We perfused fish through the conus with 0.9% NaCl, followed by 4% buffered paraformaldehyde, and post-fixed the brains overnight in paraformaldehyde and then in 4% paraformaldehyde plus 10% sucrose until it sank. We embedded the brains in 10% gelatin–10% sucrose, post-fixed overnight, and cut 50 μm frozen sections on a sliding microtome (American Optical Corp., Buffalo, NY). The brains with tract-tracing injections were treated similarly, but without the sucrose, and were cut at 60 μm by Vibratome (Pelco, Redding, CA). We visualized biotin-labeled cells with a protocol modified from that of Horikawa and Armstrong (1988) (see Amagai et al., 1998). Sections were mounted on subbed slides, counterstained with neutral red, dehydrated, and coverslipped under Permount (Fisher Scientific, Rochester, NY) or DePeX (Bio/Medical Specialties, Inc., Santa Monica, CA).
Microscopy. We made camera lucida drawings of cells on a Leitz DMRB microscope. Complete serial reconstruction was performed for several cells by lining up segments of axons from one section with the adjacent section. The exit position of an axon segment from a section reliably predicted a nearby continuing axon segment in the next section, and an axon segment that did not exit the section reliably ended with a distinct terminal onto a counterstained cell body of identifiable type. After axon assignments were made, axon segment lengths were measured by walking a pair of calipers set to the equivalent of 10 μm over the length of the traced axon. If a segment entered and exited through opposite sides of the section, its true length was estimated by assuming it took the shortest, straight diagonal path through the section, and therefore:
RESULTS
Encoding characteristics of NELL axons and ELa large cells
Our results summarize recordings from >150 units in the ELa, most of which were from NELL axons or ELa large cells, which had response characteristics similar to knollenorgan primary afferents. These cells were stimulated by either the rising edge or the falling edge of square pulse stimuli. They fired spikes, usually singly, at 2.5–3 msec latency with low jitter. One-to-one firing thresholds varied from 5 to 50 mV/cm.
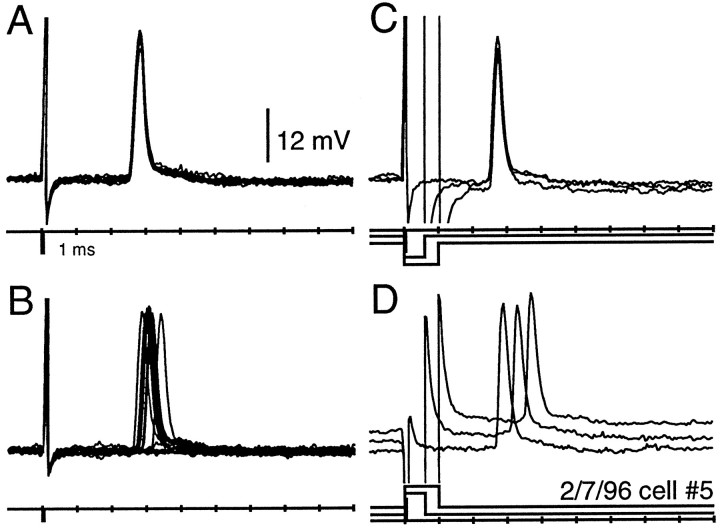
Figure 3 illustrates these characteristics for one NELL axon. This unit responded at its one-to-one firing threshold (14 mV/cm) with a latency of 2.6 ± 0 msec (Fig. 3A). When the stimulus intensity was reduced to 8.0 mV/cm, the response probability decreased to 68% (13 of 19), and the response latency and jitter increased to 2.84 ± 0.13 msec (n = 13; range, 2.65–3.2 msec; Fig. 3B). With a further reduction in stimulus intensity to 8 mV/cm (∼5 dB), the unit was silent. If the intensity was increased above the one-to-one firing threshold, there was no change in first spike latency.
Fig. 3.
Traces from a contralateral NELL axon recorded in the ELa. This recording typifies the most common type of unit recorded in the ELa. The large deflections 1 msec from the beginning of the trace are stimulus artifact. A, Response at the one-to-one firing threshold. Ten responses to a 0.05 msec, 14 mV/cm, reverse polarity square pulse are overlaid. B, Responses 5 dB below the one-to-one firing threshold. The 19 stimulus presentations of a 0.05 msec, 8.0 mV/cm, reverse polarity square pulse are overlaid. C, D, Responses to reverse (C) and normal (D) polarity stimuli of 0.05, 0.6, and 1 msec durations.
As seen in previous studies (Amagai et al., 1988, 1993, 1998), responses were phase-locked to one edge of the stimulus or the other. The spike response of the unit in Figure 3 was phase-locked at a latency of 2.6 msec to the leading edge of a reverse polarity stimulus (left side negative; Fig. 3C) or to the falling edge of a normal polarity stimulus (left side positive; Fig. 3D). From this polarity test, we predicted, and later confirmed by labeling the cell with dye, that the receptive field was on the right (contralateral) side of the fish. Most of the units we recorded from were driven by contralateral inputs. Other units were driven by ipsilateral (left) inputs, but these were less common.
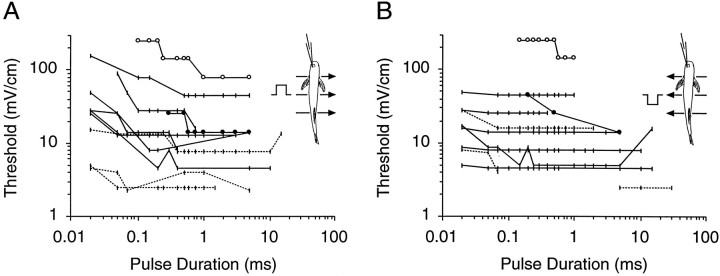
We determined the one-to-one firing thresholds to transverse electric fields for each unit over a range of square pulse durations (11 examples shown in Fig. 4). The thresholds varied from 2–3 mV/cm to 200 mV/cm for different units. These numbers were higher and more variable than receptor thresholds measured in response to direct stimulation at the receptor pore (Bennett, 1965;Hopkins, 1981a) and undoubtedly reflect the effect of stimulus geometry (see Yager and Hopkins, 1993). Typically, the thresholds were constant for square pulse stimuli with durations down to 0.1 msec. Some units showed nearly constant thresholds down to 0.02 msec square pulse, but for others the intensity had to be increased by 5 or 10 dB to achieve one-to-one firing for the shortest durations. All units shown in Figure4 were confirmed to be NELL axons or ELa large cells by intracellular labeling. Two large cells are marked with circles. One large cell (Fig. 4, open circles) could not be driven one-to-one, and we suspect its receptive field was in an unfavorable location for transverse stimuli. We could not distinguish between large cell recordings and NELL axon recordings from their physiological properties alone.
Fig. 4.
One-to-one firing thresholds for square pulses of varying durations for 11 units recorded in the ELa. Solid lines are fibers from contralateral-responding NELL cells, anddotted lines are from ipsilateral-responding NELL cells. The open and closed circles are two units confirmed to be ELa large cells. Insets show the direction of current flow, normal polarity in A, and reverse polarity in B.
NELL afferent projection patterns
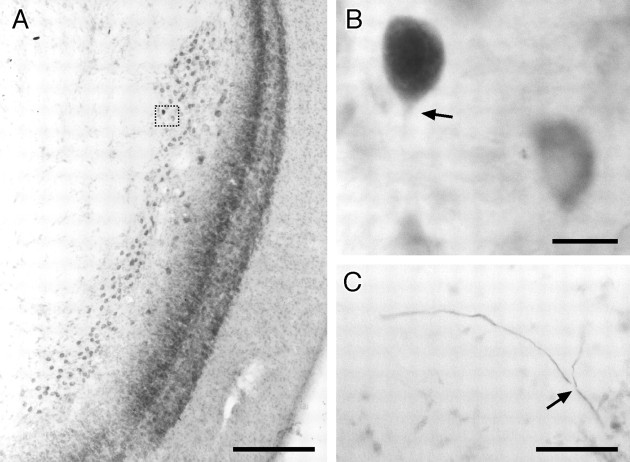
We successfully filled 30 afferent axons from the NELL with biocytin. The fills were characterized by an axon projecting into the ELa from the lateral lemniscus. Twenty-three axons ran in the contralateral (ventral) lateral lemniscal bundle; five ran in the ipsilateral (dorsal) lateral lemniscal bundle; and two could not be determined. We labeled all the way to the soma in the NELL in eight cases (e.g., Fig.5A,B). In 4 of the 30 cases, we saw a distinct bifurcation in the posterior lateral lemniscus, with collaterals to both ipsilateral and contralateral ELas (Fig. 5C). Because the axons were quite faint at the bifurcation point in these four cases, the absence of a collateral in the other 26 axons is inconclusive.
Fig. 5.
NELL cell. In this and all subsequent anatomical figures, sections are cut horizontally (i.e., anterior is attop), and the somata have been counterstained with neutral red. A, Overview of the right NELL of B. niger. Medial is to the left. The NELL is a long tube of large round cells, just medial to the ampullary zone of the ELL cortex. The area in the dotted box is enlarged inB. B, NELL soma filled by intracellular injection into ELa. The somata are large and adendritic. The arrowindicates the labeled initial segment. A nearby unfilled cell, counterstained with neutral red, is included for comparison.C, Bifurcation of an NELL axon in the decussation of the lateral lemniscus. The axon arrives from the lower rightand bifurcates (arrow), producing collateral fibers to the contralateral (right branch) and ipsilateral (left branch) ELas. Scale bars: A, 200 μm; B, 20 μm; C, 50 μm.
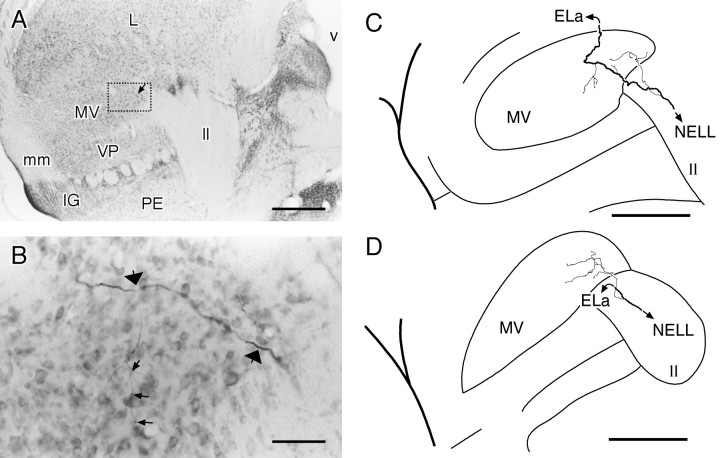
In six well labeled NELL axons, we observed a collateral projection into the medial ventral toral nucleus (Fig.6, MV). All of the axons that had MV terminals arose from the contralateral NELL, but because the number of ipsilateral NELL axons labeled was small, we cannot conclude that ipsilateral NELL axons do not terminate in the MV also. The terminal arborizations are thin and diffuse, with varicosities at intervals along their length (Fig.6B). We saw two variants of this projection. In the first variant, four NELL axons branched within the lemniscus, with the main trunk continuing dorsally toward the ELa and the thin branch turning ventrally and laterally toward the MV (Fig.6D). In the second variant, two NELL axons diverted from the lemniscus and crossed the dorsal MV, letting off intermittent branches (Fig. 6B,C), before continuing dorsally and laterally toward the ELa.
Fig. 6.
Terminals from intracellularly filled NELL cells in the MV. A, Overview of the torus semicircularis. In all subsequent figures, anterior is at top, and medial is to the right. The MV is located ventral to the nucleus exterolateralis, with the lateral lemniscus passing medially and dorsally to it. A fiber from the NELL crossing the MV is indicated by the arrow and is enlarged in B. B, Closeup of the boxed area in A. An axon from the NELL traverses the MV, with two branches visible at this plane of section (large arrows). The axon within the MV is thin, and there are small varicosities visible (small arrows). C, Reconstruction from eight sections of the axon shown in A and B. The terminal field is contained within two sections (100 μm)D, Another NELL axon terminating in the MV, reconstructed from three sections (150 μm). IG, Isthmic granule nucleus; mm, meso-mesencephalic tract;PE, preeminential nucleus; v, ventricle;VP, ventral posterior nucleus. Scale bars: A, C, D, 400 μm; B, 50 μm.
In agreement with previous studies (Mugnaini and Maler, 1987a), the NELL axon projecting into the ELa is thick (2–4 μm; Fig.7A). We observed two types of terminals from these NELL axons. The first type was a large cup-like terminal onto the soma of an ELa large cell. These terminals onto large cells were located either immediately adjacent to the NELL axon (Fig.7A) or off a thick, 10- to 80-μm-long collateral (Fig.7B). The terminals onto large cells were 4–10 μm across, compared with the large-cell soma diameter of 8–14 μm. The second type of NELL axon terminal was a smaller bouton onto an ELa small cell. These terminals generally occurred at the ends of branches off the axon (Fig. 7C) or as en passant synapses along the axon. Fibers with terminals onto small cells were <1 μm in diameter, and terminal boutons were 1–2 μm across, compared with the small cell soma diameter of 5–7 μm. In one case, we observed dye coupling between the NELL axon and the small cell somata it contacted (Fig.7C). This is consistent with the electron microscopic study of Mugnaini and Maler (1987a), which found electrotonic synapses between NELL axons and small cells.
Fig. 7.
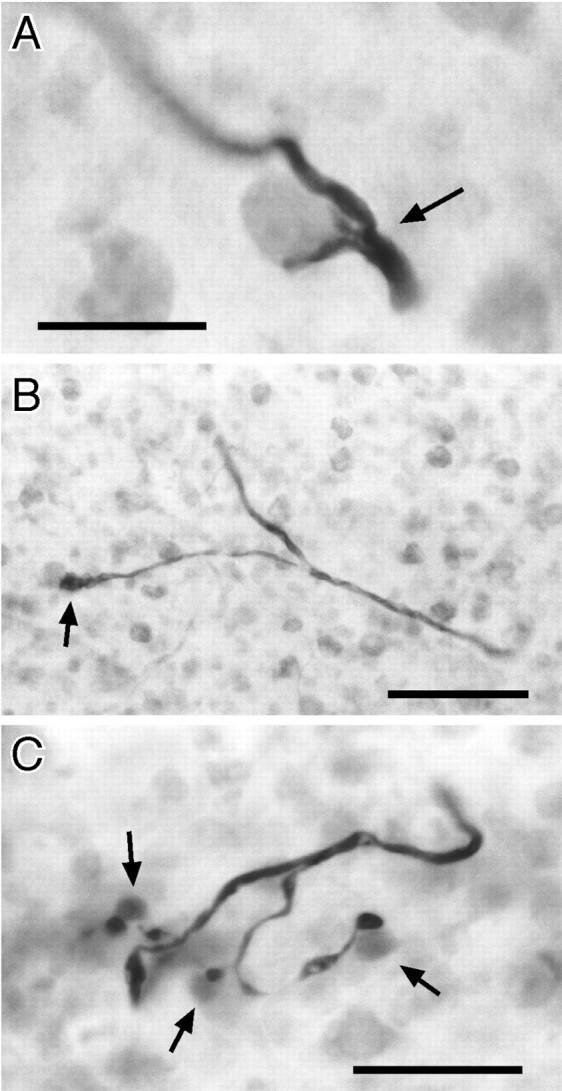
Terminals from NELL cells in the ELa.A, Nearby terminal from an intracellularly labeled NELL axon onto an ELa large cell (arrow). B, Distant terminal from an intracellularly labeled NELL axon onto an ELa large cell (arrow). C, Terminals from an intracellularly labeled NELL axon onto ELa small cells. The small cell somata contacted (arrows) are distinctly grayer than the surrounding red-counterstained small cells, which indicates dye coupling. Scale bars: A, C, 20 μm; B, 50 μm.
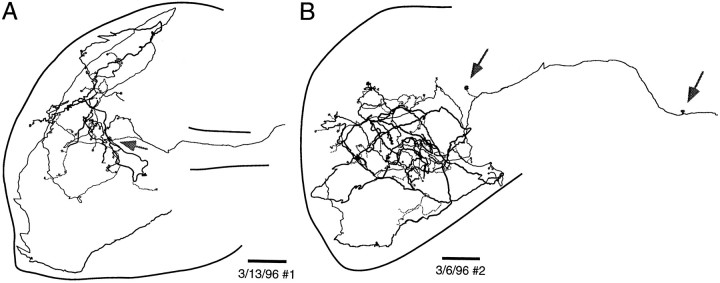
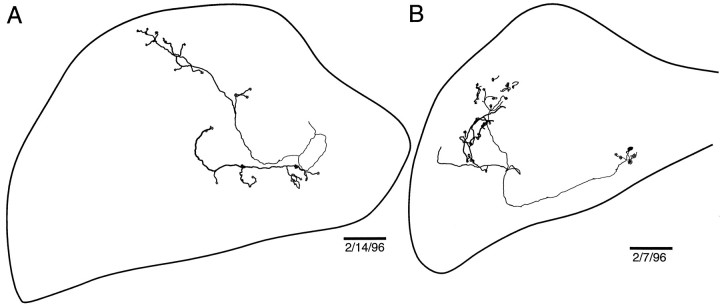
We made serial reconstructions of four NELL axons in ELa by connecting 83–206 segments of labeled axons across 12–15 serial sections. The final reconstructions of two of them are shown in Figure8. The paths described by the NELL axon are quite complex, but it is possible to follow simple ones through the nucleus. In Figure 8A, the axon enters ventrally from the lateral lemniscus and goes laterally, where it branches to make a terminal on a large cell (Fig. 8A, arrow). The main branch then heads posteriorly and dorsally to the posterior margin of the ELa, before turning laterally to the lateral edge of the ELa. Then it heads to the anterior margin of the ELa, before doubling back posteriorly and dropping ventrally to the bottom of the nucleus. Then it curves laterally, anteriorly, and dorsally and splits into four branches that go dorsally and anteriorly, laterally, posteriorly and laterally, and posteriorly and medially. Some axons are even more complex. The axon illustrated in Figure 8B winds throughout the ELa covering anterior to posterior, lateral to medial, and dorsal to ventral extents of the nucleus.
Fig. 8.
Sample reconstructed NELL terminal fields in ELa. Somata of postsynaptic cells are indicated by gray circles, and terminals onto large cells are indicated byarrows. The cross-sectional area of ELa varies greatly over the dorsal–ventral extent of ELa (Figs.12E, 13D), so the outlines chosen are taken from the sections that best encompass the entire reconstruction. The dorsal and ventral positions of axon segments along the main axon trunk are coded by the line thickness, where dorsal is thick and ventral isthin. Scale bars: 100 μm.
Because ELa large cells and small cells are adendritic, it was possible to identify terminals from these reconstructed NELL cells onto large and small cells (Fig. 8). They appear to be distributed over the entirety of the ELa, from anterior to posterior, lateral to medial, and dorsal to ventral. There are, however, long lengths of axon over which we found no terminals. The two axons reconstructed here arose from the contralateral NELL, but we did not see any qualitative difference in two ipsilaterally projecting axons.
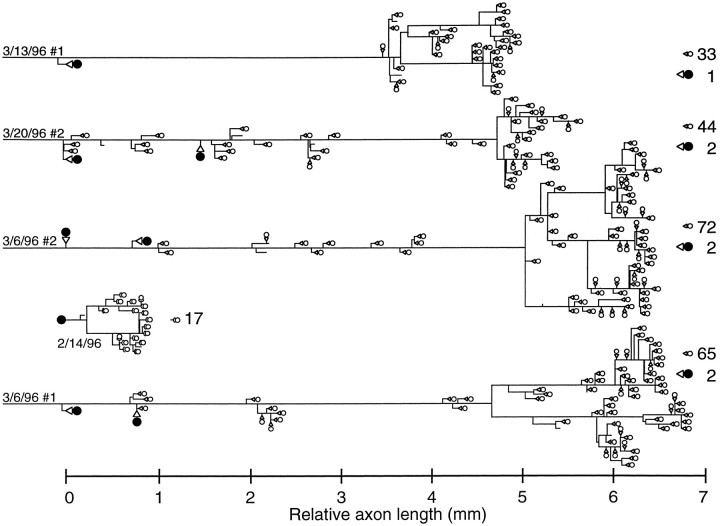
We next examined the linear branching pattern of the NELL axons. We measured the length of each traced axon segment and mapped the measurements onto a linear graph. The four NELL axons shown in Figure9 had total lengths of 5, 5.5, 6.5, and 7 mm from the position of the first terminal within the ELa. In each case, the first terminal was onto an ELa large cell, which was early in the projection of the axon through the ELa. This was followed by a second large cell terminal over the next 1 mm of axon (one cell had two additional large cell terminals). Then the axon traveled 3.5–5 mm from the last large cell terminal before branching widely and contacting a large number of small cells. The four axons in Figure 9 had 33, 44, 72, and 65 total small cell terminals. Few small cells are contacted early in the winding of the axon though the ELa. The four axons in Figure 9contacted only 0, 16, 10, and 16 small cells, respectively, before the final arborization (these counts represent 0, 36, 14, and 25% of the total number of small cell terminals). Thus, the signal traveling up the NELL axon arrives first at a few ELa large cells and then, after a long winding axon with few terminals, at a large number of ELa small cells distributed across the whole nucleus.
Fig. 9.
Linear reconstructions of four NELL axons and one large cell. All segment lengths were measured and aligned end to end. The horizontal position of any branch or terminal indicates its measured distance from the first large cell terminal or, for the ELa large cell, its distance from the soma. Vertical spacing is for clarity. Filled circles indicate terminals onto large cells, and open circles indicate terminals onto small cells. Sizes of terminals are not to scale. The numbersof terminals are listed at the right.
ELa large cell projection patterns
In B. brachyistius, the ELa large cell somata are located mainly deep in the nucleus, that is medially, ventrally, and posteriorly, where the lateral lemniscus enters the ELa. B. niger has many more large cells than B. brachyistius, and they are distributed more toward the superficial parts of the ELa. We obtained six good intracellular fills of ELa large cells. Each large cell had a round soma (8–14 μm in diameter; Fig.10A,B), as well as numerous cup-shaped terminals around small cells (Fig.10C). All of the large cells appeared to be adendritic; we saw no dye-filled processes off the soma except the axon, and all terminals that we observed on large cells were somatic. The initial segment of the large cell is thin (≤1 μm) for ∼25 μm, at which point it widens to 2–3 μm.
Fig. 10.
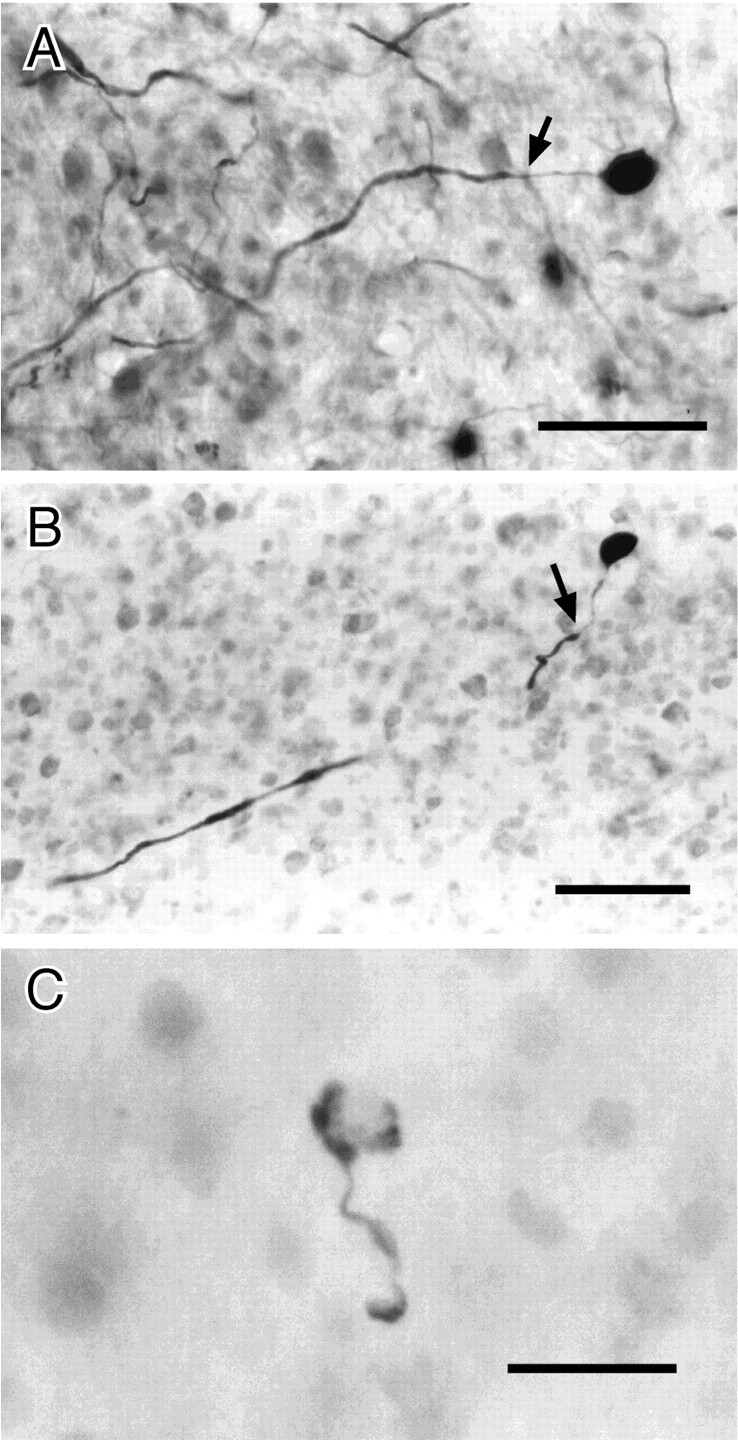
ELa large cells and terminal. A, Large cell filled by mass injection in the ELa. The adendritic soma is oval (9 × 14 μm). The axon widens to 2–3 μm ∼24 μm from the soma (arrow). B, Large cell filled by intracellular injection. The soma is round and ∼14 μm in diameter. The initial segment is ∼27 μm, before the axon thickens to ∼3 μm (arrow). (The axon briefly travels out of the plane of section.) C, Cup-shaped terminal from large cell. The target small cell is visible in neutral red stain, although such cells are frequently completely obscured by the terminal. Scale bars:A, B, 50 μm; C, 20 μm.
By comparison with the NELL axons, reconstructed ELa large cells project directly to the terminal field, with few branches (Fig.11). The terminals tend to be in restricted areas, either bands or patches in parts of the ELa up to 1 mm away. For example, the terminals of the cell in Figure11A lie close to the two main axon branches of the cell. The terminals of the cell in Figure 11C lie in a cluster ∼300 μm across, next to the lateral edge of the ELa. In one case, there was a small terminal field close to the soma onto other large cells (Fig. 11B).
Fig. 11.
Reconstructed ELa large cells. Somata of postsynaptic small cells are indicated by gray circles. The dorsal and ventral positions of axon segments along the main axon trunk are coded by the line thickness, where dorsal isthick and ventral is thin. Scale bars: 100 μm.
We quantitatively reconstructed one large cell (the cell in Fig.11A, reconstructed in Fig. 9). The total axon length was <1 mm, far less than the length of the NELL axons.
Small cell projection patterns
To trace small cell axons, we injected biotinylated dextrans into the ELa and the ELp. Dextrans are apparently taken up by axons and somata in the vicinity of the injection and then transported both anterogradely and retrogradely. The injection sites usingMr 3000 biotinylated dextrans were fairly compact, 100–150 μm in diameter.
Injections into the ELa
We performed seven successful injections into the ELa (Fig.12A). We observed labeling in ELa large cells, small cells, and cell bodies in the NELL. We also found fibers in the ELp (Fig.12B–D). The border between the ELa and the ELp is characterized by a soma-sparse central region (Fig.12B, thin part of dotted line) through which most of the fibers from the ELa enter the ELp. From there they fan out radially and proceed in almost a straight line to the most distal edge of the ELp (Fig. 12C,D). The axons show varicosities at intervals along their length, which are presumablyen passant synaptic contacts, but they do not appear to contact ELp somata directly. No other anatomical specializations suggestive of synapses were observed.
Fig. 12.
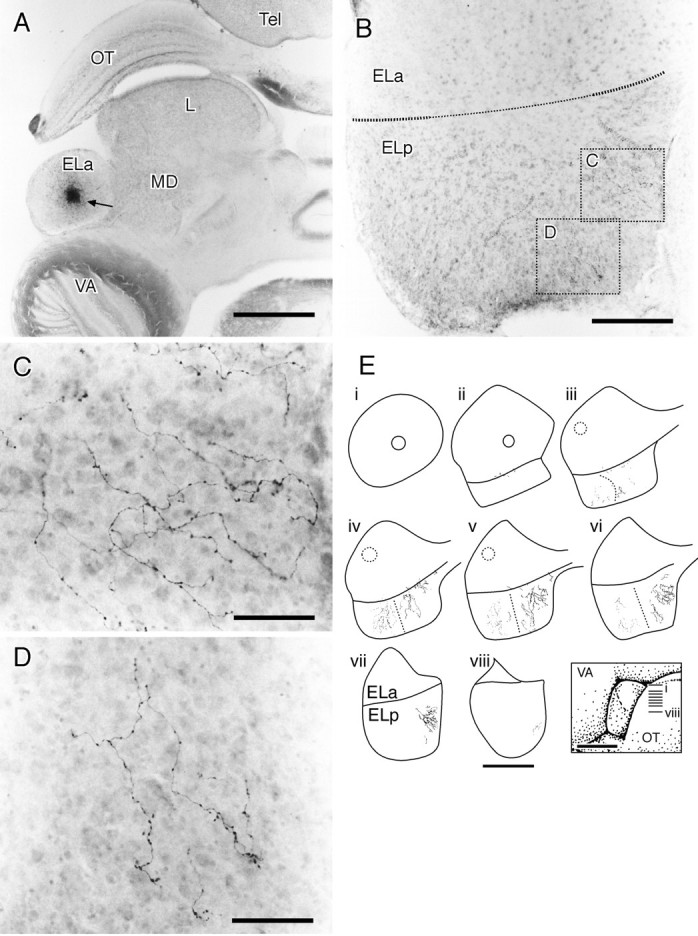
Injections of biotinylated dextrans into the ELa label small cell axons into the ELp. A, Overview of the ELa and injection site. At this dorsal level, the ELp is not visible. The injection site is ∼150 μm in diameter.B, Section ∼450 μm ventral to A. The border between the ELa and the ELp is somewhat indistinct toward the center (narrow dotted line), where the small cell axons enter the ELp. The boxed areas are magnified inC and D. C, Medial small cell fibers in the ELp. The fibers travel mostly radially toward the medial edge of the ELp. D, Posterior small cell fibers in the ELp. The fibers travel mostly radially toward the back of the ELp.E, Summary of two experiments in which biotinylated dextrans were injected into the ELa.i–viii, Horizontal sections of the ELa and the ELp over a dorsal–ventral series. The approximate positions of the sections are indicated in the inset. Figure legend continues. Circles in the ELa represent the injection sites, and fibers in the ELp are the resulting small cell projection. In the first experiment, the lateral injection (dotted circle) gave rise to lateral fibers (dotted). In the second experiment, the medial injection (solid circle) gave rise to the medial fibers (solid). L, Lateral toral nucleus; MD, medial dorsal nucleus;OT, optic tectum; Tel, telencephalon;VA, valvula. Scale bars: A, 800 μm;B, 200 μm; C, D, 50 μm;E, 500 μm for reconstructions, 1 mm for theinset.
The small cell projection from the ELa to the ELp is topographically mapped. Restricted injections in the ELa tend to project to a restricted corresponding part of the ELp. The results of two experiments from two different preparations are superimposed in Figure12E. An injection of biotinylated dextrans into the medial ELa (Fig. 12E, solid circle) anterogradely labeled axons in the medial ELp (solid fibers), whereas an injection into the lateral ELa (Fig. 12E, dotted circle) labeled axons in the lateral ELa (dotted fibers).
Injections into the ELp
We verified the results of the injections into the ELa using retrograde transport from focal injections in the ELp. We performed seven successful injections, retrogradely labeling exclusively small cell somata in the ELa (Fig.13A). After one injection we counted several hundred small cell somata. The small cell somata appear adendritic and round (5–7 μm in diameter; Fig. 13B). The small cell axons are thin and are directed toward the center of the border between the ELa and the ELp. The axons appear smooth within the boundaries of the ELa but display varicosities once they cross the border into the ELp.
Fig. 13.
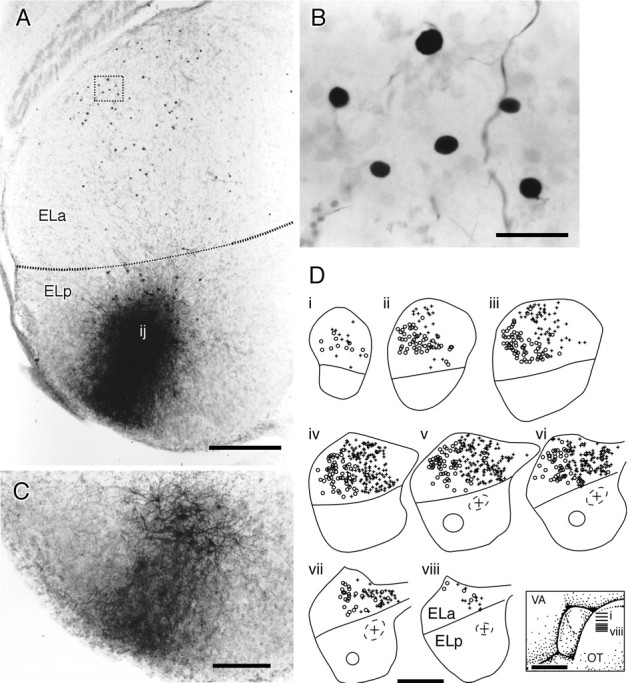
Injections of biotinylated dextrans into the ELp label small cell bodies in the ELa. A, Injection site in the ELp. The injection site (ij) is fairly anterior. Small cell bodies are labeled in the ELa, visible as dark spots. B, Close-up of the boxed area in A showing six small cell somata.C, Section of the ELp 100 μm dorsal to the injection site in A. Fibers projecting radially to the edge of the ELp are more easily visible here. D, Summary of two experiments injecting biotinylated dextrans into the ELp.i–viii, Horizontal sections of the ELa and the ELp over a dorsal–ventral series. The approximate positions of the sections are indicated in the inset.Circles in the ELp represent the injection sites, andsymbols in the ELa are the positions of retrogradely labeled small cell somata. In the first experiment, the lateral injection (solid circle) retrogradely labels lateral small cell somata (○). In the second experiment, the medial injection (dashed circle with + in the center) retrogradely labeled medial small cell somata (+). Scale bars: A, 200 μm; B, 20 μm; C, 100 μm;D, 500 μm for reconstructions, 1 mm for theinset.
Focal injections of dye into the ELp highlight the organization of small cell axons running in parallel from the center of the boundary between the ELa and the ELp to the distal margins of the ELp. The injection in Figure 13A was made in the anterior, lateral half of the ELp, but fibers are filled out to the lateral–posterior margin of the nucleus, seen more easily 100 μm dorsal to the injection site (Fig. 13C). From this we see that small cell axons travel through the injection site, pick up the dextran, and transport it both retrogradely back to the small cell soma in the ELa and anterogradely on to the furthest extent of the axonal arborization at the edge of the ELp. All injections in the ELp show a similar effect.
The topographic mapping of the ELa onto the ELp is illustrated in Figure 13D. An injection of biotinylated dextrans in the medial ELp (circle with +) retrogradely labeled small cell somata in the medial ELa (+), whereas an injection into the lateral ELp (open circle) labeled small cell somata in the lateral ELp (Fig. 13D, circles).
Putative small cell responses
Although we were unable to obtain anatomical confirmation with intracellular labeling, we present here data from five putative small cell recordings. In each case, the electrode tip was within the ELa, but the activity pattern differed from the NELL axons and ELa large cells already described.
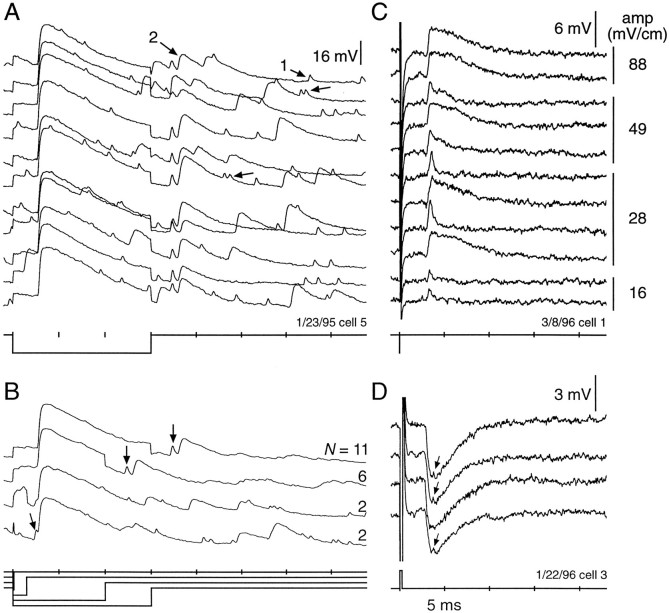
For the presumed small cell presented in Figure14A, we observed brief spontaneous potentials and long spontaneous potentials. The brief potentials were 0.33 ± 0.04 msec long (measured at half-height;n = 10). Some brief potentials were separated by as little as 0.4 msec (e.g., Fig. 14A,arrows). Spontaneous long potentials were 2.45 ± 0.31 msec long (measured at half-height; n = 8).
Fig. 14.
Recordings in ELa that may be small cells. Recordings in A and B are from one cell and in C and D are from two more.A, Eleven sample traces in response to a 15 msec reverse polarity square pulse (bottom trace). The unit had high spontaneous activity in addition to potentials phase-locked to the downward and upward edges of the stimulus. The unit showed two types of activity, a brief potential (1) and a long potential (2). Pairs of brief potentials may be separated by less than the spike refractory period (arrows). B, Averaged traces of activity revealing differing time dependence of phase-locked potentials. The downward edge of all stimuli is followed by a large, long potential (latency, 2.75 msec). The upward edge is followed first by a brief potential (latency, 2.15 msec) and then by a long potential (visible in the top two traces). For shorter-duration stimuli, the responses to the upward edge are obscured (third trace), but the brief potential emerges before the response to the downward edge at the shortest duration stimulus (bottom trace, arrow). C, Sample traces showing the effect of amplitude on brief and long potentials in a different cell fromA and B. D, Sample traces from another cell showing hyperpolarizing long potentials. This cell was held for 7 sec. The stimulus was 0.25 msec. The arrows indicate what may be a brief potential.
In addition to the spontaneous potentials, Figure 14Ashows brief and long potentials that were phase-locked to the stimulus, as can be seen better after averaging (Fig. 14B). There was a large, long potential phase-locked to the leading, downward edge of the stimulus (that is, originating from the contralateral NELL; Fig. 14B). The large, long potential had a latency of 2.75 msec, fast rise time (0.25 msec, 20–80%), and a half-height duration of ∼5 msec. There was also a brief potential phase-locked to the trailing, upward edge of the stimulus (that is, originating from the ipsilateral NELL), which was paired with a small, long potential (Fig. 14B, top two traces, arrows). The brief potential had a half-height duration of 0.4 msec and a latency of 2.15 msec. For very short stimuli, the brief potential appeared before the large, long potential (Fig. 14B, bottom trace, arrow). Thus the two stimulus edges are inducing different potentials to this unit at different latencies. No spikes were seen in this recording.
A second unit shown in Figure 14C also had brief and long potentials triggered by electrosensory stimuli, but the thresholds for these potentials differed, again indicating at least two different inputs to the unit. For high-amplitude stimuli (Fig. 14C,top group of traces), only a long potential was visible. As the stimulus amplitude decreased, the long potential occasionally failed (Fig. 14C, second andthird groups of traces), but the brief potential persisted. At very low stimulus amplitudes, the brief potential also became smaller (Fig. 14C, bottom group oftraces). This suggests that there are multiple inputs to this cell, with different kinetics and different amplitude sensitivities. Temporal sensitivity could not be adequately tested in this cell.
We interpret these recordings as follows: the brief potentials are fast, excitatory inputs through electrotonic synapses from NELL axons; and the long potentials are IPSPs from the large cells, which have become inverted as an artifact of the recording condition. We expect that the brief potentials are synaptic inputs, not distant spikes, because the delays between them can be shorter than a typical action potential refractory period. The brief duration is consistent with electrotonic input from NELL cells, which are the only cell type in ELa known to make electrotonic synapses (Mugnaini and Maler, 1987a).
Although the synapses from large cells onto small cells contain GABA (Mugnaini and Maler, 1987a), three units had long potentials that were depolarizing (two shown in Fig. 14). Recordings from two more units had long potentials that were hyperpolarizing (Fig. 14D), neither of which appeared to cause any rebound excitation. We suspect that the synaptic potential flipped from hyperpolarizing to depolarizing because the cell was damaged, or chloride was leaking out of the electrode (also see Bell and Grant, 1989). In fact, in the unit illustrated in Figure 14C, the long potential was hyperpolarizing for the first few seconds of recording, before the responses could be stored to disk.
DISCUSSION
We have shown detailed anatomical reconstructions of two major cell types in the analysis of temporal information in the mormyrid electric communication pathway. The axons from the NELL terminate on one or two ELa large cells first and then travel extensively throughout the nucleus, before ending in a large number of terminals onto ELa small cells. The projection pattern of ELa large cells onto the small cells is comparatively direct. We suggest that the long winding of the NELL axon constitutes a delay line. The conduction velocity from the NELL to the ELa up the lateral lemniscus has been estimated at 15 m/sec (Enger et al., 1976). If this speed were maintained in the ELa, then axon lengths of 3.5–7 mm between large cell terminals and small cell terminals would correspond to delays of 230–460 μsec. This is almost certainly an underestimate, because of the method used to measure the total axon length and because the axon diameter in the ELa is frequently thinner than in the lateral lemniscus, particularly in the axon branches to small cells.
Assuming that spike generation in the ELa large cell is rapid through the electrotonic junctions, and that they have the same conduction velocity as the NELL axons, the time delay to their terminals (1 mm) would be ∼60 μsec. We estimate that the synaptic delay from the large cell to the small cell is 300 μsec. Therefore, the difference in arrival times at the small cell between NELL axon and ELa large cell inputs could range from −130 to +100 μsec. For the cell we identified as possibly a small cell (Fig.14A,B), the difference in latencies between brief (NELL?) and long (large cell?) potentials was 600 μsec, which is close to our estimated latency difference. The EOD duration for B. niger is ∼250 μsec (Fig.1B), which suggests that the NELL axon delay line is in the behaviorally relevant range for computing the duration of EOD stimuli.
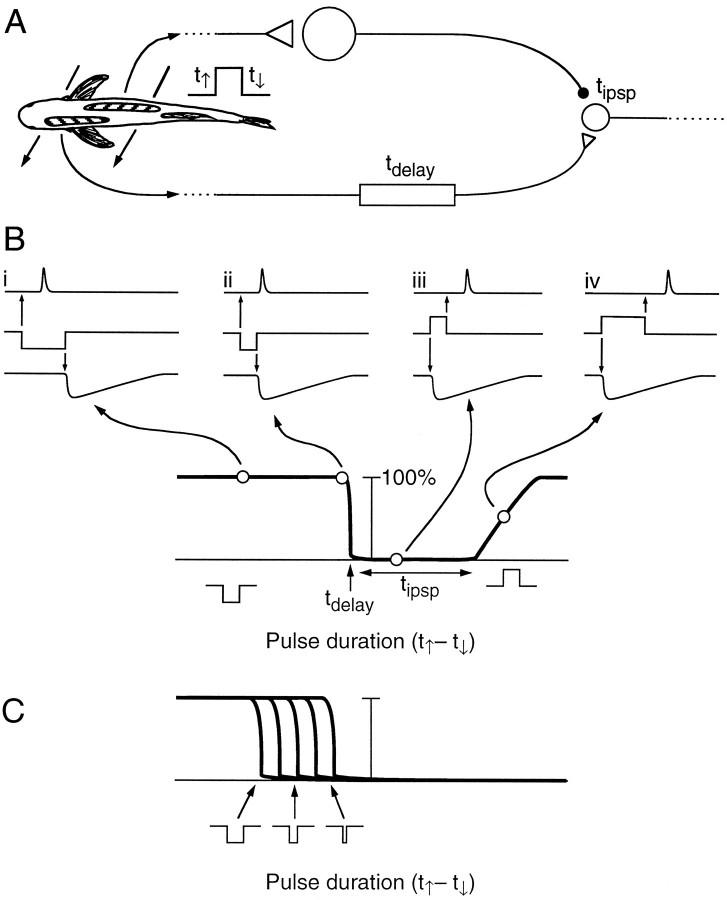
These data support the hypothesis that the small cells act as anti-co-incidence detectors, such that direct excitatory input from the NELL triggers a small cell to fire, unless it is blocked by inhibitory input from the large cell (Fig.15A). With the inhibitory input originating from a different receptive field (such as from the opposite side of the body), the small cell response would be blocked over a particular range of square pulse (and EOD) durations, which would depend solely on the length of the NELL axonal delay and the duration of the large cell IPSP (Fig. 15B). Clearly, conduction delays from more distant parts of the body (which may be as great as 1 msec; Bell and Grant, 1989), and between ipsilateral and contralateral NELLs would affect the range of potentially measurable pulse durations. However, the sharpness of the field potential in the ELa (Szabo et al., 1979) suggests that they are at least partially compensated. We saw preliminary evidence that the excitatory and inhibitory inputs can arrive from separate receptive fields (Fig. 14). Because there is a range of different length delay lines (Fig. 9), different small cells may be sensitive to different delays (Fig.15C). Each NELL axon and ELa large cell distributes its activity throughout the nucleus, as if the population of ELa small cells were comparing knollenorgan activity over the entire body surface.
Fig. 15.
Model of small cell response. A, Example of inputs to the small cell. The leading edge of the stimulus triggers activity in a patch of knollenorgans on the right side of the body, which is relayed through an NELL cell and then an ELa large cell, finally terminating on an ELa small cell with an IPSP of durationtipsp. The trailing edge of the stimulus triggers activity in a patch of knollenorgans on the left side of the body, which is relayed through an NELL cell, finally terminating on the small cell with an EPSP after a relative delay (tdelay). (These patches of knollenorgans are also presumably compared by a second small cell in which the right side passes through the delay line, and the left side passes through the large cell.) B, Hypothesized response probability of the small cell in A for different duration stimuli. Reverse polarity stimuli are treated as negative duration, because the downward edge precedes the upward edge. Four points on the response probability graph are illustrated intraces i–iv. The upward edge of the stimulus (middle traces, i–iv) leads to an IPSP of durationtipsp (bottom traces), and the downward edge leads to an EPSP at a relative delay oftdelay (top traces). The small cell fires for long-duration, reverse polarity stimuli (i) but not when the pulse duration is short enough for the IPSP to overwhelm the EPSP (ii). Responses are blanked for short-duration, normal polarity stimuli (iii), but if the duration of the normal polarity stimulus is sufficiently long, the EPSP will occur after the IPSP ends (iv). The cutoff point depends ontdelay, and the range of blanked durations depends on tipsp.C, Duration sensitivity of a family of ELa small cells with different NELL delay lines. Short-duration stimuli will cause few small cells to fire. As duration increases, more small cells are recruited.
Thus, we propose that pulse duration is represented by the number of ELa small cells that are activated. Because this representation relies only on the presence of activity in a subset of cells, the preservation of precise spike times is no longer necessary. The projection of the ELa small cells into the ELp maintains their topographic organization, and the ELp neurons have large dendritic arbors oriented perpendicular to the incoming axons (M. A. Friedman and C. D. Hopkins, unpublished observations), so ELp cells may be well suited to integrate the activity of many small cells.
However, a simple count of the number of active cells does not give an unequivocal estimate of the pulse duration. If the pulse amplitude were increased, the number of activated knollenorgans and NELL axons would increase, which would recruit more ELa small cells. To avoid this ambiguity between amplitude and duration, it would also be necessary to take into account the pattern of activated cells in the ELa. This pattern is likely to be complex, because the course of the NELL axon and its widespread terminal fields suggest that duration sensitivity is not mapped simply across the ELa.
Spatial analysis of knollenorgan information
One critical function of the knollenorgan system not discussed so far is passive electrolocation of conspecific EODs. Behavioral tests have indicated that B. brachyistius aligns its body along current lines to swim toward a dipole source (Schluger and Hopkins, 1987), and the knollenorgans are the most likely electroreceptors subserving that function. In a wide range of taxa, the optic tectum contains spatial maps of different sensory modalities (e.g., Knudsen, 1982; Bartels et al., 1990; Bodznick, 1991; Stein and Meredith, 1993) and may be involved in orientation (Knudsen et al., 1987). Knollenorgan input to the optic tectum comes from the MV (Wulliman and Northcutt, 1990).
As we have shown (Fig. 6), the NELL projection to the MV is quite different from the ELa. The NELL axons in the MV are thinner, the terminals are smaller, and they do not appear to end on MV somata. These anatomical features suggest that precise temporal information is lost in the MV. One possibility therefore is that the MV may play a role in analysis, not of temporal features of the EOD waveform, but rather of spatial features of the pattern of excitation on different parts of the body surface, which could be a cue for orientation. Because the MV also receives input from the ELp (Haugedé-Carré, 1979) (Friedman and Hopkins, unpublished observations), the MV may also play a role in analysis of EOD waveform or interpulse interval.
Comparative considerations
Mormyrid EOD durations range from 60 μsec inPollimyrus adspersus (Crawford, 1992) to 20 msec inCampylomormyrus numenius (Lovell et al., 1997). Although knollenorgans are broadly tuned to the fish’s own EOD (Bass and Hopkins, 1980, 1984; Hopkins, 1983), they respond to the EODs of other species (Hopkins, 1986). Our results imply that NELL cells and ELa large cells also respond generally. The only target of the ELa small cells is the ELp, in which Amagai (1998) found a class of units that are bandpass-tuned to square pulses, with the range of best durations from 0.1 to 10 msec. Thus it appears that the ELp, and probably the population of ELa small cells, is generalized to respond to EODs from a number of species, rather than being specialized to respond solely to the EODs of its own species. For the longest duration square pulses and EODs, the NELL axon probably could not serve as a long enough delay line, even with slower axon conduction velocity and slower channel kinetics. Long-duration species may be forced to use another time delay mechanism, such as inhibitory rebound, as has been proposed for bat echo ranging (Park and Pollak, 1993; Saitoh and Suga, 1995).
There is interspecific variation in the neuroanatomy of the knollenorgan pathway, even in the two species studied here. B. niger has approximately three times as many NELL somata asB. brachyistius, and it also has many more ELa large cells (data not shown). In addition, the two species differ in calcium-binding protein expression; in B. niger, the ELa large cells contain high levels of calretinin, but in B. brachyistius, they do not (Friedman and Kawasaki, 1997). These differences are unexpected, because the EODs of the two species are of approximately similar duration and peak power content. These differences may reflect some greater dependence on precise temporal information in B. niger, such as for individual recognition. Greater attention to behavioral and neuroanatomical differences between mormyrid species will be necessary.
Comparison with other time-coding systems
We note that the organization of the NELL axon input to the ELa contrasts sharply with the tidy organization of the auditory time-coding systems of the barn owl and the chick. In these, the nucleus magnocellularis makes a clear delay line projection across the nucleus laminaris, with ipsilateral and contralateral inputs taking different routes (Young and Rubel, 1983; Carr, 1986; Carr and Konishi, 1990), strongly reminiscent of the model of Jeffress (1948) for converting temporal information into a place code. The laminaris neurons act as co-incidence detectors to determine interaural time differences (Carr and Konishi, 1990; Overholt et al., 1992; Joseph and Hyson, 1993), by a mechanism apparently involving a rapidly activating, outward rectifier suppressing responses to sustained, rather than transient, synaptic input (Reyes et al., 1996).
In the phase-coding electrosensory pathway of Eigenmannia, a South American gymnotiform fish, the projection is not as organized as in the barn owl and appears superficially more similar to the knollenorgan system. Spherical cells in the ELL receive input from T-unit electroreceptors, which encode temporal characteristics of electrosensory stimuli by precise spike times. The projection of the spherical cell to giant cells and small cells in layer VI of the torus semicircularis is spatially restricted (Carr et al., 1986b), just as the ELa large cell projection is restricted. The layer VI giant cell projects widely (Carr et al., 1986a,b), just as the NELL axon projects widely. The layer VI small cells are sensitive to timing differences between direct spherical cell inputs and indirect giant cell inputs (Heiligenberg and Rose, 1985). The delay line is proposed to be the small cell dendrite, and one possible mechanism of co-incidence detection is proposed to be attributable to channel inactivation (Lytton, 1991).
Both the barn owl and Eigenmannia compare two excitatory inputs, whereas the mormyrid knollenorgan system compares an excitatory input with an inhibitory input (Fig. 15). This represents a novel solution to the problem of co-incidence detection.
Footnotes
This work was supported by National Institutes of Mental Health (NIMH) Grant MH37972 to C.D.H., Training Grant MH15793 from NIMH, and GM07469 from National Institutes of Health to M.A.F. We thank Satoshi Amagai and Garry Harned for help with the experiments, Phil Stoddard and Calvin Wong for help with histological procedures, and Margie Nelson for the drawing of the mormyrid brain. We thank Ron Harris-Warrick, Walter Metzner, Masashi Kawasaki, and an anonymous reviewer for comments on this manuscript.
Correspondence should be addressed to Matthew Friedman, Department of Neurobiology, Harvard Medical School, 220 Longwood Avenue, Boston, MA 02115.
REFERENCES
- 1.Amagai S (1998) Time-coding in the midbrain of mormyrid electric fish II: stimulus selectivity in the nucleus exterolateralis pars posterior (ELp). J Comp Physiol [A], in press. [DOI] [PubMed]
- 2.Amagai S, Hopkins CD, Harned GD. Neural activity in the nucleus exterolateralis anterior (ELa) of mormyrid electric fish. Soc Neurosci Abstr. 1988;14:204. [Google Scholar]
- 3.Amagai S, Friedman MA, Hopkins CD. Anatomy and physiology of cells in the time-coding pathway of mormyrid electric fish I: nucleus exterolateralis pars anterior. J Comp Physiol [A] 1993;173:747. doi: 10.1007/s003590050163. [DOI] [PubMed] [Google Scholar]
- 4.Amagai S, Friedman MA, Hopkins CD (1998) Time-coding in the midbrain of mormyrid electric fish I: physiology and anatomy of cells in the nucleus exterolateralis pars anterior (ELa). J Comp Physiol [A], in press. [DOI] [PubMed]
- 5.Bartels M, Münz H, Claas B. Representation of lateral line and electrosensory systems in the midbrain of the axolotl, Ambystoma mexicanum. J Comp Physiol [A] 1990;167:347–356. [Google Scholar]
- 6.Bass AH, Hopkins CD. Coding of species-specific signals in mormyrid electric fish. I. Frequency characteristics. Soc Neurosci Abstr. 1980;6:604. [Google Scholar]
- 7.Bass AH, Hopkins CD. Shifts in frequency tuning of electroreceptors in androgen-treated mormyrid fish. J Comp Physiol [A] 1984;155:713–724. [Google Scholar]
- 8.Bell CC, Grant K. Corollary discharge inhibition and preservation of temporal information in a sensory nucleus of mormyrid electric fish. J Neurosci. 1989;9:1029–1044. doi: 10.1523/JNEUROSCI.09-03-01029.1989. [DOI] [PMC free article] [PubMed] [Google Scholar]
- 9.Bell CC, Russell CJ. Termination of electroreceptor and mechanical lateral line afferents in the mormyrid acousticolateral area. J Comp Neurol. 1978;182:367–382. doi: 10.1002/cne.901820302. [DOI] [PubMed] [Google Scholar]
- 10.Bell CC, Szabo T. Electroreception in mormyrid fish: central anatomy. In: Bullock TH, Heiligenberg W, editors. Electroreception. Wiley; New York: 1986. pp. 375–421. [Google Scholar]
- 11.Bennett MVL. Electroreceptors in mormyrids. Cold Spring Harb Symp Quant Biol. 1965;30:245–262. doi: 10.1101/sqb.1965.030.01.027. [DOI] [PubMed] [Google Scholar]
- 12.Bodznick D. Elasmobranch vision: multimodal integration in the brain. J Exp Zool [Suppl] 1991;5:108–116. doi: 10.1002/jez.1402560515. [DOI] [PubMed] [Google Scholar]
- 13.Carr CE. Time coding in electric fish and barn owls. Brain Behav Evol. 1986;28:122–133. doi: 10.1159/000118697. [DOI] [PubMed] [Google Scholar]
- 14.Carr CE. Processing of temporal information in the brain. Annu Rev Neurosci. 1993;16:223–243. doi: 10.1146/annurev.ne.16.030193.001255. [DOI] [PubMed] [Google Scholar]
- 15.Carr CE, Konishi M. A circuit for detection of interaural time differences in the brain stem of the barn owl. J Neurosci. 1990;10:3227–3246. doi: 10.1523/JNEUROSCI.10-10-03227.1990. [DOI] [PMC free article] [PubMed] [Google Scholar]
- 16.Carr CE, Heiligenberg W, Rose GJ. A time-comparison circuit in the electric fish midbrain. I. Behavior and physiology. J Neurosci. 1986a;6:107–119. doi: 10.1523/JNEUROSCI.06-01-00107.1986. [DOI] [PMC free article] [PubMed] [Google Scholar]
- 17.Carr CE, Maler L, Taylor B. A time-comparison circuit in the electric fish midbrain. II. Functional morphology. J Neurosci. 1986b;6:1372–1383. doi: 10.1523/JNEUROSCI.06-05-01372.1986. [DOI] [PMC free article] [PubMed] [Google Scholar]
- 18.Crawford JD. Individual and sex specificity in the electric organ discharges of breeding mormyrid fish (Pollimyrus isidori). J Exp Biol. 1992;164:79–102. doi: 10.1242/jeb.164.1.79. [DOI] [PubMed] [Google Scholar]
- 19.Enger PS, Libouban S, Szabo T. Fast conducting electrosensory pathway in the mormyrid fish, Gnathonemus petersii. Neurosci Lett. 1976;2:133–136. doi: 10.1016/0304-3940(76)90004-5. [DOI] [PubMed] [Google Scholar]
- 20.Friedman MA, Hopkins CD. Tracking mormyrid electric fish in the field using individual differences in electric organ discharges. Anim Behav. 1996;51:391–407. [Google Scholar]
- 21.Friedman MA, Kawasaki M. Calretinin-like immunoreactivity in mormyrid and gymnarchid electrosensory and electromotor systems. J Comp Neurol. 1997;387:341–357. [PubMed] [Google Scholar]
- 22.Gill T. On the West African genus Hemichromis and description of new species in the museums of the Academy and Smithsonian Institutions. Proc Acad Natl Sci Phila. 1862;14:134–139. [Google Scholar]
- 23.Graff C, Kramer B. Trained weakly-electric fishes Pollimyrus isidori and Gnathonemus petersii (Mormyridae, Teleostei) discriminate between waveforms of electric pulse discharges. Ethology. 1992;90:279–292. [Google Scholar]
- 24.Günther ACLG. Catalogue of the fishes in the British Museum, Vol 6. AJ Reprints Agency; New Delhi: 1866. [Google Scholar]
- 25.Harder W. Die Beziehungen zwischen Elektrorezeptoren, Elektrischem Organ, Seitenlinienorganen und Nervensystem bei den Mormyridae. Z Vergl Physiol. 1968;59:272–318. [Google Scholar]
- 26.Haugedé-Carré F. The mesencephalic exterolateral posterior nucleus of the mormyrid fish Brienomyrus niger: efferent connections studied by the HRP method. Brain Res. 1979;178:179–184. doi: 10.1016/0006-8993(79)90097-0. [DOI] [PubMed] [Google Scholar]
- 27.Heiligenberg W, Rose G. Phase and amplitude computations in the midbrain of an electric fish: intracellular studies of neurons participating in the jamming avoidance response of Eigenmannia. J Neurosci. 1985;5:515–531. doi: 10.1523/JNEUROSCI.05-02-00515.1985. [DOI] [PMC free article] [PubMed] [Google Scholar]
- 28.Hopkins CD. Functions and mechanisms in electroreception. In: Northcutt RG, Davis RE, editors. Fish neurobiology. University of Michigan; Ann Arbor, MI: 1981a. pp. 215–259. [Google Scholar]
- 29.Hopkins CD. The neuroethology of electric communication. Trends Neurosci. 1981b;4:4–6. doi: 10.1146/annurev.ne.11.030188.002433. [DOI] [PubMed] [Google Scholar]
- 30.Hopkins CD. On the diversity of electric signals in a community of mormyrid electric fish in West Africa. Am Zool. 1981c;21:211–222. [Google Scholar]
- 31.Hopkins CD. Neuroethology of species recognition in electroreception. In: Ewert J-P, Capranica RR, Ingle DJ, editors. Advances in vertebrate neuroethology. Plenum; New York: 1983. pp. 871–881. [Google Scholar]
- 32.Hopkins CD. Behavior of Mormyridae. In: Bullock TH, Heiligenberg W, editors. Electroreception. Wiley; New York: 1986. pp. 527–576. [Google Scholar]
- 33.Hopkins CD, Bass AH. Temporal coding of species recognition signals in an electric fish. Science. 1981;212:85–87. doi: 10.1126/science.7209524. [DOI] [PubMed] [Google Scholar]
- 34.Hopkins CD, Harned GD, Schmid U. Anatomical projections of the time coding pathway of the mormyrid electric fish studied using fluorescent-labelled dextrans. Soc Neurosci Abstr. 1993;19:376. [Google Scholar]
- 35.Horikawa K, Armstrong WE. A versatile means of intracellular labelling: Injection of biocytin and its detection with avidin conjugates. J Neurosci Methods. 1988;25:1–12. doi: 10.1016/0165-0270(88)90114-8. [DOI] [PubMed] [Google Scholar]
- 36.Jeffress LA. A place theory of sound localization. J Comp Physiol [A] 1948;41:35–39. doi: 10.1037/h0061495. [DOI] [PubMed] [Google Scholar]
- 37.Joseph AW, Hyson RL. Coincidence detection by binaural neurons in the chick brain stem. J Neurophysiol. 1993;69:1197–1211. doi: 10.1152/jn.1993.69.4.1197. [DOI] [PubMed] [Google Scholar]
- 38.Knudsen EI. Auditory and visual maps of space in the optic tectum of the owl. J Neurosci. 1982;2:1177–1194. doi: 10.1523/JNEUROSCI.02-09-01177.1982. [DOI] [PMC free article] [PubMed] [Google Scholar]
- 39.Knudsen EI, du Lac S, Esterly SD. Computational maps in the brain. Annu Rev Neurosci. 1987;10:41–65. doi: 10.1146/annurev.ne.10.030187.000353. [DOI] [PubMed] [Google Scholar]
- 40.Kramer B. Electrocommunication in teleost fishes. Springer; New York: 1990. [Google Scholar]
- 41.Lovell PV, Hopkins CD, Harned GD. The diversity of electric organ discharges found in eight species of Campylomormyrus electric fish (Mormyridae). Soc Neurosci Abstr. 1997;23:249. [Google Scholar]
- 42.Lytton WW. Simulations of a phase comparing neuron of the electric fish Eigenmannia. J Comp Physiol [A] 1991;169:117–125. doi: 10.1007/BF00198178. [DOI] [PubMed] [Google Scholar]
- 43.Moller P. Electric fishes: history and behavior. Chapman & Hall; New York: 1995. [Google Scholar]
- 44.Moller P, Szabo T. Lesions in the nucleus mesencephali exterolateralis: effects on electrocommunication in the mormyrid fish Gnathonemus petersii (Mormyriformes). J Comp Physiol [A] 1981;144:327–333. [Google Scholar]
- 45.Mugnaini E, Maler L. Cytology and immunocytochemistry of the nucleus exterolateralis anterior of the mormyrid brain: possible role of GABAergic synapses in temporal analysis. Anat Embryol. 1987a;176:313–336. doi: 10.1007/BF00310187. [DOI] [PubMed] [Google Scholar]
- 46.Mugnaini E, Maler L. Cytology and immunocytochemistry of the nucleus of the lateral line lobe in the electric fish Gnathonemus petersii (Mormyridae): evidence suggesting that GABAergic synapses mediate an inhibitory corollary discharge. Synapse. 1987b;1:32–56. doi: 10.1002/syn.890010107. [DOI] [PubMed] [Google Scholar]
- 47.Overholt EM, Rubel EW, Hyson RL. A circuit for coding interaural time differences in the chick brainstem. J Neurosci. 1992;12:1698–1708. doi: 10.1523/JNEUROSCI.12-05-01698.1992. [DOI] [PMC free article] [PubMed] [Google Scholar]
- 48.Park TJ, Pollak GD. GABA shapes a topographic organization of response latency in the mustache bat’s inferior colliculus. J Neurosci. 1993;13:5172–5187. doi: 10.1523/JNEUROSCI.13-12-05172.1993. [DOI] [PMC free article] [PubMed] [Google Scholar]
- 49.Reyes AD, Rubel EW, Spain WJ. In vitro analysis of optimal stimuli for phase-locking and time-delayed modulation of firing in avian nucleus laminaris neurons. J Neurosci. 1996;16:993–1007. doi: 10.1523/JNEUROSCI.16-03-00993.1996. [DOI] [PMC free article] [PubMed] [Google Scholar]
- 50.Rose GJ, Fortune ES. New techniques for making whole-cell recordings from CNS neurons in vivo. Neurosci Res. 1996;26:89–94. doi: 10.1016/0168-0102(96)01074-7. [DOI] [PubMed] [Google Scholar]
- 51.Saitoh I, Suga N. Long delay lines for ranging are created by inhibition in the inferior colliculus of the mustached bat. J Neurophysiol. 1995;74:1–11. doi: 10.1152/jn.1995.74.1.1. [DOI] [PubMed] [Google Scholar]
- 52.Schluger JH, Hopkins CD. Electric fish approach stationary signal sources by following electric current lines. J Exp Biol. 1987;130:359–367. doi: 10.1242/jeb.130.1.359. [DOI] [PubMed] [Google Scholar]
- 53.Stein BE, Meredith MA. The merging of the senses. MIT; Cambridge, MA: 1993. [Google Scholar]
- 54.Szabo T, Enger PS, Libouban S. Electrosensory systems in the mormyrid fish, Gnathonemus petersii: special emphasis on the fast conducting pathway. J Physiol (Paris) 1979;75:409–420. [PubMed] [Google Scholar]
- 55.Szabo T, Ravaille M, Libouban S, Enger PS. The mormyrid rhombencephalon: I. Light and EM investigations on the structure and connections of the lateral line lobe nucleus with HRP labelling. Brain Res. 1983;266:1–19. doi: 10.1016/0006-8993(83)91304-5. [DOI] [PubMed] [Google Scholar]
- 56.Wulliman MF, Northcutt RG. Visual and electrosensory circuits of the diencephalon in mormyrids: An evolutionary perspective. J Comp Neurol. 1990;297:537–552. doi: 10.1002/cne.902970407. [DOI] [PubMed] [Google Scholar]
- 57.Yager DD, Hopkins CD. Directional characteristics of tuberous electroreceptors in the weakly electric fish, Hypopomus (Gymnotiformes). J Comp Physiol [A] 1993;143:401–414. doi: 10.1007/BF00193513. [DOI] [PubMed] [Google Scholar]
- 58.Young SR, Rubel EW. Frequency-specific projections of individual neurons in chick brainstem auditory nuclei. J Neurosci. 1983;3:1373–1378. doi: 10.1523/JNEUROSCI.03-07-01373.1983. [DOI] [PMC free article] [PubMed] [Google Scholar]


