Abstract
Low-frequency cells in the anteroventral cochlear nucleus (AVCN) can be sensitive to changes in the spatiotemporal pattern of discharges across their auditory nerve (AN) inputs (Carney, 1990). This sensitivity suggests that these cells may be tuned to particular spatiotemporal patterns, or features, in the discharge patterns of populations of AN fibers. To evaluate and characterize this sensitivity, we developed a technique whereby the physiological responses of AVCN cells to wide-band noise were analyzed using the simulated response of a population of AN fibers to the same noise stimulus. By averaging the simulated two-dimensional spatiotemporal pattern of AN activity that preceded each AVCN discharge, it was possible to derive a two-dimensional reverse-correlation function that characterized the spatiotemporal tuning of each AVCN cell. The derived spatiotemporal tuning pattern represented a feature in the AN population response that was most likely to precede discharges of the AVCN cell. To test the spatiotemporal tuning characterizations, we used these patterns to predict the responses of cells to noise stimuli statistically independent from the stimuli used to characterize the cells. This technique provides a general tool for the study of any neural system that involves the analysis of spatiotemporal input patterns.
Keywords: spatiotemporal tuning, feature detection, neural encoding, auditory, brainstem, sensory systems
Peripheral sensory systems provide complex spatiotemporal patterns of activity, containing all of the information pertaining to the environment of an organism, to the CNS. In the auditory system, the frequency content of acoustic stimuli is represented on one of the spatial dimensions of these patterns, because of the tonotopic frequency map that is established in the inner ear and that persists throughout the CNS. It is also known that the timing of the responses of auditory neurons, especially at low frequencies, is closely related to the temporal aspects of acoustic stimuli, because auditory nerve (AN) fibers that respond to low-frequency sounds have discharges that are well phase-locked to the stimulus waveform (Kiang et al., 1965; Rose et al., 1967).
The anteroventral cochlear nucleus (AVCN), which is a site of termination for one branch of each AN fiber, provides a unique opportunity to investigate the processing of spatiotemporal information. AN fibers project into the brainstem and terminate in different patterns on various cell types. Known cell types in the AVCN have different morphologies and membrane characteristics (Oertel, 1983;Manis and Marx, 1991) and receive convergent excitatory inputs from AN fibers, which vary in terms of the numbers, sizes, and locations of AN terminals (Ramon y Cajal, 1909; Osen, 1969, 1970; Lorente de No, 1981;Liberman, 1991). In addition, the response patterns of AN fibers tuned to low frequencies are rather well understood, allowing detailed simulation of the spatiotemporal pattern that is present across the population of AN fibers (Carney, 1993).
Furthermore, there is evidence that cells in the AVCN are sensitive to changes in the spatiotemporal patterns of their inputs. A previous study revealed that some cell types in the AVCN are sensitive to manipulation of the phase spectrum of complex sounds (Carney, 1990). The spatiotemporal manipulations were designed to change the relative timing of discharges of AN fibers tuned to slightly different frequencies. That result was consistent with the hypothesis that AVCN cells receive convergent input from AN fibers tuned to different frequencies and perform a coincidence detection (equivalently a cross-correlation) across their AN inputs. That result also leads to the question addressed here; if AVCN neurons are sensitive to changes in spatiotemporal discharge patterns, can we determine the spatiotemporal pattern to which they are most sensitive or tuned?
The spatiotemporal patterns of AN fiber activity to which AVCN cells are tuned were derived in this study by analyzing the responses of cells to wide-band noise. The procedure developed here involved correlating a recording of the activity of an AVCN cell to patterns of activity in the simulated response of a population of AN fibers. This technique characterizes the spatiotemporal pattern of activity across AN fibers that is most likely to precede a spike in the AVCN cell. The spatiotemporal tuning pattern provides a mechanism for predicting discharge times in response to complex stimuli. Feature detection based on spatiotemporal tuning patterns provides a novel method for exploring the neural encoding properties of these cells.
MATERIALS AND METHODS
Electrophysiological methods. The results presented here were based on recordings from AN fibers and from cells in the AVCN of Mongolian gerbils. AN fibers were studied to allow simulation of populations of AN responses in the gerbil, which required modification of an existing filter bank that was developed as part of a model for the responses of AN fibers in the cat (Carney, 1993). Recordings from AN fibers and AVCN cells were made in gerbils with ears that were free from signs of middle ear infection. The animals were anesthetized with Ketamine (0.17 mg/gm) and Xylazine (0.007 mg/gm); surgical levels of anesthesia were maintained throughout the experimental recording session. The animals were tracheotomized, and the pinna and surrounding soft tissue were removed to expose the bony bulla, through which the brainstem was approached (Sokolich and Smith, 1973). The temperature of the animal was maintained at 38.5°C throughout the experiment with an automatically controlled heating pad. All procedures involving the care, anesthesia, surgery, and killing of the animals comply with the National Institutes of Health and Boston University regulations regarding animal use.
At the beginning of each experiment, the acoustic system was calibrated with a Bruel & Kjaer 4134 ½ inch condenser microphone coupled to a calibrated probe tube, followed by an anti-aliasing filter before the analog-to-digital convertor. All stimuli were generated digitally and presented through a 16 bit digital-to-analog convertor, programmable attenuator, and earphone buffer amplifier (Tucker-Davis Technologies). The stimuli were presented through a Beyer DT-48 earphone coupled to a speculum that was sealed into the external auditory meatus.
Glass pipettes filled with 3 m NaCl were used for extracellular microelectrodes. Action potentials were detected using a peak discriminator, and times were digitally recorded at a resolution of 0.1 μsec. After a cell was isolated, the characteristic frequency (CF, the frequency to which a neuron is most sensitive), was estimated with either a tuning curve (estimated threshold as a function of frequency) or a response area (response rates as a function of frequency) at low stimulus levels. Discharge times were recorded in response to tones of 25 msec duration at CF, presented every 100 msec, and to wide-band noise of 800 msec duration, presented every 1 sec. The Gaussian noise stimuli were generated digitally with a sampling time of 50 μsec, resulting in a bandwidth of 10 kHz. Stimuli were gated on and off with 3.9 msec linear ramps. Noise waveforms were stored for later analysis of discharge times.
Categorization of physiological response types. This study focused on cells in the AVCN, which receive excitatory inputs from AN fibers and then project to major binaural nuclei in the auditory brainstem and midbrain (Warr, 1982; Cant and Casseday, 1986; Smith et al., 1991, 1993). The two major morphological cell types in the AVCN are bushy cells and stellate cells. Globular bushy cells, which are located more caudally in the AVCN, receive several large somatic inputs from AN fibers (Osen, 1969, 1970; Brawer and Morest, 1975; Tolbert and Morest, 1982a,b; Smith and Rhode, 1987; Liberman, 1991). Spherical bushy cells, in the rostral AVCN, may receive one or a few inputs in the form of very large “endbulbs of Held,” synaptic terminals on the soma (Ramon y Cajal, 1909; Osen, 1969, 1970; Cant and Morest, 1979;Lorente de No, 1981). Stellate cells, which are located throughout the AVCN, have been demonstrated to have two types of synaptic termination patterns (Cant, 1981; Smith and Rhode, 1989): type I cells have the majority of their small input terminals on the branching dendrites, whereas type II cells have a significant number of terminals on the cell soma, in addition to a number of small terminals on the dendrites.
Responses of AVCN cells to tones at their CF can be used to categorize cells as primary-like or chopper response types. Responses to tones at CF are characterized on the basis of their peristimulus time (PST) histograms, interval histograms, and coefficient of variation (CV, the ratio of the variance and the mean interspike interval) (Young et al., 1988; Blackburn and Sachs, 1989). Categorizations were based on the responses at several sound levels, beginning 20 dB above threshold, for which PST and interval histograms are significantly different than spontaneous activity.
Primary-like response types had PST histograms in response to tones and noise that were similar to those of AN fibers and were phase-locked to tonal stimuli at low frequencies. Primary-like response-type neurons have been associated with bushy cells based on combined morphological and physiological studies; neurons with primary-like-with-notch and onset-with-low-sustained-rate PST histograms are also associated with globular bushy cells (Smith and Rhode, 1987).
Chopper response types had unimodal interval histograms and low CVs. Cells with CVs that were <0.3 over the interval 15–20 msec during a tone of 25 msec duration at CF were categorized as sustained choppers, and cells with linearly increasing CVs >0.3 over the same 15–20 msec interval were categorized as transient choppers (Blackburn and Sachs, 1989). Chopper response types are associated with stellate cells (Smith and Rhode, 1989). Sustained chopper response types are hypothesized to belong to type I stellates, and transient chopper responses are associated with type II stellates (Young et al., 1988).
Several cells that were studied could not be categorized as either primary-like or chopper response types on the basis of their PST and interval histograms (Blackburn and Sachs, 1989). These so-called unusual response types could have elements in their responses of both low-frequency chopping and phase locking. Unusual cells had a wide range of CVs in response to tones. Interval histograms of some unusual cells in response to noise were dominated by long intervals, dramatically different from those of primary-like and chopper responses. Some of these cells had characteristics similar to those of onset choppers (Rhode and Smith, 1986; Smith and Rhode, 1989), including a few chopping modes followed by a low sustained rate and a wide dynamic range for discharge rate in response to tones at CF. However, unlike onset choppers, these cells did not synchronize strongly to low-frequency tones and did not have precisely timed onset spikes. These physiologically characterized unusual cells were found in experimental preparations near primary-like and chopper neurons, suggesting that these cells are located in the AVCN. The results presented are based on the responses of 44 well-isolated cochlear nucleus cells in 13 animals (27 primary-like responses, 2 sustained choppers, 8 transient choppers, and 7 unusual response types) and 31 AN fibers in 12 animals.
Auditory nerve filter bank. The Carney (1993) model used for the analyses in this study consists of several standard stages in the transformation from an arbitrary stimulus pressure waveform to a sequence of action potentials, such as transduction by inner hair cells, low-pass filtering that limits phase locking at high frequencies, synaptic adaptation, and refractoriness. Fundamental to the ability of the model to simulate nonlinear temporal response properties is the nonlinear feedback loop that controls the bandwidth of the filter as a function of time. The forward path of the feedback model is a fourth-order gamma-tone filter (Patterson et al., 1988) that was modified to include a continuously varying filter bandwidth controlled by the feedback signal (Carney, 1993).
The AN filters, which were originally designed to simulate the responses of AN fibers in the cat, were modified using responses of AN fibers in the gerbil to wide-band noise. The bandwidths of gerbil AN fibers, as estimated based on reverse-correlation (revcor) functions derived from responses to wide-band noise (e.g., de Boer and de Jongh, 1978), were significantly broader than were the bandwidths of cat AN fibers. Broad tuning for gerbil AN fibers compared with that of the cat has been shown previously using conventional threshold tuning curves (Schmiedt, 1989). This broader tuning was included in the AN simulations by modifying the bandwidth parameter in the time-varying narrowband filter. The new parameter values were found by fitting revcor functions for the gerbil AN fibers using the same procedures that were used for the cat AN fibers (Carney and Yin, 1988).
The values for τ0 in the function for the feedback parameter F(t) (Carney, 1993, her Eq. 4) were determined by the expression: τ0 = Cexp(−x/S0), whereC is equal to 1.33 msec, S0 is equal to 3.6 mm, and x is the distance in millimeters from the apex of the basilar membrane. The single-fiber filter was extended to a population filter bank by choosing a set of filters with center frequencies that were equally spaced on a log frequency scale and thus approximately linearly spaced in distance along the frequency map in the basilar membrane (Carney and Yin, 1988). The frequency map for the filter bank was unchanged from that used in Carney and Yin (1988), which was based on the cat. Unfortunately, frequency maps for gerbils and other small animals, such as guinea pigs, are currently based on very limited data, especially in the low-frequency range (Greenwood, 1990). Filter banks used for all figures presented here consisted of 31 AN filters, with the center frequency of each filter (the peak frequency to which each filter is tuned) spaced 0.17 mm apart along the basilar membrane. The difference between peak frequencies of neighboring filters was thus much smaller than the bandwidths of the filters to provide adequate representation of the population response patterns. The frequency range of the AN filter bank that was used to analyze each cell was approximately centered on the CF of the cell, keeping the range of filter frequencies the same for cells with similar CFs.
All filter parameters other than bandwidth were left unchanged from the values for the cat AN filters. Note that only the time-varying narrowband filter portion of the full AN model was used in this study; the amplitude of each filter response is proportional to the probability of discharge of an individual fiber. These estimates of the probabilities of discharge rather than the simulations of actual neural discharge patterns were used to characterize the population activity patterns of AN fibers. Thus the portions of the full AN model related to transduction and low-pass filtering by the inner hair cells, adaptation of the auditory nerve synapse, and refractoriness were omitted from the simulations presented here.
RESULTS
Spatiotemporal tuning of AVCN cells
The analysis of the spatiotemporal tuning of AVCN cells is an extension of the revcor technique that has been used successfully to characterize the temporal and tuning properties of AN fibers (de Boer and de Jongh, 1978; Carney and Yin, 1988). In this study, the technique has been modified for use in the AVCN in two ways. (1) The revcor analysis is applied to the response of an AN filter that includes nonlinear aspects of the auditory periphery rather than being applied to the stimulus waveform itself, and (2) the revcor analysis is applied in both time and frequency dimensions to include patterns of activity across populations of AN fibers tuned to different frequencies, as suggested by earlier spatiotemporal analysis techniques (e.g.,Eggermont et al., 1983a,b). The facts that AVCN cells are sensitive to the relative timing of their AN inputs (Carney, 1990) and that the timing of AN responses varies as a function of sound level (Anderson et al., 1971; Carney and Yin, 1988) dictate the use of a nonlinear model to describe the response properties of AN fibers.
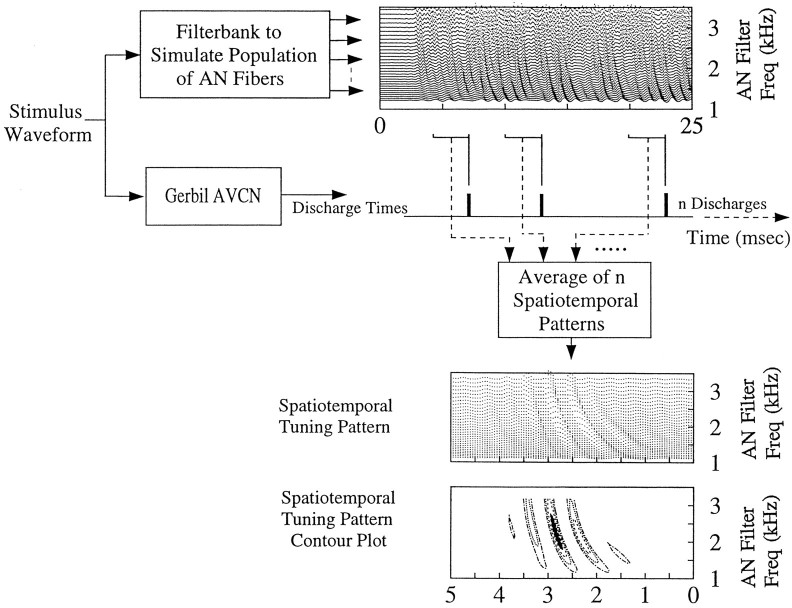
The simulated activity of the AN fiber population responding to a noise stimulus was analyzed via two-dimensional averaging (Fig.1). Specifically, the AN filter bank response patterns that preceded each discharge of an AVCN cell were averaged, yielding an average spatiotemporal pattern that preceded an action potential of the AVCN cell. Alternatively, the analysis can be described as a repeated analysis of the response of the cell, correlating it to the response of each of the AN filters in the filter bank, which were tuned across a range of frequencies. The results of the correlations for each filter were then aligned at time 0 to form the plot of the spatiotemporal tuning pattern.
Fig. 1.
Schematic illustration of the calculation of a spatiotemporal tuning pattern for an AVCN cell. The stimulus waveform presented to the animal was also the input to a filter bank model for the population of AN fibers. The responses of each AN filter as a function of time for the population filter bank are shown (top right). This population response represents the spatiotemporal discharge pattern of the AN population, which is the input pattern for AVCN cells. The patterns of activity that preceded discharges of an AVCN cell (shown along the time line below the population response) were summed across AVCN discharges to compute the average pattern that preceded discharges (bottom). Thetime axes for the spatiotemporal tuning patterns indicate time in milliseconds preceding the discharge time of the AVCN cell, which occurred at the right edge of theplot (time = 0). The bottom plotshows a contour plot representation of the spatiotemporal tuning pattern that facilitated comparison of spatiotemporal tuning across different neurons. The contours in this and all subsequent plots represent the 0, 25, 50, and 75% contours for the pattern; the peak of the pattern was scaled to 100%. The dark regionrepresents the peak 25% of the spatiotemporal tuning pattern.
Activity of AN filters with center frequencies far from the CF of the AVCN cell was uncorrelated to the discharge of the cell and resulted in an average pattern near zero. Similarly, activity preceding the discharge time by more than a few milliseconds resulted in an average pattern near zero. However, activity of AN filters with center frequencies close to the CF of the cell and during a time frame that preceded the discharge of the cell by ∼1–5 msec was correlated with the responses of the AVCN cell and provided an estimate of the pattern of AN activity that tended to precede discharges in the AVCN cell.
The pattern of spatiotemporal tuning in the AVCN varied from cell to cell (see Figs. 2-5). This observation indicates that the pattern of convergence of inputs onto a cell and thus its ability to “sample” the spatiotemporal pattern of the AN population for feature detection are potentially represented by these tuning patterns. The time course and the frequency range spanned by the peak region, which was measured as the frequency extent of the top 25% of the spatiotemporal pattern (Fig. 1, filled area of the contour plot), were the two most robust and quantifiable properties of these tuning patterns. Other features of the pattern, including the overall frequency span and the ringing nature of the peaks across time, simply reflect the frequency-tuning properties of the AN filters. Thus, because there is a great deal of redundant information in the patterns, the peak region provides a concise representation of the overall spatiotemporal tuning pattern.
Fig. 2.
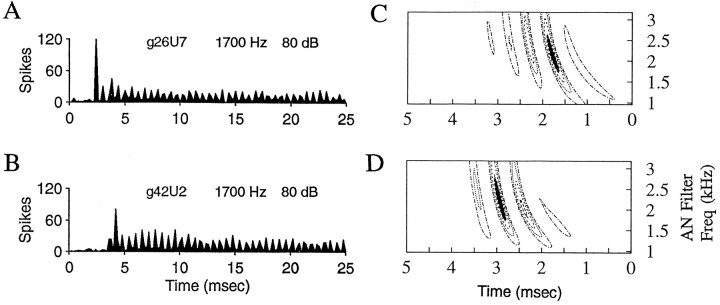
Spatiotemporal tuning patterns for two AVCN primary-like response-type cells with CFs equal to 1700 Hz.A, B, PST histograms for the responses of each cell (cells g26U7 and g42U2) to tones at CF. Two hundred repetitions of a tone of 25 msec duration were presented at 100 msec intervals. The bin size in the PST histograms here and in subsequent figures is 0.2 msec, unless otherwise noted. Sound levels are in decibels re: sound pressure level (dB SPL). C,D, Spatiotemporal tuning patterns for each cell inA and B, respectively, calculated as described in Figure 1. The patterns are based on responses to wide-band Gaussian noise of 800 msec duration presented at 1 sec intervals. The noise level for these responses was 50 dB SPL rms. Frequency spans of the peak regions are 875 Hz (C) and 1120 Hz (D).
Fig. 3.
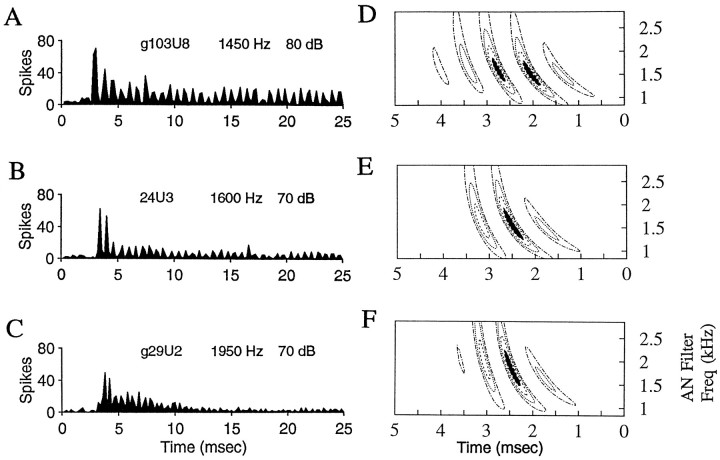
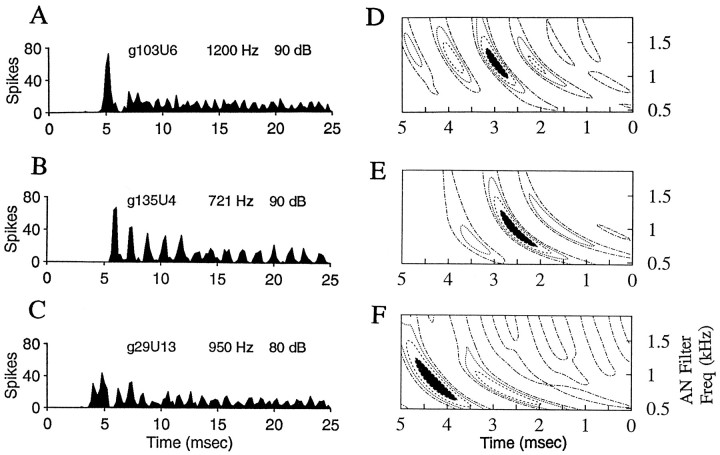
Three examples of primary-like response-type neurons. A–C, PST histograms for responses to tones at CF (parameters same as described for Fig. 1). D–F, Spatiotemporal tuning patterns for 50 dB SPL rms noise for neurons inA–C, respectively. Frequency spans of peak regions are 550 Hz (D), 675 Hz (E), and 860 Hz (F).
Fig. 4.
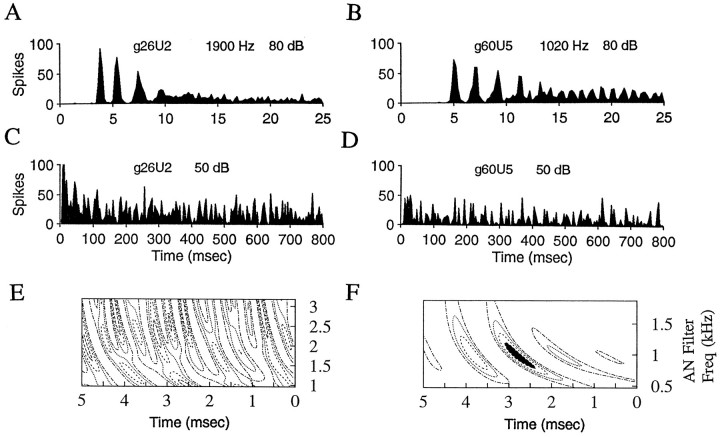
Examples of two transient-chopper response-type neurons. A, B, PST histograms for responses to tones at CF (parameters same as described for Fig. 1). C, D, PST histograms for the cells in A and B, respectively, for responses to wide-band noise. Fifty repetitions of noise of 800 msec duration were presented every 1 sec; bin size = 0.25 msec. Responses to 50 dB SPL rms noise levels are shown. E,F, Spatiotemporal tuning patterns derived from the responses shown in C and D, respectively. The frequency span of the peak region in F is 425 Hz.
Fig. 5.
Three examples of unusual response-type neurons. A–C, PST histograms for responses to tones at CF (parameters same as described for Fig. 1). D–F, Spatiotemporal tuning patterns for 50 dB SPL rms (D,E) and 60 dB SPL rms (F) noise for neurons in A–C, respectively. Frequency spans of peak regions are 495 Hz (D), 690 Hz (E), and 575 Hz (F).
Based on the sensitivities of AVCN cells to manipulations of spatiotemporal patterns (Carney, 1990), it was hypothesized that response types that were most likely to be sensitive to manipulations, such as primary-like response types, would have the clearest spatiotemporal tuning patterns. Chopper response types, and especially sustained chopper response types, were hypothesized to have less apparent spatiotemporal tuning patterns, because these cells tended to be insensitive to manipulations of the phase spectrum.
PST histograms for tones at CF and spatiotemporal tuning patterns for two primary-like cells with CFs of 1700 Hz are shown in Figure2. The pattern of AN activity that tends to precede responses for the cell shown in Figure 2, A andC, spans a narrower frequency range (875 Hz) than that (1120 Hz) for the cell shown in Figure 2, B and D. The frequency span of the spatiotemporal pattern is presumably determined by the CFs, number, and synaptic strengths of the AN inputs to the cell, as well as by the membrane properties of the cell and potentially by other (non-AN) inputs. Here, it can only be said that the pattern of activity represented by the spatiotemporal tuning pattern tends to occur before the cell discharges. The difference in latencies of the two neurons in response to tones and the differences in the timing of their spatiotemporal discharges patterns are presumably attributable to differences in the levels of the stimuli with respect to threshold, as well as possibly to differences introduced in the latencies because of triggering of the discharges at different levels or different phases of the discharge waveform.
Three additional examples of primary-like response-type neurons are illustrated in Figure 3. The spatiotemporal tuning patterns illustrate that the frequency range spanned by the peak of the pattern increases slightly as CF increases. This trend is expected because of the related change in bandwidth of the AN fibers as CF increases. Some cells have spatiotemporal patterns for some noise levels with more than one region in the peak 25% (Fig.3D); the frequency ranges of these patterns broaden gradually with noise level, consistent with broadened tuning of AN fibers as sound level increases.
Cells with chopper response types did not always have distinct spatiotemporal tuning patterns. Of eight cells with transient-chopper response characteristics, six had spatiotemporal patterns with clear peak regions. Figure 4 illustrates the responses of two transient choppers, one without a clear spatiotemporal tuning pattern (Fig. 4E) and one with a distinct pattern (Fig. 4F). Of two cells with sustained chopper responses, one had a clear spatiotemporal pattern, and one did not (although the latter also had a relatively high CF of 5000 Hz). Chopper responses to noise were interesting in that they typically responded reliably at certain points within the noise waveforms, trial after trial, as indicated by strong peaks in the PST histograms to noise (Fig. 4C,D). However, there was no qualitative difference in the PST histograms in response to noise for the cells in Figure 4, whereas the spatiotemporal tuning patterns derived from those responses were very different.
Five of seven cells with unusual response types had distinct spatiotemporal tuning patterns, and these patterns were also sometimes unusual. Figure 5 shows examples of three unusual cells. These cells were characterized by unusually long interspike intervals, especially in response to noise. That property seems to be reflected in the relatively long interval between the peak region of the spatiotemporal tuning pattern and the time of the cell discharge (time = 0) for some of these neurons. (Compare the temporal position of peaks in Fig.5D,E,F with the patterns in Figs. 2-4.)
This analysis technique was most successful in deriving spatiotemporal tuning patterns for neurons with primary-like and primary-like-with-notch responses; of the 27 cells that were studied, all had distinct spatiotemporal tuning patterns. Many cells with chopper and unusual responses also had clear spatiotemporal tuning patterns (12 of 17 cells studied). The spatiotemporal patterns of some primary-like-with-notch cells (and some of the unusual response types) were relatively broad, spanning a wide range of frequencies. This result is consistent with the fact that neurons with primary-like-with-notch responses are most likely to show sensitivity to manipulations of spatiotemporal patterns (Carney, 1990).
Spatiotemporal tuning as a function of sound level
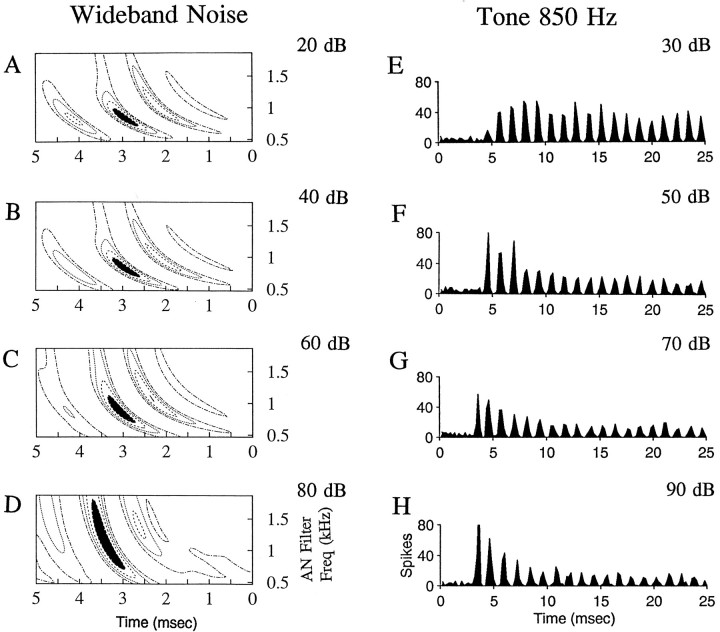
The spatiotemporal tuning patterns shown above were based on responses to noise presented at a single intensity. Responses of many cells were studied over a wide range of sound levels. Figure6 shows examples of spatiotemporal tuning patterns, as well as tone responses, for a low-frequency primary-like cell. The trend for the spatiotemporal tuning pattern to broaden as sound level was increased (Fig. 6A–D) was seen in all neurons that were studied. In addition, the timing of the peak region in the spatiotemporal tuning patterns shifted to theleft as the level was increased (Fig.6A–D). This shift is in the opposite direction that would be expected for a simple decrease in latency, which is seen for the onset responses of this cell for tones at increasing levels (Fig.6E–H). The shift in the spatiotemporal tuning patterns presumably results from changes in the phase of responses as a function of level during the sustained response to the wide-band noise. This shift and the increase in bandwidth were also seen when the spatiotemporal tuning patterns were computed with a linear filter bank and so were not simply introduced by changes in the bandwidth and phase of the nonlinear filter in the analysis procedure.
Fig. 6.
A–D, Spatiotemporal tuning patterns versus SPL for a primary-like cell with CF of ∼800 Hz. Note that the bandwidth of the peak region (filled area, top 25% of the pattern) increases with SPL.E–G, PST histograms in response to tones at CF of 850 Hz. Noise levels are indicated in decibels re: SPL rms; tone levels are in decibels re: SPL. Cell is g154U1.
Predictions of AVCN noise responses by spatiotemporal tuning patterns
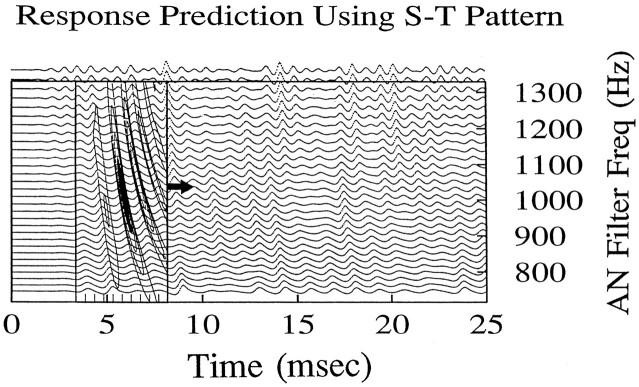
To test whether the spatiotemporal tuning pattern provided a useful description of the response properties of a cell, we used these patterns to predict the responses of a cell to another, independent, noise waveform. Figure 7 illustrates the two-dimensional convolution that is involved in making these predictions. The new noise waveform was used as the input to the AN filter bank. The degree of similarity between the population response and the spatiotemporal tuning pattern for a given cell was computed at each time point by taking a product of the two patterns and then by summing the product across the region. In this case, the time–frequency region that contained the significant spatiotemporal tuning pattern had a duration of 5 msec and ranged in frequency from 800 to 1300 Hz. The sum of the product of the two patterns provided an estimate of the likelihood of discharge of the AVCN cell at the time of the leading edge of the pattern. To predict the response of the AVCN cell as a function of time, we moved the tuning pattern along the time axis, and the product and sum were computed at each time step.
Fig. 7.
Illustration of two-dimensional convolution procedure used for computing predicted responses based on spatiotemporal tuning patterns. The tuning pattern for one cell is shown overlaid on the AN filter bank response to a noise stimulus; this stimulus waveform was statistically independent from the waveform used to generate the spatiotemporal tuning pattern. The probability of a discharge at any time is related to the similarity of the spatiotemporal tuning pattern and the pattern of activity of the simulated AN population. The prediction for a response at the time of the leading edge of the tuning pattern (arrow) is computed by finding the product of the two patterns and then by summing over the region of the tuning pattern. This operation is repeated at each time point over the duration of the stimulus.
The absolute amplitude of the prediction is somewhat arbitrary because the amplitude of the spatiotemporal tuning patterns is influenced, for example, by the numbers of discharges included in the analysis and by the degree of phase locking between the responses of the cell and the energy in the noise at frequencies near the peak frequency of each filter. For the predictions presented here, the spatiotemporal tuning patterns were normalized to 1, and the predicted PST histograms were scaled so that the peak of the predicted and the actual PST histograms had the same value. The prediction procedure is based on linear techniques, yet the analysis involves a nonlinear filtering stage. The degree to which the nonlinear aspects of both the analysis and the neural response influenced the predictions was tested by direct comparison of actual responses with the predictions based on spatiotemporal tuning patterns.
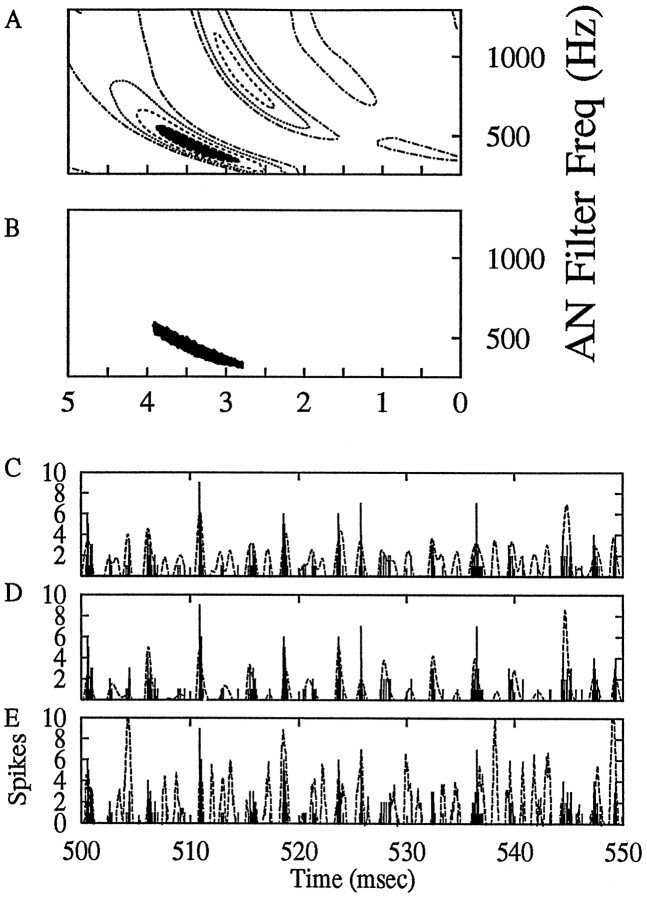
In many cases, the prediction of the PST histogram of the cell based on the spatiotemporal tuning pattern was superior (in terms of the mean squared error) to predictions based on a simple linear revcor analysis. One example of such a case for a primary-like neuron is shown in Figure8. Two versions of the spatiotemporal pattern were used for the predictions, the full pattern (Fig.8A) and a simplified pattern that consisted of only the peak 25% of the full pattern (the pattern below this threshold was set to zero) (Fig. 8B). The actual response to a 50 msec segment of the noise response (Fig. 8C–E, filled bars) is superimposed on predictions of the PST made using the full spatiotemporal pattern (Fig. 8C, dotted lines) and the simplified spatiotemporal pattern (Fig.8D, dotted lines) and on a prediction made with a first-order linear revcor analysis of the noise response (Fig. 8E, dotted lines). The revcor analysis prediction differed from the two spatiotemporal pattern predictions because it did not use AN filters; AVCN discharges were simply correlated to the stimulus waveform itself, and the resulting estimate of a linear impulse response was used to predict the response to the independent noise waveform. In this example, the mean squared error (computed over a duration of 400 msec) for the prediction based on the simplified spatiotemporal pattern was lower than that for the full pattern, and both were lower than that for the linear revcor prediction.
Fig. 8.
Prediction of the response of a cell to wide-band noise based on spatiotemporal tuning patterns. The noise was presented at 70 dB SPL rms. A, The full spatiotemporal tuning pattern. B, A simplified spatiotemporal tuning pattern that represents the peak 25% of the full pattern. C–E,Solid bars, The PST histogram for 50 msec of the response of this cell to a noise waveform that is independent from that used to find the spatiotemporal tuning pattern. C, The prediction (dotted line) of the response to this noise computed with the full spatiotemporal tuning pattern. D, The prediction (dotted line) based on the simplified spatiotemporal tuning pattern. E, The prediction (dotted line) of the PST based on a linear reverse-correlation analysis. Predictions were made for a noise waveform of 400 msec duration; the predicted responses were each normalized to the peak of the actual PST histogram. All predictions and the PST histogram have a temporal resolution (bin size) of 50 μsec, which is the time step used for the computations in the AN simulations. Mean squared errors between each prediction and the actual PST histogram are 1.95 (C), 1.07 (D), and 4.40 (E). Cell is g154u4.
Predictions based on spatiotemporal tuning patterns were generally equivalent or superior to those based on the revcor prediction, except for cases in which no significant spatiotemporal tuning pattern was present (e.g., for some chopper and unusual response types; Fig.4E). For 18 of 27 primary-like response types, the predictions based on spatiotemporal patterns were better (in terms of mean squared error) than those based on a linear revcor analysis. For 6 of 12 chopper and unusual neurons with distinct spatiotemporal patterns, the predictions based on these patterns were superior to the linear revcor analysis.
DISCUSSION
The spatiotemporal tuning pattern can be thought of as a feature in the AN population response that is detected by the AVCN cell. The analysis procedure that identifies this feature requires a linear two-dimensional reverse correlation of the simulated AN population response and the discharge times of the cell. Detection of the spatiotemporal feature by the cell may be based solely on linear mechanisms, or it can be enhanced by nonlinear mechanisms. For example, coincidence detection is a simple nonlinear neural mechanism that allows a cell to be sensitive to the temporal relationships between different excitatory inputs. Coincidence detection is consistent with the membrane properties of globular bushy cells (Oertel, 1983; Manis and Marx, 1991). Sensitivity to the temporal relationships of the inputs of a cell permits a cell to respond selectively to a particular spatiotemporal feature in the AN activity that results in coincident arrival of discharges at the cell. The number of AN inputs to a cell, the relative CFs of these inputs, and the sensitivity of the cell to individual inputs or combinations of inputs will determine the spatiotemporal patterns that are most effective in stimulating a neuron. These issues can be explored further by modeling studies that allow one to manipulate each of these parameters in a systematic manner to explore their influence on the spatiotemporal tuning patterns of model neurons.
By applying a threshold to the two-dimensional spatiotemporal tuning pattern, we can extract a simplified pattern of AN activity that is most strongly associated with the response of the AVCN cell (Fig.8B). This thresholding operation on the spatiotemporal pattern leads to an estimate for the pattern of activity across a limited range of AN fibers that most likely evokes a response from the AVCN neuron. The prediction based on the response of the simplified spatiotemporal tuning pattern provides a simple model for feature detection performed by a coincidence-detecting cell. This description, however, does not explicitly include the nonlinearity associated with the membrane properties of coincidence-detecting cells.
Because of nonlinearities in the tuning of AN fibers, sound level systematically influences the timing of AN responses (Anderson et al., 1971) and thus influences the spatiotemporal patterns of the AN population (Carney, 1994). These changes can be expected to influence the responses of feature-detecting cells in the AVCN (Carney, 1994). Because most AVCN cells are tuned to a relatively narrow frequency range, they are well suited to extract features related to the stimulus level in limited frequency ranges. Further studies of the responses of AVCN cells to complex sounds and the relationship of those responses to the spatiotemporal tuning properties of the cell are required to determine the use of this analysis technique for understanding the encoding of sounds with complex spectra. The role of the peripheral nonlinearity in influencing these responses is particularly interesting, because this nonlinearity is associated with the cochlear amplifier, and loss of this nonlinearity is associated with mild-to-moderate hearing impairment (Kates, 1993; Van Tasell, 1993).
Other plans for future studies include extending the analysis of chopper response types, which qualitatively showed selectivity for features in the noise waveform based on their highly reliable responses at particular points during the stimulus. An understanding of the features in complex stimuli that cause these cells to discharge will contribute to our understanding of the role of these cells in auditory processing. The responses of cells at higher levels of the brainstem are also candidates for related analyses, although the analysis procedure will have to be modified to incorporate binaural stimulation. For example, it was observed in a previous study (Carney and Yin, 1989, their Figs. 10, 11) that cells in the inferior colliculus (IC) respond reliably at certain points within a wide-band noise stimulus. In fact, the selectivity of the IC cells was much stronger than that seen for the choppers in this study (Fig. 4C,D) and similarly was apparently unrelated to a simple analysis based on the tuning properties of the cell.
Deciphering the complex stimulus features that elicit responses from cells will provide new information related to the encoding and processing of complex sounds by the auditory system. The analysis of spatiotemporal tuning patterns was motivated by the morphological and physiological descriptions of these cells and thus will potentially lead to new insight into the role of these different elements in the coding process. A limitation of this technique at present is that it characterizes only the AN inputs to the cells, which are known to be excitatory, and it does include non-AN inputs, such as descending and other potentially inhibitory inputs. Also, the AN filter bank used to provide the simulation of the population response does not include several nonlinear features, such as changes in the peak frequency of the tuning of fibers with sound level and two-tone suppression. It is difficult to predict how these two factors might influence either the calculation of spatiotemporal patterns or the prediction of neural responses based on those patterns. However, both of these nonlinear phenomena, which are associated with the compressive nonlinearity of the inner ear, affect the timing of AN responses and thus would be presumed to influence the responses of cells that receive convergent AN input and are sensitive to the relative timing of their inputs. These nonlinear properties are particularly interesting because they affect the spatiotemporal response patterns of the healthy ear and are associated with the fragile cochlear amplifier (Ruggero et al., 1992). As AN models are developed with these nonlinear properties, this analysis technique will provide a tool for understanding the influence of nonlinearities on the responses of cells that are sensitive to the spatiotemporal patterns of their AN inputs.
The peripheral auditory system provides an ideal case for the analysis of spatiotemporal tuning because detailed, quantitative models of the responses of primary afferents are available, as well as a body of physiological and morphological studies of the terminations of those afferents on secondary cells in the AVCN. The technique developed here to understand the spatiotemporal tuning of secondary cells could be applied to other sensory systems that require analyses of spatiotemporal inputs from primary afferents. Additionally, the technique can be applied more generally to higher levels of processing in neural systems, wherever the input patterns are understood well enough to provide estimates of their spatiotemporal patterns of activity.
Footnotes
This work was supported by Grants DC01641 from the National Institute on Deafness and Other Communication Disorders and IBN9601215 from the National Science Foundation. We acknowledge the helpful comments on this manuscript provided by David Cameron, Susan Moscynski, and Virginia Richards.
Correspondence should be addressed to Dr. Laurel H. Carney, Boston University, Biomedical Engineering, 44 Cummington Street, Boston, MA 02215.
REFERENCES
- 1.Anderson DJ, Rose JE, Hind JE, Brugge JF. Temporal position of discharges in single auditory nerve fibers within the cycle of a sine-wave stimulus: frequency and intensity effects. J Acoust Soc Am. 1971;49:1131–1139. doi: 10.1121/1.1912474. [DOI] [PubMed] [Google Scholar]
- 2.Blackburn CC, Sachs MB. Classification of unit types in the anteroventral cochlear nucleus: PST histograms and regularity. J Neurophysiol. 1989;62:1303–1329. doi: 10.1152/jn.1989.62.6.1303. [DOI] [PubMed] [Google Scholar]
- 3.Brawer JR, Morest DK. Relations between auditory nerve endings and cell types in the cat’s anteroventral cochlear nucleus seen with the Golgi method and Nomarski optics. J Comp Neurol. 1975;160:491–506. doi: 10.1002/cne.901600406. [DOI] [PubMed] [Google Scholar]
- 4.Cant NB. The fine structure of two types of stellate cells in the anterior division of the anteroventral cochlear nucleus of the cat. Neuroscience. 1981;6:2643–2655. doi: 10.1016/0306-4522(81)90109-3. [DOI] [PubMed] [Google Scholar]
- 5.Cant NB, Casseday JH. Projections from the anteroventral cochlear nucleus to the lateral and medial superior olivary nuclei. J Comp Neurol. 1986;247:457–476. doi: 10.1002/cne.902470406. [DOI] [PubMed] [Google Scholar]
- 6.Cant NB, Morest DK. The bushy cells in the anteroventral cochlear nucleus of the cat. A study with the electron microscope. Neuroscience. 1979;4:1925–1945. doi: 10.1016/0306-4522(79)90066-6. [DOI] [PubMed] [Google Scholar]
- 7.Carney LH. Sensitivities of cells in the anteroventral cochlear nucleus of cat to spatiotemporal discharge patterns across primary afferents. J Neurophysiol. 1990;64:437–456. doi: 10.1152/jn.1990.64.2.437. [DOI] [PubMed] [Google Scholar]
- 8.Carney LH. A model for the responses of low-frequency auditory-nerve fibers in cat. J Acoust Soc Am. 1993;93:401–417. doi: 10.1121/1.405620. [DOI] [PubMed] [Google Scholar]
- 9.Carney LH. Spatiotemporal encoding of sound level: models for normal encoding and recruitment of loudness. Hear Res. 1994;76:31–44. doi: 10.1016/0378-5955(94)90084-1. [DOI] [PubMed] [Google Scholar]
- 10.Carney LH, Yin TCT. Temporal coding of resonances by low-frequency auditory nerve fibers: single fiber responses and a population model. J Neurophysiol. 1988;60:1653–1677. doi: 10.1152/jn.1988.60.5.1653. [DOI] [PubMed] [Google Scholar]
- 11.Carney LH, Yin TCT. Responses of low-frequency cells in the inferior colliculus to interaural time differences of clicks: excitatory and inhibitory components. J Neurophysiol. 1989;62:144–161. doi: 10.1152/jn.1989.62.1.144. [DOI] [PubMed] [Google Scholar]
- 12.de Boer E, de Jongh HR. On cochlear encoding: potentialities and limitations of the reverse correlation technique. J Acoust Soc Am. 1978;63:115–135. doi: 10.1121/1.381704. [DOI] [PubMed] [Google Scholar]
- 13.Eggermont JJ, Aertsen AMHJ, Johannesma PIM. Quantitative characterisation procedure for auditory neurons based on the spectro-temporal receptive field. Hear Res. 1983a;10:167–190. doi: 10.1016/0378-5955(83)90052-7. [DOI] [PubMed] [Google Scholar]
- 14.Eggermont JJ, Aertsen AMHJ, Johannesma PIM. Prediction of the responses of auditory neurons of the grass frog based on the spectro-temporal receptive field. Hear Res. 1983b;10:191–202. doi: 10.1016/0378-5955(83)90053-9. [DOI] [PubMed] [Google Scholar]
- 15.Greenwood DD. A cochlear frequency-position function for several species–29 years later. J Acoust Soc Am. 1990;87:2592–2605. doi: 10.1121/1.399052. [DOI] [PubMed] [Google Scholar]
- 16.Kates JM. Hearing aid design criteria. JSLPA Monogr [Suppl] 1993;1:15–23. [Google Scholar]
- 17.Kiang NY-S, Watanabe T, Thomas EC, Clark LF. Discharge patterns of single fibers in the cat’s auditory nerve. MIT research monograph, No 35. MIT; Cambridge, MA: 1965. [Google Scholar]
- 18.Liberman MC. Central projections of auditory-nerve fibers of differing spontaneous rate. I. Anteroventral cochlear nucleus. J Comp Neurol. 1991;313:240–258. doi: 10.1002/cne.903130205. [DOI] [PubMed] [Google Scholar]
- 19.Lorente de No R. The primary acoustic nuclei. Raven; New York: 1981. [Google Scholar]
- 20.Manis PB, Marx SO. Outward currents in isolated ventral cochlear nucleus neurons. J Neurosci. 1991;11:2865–2880. doi: 10.1523/JNEUROSCI.11-09-02865.1991. [DOI] [PMC free article] [PubMed] [Google Scholar]
- 21.Oertel DO. Synaptic responses and electrical properties of cells in brain slices of the mouse anteroventral cochlear nucleus. J Neurophysiol. 1983;3:2043–2053. doi: 10.1523/JNEUROSCI.03-10-02043.1983. [DOI] [PMC free article] [PubMed] [Google Scholar]
- 22.Osen KK. The intrinsic organization of the cochlear nuclei in the cat. Acta Otolaryngol. 1969;67:352–359. doi: 10.3109/00016486909125462. [DOI] [PubMed] [Google Scholar]
- 23.Osen KK. Course and terminations of the primary afferents in the cochlear nuclei of the cat. An experimental study. Arch Ital Biol. 1970;108:21–51. [PubMed] [Google Scholar]
- 24.Patterson R, Nimmo-Smith I, Holdsworth J, Rice P. Implementing a gammatone filter bank. In: SVOS final report: the auditory filter bank. MRC Applied Psychology Unit; Cambridge, UK: 1988. [Google Scholar]
- 25.Ramon y Cajal S. Histologie du systeme nerveux de l’homme et des vertebres. Instituto Ramon y Cajal; Madrid: 1909. [Google Scholar]
- 26.Rhode WS, Smith PH. Encoding timing and intensity in the ventral cochlear nucleus of the cat. J Neurophysiol. 1986;56:261–286. doi: 10.1152/jn.1986.56.2.261. [DOI] [PubMed] [Google Scholar]
- 27.Rose JE, Brugge JF, Anderson DJ, Hind JE. Phase-locked responses to low-frequency tones in single auditory nerve fibers of the squirrel monkey. J Neurophysiol. 1967;30:769–793. doi: 10.1152/jn.1967.30.4.769. [DOI] [PubMed] [Google Scholar]
- 28.Ruggero MA, Robles L, Rich NC. Two-tone suppression in the basilar membrane of the cochlea: mechanical basis of auditory-nerve rate suppression. J Neurophysiol. 1992;68:1087–1099. doi: 10.1152/jn.1992.68.4.1087. [DOI] [PubMed] [Google Scholar]
- 29.Schmiedt RA. Spontaneous rates, thresholds, and tuning of auditory nerve fibers in the gerbil: comparisons to cat data. Hear Res. 1989;42:23–36. doi: 10.1016/0378-5955(89)90115-9. [DOI] [PubMed] [Google Scholar]
- 30.Smith PH, Rhode WS. Characterization of HRP-labelled globular bushy cells in the cat anteroventral cochlear nucleus. J Comp Neurol. 1987;266:360–375. doi: 10.1002/cne.902660305. [DOI] [PubMed] [Google Scholar]
- 31.Smith PH, Rhode WS. Structural and functional properties distinguish two types of multipolar cells in the ventral cochlear nucleus. J Comp Neurol. 1989;282:595–616. doi: 10.1002/cne.902820410. [DOI] [PubMed] [Google Scholar]
- 32.Smith PH, Joris PX, Carney LH, Yin TCT. Projections of physiologically characterized globular bushy cell axons from the cochlear nucleus of the cat. J Comp Neurol. 1991;304:387–407. doi: 10.1002/cne.903040305. [DOI] [PubMed] [Google Scholar]
- 33.Smith PH, Joris PX, Yin TCT. Projections of physiologically characterized spherical bushy cell axons from the cochlear nucleus of the cat: evidence for delay lines to the medial superior olive. J Comp Neurol. 1993;331:245–260. doi: 10.1002/cne.903310208. [DOI] [PubMed] [Google Scholar]
- 34.Sokolich W, Smith RL. Easy access to the auditory nerve in the Mongolian gerbil. J Acoust Soc Am. 1973;54:283. [Google Scholar]
- 35.Tolbert LP, Morest DK. The neuronal architecture of the anteroventral cochlear nucleus of the cat in the region of the cochlear nerve root: Golgi and Nissl methods. Neuroscience. 1982a;7:3013–3030. doi: 10.1016/0306-4522(82)90227-5. [DOI] [PubMed] [Google Scholar]
- 36.Tolbert LP, Morest DK. The neuronal architecture of the anteroventral cochlear nucleus of the cat in the region of the cochlear nerve root: electron microscopy. Neuroscience. 1982b;7:3053–3067. doi: 10.1016/0306-4522(82)90229-9. [DOI] [PubMed] [Google Scholar]
- 37.Van Tasell DJ. Hearing loss, speech, and hearing aids. J Speech Hear Res. 1993;36:228–244. doi: 10.1044/jshr.3602.228. [DOI] [PubMed] [Google Scholar]
- 38.Warr WB. Parallel ascending pathways from the cochlear nucleus: neuroanatomical evidence of functional specification. Contr Sensory Physiol. 1982;7:1–38. [Google Scholar]
- 39.Young ED, Robert J-M, Shofner WP. Regularity and latency of units in ventral cochlear nucleus: implications for unit classification and generation of response properties. J Neurophysiol. 1988;60:1–29. doi: 10.1152/jn.1988.60.1.1. [DOI] [PubMed] [Google Scholar]


