

Abstract
We have shown previously that the Ca2+ channel β3 subunit is capable of modulating tonic G-protein inhibition of α1A and α1BCa2+ channels expressed in oocytes. Here we determine the modulatory effect of the Ca2+ channel β3 subunit on M2 muscarinic receptor-activated G-protein inhibition and whether the β3 subunit modulates the G-protein sensitivity of α1A and α1B currents equivalently. To compare the relative inhibition by muscarinic activation, we have used successive ACh applications to remove the large tonic inhibition of these channels. We show that the resulting rebound potentiation results entirely from the loss of tonic G-protein inhibition; although the currents are temporarily relieved of tonic inhibition, they are still capable of undergoing inhibition through the muscarinic pathway. Using this rebound protocol, we demonstrate that the inhibition of peak current amplitude produced by M2 receptor activation is similar for α1A and α1B calcium currents. However, the contribution of the voltage-dependent component of inhibition, characterized by reduced inhibition at very depolarized voltage steps and the relief of inhibition by depolarizing prepulses, was slightly greater for the α1B current than for the α1A current. After co-expression of the β3subunit, the sensitivity to M2 receptor-induced G-protein inhibition was reduced for both α1A and α1Bcurrents; however, the reduction was significantly greater for α1A currents. Additionally, the difference in the voltage dependence of inhibition of α1A and α1Bcurrents was heightened after co-expression of the Ca2+ channel β3 subunit. Such differential modulation of sensitivity to G-protein modulation may be important for fine tuning release in neurons that contain both of these Ca2+ channels.
Keywords: Ca2+ channels, G-proteins, α1A, α1B, Ca2+ channel β subunit, voltage-dependent inhibition, Xenopus oocyte, muscarinic M2receptor, NEM
Although the types of Ca2+ channels present in neuronal synapses are variable, there are numerous instances in which the N-type (α1B) and P/Q-type (α1A) are colocalized presynaptically. The relative contribution of these channel types to synaptic transmission is variable but often mediated by both, acting in concert (Leubke et al., 1993; Takahashi and Momiyama, 1993;Castillo et al., 1994; Wheeler et al., 1994, 1996; Mintz et al., 1995;Regehr and Mintz, 1996). Ca2+ has been shown to act cooperatively in the presynaptic terminal to cause release of neurotransmitter, and as a result, small changes in the amount of Ca2+ entering the presynaptic neuron have large effects on synaptic transmission (Dodge and Rahamimoff, 1967;Heidleberger et al., 1994; Heinemann et al., 1994). Thus, even subtle differences in modulation of the Ca2+ channel types mediating neurotransmission would profoundly alter release.
Multiple varieties of Ca2+ channel inhibition by heterotrimeric G-proteins have been documented. The most common form of inhibition occurs in a voltage-dependent manner through activation of a pertussis toxin (PTX)-sensitive G-protein. In voltage-clamp studies of this type of inhibition, application of neurotransmitter causes a slowing of the current activation kinetics, and current inhibition is greater at less depolarized voltages (Marchetti et al., 1986; Wanke et al., 1987; Bean, 1989; Kasai and Aosaki, 1989). Other forms of inhibition occur in a voltage-independent manner, involving activation of a second messenger cascade (Beech et al., 1991; Bernheim et al., 1991), or through a membrane-delimited pathway (Shapiro and Hille, 1993; Diverse-Pierluissi et al., 1995; Wollmuth et al., 1995).
Several Ca2+ channel α1 subunits as well as a number of auxiliary subunits have been cloned recently (Miller, 1992; Birnbaumer et al., 1994; Isom et al., 1994; Perez-Reyes and Schneider, 1995; Catterall, 1996). The α1 subunit has a putative structure similar to other channels in the voltage-gated ion channel family, and expression of the α1 subunit alone is sufficient for the formation of functional Ca2+channels (Perez-Reyes et al., 1992). Current through α1channels can be modulated by co-expression of auxiliary subunits. The intracellularly situated β subunit affects the amplitude and kinetics of the Ca2+ currents of several cloned channels (Lacerda et al., 1991; Mori et al., 1991; Wei et al., 1991; Williams et al., 1992; Brust et al., 1993; Ellinor et al., 1993; Sather et al., 1993; Soong et al., 1993; Stea et al., 1993).
We have shown previously that α1A and α1BCa2+ channels expressed in Xenopusoocytes are tonically inhibited by G-proteins, demonstrated by blockade of a basally active G-protein population (Roche et al., 1995). Although much useful information can be derived using this approach, further characterization of the G-protein inhibition is better served by use of an experimental paradigm in which the inhibition of Ca2+ channels is controlled by activation of a single receptor type, in a reversible manner. In the present study, we use the muscarinic M2 receptor as a G-protein activation pathway, incorporating an experimental paradigm in which the inhibition results completely from muscarinic receptor activation, in the absence of background tonic G-protein inhibition. We demonstrate that this condition can be met and compare the G-protein inhibition of α1A and α1B Ca2+currents before and after co-expression of the Ca2+channel β3 subunit. Both the degree of inhibition and the contributions of the voltage-dependent and voltage-independent components of the inhibition were dependent on channel subunit composition. Additionally, these parameters of α1A and α1B current inhibition were differentially modulated by co-expression of the Ca2+ channel β3subunit.
MATERIALS AND METHODS
Expression plasmids and oocyte preparation. Capped RNA transcripts encoding full-length α1A (XbaI linearized/SP6 RNA polymerase; gift of Dr. Y. Mori, University of Cincinnati Medical Center), α1B (SalI/SP6; gift of Dr. Y. Fujita, Kyoto University), and β3(NotI/T7; gift of Dr. Edward Perez-Reyes, Loyola University Medical Center) calcium channel subunits as well as the M2muscarinic receptor (EcoRI, BglII/T7; gift of Dr. Wolfgang Sadee, University of California, San Francisco) were synthesized using a mMESSAGE mMACHINE in vitro transcription kit (Ambion, Austin, TX). Xenopus laevis stage V–VI oocytes were removed and treated with collagenase (Sigma type IV; Sigma, St. Louis, MO) to remove the follicular layer. The oocytes were then injected with cRNA encoding the M2 receptor along with either α1A, or α1B alone (1:1) or in combination with β3 (1:1:1). The concentration of all individual RNAs before injection was 0.1 μg/μl, and 20–60 nl of RNA mixed at the above ratios was injected. The oocytes were maintained in culture at 18°C for at least 2 d in ND-96 solution (96 mm NaCl, 2 mm KCl, 1.8 mmCaCl2, 5 mm HEPES, pH 7.5) supplemented with 2.5 mm sodium pyruvate and 2 mg/ml of gentamycin.
Electrophysiological recording and experimental treatments.Two-electrode voltage-clamp currents were recorded using a Dagan CA-1 amplifier. Oocytes were clamped at a holding potential of −80 mV, and several different voltage protocols were used (specific protocols can be found in the figure legends). Currents were filtered at 1 kHz, and a p/2 or p/4 leak subtraction technique was used. Analysis was performed off line with pClamp software version 6.0.2 (Axon Instruments, Foster City, CA). Electrodes contained 3 m KCl and had resistances of 0.5–2 MΩ. Oocytes were placed in a 1 ml chamber and perfused at a rate of 0.5 ml/min. All recordings were made at room temperature using bath solutions containing (in mm): BaOH 10, NaOH 50, CsOH 2, TEA-OH 20, N-methyl-d-glucamine 20, HEPES 5, titrated to pH 7.5 with methane sulfonic acid. In all experiments, 40 nl of a 50 mm stock solution of K3-1,2-bis(aminophenoxy)ethane-N,N,N′,N′-tetra-acetic acid (BAPTA) (Sigma) was injected at least 2 hr before the experiment. The final concentration of BAPTA inside the oocyte was estimated to be between 2 and 5 mm, assuming an oocyte volume of 1 μl. Acetylcholine chloride (Sigma) was dissolved in the external recording solution from a 100 mm stock to a final concentration of 50 μm. For experiments using n-ethylmaleimide (NEM) (Aldrich), NEM was dissolved in the external solution at a concentration of 200 μm and applied to the oocyte for 2 min. In experiments using PTX, oocytes were incubated in 4 μg/ml of PTX in ND-96 solution for 72 hr. All histograms are mean ± SEM. The n for these experiments is represented above the histograms.
RESULTS
Characterization of tonic G-protein inhibition after co-expression of the unliganded muscarinic receptor
Co-expression of the M2 muscarinic acetylcholine receptor with α1A or α1BCa2+ channels allowed us to activate a PTX-sensitive G-protein population, presumably either endogenous Gαi or Gαo (Lechleiter et al., 1991). The presence of the muscarinic receptor did not appear to affect the availability of the endogenous G-protein pool for tonic inhibition of α1A and α1B channels. Figure 1shows that α1A and α1B channels expressed in the oocyte are subject to tonic voltage-dependent G-protein inhibition, in a manner similar to that reported previously (Roche et al., 1995), apparently unaffected by the presence of the unliganded co-expressed muscarinic receptor. The level of tonic inhibition was determined by comparing the current generated during a test voltage step in the absence or presence of a strongly depolarizing voltage step given before the test voltage step (Elmslie et al., 1990; Ikeda, 1991;Lopez and Brown, 1991). At strongly depolarized voltages the channel is able to overcome the G-protein inhibition, perhaps by temporary dissociation of the G-protein from the channel (Bean, 1989; Lopez and Brown, 1991). In addition to showing the lack of effect of M2 receptor expression on this tonic inhibition, Figure1C also illustrates the elimination of prepulse facilitation by NEM and near-elimination by PTX, agents that are thought to bind to and uncouple the Gi/Go classes of G-protein α subunit from receptor activation. Elimination of tonic G-protein inhibition by these agents after co-expression of the unliganded receptor occurs essentially as in the absence of the unliganded receptor (Roche et al., 1995). Thus, the basic characteristics of the tonic G-protein inhibition of α1Aand α1B Ca2+ channels appeared unchanged by the presence of the unliganded receptor.
Fig. 1.

Co-expression of the M2 muscarinic acetylcholine receptor does not modify the tonic inhibition of α1A and α1B Ca2+currents by a basally active PTX-sensitive G-protein population.A, Depolarizing prepulse protocol used to relieve voltage-dependent G-protein inhibition. B, Currents elicited using this protocol. The protocol consists of a voltage step to +10 mV both before (−PP) and after (+PP) a depolarizing prepulse to +100 mV for 75 msec.C, Mean facilitation (±SEM) of current amplitude using this prepulse protocol for α1A (left) and α1B (right) currents. Represented is the facilitation seen in control conditions (Con), after application of 200 μm NEM (NEM), and after incubation with 4 μg/ml PTX (PTX) for 72 hr. The number for each experiment is represented above the respective histogram. For these experiments RNA encoding either α1A or α1B was coinjected with RNA encoding the M2 muscarinic ACh receptor.
Removal of tonic G-protein inhibition
The presence of tonic G-protein inhibition could complicate the interpretation of results obtained with muscarinic receptor activation, if the tonic inhibition differentially affects the two channel types or in some way differentially occludes the receptor-induced G-protein-mediated inhibition of α1A and α1B Ca2+ channels. Therefore, it is important to demonstrate that tonic inhibition is indeed not present during subsequent experiments, and we use a number of approaches to confirm this. It has been reported previously that after neurotransmitter-induced G-protein inhibition of Ca2+ channels there is a refractory period after the removal of the transmitter during which tonic G-protein inhibition of the channels is occluded (Kasai, 1991), and we examined whether this protocol might allow us to observe muscarinic inhibition in the absence of the background of tonic inhibition.
Activation of the M2 receptor by ACh resulted in inhibition of both α1A (Fig.2B, trace 2) and α1B (Fig. 2D, trace 2) currents beyond the level of tonic inhibition. Additionally, after removal of the ACh there was a large (two- to threefold) rebound of current amplitude (Fig. 2B,D, trace 3). Figure 2 also illustrates the similarity in current amplitude and kinetics during the rebound phase (Fig. 2B,D, trace 3) as compared with currents after removal of tonic inhibition by the application of NEM (Fig. 2B,D, trace 4). These similarities were consistent with a temporary loss of tonic inhibition, and we investigated this further, using α1BCa2+ currents.
Fig. 2.

Removal of ACh results in rebound potentiation of current amplitude for both α1A and α1BCa2+ currents. A, C, Time course of muscarinic-mediated G-protein inhibition for both α1A(left) and α1B (right) currents. The oocyte was held at a potential of −80 mV, and the oocyte was stepped to the test potential of +10 mV every 15 sec. Thecircles represent the peak current amplitude at the test potential of +10 mV. The black lines represent application of 50 μm ACh, whereas the gray lines represent application of 200 μm NEM. Spaces in which no circles are present indicate time periods in which other protocols were instituted. B, D, Current traces for various time points labeled on the graph in A andC. Note the similarity between the current kinetics and amplitude of the rebound current (3) and the current after treatment with NEM (4).
If indeed the amplitude of the rebound current was larger because of the loss of tonic G-protein inhibition, the facilitation of current amplitude by depolarizing prepulses would be lost during this period. When the depolarizing prepulse protocol was given either before (Con.) or during (+ ACh.) ACh presentation, significant prepulse facilitation was evident (Fig.3A,B). However, after removal of the ACh, during the period of potentiated current amplitude or rebound (Reb.), very little or no prepulse facilitation was seen (Fig. 3A,B), providing support for the contention that the tonic inhibition is lost during the period of rebound current potentiation.
Fig. 3.

Rebound current facilitation is a result of temporary loss of tonic inhibition. A, α1Bcurrents elicited using the prepulse protocol illustrated in Figure1A. Oocytes were stepped to +10 mV either with (+PP) or without (−PP) a depolarizing voltage step to +100 mV for 75 msec. The prepulse was given 20 msec before the test voltage step. Treatments: application of 50 μm ACh (+ ACH.); after the rebound of current amplitude on removal of ACh (Reb.); and after treatment of the oocyte with NEM (NEM). The representative currents were obtained from different oocytes.B, Summary of mean prepulse facilitation (±SEM) of current amplitude after the various treatments (* denotes significant difference from control; Student’s t test;p < 0.01). C, Summary of the mean potentiation (±SEM) of current by application of NEM (hatched) and by removal of acetylcholine (black). In all cases the control current was taken to be the initial stable current amplitude (trace 1, Fig.2A,C). The rebound potentiation (black) was the peak current amplitude attained after the removal of acetylcholine, both with (right) and without (left) previous incubation with PTX. The mean percent potentiation of the peak current amplitude after application of NEM (hatched) is also shown both with (right) and without (left) PTX pretreatment. D, Plot of current potentiation resulting from NEM application versus potentiation resulting from removal of acetylcholine. The white squares represent oocytes in which both rebound potentiation and NEM-induced potentiation were measured. The black squares represent oocytes that were pretreated with PTX and subsequently exposed to both treatments. The correlation coefficient is 0.87 (p < 0.001). The slope of the linear fit = 1.04.
Previously published data indicate that NEM relieves all of the tonic inhibition, based on the loss of prepulse facilitation and the occlusion of the actions of NEM by GDPβS, which blocks all G-proteins (Roche et al., 1995). Thus, for any given oocyte, if there is complete loss of tonic inhibition during rebound, the degree of current potentiation should be similar after NEM treatment and during the rebound produced by withdrawal of transmitter. We measured the potentiation after each of these treatments as the maximal current attained after the treatment divided by the initial current (voltage step to +10 mV). Frequently, as seen in Figure 2A, the maximal rebound after ACh application was not attained after the first application. Thus, repetitive ACh applications were given until a maximal and stable level of rebound was attained. Figure 3Cshows that the mean potentiation observed in individual oocytes after removal of acetylcholine was not significantly different from that produced by exposure to NEM.
We also used this protocol with oocytes incubated with PTX for 72 hr before the experiment to remove tonic inhibition. These oocytes were still partially inhibited by ACh (36 ± 5.8%; n = 4), presumably through non-PTX-sensitive G-proteins. Little potentiation was seen, however, either after removal of acetylcholine or after application of NEM. The potentiation by NEM was plotted against the potentiation resulting from rebound in individual oocytes. For these experiments, repetitive ACh applications were given until the rebound potentiation reached a maximal steady state. The current was then allowed to decay back to control values for a short period (∼5 min), at which time NEM was applied to the oocyte. When the inhibition from the two treatments was compared, the correlation coefficient was 0.87 and the slope of the linear fit was 1.04 (p< 0.0001), indicating a strong correlation (Fig. 3D). We conclude from all of these data that the rebound of current amplitude seen after the removal of ACh is a result of temporary loss of the total tonic G-protein inhibition and that we can study receptor-induced G-protein inhibition in the absence of tonic inhibition.
M2 receptor-induced inhibition of α1A and α1B currents in the absence of auxiliary subunits
Application of ACh and subsequent activation of the exogenously expressed muscarinic M2 receptor during the rebound period caused a reduction of current amplitude (Fig.4A,B), which was roughly equivalent for α1A and α1BCa2+ channels (77 ± 2%, n = 15, for the α1A current vs 79 ± 1%,n = 26, for the α1B current). Application of ACh to oocytes that did not contain exogenous M2receptor had no effect on either α1A or α1BCa2+ currents (data not shown). Also apparent is the slowed activation kinetics of both α1A and α1B currents after application of ACh, a hallmark of voltage-dependent G-protein-mediated inhibition (Marchetti et al., 1986; Wanke et al., 1987; Bean, 1989; Kasai and Aosaki, 1989). The time-to-peak current amplitude during a 250 msec voltage step to +10 mV was shifted from 20 ± 1 msec for control to 115 ± 1 msec (n = 13) after the application of ACh for the α1A currents, and from a value of 30 ± 4 msec for control to 131 ± 10 msec (n = 19) for the α1B currents. From these data we conclude that muscarinic M2 receptor-induced inhibition of α1A and α1B currents is equivalent at +10 mV. Additionally, the inhibition of both α1A and α1B currents contains voltage-dependent components, which produce similarly slowed activation kinetics.
Fig. 4.

Comparison of muscarinic M2receptor-induced G-protein inhibition of α1A and α1B currents in the absence of tonic inhibition.A, B, Inhibition of current amplitude by reapplication of acetylcholine to oocytes during the rebound phase of current amplitude, which resulted from removal of previous application of acetylcholine. The current during the rebound period is taken as control (Control), whereas the current after application of acetylcholine is represented as + ACh.C, Slowing of the activation kinetics after application of acetylcholine. D, Inhibition of peak current amplitude by activation of the M2 receptor in the absence of tonic inhibition at various test voltages for α1A(gray) and α1B(black) currents. (* represents significant difference in inhibition of α1A and α1B currents at a given test pulse voltage; Student’s independent t test;p ≤ 0.01).
We also tested the magnitude of inhibition at various voltages to determine whether the inhibition of the two channels was differentially voltage sensitive. This protocol revealed that M2receptor-induced reduction in current amplitude at more depolarized voltage steps was greater for α1A than for α1B (Fig. 4D), suggesting that although activation of the M2 pathway produces a similar magnitude of inhibition for the two channel types, the inhibition of α1B contains a larger voltage-dependent component.
The M2-induced inhibition of both α1A and α1B currents was partially relieved by depolarizing prepulses (Fig. 5A,B), another hallmark of voltage-dependent G-protein inhibition (Elmslie et al., 1990; Ikeda, 1991; Lopez and Brown, 1991). Figure 5C,D shows that between 20 and 50% of the inhibition could be relieved by depolarizing voltage. Examination of the data in histogram form (Fig.5E) demonstrates the divergence in the amount of inhibited current that was relieved by depolarizing prepulses, with α1B having a greater proportion of voltage-sensitive inhibition, consistent with the greater inhibition of α1Acurrent at more depolarized voltage steps (Fig. 4C). We conclude from these data that α1A and α1BCa2+ current amplitudes are equivalently sensitive to G-protein inhibition; however, the inhibition of α1Bcurrents is more voltage sensitive than the inhibition of α1A currents.
Fig. 5.

Voltage-dependent component of M2-mediated inhibition of α1A and α1B in the absence of the Ca2+ channel β3 subunit. A, B, Facilitation of α1A and α1B Ca2+currents using the prepulse protocol illustrated in Figure1A. C, D, Normalized current versus voltage plots of rebound current (▪), subsequent inhibition by application of 50 μm ACh (•), and facilitation of the inhibited current by a depolarizing prepulse to +100 mV for 75 msec (▵). E, Facilitation of current amplitude by the prepulse voltage protocol illustrated previously, for α1A(gray) and α1B(black) currents. Facilitation is measured as the percentage of current inhibited by application of ACh, which is subsequently relieved by the prepulse voltage protocol.
The Ca2+ channel β3 subunit differentially modulates the magnitude of M2-mediated G-protein inhibition of α1A and α1BCa2+ currents
We reported previously that co-expression of the Ca2+ channel β3 subunit significantly reduced tonic inhibition of α1A and α1BCa2+ currents (Roche et al., 1995). In the presence of the β3 subunit, α1A and α1B currents show a relatively small amount of rebound after removal of ACh and little or no prepulse facilitation (data not shown), indicating that only a small degree of tonic inhibition remains. Using the rebound protocol to eliminate the already reduced background tonic inhibition, we determined the ability of the β3 subunit to modulate muscarinic receptor-induced inhibition and furthermore whether the Ca2+ channel β3 subunit differentially modifies the muscarinic receptor-induced inhibition of α1A and α1BCa2+ currents.
In contrast to the results obtained in the absence of the β3 subunit, the inhibition of current amplitude induced by the M2 receptor is different for the two channel types. Co-expression of the Ca2+ channel β3subunit reduced the sensitivity of both the α1A and α1B Ca2+ currents to M2-induced G-protein inhibition. However, the β3 subunit blocked the muscarinic M2inhibition of the α1A current to a much greater extent than the α1B current. This is illustrated in Figure6A,B, which shows representative α1Aβ3 and α1Bβ3 currents before and after application of ACh. These current traces also demonstrate the greater slowing of α1Bβ3 current activation kinetics compared with that of α1Aβ3 current during M2 receptor activation, in contrast to the results obtained in the absence of the Ca2+ channel β3subunit. The time-to-peak current is quantitated in Figure6C. The slowed activation kinetics of the α1Bβ3 current is similar to the slowing seen when α1B is expressed alone.
Fig. 6.

Co-expression of the Ca2+channel β3 subunit differentially modulates the inhibition induced by activation of the muscarinic M2receptor. A, B, Currents elicited by a voltage step to +10 mV from a holding potential of −80 mV before (Control) and after (+ACh) application of 50 μm acetylcholine. C, Slowing of activation kinetics by application of acetylcholine after co-expression of the Ca2+ channel β3subunit (voltage step to +10 mV). D, Inhibition of current amplitude at various test potentials for both α1Aβ3 (gray) and α1Bβ3 (black) currents. (* represents significant difference between inhibition of α1Aβ3 and α1Bβ3currents at a given test pulse voltage; Student’s independentt test; p ≤ 0.01)
Slowing of the current activation kinetics is frequently associated with voltage-dependent inhibition, and the Ca2+channel β3 subunit differentially affects this aspect of inhibition for the two channels, suggesting that the β3subunit may differentially affect the voltage dependence of G-protein inhibition. This interpretation is strengthened by analysis of the inhibition at various test pulse voltages, which reveals a pronounced difference in the magnitude of the inhibition at relatively negative voltage steps (Fig. 6D), again in contrast to the results seen without the Ca2+ channel β3 subunit. In addition, the relief of G-protein inhibition by depolarizing prepulses was significantly greater for α1Bβ3 currents than for α1Aβ3 currents (Fig.7). Figure 7A,B illustrates the effect of a depolarizing prepulse to +100 mV, demonstrating clearly the difference in current facilitation for these two cloned channels after co-expression of the β3 subunit. The relief of G-protein inhibition using this protocol is 46.8 ± 0.03% for α1Bβ3 currents, whereas there is no significant relief of inhibition for α1Aβ3currents (Fig. 7C). These data indicate that not only does the Ca2+ channel β3 subunit differentially modulate the magnitude of M2receptor-induced G-protein inhibition of these two cloned channels, but it also heightens the inherent differences in the voltage dependence of M2 receptor-induced inhibition.
Fig. 7.

Co-expression of the Ca2+channel β3 subunit differentially modulates the voltage-dependent inhibitory characteristics associated with M2-induced G-protein inhibition. A, B, Facilitation of α1Aβ3 and α1Bβ3 Ca2+ currents using the prepulse protocol illustrated in Figure1A. C, D, Normalized current versus voltage plots of rebound current (▪), subsequent inhibition by application of 50 μm ACh (•), and facilitation of the inhibited current by a depolarizing prepulse to +100 mV for 75 msec (▵). E, Facilitation of α1Aβ3 (gray) and α1Bβ3 (black) current amplitude. Facilitation was measured as the percentage of inhibited current, which was reversed by the depolarizing prepulse (* represents significant difference between facilitation of α1Aβ3 and α1Bβ3currents at a given test pulse voltage; Student’s ttest; p ≤ 0.01).
Comparison of rate of prepulse facilitation of α1Aβ3 and α1Bβ3Ca2+ currents
The voltage dependence of G-protein inhibition is thought to arise from the voltage-dependent dissociation of the G-protein from the Ca2+ channel (Bean, 1989; Lopez and Brown, 1991). We have demonstrated that the Ca2+ channel β3 subunit differentially modifies the magnitude as well as the voltage dependence of G-protein inhibition of α1Aand α1B Ca2+ channels, raising the possibility that G-protein dissociation rates for the two channel types are dissimilar. Figure8A,B shows the rate of facilitation of Ca2+ currents when the prepulse duration is varied and the voltage is held constant. The time constants derived from these data were similar [7.12 ± 1.24 msec for α1Aβ3 (n = 4) and 6.91 ± 0.95 msec for α1Bβ3 (n = 5)], suggesting that the rate of relief of G-protein inhibition does not explain the differences in inhibitory characteristics of these two channel types. However, it should be noted that only a small portion of the inhibition of α1Aβ3 currents is relieved using these prepulse protocols (∼6% facilitation for α1Aβ3 vs ∼80% for α1Bβ3), and caution should be used in interpreting this result as a definitive indicator of G-protein affinity for the α1Aβ3 channel.
Fig. 8.
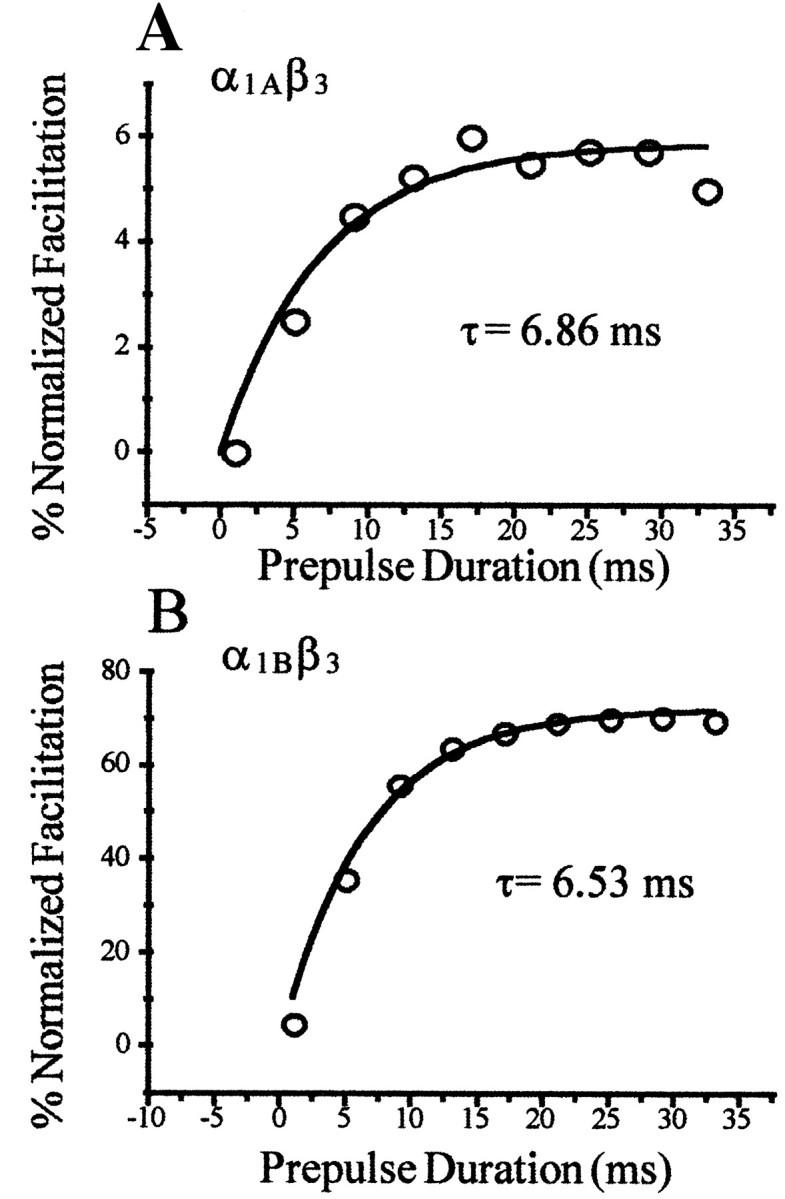
Prepulse facilitation of α1Aβ3 and α1Bβ3currents as a function of prepulse duration. A, B, Facilitation of current with a prepulse to +100 mV for varying durations, in a representative experiment. The data were fit with a single exponential, and the time constant of this fit is shown. In both cases, facilitation of current was normalized to the values of facilitation seen in the absence of G-protein inhibition, to eliminate any contribution of desensitization produced by these protocols.
DISCUSSION
Our results demonstrate that co-expression of the calcium channel β3 subunit differentially modulates both the magnitude and voltage dependence of M2 receptor-induced G-protein inhibition of α1A and α1BCa2+ currents. The magnitude of inhibition, previously equivalent for α1A and α1BCa2+ currents at moderate depolarizations, becomes greater for α1Bβ3 currents compared with α1Aβ3 currents. In addition, G-protein inhibition of α1Aβ3 channels becomes less voltage dependent, whereas inhibition of α1Bβ3 channels becomes more voltage dependent than α1A and α1B channels were in the absence of the β subunit. However, we found no difference in the rate of prepulse relief of G-protein inhibition between α1Aβ3 and α1Bβ3currents, suggesting no difference in the rate at which the G-proteins dissociate from these channels at equivalent voltages.
Frequently, voltage-dependent and voltage-independent forms of inhibition are separable components (Beech et al., 1991, 1992; Bernheim et al., 1991; Leubke and Dunlap, 1994; Diverse-Pierluissi et al., 1995;Wollmuth et al., 1995), which is attributable to the activation of distinct biochemical pathways by G-protein-coupled receptor(s). Thus, a shift in the contribution of voltage-dependent versus voltage-independent components to overall inhibition could be explained by a blockade of one of these pathways by the β subunit. However, this is not likely to explain our results, because the Ca2+ channel β3 subunit would have to selectively eliminate the voltage-dependent inhibitory pathway for the α1A channel and the voltage-independent pathway for the α1B channel.
An alternative explanation is that changes in the voltage dependence may reflect inherent differences in the rate of dissociation of the G-protein from the Ca2+ channel α1subunit, which is accentuated by the Ca2+ channel β3 subunit. Differences in the rate of voltage-dependent relief of somatostatin receptor-induced inhibition have been documented previously and proposed to explain differences in the magnitude of inhibition of α1Aβ1 and α1Bβ1 currents (Zhang et al., 1996). In these studies, the rate of G-protein dissociation was twofold faster for the α1Aβ1 Ca2+channel, and this was suggested to be responsible for the smaller magnitude of G-protein inhibition of this channel type, compared with α1Bβ3 channels. However, a similar comparison of G-protein inhibition of N- and Q-type Ca2+ currents in adrenal chromaffin cells (Currie and Fox, 1997) uncovered no differences in the rate of relief of inhibition by depolarizing prepulses, although the N- and Q-type currents displayed differences in the magnitude of G-protein inhibition similar to the differences seen in α1Aβ and α1Bβ channels expressed in oocytes. Our results show no difference in G-protein dissociation rate, probed using prepulse protocols, between α1Aβ3 and α1Bβ3, similar to the results ofCurrie and Fox (1997); however, caution should be exercised in the interpretation of these results. If G-protein dissociation occurs at extremely fast rates, a significant amount of dissociation will occur during the test pulse step to +10 mV. Subsequent attempts to cause further G-protein dissociation using depolarizing prepulses would cause little additional dissociation and might not accurately reflect the overall state of G-protein dissociation. Such extremely fast dissociation is consistent with the voltage-dependent characteristics of the G-protein inhibition of α1Aβ3current. Our results show decreased slowing of activation kinetics and decreased prepulse facilitation of α1Aβ3current, consistent with an increased rate of G-protein dissociation from α1Aβ3 channels. Biochemical determination of relative binding affinities for G-protein subunits for both the α1A and α1BCa2+ channels might shed definitive light on this subject. However, voltage-dependent channel conformations may be necessary to see differences in affinity of the G-proteins for these two channels. Whatever the mechanism, it remains that the inhibition of α1Bβ3 current is more easily reversed by voltage and is thus more voltage dependent.
It has been suggested recently that the Xenopus oocyte contains an endogenous β subunit (β3XO) (Tareilus et al., 1997), which is suggested to increase expression at low expression levels and modulate channel activity at higher expression levels, possibly by binding to multiple sites on the Ca2+ channel α1 subunit. It is clear that G-protein inhibition of Ca2+ channels in our experiments is significantly altered by co-expression of β3. We do not believe that the endogenous β subunit significantly couples with exogenous α1 subunits, on the basis of the following data. (1) The endogenous Ca2+current is very small compared with the currents seen with the α1 subunits expressed alone (∼10 nA compared with ∼1000 nA for α1B), and therefore the endogenous β3 subunit would have to be expressed in excess of the endogenous α1 subunit to have any effect on exogenously expressed Ca2+ channels (Mori et al., 1991; Bourinet et al., 1992), but (2) injection of exogenous β subunit increases the current amplitude of the endogenous Ca2+ currents, indicating that the endogenous β subunit is not likely expressed in overabundance (Lacerda et al., 1994); (3) certain α1Bclones, incapable of expressing without exogenous β subunit, can be expressed in high densities when placed in a Xenopusexpression vector, suggesting not only that endogenous β subunit is insufficient for expression of these clones, but also that the β subunit is not a requirement for high density expression (Lin et al., 1997). However, the potential role of endogenous β subunits can be fully determined only by quantitating expression levels.
We used the refractory period that follows the removal of transmitter, during which tonic inhibition is absent (rebound), to examine the actions of G-proteins activated by M2 activation. The mechanism behind this rebound is unclear at this time, but the phenomenon may have significant physiological implications. For example, a cell that has been inhibited by the action of two or more transmitters, on removal of one of these transmitters might be refractory to the actions of the second transmitter. Tonic G-protein inhibition may influence transmission at some synapses where presynaptic elements might exhibit heightened release as a result of temporary removal of tonic inhibition for a period of time after removal of a neurotransmitter.
The influence of calcium channel subunit composition on G-protein modulation is also likely to have significant functional consequences. When transmitter release is triggered by lengthy, high-frequency trains of action potentials, the voltage-dependent form of G-protein inhibition will be minimized (Elmslie et al., 1990; Ikeda, 1991). This would lead to a greater amount of Ca2+ entry from channels that are inhibited in a voltage-dependent manner and in turn lead to a greater amount of transmitter release. It is apparent from our experiments that the ability of release to become facilitated will depend on both the expression of particular α1 subunits as well as on the degree of β subunit association with these α1 subunits. Transmitter release at many CNS synapses is initiated by Ca2+ permeating both N-type (α1B) and P/Q-type (α1A) Ca2+ channels. The relative contribution of these channel types to synaptic transmission is variable but often mediated by both acting in concert (Leubke et al., 1993; Takahashi and Momiyama, 1993; Castillo et al., 1994; Wheeler et al., 1994; Mintz et al., 1995;Regehr and Mintz, 1996; Wheeler et al., 1996). At these synapses, regulation of both the expression of the Ca2+channel β subunit and the relative abundance of a particular α1 subunit will finely regulate the overall sensitivity of the synapse to G-protein modulation, as well as its response to trains of depolarizing action potentials. Regulation of inhibitory modulation at the level of the target channel would allow more precise tuning than would regulation of inhibitory modulation at the level of the G-protein, in which a larger range of downstream targets would be affected.
In conclusion, these data indicate that the both the magnitude as well as the voltage dependence of G-protein-mediated inhibition of the α1A and α1B Ca2+currents is differentially modulated by the Ca2+channel β3 subunit. This may play an important role in the CNS to regulate the plasticity of synapses.
Footnotes
This work was supported by National Institutes of Health (NIH) Grants AA05542 and AA08003 to S.N.T. and NIH predoctoral fellowship to J.P.R. We thank Dr. Ann Rittenhouse for careful reading of this manuscript, and Andy Wilson and Lynda Zorn for expert technical assistance.
Correspondence should be addressed to Dr. Steven N. Treistman, Department of Pharmacology and Molecular Toxicology, University of Massachusetts Medical Center, Worcester, MA 01655.
Dr. Roche’s present address: Department of Physiology and Biophysics, University of Washington, Seattle, WA 98195.
REFERENCES
- 1.Bean BP. Neurotransmitter inhibition of neuronal calcium currents by changes in channel voltage dependence. Nature. 1989;340:153–156. doi: 10.1038/340153a0. [DOI] [PubMed] [Google Scholar]
- 2.Beech DJ, Bernheim L, Mathie A, Hille B. Intracellular Ca2+ buffers disrupt muscarinic suppression of Ca2+ current and M current in rat sympathetic neurons. Proc Natl Acad Sci USA. 1991;88:652–656. doi: 10.1073/pnas.88.2.652. [DOI] [PMC free article] [PubMed] [Google Scholar]
- 3.Beech DJ, Bernheim L, Hille B. Pertussis toxin and voltage dependence distinguish multiple pathways modulating calcium channels of rat sympathetic neurons. Neuron. 1992;8:97–106. doi: 10.1016/0896-6273(92)90111-p. [DOI] [PubMed] [Google Scholar]
- 4.Bernheim L, Beech DJ, Hille B. A diffusible second messenger mediates one of the pathways coupling receptors to Ca2+ channels in rat sympathetic neurons. Neuron. 1991;6:859–867. doi: 10.1016/0896-6273(91)90226-p. [DOI] [PubMed] [Google Scholar]
- 5.Birnbaumer L, Campbell K, Catterall WA, Harpold MM, Hofman F, Horne WA, Mori Y, Schwartz A, Snutch TP, Tanabe T, Tsien RW. Matters arising: the naming of voltage gated calcium channels. Neuron. 1994;13:505–506. doi: 10.1016/0896-6273(94)90021-3. [DOI] [PubMed] [Google Scholar]
- 6.Bourinet E, Fournier F, Nargeot J, Charnet P. Endogenous Xenopus-oocyte Ca-channels are regulated by protein kinases A and C. FEBS Lett. 1992;299:5–9. doi: 10.1016/0014-5793(92)80087-w. [DOI] [PubMed] [Google Scholar]
- 7.Brust PF, Simerso S, McCue AF, Deal CR, Schoonmaker S, Williams ME, Velicelebi G, Johnson EC, Harpold MM, Ellis SB. Human neuronal voltage-dependent calcium channels: studies on subunit structure and role in channel assembly. Neuropharmacology. 1993;32:1089–1102. doi: 10.1016/0028-3908(93)90004-m. [DOI] [PubMed] [Google Scholar]
- 8.Castillo PB, Weisskopf MG, Nicoll RA. The role of Ca2+ channels in hippocampal mossy fiber synaptic transmission and long-term potentiation. Neuron. 1994;12:261–269. doi: 10.1016/0896-6273(94)90269-0. [DOI] [PubMed] [Google Scholar]
- 9.Catterall WA. Molecular properties of sodium and calcium channels. J Bioenerg Biomembr. 1996;28:219–230. doi: 10.1007/BF02110697. [DOI] [PubMed] [Google Scholar]
- 10.Currie KP, Fox AP. Comparison of N- and P/Q-type voltage-gated calcium channel current inhibition. J Neurosci. 1997;17:4570–4579. doi: 10.1523/JNEUROSCI.17-12-04570.1997. [DOI] [PMC free article] [PubMed] [Google Scholar]
- 11.Diverse-Pierluissi M, Goldsmith PK, Dunlap K. Transmitter-mediated inhibition of N-type calcium channels in sensory neurons involves multiple GTP-binding proteins and subunits. Neuron. 1995;14:191–200. doi: 10.1016/0896-6273(95)90254-6. [DOI] [PubMed] [Google Scholar]
- 12.Dodge FA, Rahamimoff R. Co-operative action of calcium ions in transmitter release at the neuromuscular junction. J Physiol (Lond) 1967;193:419–432. doi: 10.1113/jphysiol.1967.sp008367. [DOI] [PMC free article] [PubMed] [Google Scholar]
- 13.Ellinor PT, Zhang J-F, Randall AD, Zhou M, Schwarz TL, Tsien RW, Horne WA. Functional expression of a rapidly inactivating neuronal calcium channel. Nature. 1993;363:455–458. doi: 10.1038/363455a0. [DOI] [PubMed] [Google Scholar]
- 14.Elmslie KS, Zhou W, Jones SW. LHRH and GTP-γ-S modify calcium current activation in bullfrog sympathetic neurons. Neuron. 1990;5:75–80. doi: 10.1016/0896-6273(90)90035-e. [DOI] [PubMed] [Google Scholar]
- 15.Heidleberger R, Heinemann C, Neher E, Matthews G. Calcium dependence of the rate of exocytosis in a synaptic terminal. Nature. 1994;371:513–515. doi: 10.1038/371513a0. [DOI] [PubMed] [Google Scholar]
- 16.Heinemann C, Chow RH, Neher E, Zucker RS. Kinetics of the secretory response in bovine chromaffin cells following flash photolysis of caged Ca2+. Biophys J. 1994;67:2546–2557. doi: 10.1016/S0006-3495(94)80744-1. [DOI] [PMC free article] [PubMed] [Google Scholar]
- 17.Ikeda SR. Double-pulse calcium channel current facilitation in adult rat sympathetic neurons. J Physiol (Lond) 1991;439:181–214. doi: 10.1113/jphysiol.1991.sp018663. [DOI] [PMC free article] [PubMed] [Google Scholar]
- 18.Isom LL, De Jongh KS, Catterall WA. Auxiliary subunits of voltage-gated ion channels. Neuron. 1994;12:1183–1194. doi: 10.1016/0896-6273(94)90436-7. [DOI] [PubMed] [Google Scholar]
- 19.Kasai H. Tonic inhibition and rebound facilitation of a neuronal calcium channel by a GTP-binding protein. Proc Natl Acad Sci USA. 1991;88:8855–8859. doi: 10.1073/pnas.88.19.8855. [DOI] [PMC free article] [PubMed] [Google Scholar]
- 20.Kasai H, Aosaki T. Modulation of Ca-channel current by an adenosine analog mediated by a GTP-binding protein in chick sensory neurons. Pflügers Arch. 1989;414:145–149. doi: 10.1007/BF00580956. [DOI] [PubMed] [Google Scholar]
- 21.Lacerda AE, Kim HS, Ruth P, Perez-Reyes E, Flockerzi V, Hofmann F, Birnbaumer L, Brown AM. Normalization of current kinetics by interaction between the α1 and β subunits of the skeletal muscle dihydropyridine-sensitive Ca2+ channel. Nature. 1991;352:527–530. doi: 10.1038/352527a0. [DOI] [PubMed] [Google Scholar]
- 22.Lacerda AE, Perez-Reyes E, Wei X, Castellano A, Brown AM. T-type and N-type calcium channels of Xenopus oocytes: evidence for specific interactions with β subunits. Biophys J. 1994;66:1833–1843. doi: 10.1016/S0006-3495(94)80977-4. [DOI] [PMC free article] [PubMed] [Google Scholar]
- 23.Lechleiter J, Girard S, Clapham D, Peralta E. Subcellular patterns of calcium release determined by G protein-specific residues of muscarinic receptors. Nature. 1991;350:505–508. doi: 10.1038/350505a0. [DOI] [PubMed] [Google Scholar]
- 24.Leubke JI, Dunlap K. Sensory neuron N-type calcium currents are inhibited by both voltage-dependent and -independent mechanisms. Pflügers Arch. 1994;428:499–507. doi: 10.1007/BF00374571. [DOI] [PubMed] [Google Scholar]
- 25.Leubke JI, Dunlap K, Turner TJ. Multiple calcium channel types control synaptic transmission. Neuron. 1993;11:895–902. doi: 10.1016/0896-6273(93)90119-c. [DOI] [PubMed] [Google Scholar]
- 26.Lin Z, Haus S, Edgerton J, Lipscombe D. Identification of functionally distinct isoforms of the N-type Ca2+ channel in rat sympathetic ganglia and brain. Neuron. 1997;16:1623–1633. doi: 10.1016/s0896-6273(01)80054-4. [DOI] [PubMed] [Google Scholar]
- 27.Lopez HS, Brown AM. Correlation between G protein activation and reblocking kinetics of Ca2+ channel currents in rat sensory neurons. Neuron. 1991;7:1061–1068. doi: 10.1016/0896-6273(91)90350-9. [DOI] [PubMed] [Google Scholar]
- 28.Marchetti C, Carbone E, Lux HD. Effects of dopamine and noradrenaline on Ca2+ channels of cultured sensory and sympathetic neurons of chick. Pflügers Arch. 1986;406:104–111. doi: 10.1007/BF00586670. [DOI] [PubMed] [Google Scholar]
- 29.Miller RJ. Voltage-sensitive Ca2+ channels. J Biol Chem. 1992;267:1403–1406. [PubMed] [Google Scholar]
- 30.Mintz IM, Sabatini BL, Regehr WG. Calcium control of transmitter release at a cerebellar synapse. Neuron. 1995;15:675–688. doi: 10.1016/0896-6273(95)90155-8. [DOI] [PubMed] [Google Scholar]
- 31.Mori Y, Friedrich T, Kim MS, Mikami A, Nakai J, Ruth P, Bosse E, Hofmann F, Flockerzi V, Furuichi T, Mikoshiba K, Imoto K, Tanabe T, Numa S. Primary structure and functional expression from complementary DNA of a brain calcium channel. Nature. 1991;350:398–402. doi: 10.1038/350398a0. [DOI] [PubMed] [Google Scholar]
- 32.Perez-Reyes E, Schneider T. Molecular biology of calcium channels. Kidney Int. 1995;48:1111–1124. doi: 10.1038/ki.1995.395. [DOI] [PubMed] [Google Scholar]
- 33.Perez-Reyes E, Castellano A, Kim HS, Bertrand P, Baggstrom E, Lacerda AE, Wei X, Birnbaumer L. Cloning and expression of cardiac/brain β subunit of the L-type calcium channel. J Biol Chem. 1992;267:1792–1797. [PubMed] [Google Scholar]
- 34.Regehr WG, Mintz IM. Participation of multiple calcium channel types in transmission at single climbing fiber to Purkinje cell synapses. Neuron. 1996;12:605–613. doi: 10.1016/0896-6273(94)90216-x. [DOI] [PubMed] [Google Scholar]
- 35.Roche JP, Anantharam V, Treistman SN. Abolition of G protein inhibition of α1A and α1B calcium channels by co-expression of the β3 subunit. FEBS Lett. 1995;371:43–46. doi: 10.1016/0014-5793(95)00860-c. [DOI] [PubMed] [Google Scholar]
- 36.Sather WA, Tanabe T, Zhang J-F, Mori Y, Adams ME, Tsien RW. Distinctive biophysical and pharmacological properties of class A (B1) calcium channel α1 subunits. Neuron. 1993;11:1–20. doi: 10.1016/0896-6273(93)90185-t. [DOI] [PubMed] [Google Scholar]
- 37.Shapiro MS, Hille B. Substance P and somatostatin inhibit calcium channels in rat sympathetic neurons via different G protein pathways. Neuron. 1993;10:11–20. doi: 10.1016/0896-6273(93)90237-l. [DOI] [PubMed] [Google Scholar]
- 38.Soong TW, Stea A, Hodson CD, Dubel SJ, Vincent SR, Snutch TP. Structure and functional expression of a member of the low voltage-activated calcium channel family. Science. 1993;260:1133–1136. doi: 10.1126/science.8388125. [DOI] [PubMed] [Google Scholar]
- 39.Stea A, Dubel SJ, Pragnell M, Leonard JP, Campbell KP, Snutch TP. A β-subunit normalizes the electrophysiological properties of a cloned N-type Ca2+ channel α1 -subunit. Neuropharmacology. 1993;32:1103–1116. doi: 10.1016/0028-3908(93)90005-n. [DOI] [PubMed] [Google Scholar]
- 40.Takahashi T, Momiyama A. Different types of calcium channels mediate central synaptic transmission. Nature. 1993;366:156–158. doi: 10.1038/366156a0. [DOI] [PubMed] [Google Scholar]
- 41.Tareilus E, Roux MJ, Qin N, Olcese R, Zhou J, Stefani E, Birnbaumer L. A Xenopus oocyte β subunit: evidence for a role in the assembly/expression of voltage-gated calcium channels that is separate from its role as a regulatory subunit. Proc Natl Acad Sci USA. 1997;94:1703–1708. doi: 10.1073/pnas.94.5.1703. [DOI] [PMC free article] [PubMed] [Google Scholar]
- 42.Wanke E, Ferroni A, Malgaroli A, Ambrosini A, Pozzan T, Meldolesi J. Activation of a muscarinic receptor selectively inhibits a rapidly inactivated Ca2+ current in rat sympathetic neurons. Proc Natl Acad Sci USA. 1987;84:4313–4317. doi: 10.1073/pnas.84.12.4313. [DOI] [PMC free article] [PubMed] [Google Scholar]
- 43.Wei X, Perez-Reyes E, Lacerda AE, Schuster G, Brown AM, Birnbaumer L. Heterologous regulation of the cardiac Ca2+ channel α1 subunits by skeletal muscle β and γ subunits. J Biol Chem. 1991;266:21943–21947. [PubMed] [Google Scholar]
- 44.Wheeler DB, Randall A, Tsien RW. Roles of N-type and Q-type Ca2+ channels in supporting hippocampal synaptic transmission. Science. 1994;264:107–111. doi: 10.1126/science.7832825. [DOI] [PubMed] [Google Scholar]
- 45.Wheeler DB, Randall A, Tsien RW. Changes in action potential duration alter reliance of excitatory synaptic transmission on multiple types of Ca2+ channels in rat hippocampus. J Neurosci. 1996;16:2226–2237. doi: 10.1523/JNEUROSCI.16-07-02226.1996. [DOI] [PMC free article] [PubMed] [Google Scholar]
- 46.Williams ME, Brust PF, Feldman DH, Patthi S, Simerson S, Maroufi A, McCue AF, Velicelebi G, Ellis SB, Harpold MM. Structure and functional expression of an ω-conotoxin-sensitive human N-type calcium channel. Science. 1992;257:389–395. doi: 10.1126/science.1321501. [DOI] [PubMed] [Google Scholar]
- 47.Wollmuth LP, Shapiro MS, Hille B. Pancreatic polypeptide inhibits calcium channels in rat sympathetic neurons via two signaling pathways. J Neurophysiol. 1995;73:1323–1328. doi: 10.1152/jn.1995.73.3.1323. [DOI] [PubMed] [Google Scholar]
- 48.Zhang J-F, Ellinor PT, Aldrich RW, Tsien RW. Multiple structural elements in voltage-dependent Ca2+ channels support their inhibition by G proteins. Neuron. 1996;17:991–1003. doi: 10.1016/s0896-6273(00)80229-9. [DOI] [PubMed] [Google Scholar]