

Abstract
Spontaneous, rhythmic waves of excitation in the developing mammalian retina play a critical role in the formation of precise neuronal connectivity in the visual system. However, it is not known what circuits in the retina are responsible for the production of these waves. Using patch-clamp recordings in the whole-mount neonatal rabbit retina, this study reports that the displaced starburst amacrine cell, a unique cholinergic interneuron in the ganglion cell layer of the retina, undergoes rhythmic bursts of membrane depolarization with a frequency and duration similar to those of spontaneous retinal waves. Simultaneous patch-clamp recordings from pairs of neighboring starburst and ganglion cells show that the rhythmic activity in starburst cells is closely correlated with that in ganglion cells, and that the excitation in both cell types is most likely driven by synaptic input. However, in contrast to ganglion cells, displaced starburst cells usually do not generate spontaneous somatic action potentials. Instead, they seem to use subthreshold potentials (at least at the soma) to mediate the rhythmic excitation. The results suggest that acetylcholine is likely released rhythmically in the developing retina. Thus, starburst amacrine cells form the first identified network of retinal interneurons that directly participate in spontaneous rhythmic activities in the developing retina.
Keywords: cholinergic amacrine cell, ganglion cell, mammalian retina, rhythmic excitation, whole-cell patch clamp, visual development
The development of specific synaptic circuitry in the CNS often requires the presence of neuronal electric activity (Constantine-Paton et al., 1990; Kalil, 1990; Cook, 1991;Bodnarenko and Chalupa, 1993; Goodman and Shatz, 1993; Katz and Shatz, 1996). In the developing vertebrate retina, synchronized bursts of spontaneous action potentials in ganglion cells (Masland, 1977; Maffei and Galli-Resta, 1990; Meister et al., 1991; Sernagor and Grzywacz, 1996) are believed to play a critical role in the formation of precise neuronal connectivity in the visual system (Cline, 1991; Goodman and Shatz, 1993; Wong, 1993; Sernagor and Grzywacz, 1996; Shatz, 1996; Wong and Oakley, 1996). However, the mechanism by which spontaneous activities are generated in the retina is still unknown. Recent studies suggest that correlated spikes in ganglion cells of the immature mammalian retina may be driven, at least in part, by neurotransmitter input (Feller et al., 1996). It seems that a specific retinal network, most likely involving both retinal interneurons and ganglion cells (Wong et al., 1995; Feller et al., 1996), may participate in mediating the spontaneous activity, although very little is known about the circuitry or the physiology of this network. To understand how interactions within such a network may mediate spontaneous waves of excitation, it is essential to identify major types of neurons, in addition to ganglion cells, that participate in the circuitry. It is also important to understand the function of these identified interneurons.
In the developing ferret retina, correlated waves of excitation occur spontaneously before eye opening (Meister et al., 1991; Wong et al., 1995; Feller et al., 1996). These spontaneous activities are most prominent during the period when eye-specific layers in the lateral geniculate nucleus are being formed (Wong et al., 1993, 1995; for waves at a later stage, see Wong and Oakley, 1996). At this early stage of visual development, only conventional synapses are seen in the inner plexiform layer (IPL) of the retina, suggesting that the major synaptic input to ganglion cells is from amacrine cells, because ribbon synapses at bipolar cell synaptic terminals are not yet developed (Greiner and Weidman, 1981). The electrophysiological properties of amacrine cells during development are so far unclear. Earlier attempts of intracellular recordings failed to show any rhythmic changes in the membrane potential of amacrine cells in the developing ferret retina (Wong et al., 1993). More recently, optical imaging from amacrine cells (identified on the basis of their soma size and location in the developing ferret retina) have shown that some of these cells undergo oscillations in intracellular calcium concentration (Wong et al., 1995;Stellwagen et al., 1997).
Of particular interest is a type of amacrine cell named “starburst” (Famiglietti, 1983), which is the only cholinergic cell type and the only amacrine cell using an excitatory neurotransmitter in the adult mammalian retina (for review, see Masland and Tauchi, 1986) (Vaney 1990; Wässle and Boycott, 1991). They exist in the IPL as two mirror symmetric populations, each ramifying in one of the two narrow strata in the IPL (Hayden et al., 1980; Vaney et al., 1981;Famiglietti, 1983, 1985). The cells stratifying near the proximal margin (sublamina b) of the IPL have their cell bodies displaced to the ganglion cell layer and are called displaced starburst amacrine cells.
Recent calcium imaging studies of the immature ferret retina show that the propagation of spontaneous retinal waves in the ganglion cell layer requires cholinergic synaptic transmission (Feller et al., 1996), indicating that starburst cells play an important role. Patch-clamp recordings in rabbit retinal slices (Zhou and Fain, 1996) also show that displaced starburst amacrine cells undergo a surprising transition in their membrane excitability (from being able to generate spikes to nonspiking) just around eye opening, a time when correlated retinal waves also disappear (Wong et al., 1993). Thus, it seems possible that starburst cells play a crucial role in the generation and, perhaps, also the termination of spontaneous waves in the developing retina. An important task at this point is to prove whether starburst cells directly participate in rhythmic waves of excitation in the developing retina and to understand their physiological function in wave production.
As a first attempt to understand electrophysiologically the functional role of identified retinal interneurons in spontaneous waves of excitation, this study made whole-cell patch-clamp recordings from morphologically identified displaced starburst amacrine cells and pairs of neighboring starburst and ganglion cells in a whole-mount preparation of the neonatal rabbit retina. These recordings unequivocally demonstrate a direct participation of displaced starburst cells in spontaneous rhythmic activities in the developing retina. They also show that displaced starburst cells undergo rhythmic bursts of subthreshold somatic depolarizations that are closely correlated with bursts of spikes in neighboring ganglion cells and that both displaced starburst cells and ganglion cells receive rhythmic synaptic input.
Preliminary results have been reported in abstract form (Zhou, 1997).
MATERIALS AND METHODS
Rabbit retinal preparation. Retinas from pigmented (Dutch Belt and New Zealand Red) and nonpigmented (New Zealand White) rabbits aged between postnatal day 0 (P0, day of birth) and P6 were used for this study. No significant differences in the spontaneous activity of ganglion and amacrine cells were found among these strands of rabbits. Animals were killed with an overdose of Nembutal, and their eyes were immediately enucleated and hemissected behind the ora serrata. Retinas were isolated from eyecups in Ames medium (Sigma, St. Louis, MO) saturated with carbogen (95% O2, 5% CO2) at either room temperature (21–25°C) or 4°C. Each isolated retina was then cut into two to three pieces and incubated in carbogen-saturated Ames medium for periods between 0.5 and 8 hr at room temperature. In some earlier experiments, the fluorescent dye 4,6-diamidino-2-phenylindole (DAPI, 0.1 μg/ml) was included in the incubation medium during the first 1–2 hr of incubation in an effort to facilitate the identification of displaced starburst cells. In contrast to the selective staining of displaced starburst cells by DAPI in the adult rabbit retina (Tauchi and Masland, 1984), incubation with DAPI (or intravitreous injection of the dye) did not label displaced starburst cells exclusively (Wong and Collin, 1989; Zhou and Fain, 1996). Although displaced starburst cells and many other cell types were labeled by DAPI after 1 hr incubation, some small-size cell types in the ganglion cell layer were excluded from the labeled population. Thus the probability of finding displaced starburst cells was increased to some extent after incubation with DAPI. With experience, however, it was found that DAPI labeling was unnecessary in most cases, because identification based solely on the size, shape, and location of cells in the ganglion cell layer already yielded a high success rate (∼80%) of finding displaced starburst cells. Definitive identification of a starburst cell was always made morphologically under epifluorescent illumination at the end of the whole-cell patch clamp with Lucifer yellow-filled pipettes. Identification of ganglion cells was made based on their large soma size and the presence of an axon. No systematic effort was made to classify ganglion cell subtypes.
Patch-clamp recording. For electrophysiological recordings, a piece of retina was transferred to a recording chamber and held to the bottom of the chamber, sclera side down, by a nylon mesh glued to a platinum ring. The recording chamber was continuously superperfused with cabogen-saturated Ames medium at a rate of 4–5 ml/min at 34–37°C. Patch-clamp recordings were made from the whole-mount retina under a 40× water immersion objective lens on a fixed-stage upright microscope (Axioskop FS; Zeiss, Thornwood, NY) equipped with differential interference contrast optics, epifluorescence, and a 35 mm camera. Glial cells and Müller cell endfeet that covered the neurons in the ganglion cell layer were removed mechanically with a large-tip patch pipette or a pair of fine forceps. Whole-cell patch clamp, with a seal resistance >4 GΩ, was made under visual control from displaced starburst amacrine cells and ganglion cells with 2–5 MΩ resistance electrodes pulled from thick-walled borosilicate filament glass tubing (1.5 mm outer diameter, 0.86 mm inner diameter; Sutter Instruments, San Rafael, CA) on a Flaming–Brown pipette puller (model P97, Sutter Instruments). Series resistance, typically between 8 and 15 MΩ, was compensated by 20–85% with the series resistance compensation circuitry in the patch-clamp amplifier (Axopatch 200B; Axon Instruments, Burlingame, CA). The resting membrane potential (Vr) was measured in the current-clamp mode (I = 0) immediately after the formation of the whole-cell clamp configuration. Because of the limited seal resistance after the formation of a whole-cell configuration in some cells, the measured Vr was likely an underestimate of the truein vivo resting potential of the cell. To minimize this error, only the lower one-third of the cell population tested (which had more negative resting potentials and often higher seal and input resistance values) was pooled to produce the mean resting potential and the SD for starburst and ganglion cells. Dual patch-clamp recordings from pairs of neighboring cells were made with two identical patch-clamp amplifiers (Axopatch 200B, Axon Instruments). Data obtained from both amplifiers were low-pass filtered at 2 kHz (fc, eight-pole Bessel filter built in the Axopatch 200B amplifier), digitized simultaneously with an analog-to-digital converter (Digidata 1200, Axon Instruments), and stored on a computer hard disk. Data generated during long periods (up to 2 hr) of continuous recordings were also stored on VCR tapes through a pulse code modulator (model 501; Sony, Tokyo, Japan; 44 kHz sampling rate, 14 bit resolution) and later played back for analysis. These data were refiltered with an eight-pole Bessel filter (model 901; Frequency Device, Haverhill, MA) at corner frequencies (fc) two to five times lower than the Nyquist frequency and were digitized at sampling rates specified in figure legends. The liquid junction potential was corrected as described (Fenwick et al., 1982; Zhou and Fain, 1995). Data acquisition and analysis were done with pClamp software (Axon Instruments), Axioscope (Axon Instruments), and Origin (MicroCal Software Inc., Northampton, MA).
Because starburst cells and many of the ganglion cells recorded had extensive dendritic trees, voltage clamp at fine distal dendrites was conceivably inadequate, especially when currents were fast and large. However, this relatively poor space clamp should not affect the basic conclusions of this study, because the overall spontaneous activity was relatively slow (lasting 1–2 sec, see Results) and did not depend on dendrites being completely voltage-clamped.
Solutions. The standard intracellular (pipette) solution contained (in mm): 110 KCl, 5 NaOH, 0.5 CaCl2, 2 MgCl2, 5 EGTA, 10 HEPES, 2 ATP (disodium salt, Sigma), 0.5 GTP (trisodium salt, Sigma), and 2 ascorbate, pH 7.2, with 18 mm KOH. This solution was kept frozen at −20°C in small aliquots and was supplemented with 0.1–0.3% w/v Lucifer yellow (Molecular Probes, Eugene, OR) before use. In a small number of experiments, a portion of the KCl (95 mm) in the pipette solution was replaced with equimolar K-gluconate. In all recordings, the extracellular (bath) solution was always Ames medium equilibrated with carbogen.
RESULTS
Anatomical properties of displaced starburst cells in the developing rabbit retina
A total of 56 displaced starburst amacrine cells were studied with whole-cell patch clamp in the whole-mount rabbit retina during the first postnatal week. At this age, the eyes of the animal were not yet open, and the retina was still immature (McArdle et al., 1977; Greiner and Weidman, 1982; Zhou and Fain, 1996). Neurogenesis in the mammalian retina starts from ganglion cells and amacrine cells (Robinson, 1991), which in rabbits become differentiated in late fetal life (Greiner and Weidman, 1982; Stone et al., 1985). By the time of birth, most of the cells in the ganglion cell and amacrine cell layers of the rabbit retina are fully differentiated (McArdle et al., 1977), and displaced starburst amacrine cells have already attained an adult-like dendritic morphology (Wong and Collin, 1989).
Figure 1 gives two examples of displaced starburst cells at different eccentricities of the neonatal rabbit retina photographed immediately after patch-clamp recording with Lucifer yellow-filled pipettes. The cell shown in Figure1A was located near the visual streak of a P3 retina, whereas the one in Figure 1B was from the midperiphery (∼3 mm from the visual streak) of a P0 retina. The morphology of these two cells was typical of all the displaced starburst cells recorded. Their dendrites were nearly radially symmetric and narrowly stratified, with typically four to six primary dendrites originating from soma 8–10 μm in diameter. Each primary dendrite was further divided into a number of secondary and tertiary branches, which formed the intermediate and distal dendritic tree. This basic branching pattern closely resembled that of adult starburst cells (Hayden et al., 1980; Vaney et al., 1981; Famiglietti, 1983, 1985;Tauchi and Masland, 1984; Vaney, 1984). However, two unique features were noted for starburst cells in the neonatal rabbit retina. First, there were numerous dendritic spines in developing starburst cells (Fig. 1) (Wong and Collin, 1989); second, starburst cells of the developing retina lacked localized dendritic varicosities seen in distal dendrites of mature starburst cells (Famiglietti, 1991; Wong and Collin, 1989).
Fig. 1.

Examples of Lucifer yellow-filled displaced starburst amacrine cells photographed immediately after whole-cell patch-clamp recordings in the whole-mount neonatal rabbit retina.A, Cell located near the visual streak of a P3 retina with a patch pipette still attached to the soma. B, Another cell from the inferior midperiphery (∼3 mm from the visual streak) of a P0 rabbit retina. In this and most other cells, the patch pipette was successfully removed from the soma at the end of the recording. A, B, Cells have radially symmetric and narrowly stratified dendrites. The general branching pattern of these cells resembles that of adult starburst cells. However, the numerous dendritic spines seen in these cells are found only in the neonatal retina. Also notice the lack of varicosities that are usually seen in distal dendrites of mature starburst cells. Scale bars, 50 μm.
Although the dendrites of nearly every starburst cell recorded appeared to be completely filled with Lucifer yellow at the end of patch-clamp recording, tracer coupling among starburst cells or between starburst and other cell types was never observed. This result is in agreement with a previous report (Wong and Collin, 1989) and is consistent with the belief that starburst cells do not make gap junctions in adult rabbits (Vaney 1990; Wässle and Boycott, 1991), although the lack of Lucifer yellow coupling alone is not sufficient evidence for starburst cells being not coupled in the neonatal rabbit. It would certainly have important implications for the circuitry of spontaneous waves if starburst cells were indeed not coupled in the neonatal rabbit.
Electrical properties of starburst cells
The intrinsic electrical properties of displaced starburst cells in the developing rabbit retina were studied under both current- and voltage-clamp conditions. The resting membrane potential was measured under current-clamp (I = 0) immediately on the formation of a whole-cell patch clamp configuration when the cell was minimally dialyzed (see Materials and Methods). Recordings from displaced starburst cells revealed a relatively low (hyperpolarized) resting membrane potential (Vr) of −70 ± 4 mV (SD, n = 19; see Materials and Methods) in Ames medium (Ames and Nesbett, 1981). This was significantly more hyperpolarized than the ganglion cells recorded under the same condition (mean Vr ± SD, −49 ± 5 mV, n = 10). The difference in resting membrane potential between starburst and ganglion cells may partially contribute to the different excitability of the two cell types (see below). Frequently, it was also found that the membrane potential of starburst cells became gradually hyperpolarized by an additional 3–8 mV from the original resting potential during the first 1–3 min after the formation of the whole-cell configuration, possibly attributable to intracellular dialysis and/or a gradual increase in seal resistance.
Figure 2, A and B, shows voltage- and current-clamp results from a starburst cell in a P0 rabbit retina. Whole-cell currents, shown here after leak subtraction, were elicited by depolarizing voltage steps of 10 mV increments from a holding potential (Vh) of −70 mV (Fig.2A). This overall current waveform contained both inward and outward components, typical in all starburst cells tested. The transient inward current component consisted mainly of Na+ currents, because the amplitude of the transient Ca2+ current was quite small under this recording condition (Zhou and Fain, 1996). The space clamp of these Na+ currents appeared rather poor (as evident from the current–voltage relationship and sometimes multiple peaks of Na currents under voltage–clamp) (data not shown), suggesting that a significant portion of the currents may be from the dendrites. Note that, when compared with the peak amplitude of outward K currents, the inward Na+ current component in starburst cells was usually much smaller, often by a factor of 3–8 in the voltage range tested (−60 to +60 mV). This current profile was in clear contrast with that of the ganglion cells tested, because the peak Na+ current amplitude in ganglion cells was usually equivalent to or larger than that of outward K currents (Fig.2C). Similarly, voltage responses of starburst cells under current clamp were characteristically different from those of ganglion cells. Figure 2B shows the membrane potential of the same starburst cell as in Figure 2A in response to depolarizing current pulses of 200 pA increments injected under current clamp at a holding potential near the resting membrane potential. The starburst cell responded to a prolonged current pulse with a single spike. The threshold for somatic action potentials in the starburst cell was between −30 and −35 mV (Fig. 2B). On the other hand, the threshold for somatic action potentials in the ganglion cell was approximately −45 mV (Fig. 2D). Action potentials in ganglion cells were also considerably larger and faster than those in starburst cells (Fig. 2C,D) and often consisted of multiple spikes during prolonged depolarizing current injections (data not shown). Similar results were obtained for all the starburst and ganglion cells tested.
Fig. 2.

Membrane electric properties of displaced starburst (A, B, P0 retina) and ganglion cells (C, D, P3 retina). Currents shown here have been corrected for membrane leakage. A,Whole-cell currents from the starburst cell elicited by depolarizing voltage steps (13 steps in 10 mV increments) under voltage clamp from a Vh of −70 mV. The transient inward currents are carried mostly by Na+. B, Voltage responses from the same starburst cell to depolarizing current pulses of 200 pA increments under current clamp at approximately −70 mV. As in nearly all of the starburst cells tested, the action potentials in this cell contain a single spike and have an activation threshold between −30 and −35 mV. C, Whole-cell currents from a ganglion cell voltage-clamped at −70 mV in response to the same voltage protocol as in A. Compared with starburst cells, the ganglion cell has significantly larger inward Na+ currents, with the maximum amplitude similar to or larger than that of the outward K+ currents. D, Voltage responses of the ganglion cell in C to depolarizing current pulses of 80, 100, 140, and 160 pA in amplitude. The action potentials in the ganglion cell are larger and faster than those in the starburst cellB and have a threshold around −45, which is significantly lower than that in starburst cells. Data shown in this figure were filtered at 2 kHz and digitized at 10–40 kHz.
Rhythmic, spontaneous excitation of starburst cells in the developing retina
To investigate the spontaneous activity of displaced starburst cells, continuous voltage- and current-clamp recordings were made from these cells at their resting membrane potential. Displaced starburst cells recorded under this condition underwent periodic, spontaneous membrane excitation. Figure 3 shows a segment of continuous current-clamp recording from the same P0 starburst cell as shown in Figure 2. The cell was generally quiet except for brief moments lasting a few seconds during which bursts of activities occurred abruptly. The bursts of membrane depolarization appeared rhythmically once every 1–1.5 min and continued for the entire recording period of ∼2 hr. Each burst consisted of a slow membrane depolarization and many small-amplitude activities riding atop (Fig.3B).
Fig. 3.

Rhythmic activities from the same starburst cell in Figure 2A,B. The cell was current-clamped at its resting membrane potential.A, Segment of continuous recording showing rhythmic bursts of membrane depolarization from the cell (upward deflections). The bursting activity in this cell occurred regularly at a rate of once every 1–1.5 min throughout the entire recording period of ∼2 hr. B, One of the bursts inA (arrow) shown on a faster time scale. The burst was ∼2 sec long and 5 mV in amplitude, and it consists of a slow depolarization with small peaks riding atop. Data shown in this figure were filtered at 200 Hz and digitized at 1.2 Hz.
Similar spontaneous activities were found in another 31 displaced starburst amacrine cells recorded from rabbits aged between P0 and P6 (but see the last paragraph in Results). Shown in Figure4 is another example of a displaced starburst cell from a P1 retina recorded first under current clamp and then under voltage clamp at a holding potential near its resting potential. This cell showed spontaneous bursts of excitation with a period of 1.5–2.5 min. One of these bursts is shown on an expanded time scale in Figure4B. The time course of these bursts was relatively slow, on the order of 1–2 sec (Fig. 4B). In general, the duration of these spontaneous bursts was quite consistent for each starburst cell and varied little from cell to cell (within 1–3 sec). On the other hand, the peak amplitude of the depolarization often varied from time to time and from cell to cell in the range between 5 and 30 mV. The interburst interval also varied considerably from cell to cell, ranging between 40 sec and 5 min.
Fig. 4.

The pattern of spontaneous bursts from a P1 displaced starburst cell under current and voltage clamp.A, Continuous patch-clamp recording first under current clamp (I = 0, top 5 traces) and then voltage clamp (−80 mV, bottom 2 traces). Periodic bursts of membrane depolarization are shown as upward deflections under current clamp, whereas rhythmic inward currents are seen as downward deflections under voltage clamp. The average interburst duration (∼2 min) is the same in either recording mode. To test the spiking capability of the cell, depolarizing current pulses were also injected into the cell during an early part of the recording (arrow). Data shown in A were filtered at 5 Hz and digitized at 15 Hz. B, One of the bursts of membrane depolarization (A, arrow) is shown on an expanded time scale. The burst consists of many superimposed fast events reminiscent of postsynaptic potentials. Data shown in this panel were filtered at 600 Hz and digitized at 1.67 kHz.C, Closer view of the voltage responses to depolarizing current pulses shown in A (first trace). The cell is obviously capable of generating somatic potentials, which have a characteristic single-spike profile and an activation threshold of approximately −35 mV. The cell was current-clamped at its resting membrane potential and was depolarized by current steps of 50 pA increments. Data were filtered at 2 kHz and digitized at 10 kHz. D, Closer view of a spontaneous burst of synaptic currents in A (last trace). The burst consists of numerous fast synaptic currents and lasts ∼2–3 sec. The inset shows a few of these synaptic currents in more detail. Data were filtered at 600 Hz and digitized at 1.67 kHz.
Interestingly, spontaneous activation of somatic action potentials was never seen in any of the starburst cells tested (when the cell was current-clamped either near its resting membrane potential or within ±20 mV from the resting potential), although action potentials could be elicited from these cells by injecting depolarizing current pulses under current clamp. Figure 4C shows voltage responses to current pulses of 50 pA increments from the same starburst cell in Figure 4A. Somatic action potentials were clearly evoked by whole-cell current injections (Fig. 4C) during the silent period between bursts of spontaneous excitation (Fig.4A). Similar spikes could also be elicited immediately (within 1 sec) before or after a spontaneous bursting event (data not shown). This result suggests that, if there is a refractory period between two successive spontaneous waves of excitation in the ganglion cell layer (Feller et al., 1997), such refractoriness may not be caused by the inability of the starburst cell to fire somatic or dendritic action potentials during this period.
From Figure 4, it seemed likely that bursts of spontaneous membrane depolarization in starburst cells were a result of nearly synchronous activation of many postsynaptic potentials (PSPs), although it was also possible that some of the small, fast peaks might even be dendritic spikes evoked by the PSPs (see Discussion). Voltage-clamp experiments from displaced starburst cells at their resting membrane potential also showed bursts of inward currents reminiscent of postsynaptic currents (although extrasynaptic currents might also be involved). The bottom two traces in Figure 4A show membrane currents from the same starburst cell immediately after the recording was switched from the current-clamp to the voltage-clamp mode. The cell under voltage clamp continued to display bursts of spontaneous activities [postsynaptic currents (PSCs)] with a similar frequency. Each burst under voltage clamp contained numerous fast synaptic currents (Fig.4D). The burst duration (1–3 sec) was similar in either current clamp or voltage clamp. The kinetics of the PSCs under voltage clamp was also comparable to that of PSPs under current clamp. Together, these results provide evidence that the periodic membrane depolarizations seen under current clamp were produced by rhythmic bursts of synaptic currents. Thus the spontaneous rhythmic activity in the starburst cell seemed to be synaptically driven but not intrinsically generated, at least within a single cell.
Rhythmic activities of ganglion cells
To compare the rhythmic excitation of starburst cells with the activities of ganglion cells in the developing rabbit retina, whole-cell patch clamp recordings were made from ganglion cells under the same condition as described above. Ganglion cells were identified based on their large soma size (10–30 μm in diameter) and the presence of an axon. Figure 5 shows an example of spontaneous activities from a ganglion cell in a P0 retina. This cell was recorded under current clamp near its resting membrane potential of −53 mV. Spontaneous bursts of action potentials were observed once every 1–2 min with little activity between bursts. Each burst lasted ∼2 sec and contained 3–5 large spikes (60–100 mV in amplitude). One of the bursts is shown in more detail in Figure5B. The bursting action potentials in this cell consisted of a fast spike followed by a distinctive plateau potential.
Fig. 5.

Spontaneous bursts of action potentials in a P0 ganglion cell. A, Current-clamp recording showing bursts of action potentials occurring at a frequency of once per 1–2 min. The cell was held near its resting membrane potential of −53 mV.B, Expanded view of the first burst shown inA. This burst consists of a train of four action potentials, each having a large spike amplitude and a distinctive plateau potential. Data were filtered at 10 Hz (sampled at 20 Hz) inA and at 200 Hz (sampled at 500 Hz) in B. Because of the low filter frequency, the spike amplitude inA appears much smaller.
Rhythmic activities were also found in another 21 ganglion cells tested during the first postnatal week. In most of these ganglion cells, the duration of spontaneous bursts was on the order of 1–3 sec, similar to that of displaced starburst cells. The interburst interval in ganglion cells was also similar to that of starburst cells (40 sec–5 min), suggesting that the spontaneous activities of ganglion and starburst cells belonged in the same retinal waves. However, unlike displaced starburst cells whose bursting patterns were primarily homogeneous among all the cells tested, ganglion cells often had a variety of bursting behavior. Although the majority of ganglion cells had similar ranges of burst frequencies and duration, detailed burst properties varied considerably in some ganglion cells, presumably as a result of the differences among various ganglion cell subtypes. Figure6A shows results from a P3 ganglion cell under current clamp. This cell underwent rhythmic bursts of excitation separated by a silent period of ∼45 sec. Note, however, that most of the bursting activities in this cell occurred in distinctive doublets instead of the singular bursts typically seen in most ganglion cells. Another example from the same P3 retina is shown in Figure 6, B–D. This ganglion cell again showed rhythmic bursting activities at the usual frequency of about once per minute, but the burst duration (20–40 sec) was significantly longer than the 1–3 sec duration usually found in other cells. Each burst in this cell contained a train of numerous spikes. Figure 6E shows yet another ganglion cell from a P5 retina voltage-clamped at a holding potential of −70 mV. Spontaneous activities of this cell, shown here as inward postsynaptic currents, were highly periodic throughout the entire 1 hr period of recording. The peak amplitude of the PSCs decayed monophasically in each burst. The burst duration in this cell was also longer than that of most other ganglion cells recorded.
Fig. 6.
Examples of different patterns of spontaneous activities seen in a small number of ganglion cells. A,Current-clamp recording from a P3 ganglion cell showing spontaneous bursting activities occurring in doublets. The overall interburst interval in this cell is once every 1–3 min, similar to that found in most ganglion cells. Data were filtered at 10 Hz and digitized at 20 Hz. B, Rhythmic activities from another ganglion cell current-clamped in the same P3 retina as in A. The bursts shown here have a much longer duration (20–50 sec) and consist of clusters of shorter bursts. The interburst interval is well within the range of 1–3 min. Data in this panel were filtered at 10 Hz and digitized at 20 Hz. The amplitude of the spikes shown here is much smaller than in D because of heavy filtering.C, Expanded view of a burst in B. Data were filtered at 100 Hz and digitized at 200 Hz. D, Two spontaneous action potentials in B shown on a faster time scale. Data were filtered at 2 kHz and digitized at 10 kHz. E,Voltage-clamp recording (Vh = −70 mV) from a ganglion cell in a P5 retina showing highly periodic bursts of synaptic currents at a frequency of approximately one per minute. The burst duration in this cell is of the order of 30 sec, which is much longer than in most other cells. Data were filtered at 50 Hz and sampled at 100 Hz.
Figure 6D also makes the point that rhythmic bursts of action potentials in neonatal rabbit ganglion cells were most likely associated with periodic bursts of synaptic currents. Similar voltage- and current-clamp recordings from five other ganglion cells (data not shown) also confirmed the correlation between bursts of spikes under current clamp and PSCs under voltage clamp, suggesting that spontaneous bursts of spikes in neonatal rabbit ganglion cells were driven, to a large extent, by synaptic input.
Thus both ganglion cells and starburst cells underwent rhythmic membrane excitation. The interburst duration in both cell types ranged between 40 sec and 5 min. However, starburst and ganglion cells differed markedly with respect to the nature of the burst. Although displaced starburst cells typically produced homogeneous bursts of subthreshold membrane depolarization, ganglion cells usually generated bursts of suprathreshold somatic spikes with inhomogeneous burst kinetics. Ganglion cells of different morphology were included in the sample and might have contributed to the inhomogeneity in burst kinetics. No systematic effort was made in the present study to correlate ganglion cell responses with cell types.
Correlation between spontaneous activities of displaced starburst cells and ganglion cells
One of the most important features of the spontaneous activity in the developing retina is its spatiotemporal pattern. Synchronous bursts of action potentials among ganglion cells have been previously reported in rat (Maffei and Galli-Resta, 1990) and ferret (Meister et al., 1991) with extracellular electrodes. To determine whether spontaneous bursts of subthreshold excitation of displaced starburst cells were also in synchrony with bursts of action potentials of neighboring ganglion cells, dual patch-clamp recordings were made from pairs of displaced starburst cells and ganglion cells. Figure 7shows a fluorescence photomicrograph of a pair of starburst and ganglion cells in a P1 retina immediately after dual patch-clamp recording. Temporally correlated activities were indeed found in pairs of neighboring starburst and ganglion cells (n = 3). Whole-cell current- and voltage-clamp recordings from one of these pairs of cells are shown in Figure 8. Recordings from this cell pair lasted 35 min during which both cells continuously underwent rhythmic bursts of excitation. The ganglion cell (Fig. 8A, top traces) was voltage-clamped at −70 mV during the entire period shown in the figure, whereas the displaced starburst cell (bottom traces) was recorded first under current clamp at its resting potential (−70 mV) and then under voltage clamp at the same potential.
Fig. 7.
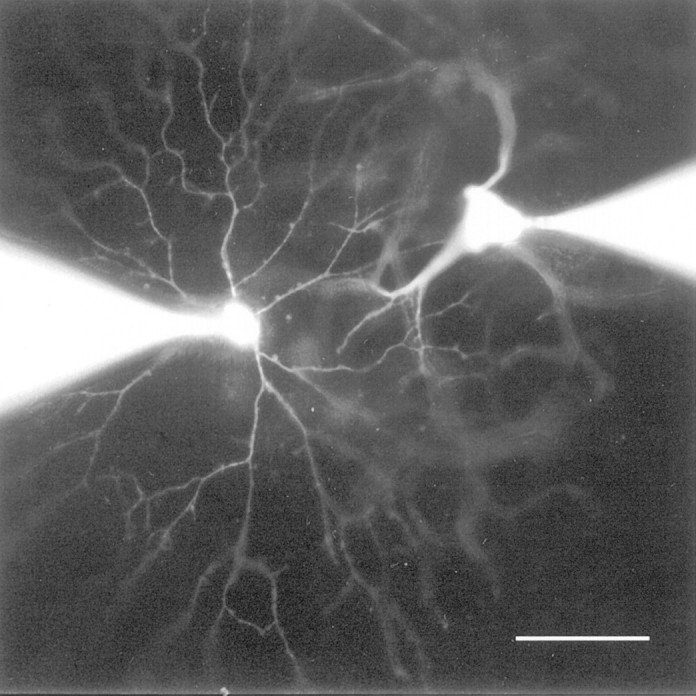
Fluorescence photomicrograph of a pair of neighboring starburst (left) and ganglion (right) cells in a P0 rabbit retina immediately after simultaneous patch-clamp recording with pipettes filled with Lucifer yellow. Scale bar, 50 μm.
Fig. 8.

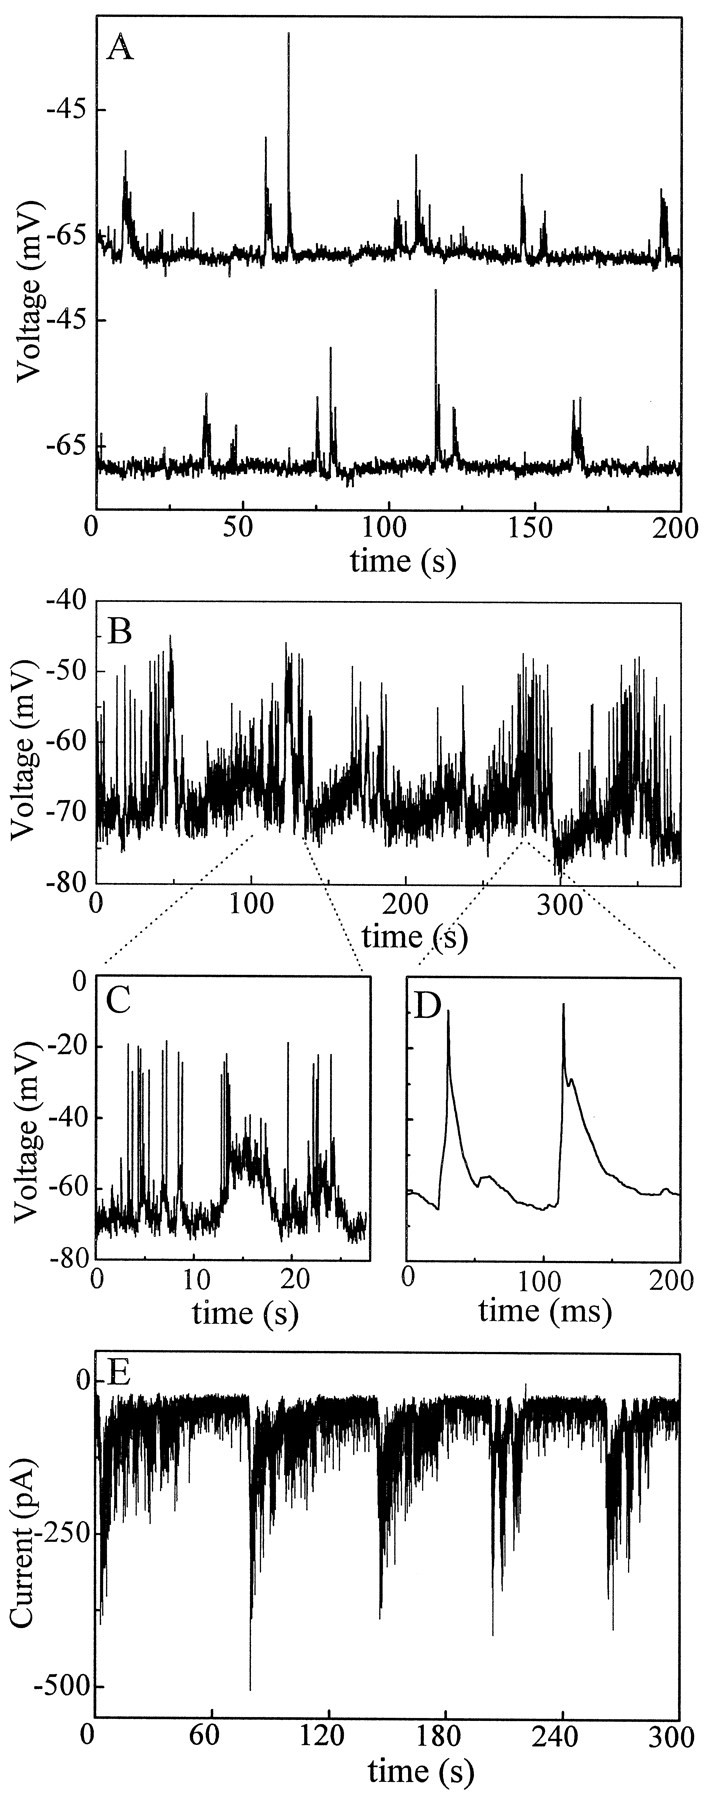
An example of a dual patch-clamp recording from a pair of starburst and ganglion cells showing close correlation between the spontaneous activities in the two cells. A, 20 min segment of dual recording from the ganglion cell under voltage clamp at −70 mV (upper trace) and a nearby displaced starburst cell under first current clamp (I = 0,bottom left trace) and then voltage clamp (Vh = −70 mV, bottom right trace). Spontaneous bursts of excitation in the ganglion cell are shown as brief inward synaptic currents (downward deflections), and those from the starburst cell are shown as bursts of either membrane depolarization (upward deflections,bottom left) or inward synaptic currents (downward deflections, bottom right). Every burst in the starburst cell matches closely in time a burst in the ganglion cell. Data were filtered at 7 Hz and digitized at 20 Hz.B, C, Expanded view of the temporal correlation between two pairs of bursts shown in A. Data were filtered at 700 Hz and digitized at 2 kHz.
Rhythmic activities from these two adjacent cells were precisely synchronized. Every burst of inward synaptic currents in the ganglion cell matched closely in time a burst of either membrane depolarization (under current clamp) or inward PSCs (under voltage clamp) in the starburst cell (Fig. 8A). The precise correlation between the activities of this pair of ganglion and starburst cells is more clearly seen on a faster time scale in Figure 8, B andC. In addition to the temporal synchrony, there was also a significant degree of correlation between the amplitude of the spontaneous activities in these two cells. A large (or small) burst in the ganglion cell tended to be accompanied by a large (or small) burst in the starburst cell (Fig. 8A). Thus the spontaneous rhythmic activity of starburst cells was closely correlated with the synchronous, spontaneous spikes of the neighboring ganglion cells.
Variability of the preparation
It should be pointed out that the ability to detect spontaneous activities form starburst cells and ganglion cells in the whole-mount preparation varied significantly from retina to retina, such that rhythmic activities were found only in ∼65% of the retinas tested. This variability seemed related to the condition of the preparation, rather than differences among individual starburst and ganglion cells, because either most of the starburst and ganglion cells recorded in a retina showed rhythmic spontaneous activities or none of them had any consistent bursting activity. Similarly, the overall robustness of the spontaneous activity also appeared to be affected by the condition of the preparation. It is possible that subtle changes in experimental conditions may contribute to this variability because the spontaneous activity seemed quite labile in the isolated rabbit retina. However, there might also be variability among individual animals, attributable, for example, to differences in developmental stages (even at the same age) although no consistent correlation has yet been found between the rhythmic activity and animal age (P0–P6). The exact cause for this variability is still under investigation. It will be interesting to find out if this variability becomes much less significant in younger (prenatal) rabbits.
DISCUSSION
This study directly demonstrates that displaced starburst cells undergo rhythmic bursting excitation in the neonatal rabbit retina. The frequency and duration of these bursts are similar to those of spontaneous Ca2+ waves previously seen in the developing mammalian retina (Wong et al., 1995; Feller et al., 1996). Dual patch-clamp recordings also show that the periodic excitation in starburst cells is closely correlated with that in neighboring ganglion cells. Together these results provide convincing evidence that displaced starburst cells are indeed a part of the retinal circuit that participates in spontaneous retinal waves, thus demonstrating a direct participation by retinal interneurons in rhythmic bursts of excitation in the developing mammalian retina. These results also indicate that ACh is likely released rhythmically and concomitantly with retinal waves. Because the propagation of spontaneous retinal waves is blocked by cholinergic antagonists (Feller et al., 1996), it is most likely that starburst cells constitute a critical component of the circuit, and they are not simply bystanders being excited at the same time as the ganglion cells. The finding that displaced starburst cells do not generate somatic action potentials during periodic bursts of excitation suggests that not all neurons in the circuit fire action potentials. Instead, some interneurons may use subthreshold excitation (graded membrane potentials) to mediate synchronous firings in ganglion cells.
The fact that action potentials can be evoked from displaced starburst cells by injections of current pulses under current clamp (Figs. 2, 4) confirms the previous finding in rabbit retinal slices that starburst cells are capable of firing somatic action potentials before eye opening (Zhou and Fain, 1996). TTX-sensitive spikes and Na currents in starburst cells of the rabbit retina were also reported (Zhou and Fain, 1996) to disappear right around eye opening (but see also Bloomfield, 1992; Jensen, 1995; Taylor and Wässle, 1995; Peters and Masland, 1996). Thus, one might expect starburst cells to use action potentials for a developmental purpose and not just to be artificially induced to spike by extrinsic current injections. It is somewhat surprising that spontaneous somatic spikes in neonatal starburst cells were never observed in this study, even during rhythmic bursts of excitation. A possible explanation for this result may be that action potentials are not required at the starburst cell soma. Instead, the cell may use spikes in the dendrites. It has been estimated the passive propagation of signals in starburst dendrites is severely attenuated because of the long and extremely thin dendritic structure (Miller and Bloomfield, 1983). However, according to computational simulations (my unpublished observations), such spatial attenuation may be relieved significantly by the presence of dendritic Na+ channels at a density similar to that found in these experiments (Zhou et al., 1996). Thus it is conceivable that action potentials may be used in starburst dendrites to facilitate the spread of synaptic signals. However, these dendritic spikes may be unable to trigger a somatic action potential because of a severe impedance mismatch at the soma and, as a result, they appear as subthreshold potentials at the soma. It is possible that spike initiation is easier in starburst dendrites than at the soma, because of larger input impedance and stronger, more synchronized synaptic inputs in local dendritic domains. In fact, the lack of somatic action potentials in starburst cells may likely serve specific functions within the circuit. For example, because starburst dendrites are radially symmetric, an action potential at the soma is expected to induce a centrifugal spread of excitation from a focal point (the soma) that would be incompatible with the way most spontaneous waves are known to propagate across local domains of the retina (Feller et al., 1996). Thus, by generating subthreshold somatic responses, the starburst cell may enable its dendrites to function more autonomously, so that waves of all directions may be mediated by the cell.
Another interesting finding that emerged from this study is that both ganglion and starburst cells seemed to receive rhythmic synaptic inputs, suggesting that extrinsic, periodic input, instead of intrinsic oscillation in single starburst cells, plays a dominant role in mediating the rhythmic activity in starburst cells. This finding raises an important question for future investigation: what cells drive the starburst cells? Because there has been as yet no evidence that starburst cells are coupled to other cells via gap junctions, the input to starburst cells is likely mediated by chemical substances (e.g., neurotransmitters, neuromodulators, and possibly ions) from other cells, perhaps including starburst cells themselves. Thus, spontaneous waves of excitation in the developing retina are likely mediated by a network that includes ganglion cells and more than one type of interneuron. Indeed, from a small number of displaced, nonstarburst amacrine cells encountered in this study (data not shown), it seems there are also other interneurons involved in spontaneous activities. This would suggest that other neurotransmitters may also participate in signal transmission within the network (see also Shield et al., 1996). Detailed pharmacological studies of the spontaneous activity in starburst and other cell types, which are currently under way, will likely provide important information for further understanding of the synaptic circuitry of this network.
That the spontaneous activity in starburst cells is closely correlated with that in nearby ganglion cells sheds important light on the mechanism for the initiation and propagation of retinal waves. Although this result strongly supports a recent model prediction that starburst cells participate in the spontaneous propagation of waves in ganglion cells (Feller et al., 1997), it does not support the scenario that activities in ganglion cells are initiated only when a sufficient number of nearby starburst cells become coactive (Feller et al., 1997). Because starburst cells do not seem to have spontaneous activities more frequently than ganglion cells, it is not likely that waves recorded from ganglion cells are filtered images of the activity in starburst cells (Feller et al., 1997). However, the present study does not exclude the possibility that waves in starburst and ganglion cells are filtered images of activity in other retinal cell types.
It is interesting that the overall pattern of the spontaneous activity is quite homogeneous in the displaced starburst cell population. In contrast, the burst pattern of some ganglion cells was much more variable from cell to cell, although the bursting activity in any particular ganglion cell remained relatively unchanged with time. Thus, ganglion cells with a burst duration much longer than that in neighboring starburst cells might also receive inputs from sources in addition to (or other than) starburst cells. The variability in the burst pattern of ganglion cells may reflect differences among various subtypes of ganglion cells as well as the complexity in the development of various neuronal circuits in the retina (Wong and Oakley, 1996). There may be multiple circuits within the network or multiple cellular mechanisms (Burgi and Grzywacz, 1994) working either in concert or in different developing periods. Recent reports (Catsicas et al., 1997;Sernagor and O’Donovan, 1997; Wong et al., 1997) suggest that ACh may even be able to have an effect on spontaneous retinal activities without conventional synapses during early periods of development and that different transmitter systems may be involved at different developmental stages. More detailed experiments are called for to understand the correlation between starburst amacrine cells and different types of ganglion cells during retinal waves. The results here suggest that starburst cells provide the first opportunity for us to explore the mechanism of wave production at a level presynaptic to ganglion cells. This study also demonstrates that paired patch-clamp recordings in the whole-mount developing rabbit retina, particularly in conjunction with optical imaging, may provide a useful tool for understanding the functional role of starburst amacrine cells and other morphologically identifiable neurons in spontaneous retinal waves.
Footnotes
This work was supported by National Institutes of Health Grant RO1 EY10894, Research to Prevent Blindness Inc., and the University of Arkansas for Medical Sciences Research Endowment Fund. I thank Dr. Gordon L. Fain for scientific discussions and for reading this manuscript.
Correspondence should be addressed to Dr. Z. Jimmy Zhou, Department of Physiology and Biophysics, University of Arkansas for Medical Sciences, 4301 West Markham Street, Mail Slot 505, Little Rock, AR 72205-7199.
REFERENCES
- 1.Ames A, Nesbett FB. In vitro retina as an experimental model of the central nervous system. J Neurochem. 1981;37:867–877. doi: 10.1111/j.1471-4159.1981.tb04473.x. [DOI] [PubMed] [Google Scholar]
- 2.Bloomfield SA. Relationship between receptive and dendritic field size of amacrine cells in rabbit retina. J Neurophysiol. 1992;68:711–725. doi: 10.1152/jn.1992.68.3.711. [DOI] [PubMed] [Google Scholar]
- 3.Bodnarenko SR, Chalupa LM. Stratification of ON and OFF ganglion cells depends on glutamate-mediated afferent activity in the developing retina. Nature. 1993;364:144–146. doi: 10.1038/364144a0. [DOI] [PubMed] [Google Scholar]
- 4.Burgi PY, Grzywacz NM. Model for pharmacological basis of spontaneous synchronous activity in developing retinas. J Neurosci. 1994;14:7426–7439. doi: 10.1523/JNEUROSCI.14-12-07426.1994. [DOI] [PMC free article] [PubMed] [Google Scholar]
- 5.Catsicas M, Catsicas S, Mobbs P. Spontaneous calcium waves in the developing chick retina prior to synaptogenesis. Soc Neurosci Abstr. 1997;23:641. [Google Scholar]
- 6.Cline HT. Activity-dependent plasticity in the visual systems of frogs and fish. Trends Neurosci. 1991;14:104–111. doi: 10.1016/0166-2236(91)90071-2. [DOI] [PubMed] [Google Scholar]
- 7.Constantine-Paton M, Cline HT, Debski E. Patterned activity, synaptic convergence, and the NMDA receptor in developing visual pathways. Annu Rev Neurosci. 1990;13:129–154. doi: 10.1146/annurev.ne.13.030190.001021. [DOI] [PubMed] [Google Scholar]
- 8.Cook JE. Correlated activity in the CNS: a role on every timescale? Trends Neurosci. 1991;14:397–401. doi: 10.1016/0166-2236(91)90028-s. [DOI] [PubMed] [Google Scholar]
- 9.Famiglietti EV. “Starburst” amacrine cells and cholinergic neurons: mirror-symmetric on and off amacrine cells of rabbit retina. Brain Res. 1983;261:138–144. doi: 10.1016/0006-8993(83)91293-3. [DOI] [PubMed] [Google Scholar]
- 10.Famiglietti EV. Starburst amacrine cells: morphological constancy and systematic variation in the anisotropic field of rabbit retinal neurons. J Neurosci. 1985;5:562–577. doi: 10.1523/JNEUROSCI.05-02-00562.1985. [DOI] [PMC free article] [PubMed] [Google Scholar]
- 11.Famiglietti EV. Synaptic organization of starburst amacrine cells in rabbit retina: analysis of serial thin sections by electron microscopy and graphic reconstruction. J Comp Neurol. 1991;309:40–70. doi: 10.1002/cne.903090105. [DOI] [PubMed] [Google Scholar]
- 12.Feller MB, Wellis DP, Stellwagen D, Werblin FS, Shatz CJ. Requirement for cholinergic synaptic transmission in the propagation of spontaneous retinal waves. Science. 1996;272:1182–1187. doi: 10.1126/science.272.5265.1182. [DOI] [PubMed] [Google Scholar]
- 13.Feller MB, Butts DA, Aaron HL, Rokhsar S, Shatz CJ. Dynamic properties shape spatiotemporal properties of retinal waves. Neuron. 1997;19:293–306. doi: 10.1016/s0896-6273(00)80940-x. [DOI] [PubMed] [Google Scholar]
- 14.Fenwick EM, Marty A, Neher E. A patch-clamp study of bovine chromaffin cells and of their sensitivity to acetylcholine. J Physiol (Lond) 1982;331:577–597. doi: 10.1113/jphysiol.1982.sp014393. [DOI] [PMC free article] [PubMed] [Google Scholar]
- 15.Goodman CS, Shatz CJ. Developmental mechanisms that generate precise patterns of neuronal connectivity. Cell Suppl. 1993;72:77–98. doi: 10.1016/s0092-8674(05)80030-3. [DOI] [PubMed] [Google Scholar]
- 16.Greiner JV, Weidman TA. Histogenesis of the ferret retina. Exp Eye Res. 1981;33:315–332. doi: 10.1016/s0014-4835(81)80055-3. [DOI] [PubMed] [Google Scholar]
- 17.Greiner JV, Weidman TA. Embryogenesis of the rabbit retina. Exp Eye Res. 1982;34:749–765. doi: 10.1016/s0014-4835(82)80035-3. [DOI] [PubMed] [Google Scholar]
- 18.Hayden SA, Mills JW, Masland RH. Acetylcholine synthesis by displaced amacrine cells. Science. 1980;210:435–437. doi: 10.1126/science.7433984. [DOI] [PubMed] [Google Scholar]
- 19.Jensen RJ. Receptive-field properties of displaced starburst amacrine cells change following axotomy-induced degeneration of ganglion cells. Vis Neurosci. 1995;12:177–184. doi: 10.1017/s0952523800007409. [DOI] [PubMed] [Google Scholar]
- 20.Kalil RE. The influence of action potentials on the development of the central visual pathway in mammals. J Exp Biol. 1990;153:261–276. doi: 10.1242/jeb.153.1.261. [DOI] [PubMed] [Google Scholar]
- 21.Katz LC, Shatz CJ. Synaptic activity and the construction of cortical circuits. Science. 1996;274:1133–1138. doi: 10.1126/science.274.5290.1133. [DOI] [PubMed] [Google Scholar]
- 22.Maffei L, Galli-Resta L. Correlation in the discharges of neighboring rat retinal ganglion cells during prenatal life. Proc Natl Acad Sci USA. 1990;87:2861–2864. doi: 10.1073/pnas.87.7.2861. [DOI] [PMC free article] [PubMed] [Google Scholar]
- 23.Masland RH. Maturation of function in the developing rabbit retina. J Comp Neurol. 1977;175:275–286. doi: 10.1002/cne.901750303. [DOI] [PubMed] [Google Scholar]
- 24.Masland RH, Tauchi M. The cholinergic amacrine cells. Trans Neurosci. 1986;9:218–223. [Google Scholar]
- 25.McArdle CB, Dowling JE, Masland RH. Development of outer segments and synapses in the rabbit retina. J Comp Neurol. 1977;175:253–274. doi: 10.1002/cne.901750302. [DOI] [PubMed] [Google Scholar]
- 26.Meister M, Wong RO, Baylor DA, Shatz CJ. Synchronous bursts of action potentials in ganglion cells of the developing mammalian retina. Science. 1991;252:939–943. doi: 10.1126/science.2035024. [DOI] [PubMed] [Google Scholar]
- 27.Miller RF, Bloomfield SA. Electroanatomy of a unique amacrine cell in the rabbit retina. Proc Natl Acad Sci USA. 1983;80:3069–3073. doi: 10.1073/pnas.80.10.3069. [DOI] [PMC free article] [PubMed] [Google Scholar]
- 28.Peters BN, Masland RH. Responses to light of starburst amacrine cells. J Neurophysiol. 1996;75:469–480. doi: 10.1152/jn.1996.75.1.469. [DOI] [PubMed] [Google Scholar]
- 29.Robinson SR. Development of the mammalian retina. In: Cronly-Dillion JR, editor. Vision and visual dysfunction, Vol 3. Macmillan; London: 1991. pp. 69–138. [Google Scholar]
- 30.Sernagor E, Grzywacz NM. Influence of spontaneous activity and visual experience on developing retinal receptive fields. Curr Biol. 1996;6:1503–1508. doi: 10.1016/s0960-9822(96)00755-5. [DOI] [PubMed] [Google Scholar]
- 31.Sernagor E, O’Donovan MJ. Cellular mechanisms underlying retinal waves in the chick embryo. Soc Neurosci Abstr. 1997;23:306. [Google Scholar]
- 32.Shatz CJ. Emergence of order in visual system development. Proc Natl Acad Sci USA. 1996;93:602–608. doi: 10.1073/pnas.93.2.602. [DOI] [PMC free article] [PubMed] [Google Scholar]
- 33.Shield C, Lukasieweicz PD, Wong ROL. GABAergic modulation of spontaneous bursting activity in the developing ferret retina. Invest Ophthalmol Vis Sci. 1996;37:S630. [Google Scholar]
- 34.Stellwagen D, Feller MB, Shatz CJ. Amacrine cell involvement in spontaneous wave generation in the developing retina. Soc Neurosci Abstr. 1997;23:641. [Google Scholar]
- 35.Stone J, Egan M, Rapaport DH. The site of commencement of retinal maturation in the rabbit. Vision Res. 1985;25:309–317. doi: 10.1016/0042-6989(85)90055-0. [DOI] [PubMed] [Google Scholar]
- 36.Tauchi M, Masland RH. The shape and arrangement of the cholinergic neurons in the rabbit retina. Proc R Soc Lond B Biol Sci. 1984;223:101–119. doi: 10.1098/rspb.1984.0085. [DOI] [PubMed] [Google Scholar]
- 37.Taylor WR, Wassle H. Receptive field properties of starburst cholinergic amacrine cells in the rabbit retina. Eur J Neurosci. 1995;7:2308–2321. doi: 10.1111/j.1460-9568.1995.tb00652.x. [DOI] [PubMed] [Google Scholar]
- 38.Vaney DI. “Coronate” amacrine cells in the rabbit retina have the “starburst” dendritic morphology. Proc R Soc Lond B Biol Sci. 1984;220:501–508. doi: 10.1098/rspb.1984.0016. [DOI] [PubMed] [Google Scholar]
- 39.Vaney DI. The mosaic of amacrine cells in the mammalian retina. In: Osborne NN, Chader G, editors. Progress in retinal research. Pergamon; Oxford: 1990. pp. 49–100. [Google Scholar]
- 40.Vaney DI, Peichi L, Boycott BB. Matching populations of amacrine cells in the inner nuclear and ganglion cell layers of the rabbit retina. J Comp Neurol. 1981;199:373–391. doi: 10.1002/cne.901990305. [DOI] [PubMed] [Google Scholar]
- 41.Wassle H, Boycott BB. Functional architecture of the mammalian retina. Physiol Rev. 1991;71:447–480. doi: 10.1152/physrev.1991.71.2.447. [DOI] [PubMed] [Google Scholar]
- 42.Wong RO. The role of spatio-temporal firing patterns in neuronal development of sensory systems. Curr Opin Neurobiol. 1993;3:595–601. doi: 10.1016/0959-4388(93)90061-3. [DOI] [PubMed] [Google Scholar]
- 43.Wong RO, Collin SP. Dendritic maturation of displaced putative cholinergic amacrine cells in the rabbit retina. J Comp Neurol. 1989;287:164–178. doi: 10.1002/cne.902870203. [DOI] [PubMed] [Google Scholar]
- 44.Wong RO, Oakley DM. Changing patterns of spontaneous bursting activity of on and off retinal ganglion cells during development. Neuron. 1996;16:1087–1095. doi: 10.1016/s0896-6273(00)80135-x. [DOI] [PubMed] [Google Scholar]
- 45.Wong RO, Chernjavsky A, Smith SJ, Shatz CJ. Early functional neural networks in the developing retina. Nature. 1995;374:716–718. doi: 10.1038/374716a0. [DOI] [PubMed] [Google Scholar]
- 46.Wong RO, Meister M, Shatz CJ. Transient period of correlated bursting activity during development of the mammalian retina. Neuron. 1993;11:923–938. doi: 10.1016/0896-6273(93)90122-8. [DOI] [PubMed] [Google Scholar]
- 47.Wong WT, Sanes JR, Wong ROL. Spontaneous activity patterns in the ganglion cell layer of the embryonic chick retina. Soc Neurosci Abstr. 1997;23:641. [Google Scholar]
- 48.Zhou ZJ. Periodic, spontaneous bursts of membrane depolarization in the starburst cell of the developing rabbit retina. Invest Ophthalmol Vis Sci. 1997;38:S948. [Google Scholar]
- 49.Zhou ZJ, Fain GL. Neurotransmitter receptors of starburst amacrine cells in rabbit retinal slices. J Neurosci. 1995;15:5334–5345. doi: 10.1523/JNEUROSCI.15-07-05334.1995. [DOI] [PMC free article] [PubMed] [Google Scholar]
- 50.Zhou ZJ, Fain GL. Starburst amacrine cells change from spiking to nonspiking neurons during retinal development. Proc Natl Acad Sci USA. 1996;93:8057–8062. doi: 10.1073/pnas.93.15.8057. [DOI] [PMC free article] [PubMed] [Google Scholar]
- 51.Zhou ZJ, Cheney M, Fain GL. Starburst amacrine cells change from spiking to non-spiking neurons during visual development. Invest Ophthalmol Vis Sci. 1996;37:S1153. [Google Scholar]