

Abstract
This study examined the extent of thalamocortical divergence as a potential determinant of activity-dependent representational plasticity in area 3b of adult monkey somatosensory cortex. Single or paired injections of anterogradely transported tracers, of varying anteroposterior extent, were made horizontally from behind in defined parts of the body representation in the ventral posterior lateral (VPL) and/or ventral posterior medial (VPM) thalamic nuclei, and the distribution and density of labeled thalamocortical terminations were mapped in cortex. Injections of increasing size in any dimension of VPL or VPM resulted in increasing accumulation of labeled terminals within the region of projection, implying extensive convergence of individual axons. Anteroposteriorly elongated injections labeled mediolaterally extended but anteroposteriorly restricted zones in cortex. Dorsoventral placement of an injection in VPL or VPM determined anteroposterior location of labeling in cortex.
Dual injections separated mediolaterally or dorsoventrally by ∼1 mm, and in different parts of the thalamic body or head–face representation gave rise to labeled thalamocortical terminations that overlapped extensively. For injection sites at different anteroposterior levels in VPL or VPM, the area of cortical convergence was related to their extent of anteroposterior coincidence. Labeled terminations arising from injections in immediately adjacent parts of VPL and VPM did not overlap in cortex.
The extent of thalamocortical divergence and convergence revealed by these experiments is greater than that predictable from labeling of single axons and is sufficiently great to account for representational plasticity that exceeds the 1.5 mm cortical “distance limit.”
Keywords: ventral posterior nucleus; area 3b; cortical plasticity; somatotopic representation; Phaseolus vulgaris,leukoagglutinin; fluorescent dextrans
The detailed somatotopic representation demonstrable physiologically in the primate somatosensory cortex (Powell and Mountcastle, 1959; Werner and Whitsel, 1968; Nelson et al., 1980) is subject to activity-dependent expansions and contractions that can occur under the influence of behavioral or surgical manipulations of peripheral input (Merzenich et al., 1983;Clark et al., 1988; Jenkins et al., 1990; Recanzone et al., 1992; Wall et al., 1992; Florence et al., 1994). The rapidity with which changes occur implies a considerable degree of divergence of preexisting thalamocortical and, potentially, of ascending brainstem connections. Only after the extent of preexisting divergence has been determined can the contributions of other potential mechanisms of cortical representational plasticity, such as axonal sprouting (Darian-Smith and Gilbert, 1994), be confidently predicted.
The ramifications of individual thalamocortical axons in area 3b of monkey somatosensory cortex have an intracortical spread of ∼600 μm (Garraghty and Sur, 1990; Rausell and Jones, 1995). However, adjacent cells within the same part of the body representation in the thalamic ventral posterior nucleus (VP) can project to cortical territories as distant as 1.5 mm (Rausell and Jones, 1995). The latter has been argued as providing a basis for short-term expansion of a representation, such as occurs after section of a peripheral nerve, but cannot account for much larger expansions that occur after more extensive, long-term deafferentations (Garraghty et al., 1994). In one instance an expansion of up to 12 mm was reported (Pons et al., 1991), although it has been argued that this could also be attributable to a particular pattern of preexisting connections (Lund et al., 1994).
In considering the extent to which preexisting thalamocortical connections could contribute to large expansions of this kind, a hitherto underemphasized component needs to be taken into account. Unlike in the cortical sheet, a part of the body is represented in VP as a three-dimensional lamella extending through most of the anteroposterior and dorsoventral dimensions of VP (Mountcastle and Henneman, 1952; Poggio and Mountcastle, 1963). Reports indicate that the thalamocortical input to a small (∼100 μm2) spot in area 3b comes from a considerable number of cells extending anteroposteriorly through much of the relevant lamella (Jones et al., 1982; Rausell and Jones, 1995), a distance of up to 3.6 mm in most macaque monkeys (see below). Unlike single VP cells, therefore, the axons of a population of VP cells representing, say, a finger, potentially have an enormous degree of cortical divergence. This has been used to account for the capacity of the cortical representation of a finger to maintain itself at its normal size in the face of greatly reduced input caused by lesions of progressively increasing size in VP (Jones et al., 1997). Lesion studies of this type confirm the high degree of thalamocortical divergence implied from retrograde tracing studies. There has been no direct visualization, however, of the extent of area 3b cortex subtended by the group of thalamocortical fibers arising from a small population of cells in one part of the VP representation. The extent of convergence in the cortical projection territories of populations of cells in different parts of the VP representation similarly has not been assessed.
MATERIALS AND METHODS
This work was performed on the brains of 13 macaque monkeys (three Macaca fuscata, six M. mulatta, and fourM. nemestrina). In eight of the animals, experiments were conducted on both sides of the forebrain, and in four the experiments were unilateral, giving a total of 20 cases. Where bilateral experiments were conducted, each experiment is designated by L (left) or R (right). The final animal, a M. mulatta, was normal and was used for providing a series of thalamic sections to be used as templates and for estimating the size of VP (see Fig. 1).
Fig. 1.

Left, Representation of the body in a frontal section through the middle of the ventral posterior nucleus of macaque monkeys, derived from single- and multi-unit mapping studies. Redrawn from Jones and Friedman (1982) and Rausell and Jones (1991). Italic letters to right ofbroken line in VPM indicate ipsilateral representation.DEEP indicates region that receives input from muscle spindle primary and other deep receptors and which projects to areas 3a and 2 of the somatosensory cortex. Right, Camera lucida drawings of a series of frontal sections at 300 μm intervals and in anteroposterior order through the ventral posterior and adjacent nuclei of a normal rhesus monkey, demonstrating the extent and relative dispositions of VPL and VPM. Numbers on each section indicate distance (in micrometers) from anterior pole of VPM. All injections shown in subsequent figures are replotted onto this same series of sections from the sections of the original brains.CM, Centre médian nucleus; Pla, anterior pulvinar nucleus; s, small-celled region of VPM that receives spinal and spinal trigeminal inputs; VMb, basal ventral medial nucleus; VPI, ventral posterior inferior nucleus; VPL, ventral posterior lateral nucleus; VPM, ventral posterior medial nucleus.
All animals were anesthetized with intramuscular ketamine (15 mg/kg) and maintained on a continuous intravenous infusion of sodium pentobarbital (5 mg · kg−1 · hr−1). They were positioned in a Kopf stereotaxic frame. Under aseptic conditions, the neck muscles were detached from the occipital bone, and two small craniotomy openings were made over the occipital lobes of the brain. Varnish-insulated, tungsten microelectrodes (5 MΩ resistance) were advanced in the horizontal, Horsley-Clarke plane through the occipital cortex and upper midbrain to enter the posterior pole of the ventral posterior complex of the thalamus. Single- and multi-unit responses to light mechanical stimulation of the skin or to movement of joints were recorded, using conventional methods for amplification and display, as the electrode was advanced in 100 μm steps, from posterior to anterior, through the ventral posterior nucleus. Receptive fields of the responding units were mapped in sufficient detail from repeated (usually three or four) parallel electrode penetrations to establish the somatotopy of the body representation in one part of the nucleus. In most cases, the border between the representation of the contralateral thumb in VPL and that of the contralateral lower lip in the adjacent VPM was identified.
After withdrawal of the tungsten microelectrode, either a single glass micropipette (WPI) or a pair of micropipettes was returned to a part of the VP representation located on the basis of stereotaxic coordinates obtained from the previous recordings. Single micropipettes with internal tip diameters of 5–10 μm were filled with 2%Phaseolus vulgaris leukoagglutinin (PhaL) in 0.05m Tris-buffered saline. Paired micropipettes were cemented together with epoxy resin, their tips at the same level. One was filled with 10% fluorescein dextran (10,000 MW; Molecular Probes, Eugene, OR) and the other with 10% FluoroRuby (Molecular Probes), dissolved in 0.1m phosphate buffer, pH 7.4, or in 0.9% saline. The tips measured 10–20 μm, and the intertip distance varied between 0.8 and 1.2 mm. In some experiments, the paired micropipettes were introduced in a parasagittal plane, with one dorsal to the other. In other experiments, they were introduced in a horizontal plane, with one medial to the other.
Silver wires were inserted into the internal solution of each micropipette. This enabled recording of multi-unit responses to peripheral stimulation to confirm return of the injection pipette(s) to a predetermined part of the ventral posterior nucleus and permitted iontophoretic delivery of PhaL or fluorescent dextrans.
Injections were made either at single sites in VP or at 200 μm intervals while the pipette(s) were withdrawn from a more anterior to a posterior position in the nucleus, usually over a distance of 0.75–1.5 mm. Injections at 200 μm intervals overlapped to form a single, continuous, anteroposteriorly elongated injection site. PhaL injections were made by passing 5–6 μA cathodal current for 15 min using a 50% duty cycle (7 sec on/7 sec off). Injections of fluorescent dextrans were made using 8 μA cathodal current applied over 20 or 40 min in the same 50% duty cycle. Three animals were injected bilaterally with PhaL. Five were injected bilaterally and four unilaterally with pairs of fluorescent dextrans.
Survival times were 14–21 d for both PhaL and fluorescent dextran injections. Thereafter, the animals were given an overdose of Nembutal and perfused through the ascending aorta with 500 ml of normal saline, followed by 3 l of 3% paraformaldehyde and 0.1% glutaraldehyde (for PhaL) or 4% paraformaldehyde (for fluorescent dextrans and the normal monkey) in 0.1 m phosphate buffer, pH 7.4. The brains were blocked, and the blocks were infiltrated with 30% sucrose in phosphate buffer and subsequently frozen in dry ice.
In two of the animals injected with fluorescent dextrans, the representations of the hand and adjacent part of the face were mapped in area 3b of the ipsilateral somatosensory cortex before perfusion, using tungsten microelectrodes introduced down the posterior bank of the central sulcus and the same procedures that were used in mapping the thalamic body representation.
Blocks of the thalamus and cerebral cortex were sectioned serially on a sliding microtome at 20 μm (for PhaL) or 25 μm (for fluorescent dyes). The thalamus was sectioned in the frontal plane and the cortex of the precentral and postcentral gyri and parietal lobules either in the parasagittal or horizontal planes, or in a plane parallel to the surface of the postcentral gyrus. All sections were collected in cold 0.1 m phosphate buffer.
For PhaL, serial sections were first incubated overnight at room temperature in 3% normal rabbit serum and 0.3% Triton X-100 in 0.1m phosphate buffer and then for 48–60 hr at 4°C in a goat anti-PhaL antiserum (Vector, Burlingame, CA) that had been preadsorbed in monkey-brain powder (1:2000), followed by 1 hr in biotinylated rabbit anti-goat IgG (Vector, 1:200) in 0.1 mphosphate buffer containing 0.3% Triton X-100, and finally for 1 hr in Vector avidin–biotin–peroxidase complex at room temperature. Sections were washed once in 0.1 m phosphate buffer between each step. PhaL was visualized by final incubation in 0.05% 3, 3′ diaminobenzidine 4 HCl and 0.01% hydrogen peroxide in phosphate buffer. Sections were then mounted on gelatin-coated slides and coverslipped, either with or without counterstaining with thionin.
Camera lucida drawings were made of the sections, showing the location of the PhaL injection in relation to the borders of VPL and VPM and the distribution of labeled terminal axonal ramifications in the cortex. Reconstructions of PhaL-labeled fibers and terminals were made by scanning the camera lucida drawings into Abode Photoshop, using a flatbed scanner. The scans of each section were stacked sequentially, the outlines of all sections being then removed, retaining the borders between cytoarchitectonic areas, as mapped onto the camera lucida drawings from thionin counterstaining.
For fluorescent dyes, all sections through the VP nucleus and relevant part of the cortex were mounted immediately in serial order in a 1:3 mixture of 0.1 m phosphate buffer and glycerol on glass slides and stored at 4°C. Sections were examined with an epifluorescence microscope equipped with fluorescein and rhodamine-exciting filters. The stage of the microscope was equipped with optical encoders interfaced to a personal computer using the Minnesota Datametrics MD2 plotting system. Computer-generated maps were prepared showing the outlines of each section and landmarks such as blood vessels. The locations of dye deposits were mapped onto the sections of the thalamus at low magnification (10×). Every section of the thalamus was then removed, washed, and alternately stained for cytochrome oxidase (CO) activity or with thionin and remounted. A camera lucida was then used to match the CO-stained sections to their corresponding computer-generated outlines by superimposing the cross sections of blood vessels, and the outlines of the CO-stained VP and adjacent nuclei were added to the original plots.
In the sections of the cortex, the distributions of labeled thalamocortical fibers in most of the dye-injected brains were plotted at high magnification (60×) using the MD2 system. Sections from the cortex of the two animals in which area 3b was mapped terminally were reconstructed in the same manner as the cortex from PhaL-injected animals. Reconstructions of microelectrode tracks were correlated with receptive field data to provide a map of the representation. Only labeled axons that were contained within the gray matter and showed labeled terminal or en passant boutons (see Fig. 2) were plotted. Scale bars were added to the map of each section. Neurolucida (MicroBright Field, Colchester, VT) files were created from the MD2-generated plots by scanning the plots into a personal computer equipped with Neurolucida software, using a digitizing tablet. Neurolucida “lenses” were created by reference to the scale bars on the original plots. The outlines of the sections were aligned, and sections at 100 μm intervals were stacked in single computer files using fiduciary marks such as the ends of sulci, the outlines of the sections, and profiles of blood vessels.
Fig. 2.
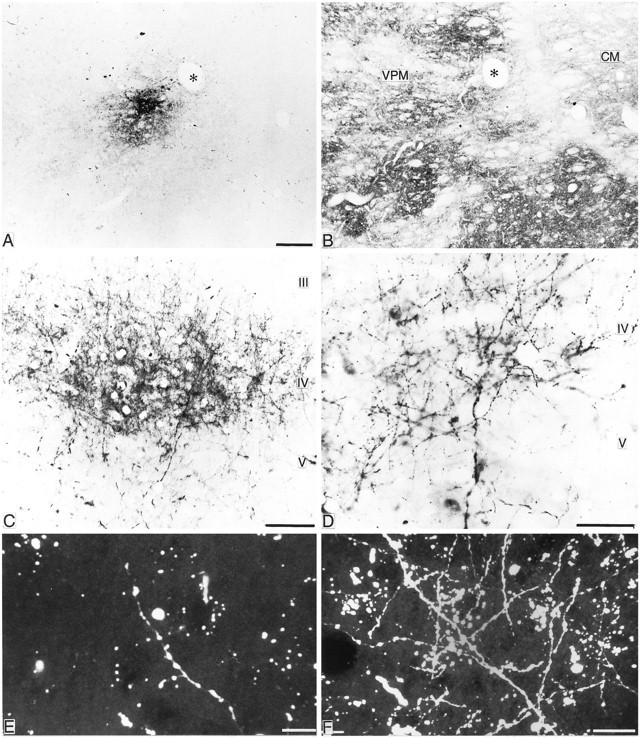
A, B, Adjacent frontal sections through VPM (asterisk indicates same blood vessel) stained for PhaL (A) or for cytochrome oxidase (B), indicating size and location of a typical injection of PhaL. Scale bar, 100 μm. C, Photomicrograph of a typical focal patch of dense PhaL-labeled terminal ramifications in layer IV and deep layer III of area 3b ensuing from the injection shown in A. Scale bar, 250 μm.D, Photomicrograph of PhaL-labeled axons and terminals from a focus similar to that shown in C. Scale bar, 100 μm. E, F, Laser confocal scanned images of fluorescent dextran-labeled axons and terminals in area 3b after injections in VP.E shows a low density of terminations after one of the smaller injections, and F shows a higher density after one of the larger injections. Scale bars, 25 μm.
Sections from one of the brains were mapped directly into Neurolucida from a fluorescence microscope equipped with mechanical stage encoders and a z-axis encoder. Plots showing the distributions of fluorescein- or rhodamine-labeled axons and terminals in the cortex were made directly from the computer screen using the appropriate Neurolucida “lens.” Sections were mapped at 100 μm intervals, and the series of sections was stacked in a single computer file.
Reconstructions showing the distribution of labeled axons and terminals in the cortex and the outlines of the stacked sections were rotated to give a view of the label from the surface of the cortex. The section outlines were then removed, and only lines representing the floor and posterior lip of the central sulcus and, depending on the location of label, certain adjacent sulci remained. The original reconstruction was also rotated, with software, into a position that optimized the ability to view intracortical label in the posterior bank of the central sulcus, as though from in front. Section outlines were then similarly removed. The final reconstructions were captured at 300 dots per inch and in 256 colors, using Corel Capture software, and pasted into Corel Photopaint in which the black background was converted to white and other colors adjusted. They were then imported into Corel Draw and printed.
To determine the extent of thalamocortical labeling in the cortex and the extent of overlap between thalamocortical ramifications labeled with red or green fluorescent dextrans, sections at 500 μm intervals from the original computer-generated stacks were opened together in Neurolucida, and lines of different colors were drawn across the full extent of terminals emanating from each set of labeled axons. The lengths of these lines were read, and the surface areas of the two sets of labeled thalamocortical ramifications and of any overlap between them were determined by multiplying the length of the line drawn on each section containing labeling by the depth of the section in the stack and summing the results.
Photographic documentation of the morphology, density, and intermingling of thalamocortical terminal ramifications labeled with fluorescein or rhodamine-labeled dextrans was obtained from laser confocal microscopy. Sections of the cortex, mounted in glycerol and phosphate buffer as above, were scanned using 514 and 657 nm exciting filters in an MRC 600 dual channel, laser confocal system mounted on an Olympus microscope. The selected sections were scanned in 10–15 steps of 1 μm.
In all references to the cerebral cortex, medial means toward the midline of the hemisphere and lateral means toward the lateral sulcus. In all maps of the somatosensory cortex, the border of area 3b with area 3a, deep in the central sulcus, is referred to as the anterior border and that with area 1 as the posterior border. Comparable relative terms are used for the borders of areas 3a, 1 and 2. In referring to VP, anterior is synonymous with rostral and posterior with caudal.
To illustrate the anteroposterior extent of each injection in the thalamus, the integrated MD2 plots and camera lucida drawings of subsequently CO-stained sections were scanned into Adobe Photoshop, giving a complete series of outlines through the VP complex of each case, from the anterior pole of VPM to the posterior pole of VPL, with the location(s) of each injection shown on those sections in which the injection was present. The anteroposterior and mediolateral extent of each injection was determined relative to the anteroposterior extent of VP and from measurements made at the time the original maps were generated. To facilitate comparison of injection locations from case to case, the injection(s) in each case was transferred to a series of outlines of frontal sections at 300 μm intervals through the VP complex, obtained from the normal M. mulatta brain.
Measurements of the anteroposterior extents of the fluorescent injections were obtained from laser confocal scans of the thalamic sections at 150 μm intervals, using the same exciting filters as for the cortex. Similar measurements were made of the PhaL injections directly from the optical microscope. All neuropil and cells that contained any trace of dye or PhaL were included in plotting the extent of the injection site. The volume of an injection was estimated by integrating the total number of sections containing the injection and its extent at each 150 μm interval.
RESULTS
All injections in VP had a narrow range of mediolateral and dorsoventral extents but they varied in anteroposterior extent. Therefore, the results will be presented by comparing the anteroposterior extent of the injection(s) in VP with the extent of thalamocortical labeling in areas 3b and 1. In all cases, receptive fields were characterized at the site of injection, and injections were centered at known locations in the body representation in VP (Fig.1). Their limited mediolateral and dorsoventral extent made it unlikely that substantial spread occurred into other parts of the representation.
The anteroposterior extent of VP occupied 3.6 mm in the normalM. mulatta brain (Fig. 1), a distance that is virtually identical to that shown by Olszewski (1952) in his atlas of the rhesus monkey thalamus. The anteroposterior extent of VP in the frontally sectioned thalami of all monkeys used in this study did not vary by >150–200 μm from the normal brain, so the locations and anteroposterior extents of the injections could be transferred, for ease of comparison, to the outlines of VP from the normal brain (Fig.2; see Figs. 3-10).
Fig. 3.

A, Localization (black) of one of the smaller injections of PhaL in VPM.Number at top left in this and subsequent figures indicates number of experiment. B, Plane of section and location of part of postcentral gyrus containing anterogradely labeled axon terminations, with a camera lucida drawing and flat reconstruction of location and extent of labeling in layer IV.Broken lines indicate borders between areas 3a, 3b, and 1, and gray lines indicate locations of fundus and posterior crest of central sulcus (CS).Arrows indicate location of section drawn inC. C, Camera lucida drawing of a section taken at level of arrows in B shows the low density of thalamocortical axon terminations typically seen after small injections in VP. D, Reconstructions of the extent of the injection in this case and in the case (FM6R) shown in Figure 4, as seen in parasagittal view. Numbers on y-axis indicate distance in micrometers from anterior pole of VP. Abbreviations defined in legend to Figure 1.
Fig. 4.

A, Location and extent of an injection of PhaL of the same circumferential extent as that in Figure3 but more elongated anteroposteriorly. B, Plane of section, location of part of postcentral gyrus containing labeled thalamocortical axon terminations, and a camera lucida drawing of the multiple focal densities in the zone of terminations, as seen in a section taken at the level of the arrows shown inC. C, Flat reconstruction showing extent and location of labeled terminations in areas 3b and 1.
Fig. 5.
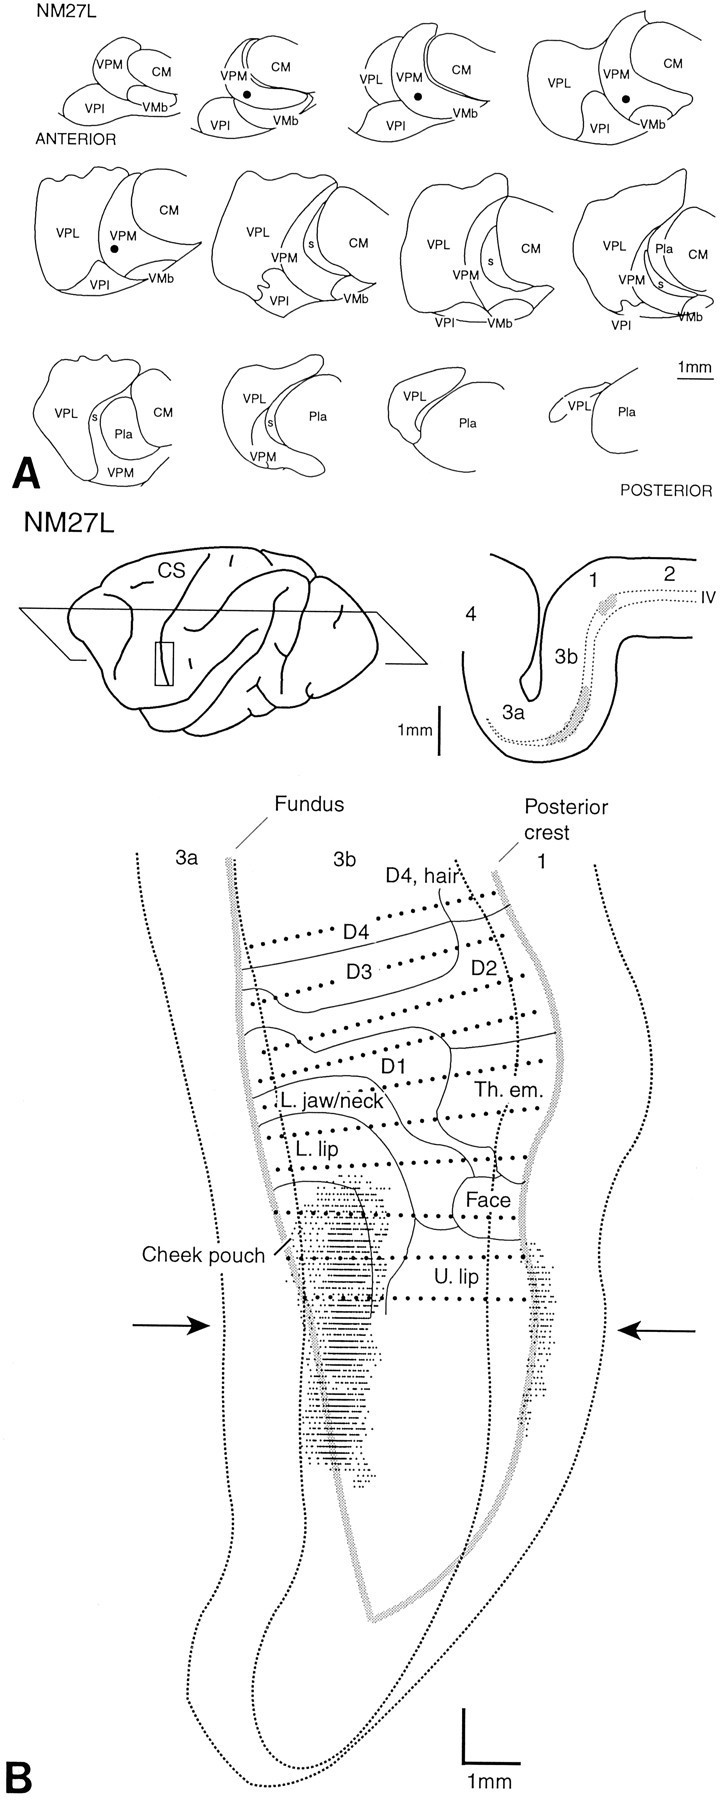
A, Location and extent of an injection of FluoroRuby in the representation of the contralateral check pouch in VPM. B, Plane of section, location of part of postcentral gyrus containing labeled thalamocortical axon terminations, and a flat reconstruction of the extent and location of the terminations in areas 3b and 1. Rows ofdots indicate recording sites used to provide a partial map of the representation of the digits (D1–D4), hand and face. L, Lower; Th.em., thenar eminence; U, upper. Arrowsindicate location of section drawn at top right.
Fig. 6.

Locations and extents of paired injections of FluoroRuby (black) and fluorescein dextran (gray) in the thalami of brains in which the distributions of labeled thalamocortical terminations are shown in Figures 7 (RM56R) and 8 (RM57L).Top, Injections plotted on the anteroposterior sequence of frontal sections through VP. Bottom, The extents of the injections and their degree of anteroposterior coincidence, as seen in the parasagittal plane. Abbreviations are defined in legend to Figure 1.
Fig. 7.
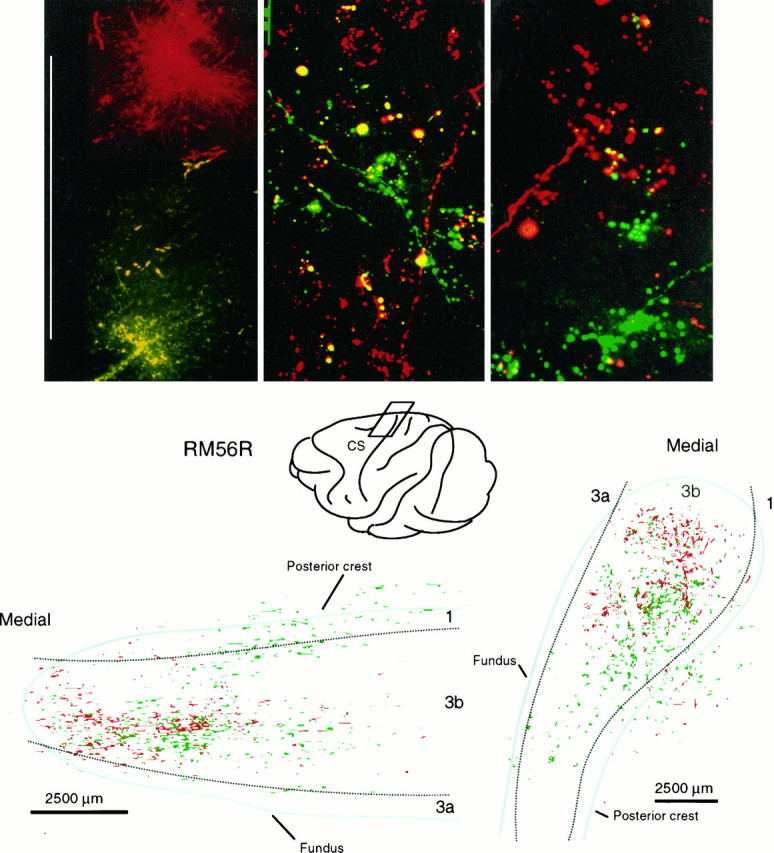
Top, Laser confocal scanned images of paired injections of FluoroRuby (red) and fluorescein dextran (green) in VP (left) and of overlapping (middle) and segregated (right) patches of labeled axons and terminals in layer IV of area 3b resulting from injections separated by different distances in VP. Scale bars: left, 1 mm;middle, 25 μm; right, 10 μm.Bottom, Location of part of postcentral gyrus containing labeled thalamocortical axon terminations ensuing from the paired injections illustrated in top part of Figure 6, with a surface projection (right) and view from in front of posterior bank of central sulcus (bottom left) showing extensive overlap of labeling. For clarity, distributions of terminals in this figure are made at half the density of those in Figures 8, 10, and11.
Fig. 8.
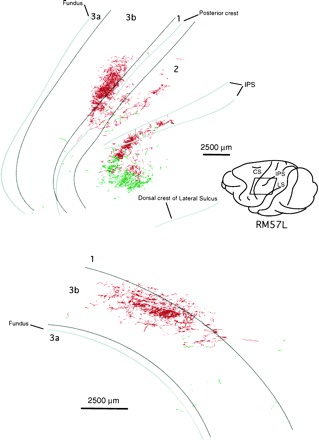
Location of part of postcentral gyrus containing labeled thalamocortical axon terminations ensuing from the paired injections illustrated in bottom part of Figure 6, only one of which (FluoroRuby) significantly affected the VP nucleus. Top map is a surface projection of all label, showing FluoroRuby-labeled terminations in areas 3b and 1 and both FluoroRuby-labeled and fluorescein dextran-labeled terminations in areas 2 and 5/7 resulting from involvement of dorsal “deep” shell of VP and of Pla nucleus in injections. IPS, Intraparietal sulcus; CS, central sulcus;LS, lateral sulcus. Bottom map is a view from in front of the posterior bank of the central sulcus and shows location and extent of label in areas 3b and 1 only.
Fig. 9.

Location and extents of paired injections of FluoroRuby (black) and fluorescein dextran (gray) in the thalamus of brains in which the distributions of labeled thalamocortical terminations are shown in Figures 10 (RM58) and 11 (RM59).Top, Injections plotted on the anteroposterior sequence of frontal sections through VP. Bottom, The extents of the injections and their degree of anteroposterior coincidence, as seen in the parasagittal plane.
Fig. 10.
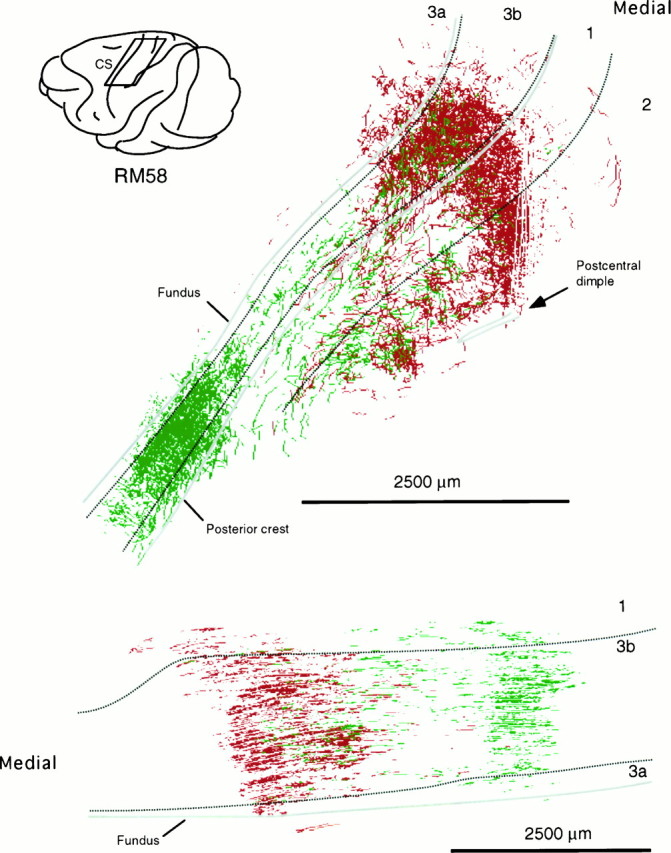
Location of part of postcentral gyrus containing labeled thalamocortical terminations ensuing from the paired injections illustrated in top part of Figure 9.Top is a surface projection of the terminal labeling. Labeling in areas 3a and 2 ensues mainly from involvement of dorsal “deep” shell of VPL in the injections, particularly that of FluoroRuby. In the case of fluorescein dextran, label in area 2 may ensue from involvement of Pla nucleus. Bottom is a view from in front of posterior bank of central sulcus showing the two foci of label in areas 3b and 1 only and the extent of overlap.
The injections of PhaL and of fluorescent dextrans had a diameter of 100–250 μm when measured in the frontal sections (Fig.2A,B; see Fig. 6).
Every injection in VP, regardless of size, resulted in anterograde labeling of axons and their terminal ramifications in areas 3b and 1 of the somatosensory cortex (Figs. 2C–F). The labeled terminations were characterized by beaded preterminal axons with boutons en passant and by short side branches ending in boutons terminaux. The neuropil in a region of concentrated labeled terminations contained labeled boutons that often formed pericellular aggregations. The density of labeled boutons and preterminal axons was related to the extent of an injection in VPL (see below). Labeled terminations were concentrated in layer IV and the deeper part of layer III in area 3b and in the deeper part of layer III in area 1, as demonstrated previously with other techniques (Jones and Burton, 1976). Labeled axons ascending to these layers gave occasional branches to the junction of layers V and VI (Fig. 2D). These laminar terminations are the same as those described previously by autoradiography (Jones and Burton, 1976). The more dorsally and anteriorly placed injections in VP led to additional labeling of thalamocortical fiber terminations in areas 3a and 2, as anticipated from earlier studies (Friedman and Jones, 1981), and injections that leaked along the micropipette track into the anterior pulvinar nucleus gave additional labeling in area 5, in accord with previous investigations (Burton and Jones, 1976; Pons and Kaas, 1985). The present analysis will focus on the projections to area 3b.
A total of 15 half-brains had injections in VP and labeling in the ipsilateral area 3b. The following account presents seven examples that represent the overall results. Each example was replicated in at least one additional half-brain.
Figures 3,4, and 5show cases that reveal the thalamocortical labeling typical of anteroposteriorly restricted or elongated injections in a part of the VP body representation. The injection of PhaL in Figure 3 was ∼300 μm in anteroposterior extent, whereas those in Figures 4 and 5 were 1200 μm long but of approximately the same diameter. All were in the representation of the contralateral cheek pouch in VPM. The injection in Figure 3 gave rise to a very limited region of thalamocortical labeling at the anterior border of area 3b. Those in Figures 4 and 5were also concentrated in the anterior part of area 3b but were mediolaterally much more extensive (8–9 vs 1 mm).
The labeling that ensued from the anteroposteriorly more extended injection of PhaL in VPM (Fig. 4) was characterized by a much higher density of labeled boutons and preterminal fibers, and especially by periodic clusters of denser labeling, each ∼250 μm in diameter and separated by narrower zones of lower density in layer IV (Fig. 4). This periodicity was a regular feature of the labeling of thalamocortical ramifications after larger injections of PhaL or fluorescent dextrans.
Results obtained with fluorescent dextrans were comparable to those obtained with PhaL. An anteroposteriorly elongated injection in the cheek pouch representation (Fig. 5) and a similar one in the dorsal part of the first finger representation in VPL (Fig.6; see Fig. 8), for example, gave labeling of thalamocortical ramifications in a mediolaterally extended but anteroposteriorly restricted part of area 3b. This was typical of all injections of similar diameter, located at a similar dorsoventral location in VP.
Dual injections, of the same anteroposterior extent in VP but separated mediolaterally by ∼1 mm (Figs. 6, 7), resulted in labeled thalamocortical ramifications that extensively overlapped in area 3b. This observation was duplicated in five half-brains involving three paired injections in VPL and two in VPM. Figure 7 is representative of all of them.
As paired injections became more widely separated, the cortical labeling resolved itself into two major concentrations in area 3b (Figs. 8,9, 10). The two concentrations were not completely isolated from one another, however. Between them there was a zone in which a lower density of red and green fluorescent-labeled fibers intermingled. In the case illustrated, there was more extensive overlap of fluorescein-labeled fibers into the zone of rhodamine-labeled fibers than the reverse, possibly because more relay cells were labeled at the rhodamine injection site.
Although paired injections in VPL or VPM gave significant overlap of the labeled terminal ramifications in area 3b, when one injection of the pair was located in VPL and the other in the adjacent part of VPM but separated by the medullary lamina between the two subnuclei, overlap was absent or minimal. This lack of overlap was observed in all such cases (n = 3). Case RM59 (Figs. 9,11), however, is most illustrative of this point. In this case, the rhodamine-labeled injection occupied the part of VPM in which the upper lip was represented, whereas the fluorescein-labeled injection straddled the lamina separating VPM and VPL, affecting the cheek pouch and possibly part of the lower lip representation in VPM as well as the thumb representation in VPL. In the cortex, a large focus of rhodamine-labeled terminal ramifications was found in area 3b, flanked by two independent foci of fluorescein-labeled ramifications. The fluorescein-labeled focus located medial to the focus of rhodamine-labeled ramifications was undoubtedly that arising from cells in the VPL representation of the thumb. It overlapped slightly with the rhodamine-labeled focus. Lateral to the focus of rhodamine-labeled fibers, there was a second focus of fluorescein-labeled ramifications, undoubtedly corresponding to that arising from cells affected by the part of the fluorescein injection located in VPM. This focus showed a significant degree of overlap with the rhodamine-labeled focus. The principle to be derived from this and similar cases is that projections from sites adjoining one another across the border between VPL and VPM do not overlap. Otherwise, the continuity and overlap of labeling in area 3b was a general feature. For example, the foci of fluorescein-labeled terminations in this experiment overlapped the rhodamine-labeled focus, indicating that projections that adjoin one another in the cortex overlap to some extent, regardless of their site of origin in VP.
Fig. 11.
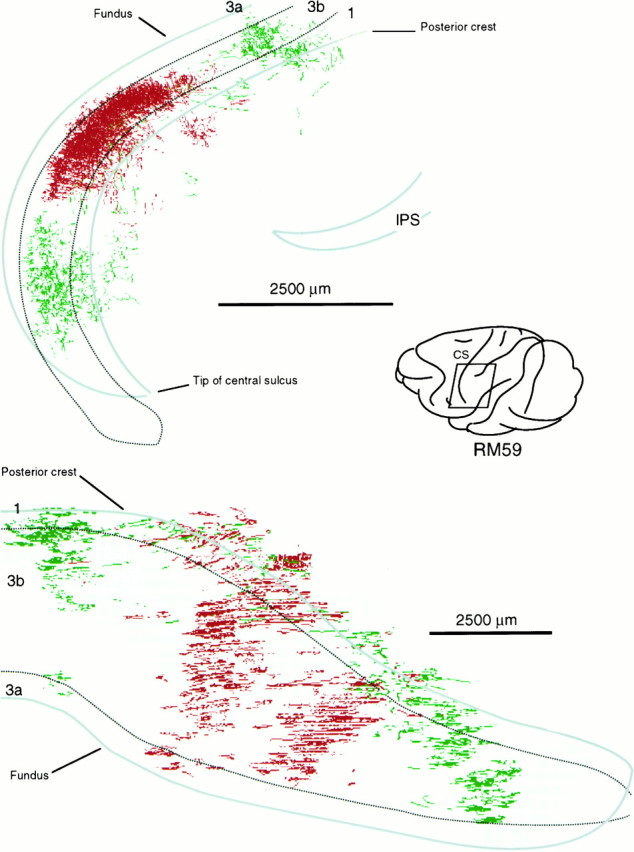
Location of part of postcentral gyrus containing labeled thalamocortical terminations ensuing from the paired injections illustrated in the bottom part of Figure 9. Top is a surface projection of the terminal labeling. Bottom is a view from in front of the posterior bank of the central sulcus showing the two dissociated patches of fluorescein dextran-labeled terminations ensuing from a single injection straddling the fiber lamina separating VPL and VPM, each overlapping slightly the single patch ensuing from the injection of FluoroRuby in another part of VPM.
Extent of cortical labeling
The extent of area 3b occupied by anterogradely labeled fibers depended on the anteroposterior extent of the injection in VP and on the volume of dye injected. Figure 12(top left) shows the anteroposterior length of the injections in each case, plotted against the area of cortex containing any terminals labeled with the corresponding dye. Each injection was treated as an independent case. The regression analysis shows that the distribution of points best fits a linear function (R2 = 0.974). When the volume of the cylinder of VP affected by an injection was plotted against the extent of labeling in the cortex (Fig. 12, bottom left), the best fit was also to a linear function (R2 = 0.959).
Fig. 12.

Left, Graphsplotting anteroposterior lengths and volumes of injections in VPL or VPM against extent of labeling of thalamocortical terminations in area 3b and showing the linear correlation. Right,Graphs plotting the distance over which dual injections occupied the same anteroposterior levels of VPL, although without actually overlapping (top), or the volume of the two dyes in this region of coincidence (bottom) against the extent of area 3b in which the labeled terminals ensuing from the two injections overlapped. Regression line in top plot cuts the y-axis at ∼1 mm2, indicating that in the absence of coincidence (i.e., for two sites at different anteroposterior levels in VP) there will still be an area of cortex, ∼1 mm2 in extent, in which the projections of the two points will overlap.
The density of terminal labeling in the cortex was additive, as suggested by comparison of Figures 3 and 4. That is, smaller injections produced a sparse cloud of labeled terminals with relatively little focal accumulation of terminals in periodic densities, whereas increasingly larger injections resulted not only in progressively larger areas of labeling but also in periodic patches of concentrated terminal densities, presumably because of the addition of more and more thalamocortical axons to each focus. The number of periodic densities increased with the size of the VP injection. The periphery of each zone of labeling was invariably less dense than the center, presumably reflecting a lack of involvement in the injection site of many thalamic neurons projecting there. The overlap of fibers labeled with different dyes and resulting from separated injections in two different parts of the thalamic representation, invariably occurred in the peripheral zones. Unlabeled cells in the gap between the two injections presumably would be the main contributors of axons to the zone of overlap, but the terminations of these axons would overlap extensively into the two adjacent zones.
Overlap of projections from two loci in VP
Figure 12 (right) illustrates that the convergence involves accumulation of thalamocortical terminals within restricted cortical loci. The anteroposterior distance over which two dye injections can be found in the same sections through VP, although not overlapping (Fig. 12, top), and the volume of dye in this region of coincidence (bottom), taken from selected experiments with dual injections, were plotted against the extent of cortex in which terminals labeled with the two dyes overlapped. The regression analysis indicated a linear function (R2 = 0.69) for distance and a power function (R2 = 0.59) for volume; the larger the extent, or the volume of anteroposterior coincidence, the larger the overlap of cortical labeling. Figure 12 (top right) suggests that even for injections at different anteroposterior levels in VP there would still be ∼1 mm2 of cortex in which terminals labeled with the two dyes should be found.
Projections to area 1
All injections in VPL or VPM gave labeling of thalamocortical axonal ramifications in areas 3b and 1. Those located most dorsally in VPL also resulted in labeling of fiber terminations in areas 3a and 2. The labeling in area 1 was invariably anteroposteriorly restricted in a manner comparable to that found in area 3b and reflected the representation pattern in area 1 (Nelson et al., 1980). Its mediolateral extent also paralleled that in area 3b, suggesting that comparable degrees of divergence occur in the thalamocortical projections from VP to the two areas. No attempt was made to quantify the projection to area 1. Areas 3b and 1 receive their principal thalamic inputs from the large cutaneous core of VP (Jones and Friedman, 1982). Areas 3a and 2 receive theirs from the anterodorsal proprioceptive shell (Friedman and Jones, 1981), which was not affected in most of the injections of VP. This study, therefore, does not address the issue of divergence in the projection to areas 3a and 2, nor does it deal with projections to other cortical areas that were labeled in instances in which an injection pipette leaked dye into the anterior pulvinar nucleus en route to VP.
DISCUSSION
This quantitative assessment of the extent of divergence and convergence in the thalamocortical projection to monkey somatosensory cortex is based on injections of tracer that were invariably small in mediolateral and dorsoventral extent in VP but extended for varying lengths anteroposteriorly, thus remaining to a large extent within a lamella of body representation in VPL (Mountcastle and Henneman, 1952;Poggio and Mountcastle, 1963; Jones and Friedman, 1982; Kaas et al., 1984) or a rod in VPM (Jones et al., 1982; Rausell and Jones, 1991). No major differences were detected in the extent of cortex subtended by the projections of comparably sized regions of VPL or VPM. Cortical divergence and convergence were evident when single injections occupied more and more of the anteroposterior extent of a lamella or rod. For VPL lamellae, in particular, the single injections, in not extending dorsoventrally, did not permit analysis of the divergence occurring when more and more of the dorsoventral extent of a lamella representing the same body part was involved. The paired dorsoventral injections offered some opportunity to do this, although few were in the same lamella. The mediolateral paired injections permitted the degree of convergence from the thalamic representations of different parts of the body surface to be determined.
There appears to be a linear relationship between the volume of VP affected by injected tracer and the amount of cortex containing labeled thalamocortical ramifications (Fig. 12; Table1). From the slopes of the curves in Figure 12, ∼25 mm2 of cortex is subtended by 0.1 mm3 of VP. However, the area of cortex affected is not necessarily symmetrical and can be mediolaterally or anteroposteriorly extended or both, depending on placement of injections in VP.
Table 1.
Linear relationship between the volume of VP affected by injected tracer and the amount of cortex containing labeled thalamocortical ramifications
| Anteroposterior length of injection in VP (μm) | Volume of VP affected by injections (mm3) | Distance of anteroposterior overlap (μm) | Volume of dye in region of anteroposterior overlap (mm3) | Extent of cortical labeling (mm2) | Extent of labeling overlap (mm2) | ||||
|---|---|---|---|---|---|---|---|---|---|
| RM57L | FR 1150 VPL | FD 200 VPL | FR 0.08 | FD 0.02 | 200 | 0.02 | FR 24.4 | FD 3.2 | 2.9 |
| RM59 | FR 1000 VPM | FD 750 VPM | FR 0.04 | FD 0.03 | 750 | 0.03 | FR 10.7 | FD 12.8 | 5.3 |
| RM56R | FR 1000 VPL | FD 1000 VPL | FR 0.05 | FD 0.03 | 1000 | 0.03 | FR 21.5 | FD 38.2 | 16.9 |
| RM58 | FR 1800 VPL | FD 1750 VPL | FR 0.05 | FD 0.10 | 1750 | 0.05 | FR 12.7 | FD 20.9 | 12.5 |
| NM28L | FR 350 VPL | FD 300 VPM | FR 0.025 | FD 0.020 | 200 | 0.010 | FR 8.5 | FD 7.7 | 0.0 |
| NM27L | FR 1000 VPM | 0.041 | 10 | ||||||
| FM6R | Phal 1200 VPM | 0.07 | 20 | ||||||
| FM4R | Phal 240 VPM | 0.006 | 0.6 | ||||||
| FM6L | Phal 75 VPM | 0.001 | <0.5 | ||||||
| FM10L | Phal 50 VPL | 0.001 | <0.5 | ||||||
FR, FluoroRuby; FD, fluorescein dextran; PhaL, Phaseolus vulgaris leukoagglutinin.
Anteroposterior expansion of an injection in the same part of a representation leads to mediolateral expansion of the extent of the labeled thalamocortical ramifications in area 3b (compare Figs. 3 and4). Therefore, the extent of cortical projection of cells along the anteroposterior dimension of a lamella or rod of thalamic representation is likely to provide a basis for expansion of the cortical representation of the same part under activity-dependent conditions. It may be predicted that dorsoventral expansion of an injection to affect more of the dorsoventral extent of a lamella of thalamic representation would lead to anteroposterior expansion of labeled thalamocortical terminations in cortex. This is evident to some extent in Figures 10 and 11. This evidence is consistent with representational patterns in VP and area 3b. The distal aspect of a finger, for example, is represented ventrally in a VPL lamella and anteriorly in area 3b; the proximal aspect is represented dorsally in a VPL lamella and posteriorly in area 3b (Powell and Mountcastle, 1959;Poggio and Mountcastle, 1963; Werner and Whitsel, 1968; Nelson et al., 1980; Jones and Friedman, 1982; Kaas et al., 1984; Manger et al., 1996).
The labeling of thalamocortical ramifications in area 3b indicates that expansion of the zone of cortical terminations as an injection expands anteroposteriorly in VP is also accompanied by considerable convergencewithin the zone of terminations. When only a few cells are labeled in VP, the zone of terminations is not only small but, within it, labeled fibers are dispersed and labeled terminal boutons are relatively few (Fig. 3). In the expanded zone of terminations resulting from labeling of a larger anteroposterior group of VP cells, labeled fibers are more concentrated, there are many more labeled boutons, often densely clustered, and there are large periodic patches of concentrated terminations (Figs. 4, 5) that resemble the periodicities seen in 14C-2-deoxy-d-glucose labeling of area 3b after localized peripheral stimulation (Juliano et al., 1981;Juliano and Whitsel, 1987). The first pattern of labeling reflects the morphology of individual thalamocortical fibers in area 3b (Garraghty and Sur, 1990; Jones, 1991), each fiber being characterized by many single boutons but having no large local concentrations of boutons. The second pattern reflects patterns of en masse thalamocortical fiber labeling (Jones et al., 1982) and the many local concentrations of thalamocortical boutons seen by electron microscopy in layer IV (DeFelipe and Jones, 1991). Co-activation of many cells along an anteroposterior trajectory in VP by coherent peripheral stimuli therefore should lead to powerfully concentrated synaptic drive on a zone of cortical cells. This would be expected to overwhelm any overlapping inputs from adjacent parts of the thalamic representation that are less active or less coherent, resulting potentially in expansion of one part of the cortical representation at the expense of overlapping parts.
This massive convergence of inputs from cells that are spatially separated along the anteroposterior axis of VP by as much as 3.6 mm could have been predicted from past studies in which even the smallest focal injections of tracer in area 3b led to retrograde labeling of a rod of cells extending anteroposteriorly through VP (Jones et al., 1979, 1982). Larger injections label a dorsoventral lamella of cells, also extending anteroposteriorly through VP (Jones et al., 1979; Nelson and Kaas, 1981; Darian-Smith and Darian-Smith, 1993), reflecting spread of the injection across the anteroposterior width of area 3b and the projection of the dorsoventral axis of VP to the anteroposterior axis of area 3b.
Paired, mediolaterally separated injections in VP permitted determination of the extent of overlap in the cortical projections of different parts of the thalamic body representation. Injections separated mediolaterally by ∼1 mm but confined to VPL or VPM give labeling of zones of thalamocortical ramifications that overlap substantially; the degree of overlap and the density of labeling within the overlap zone and in the primary foci were determined by the extent of the injections in VP. The overlap, like the divergence, is much more substantial than would be predicted from the fine grain topography of the representational map in area 3b, and both imply that mechanisms must normally exist to focus parts of this divergent projection and to suppress other parts. It is conceived that these mechanisms are partly afferent, involving coherency and noncoherency of inputs (Clark et al., 1988), and partly intracortical, involving activities of inhibitory neurons (Jones, 1993). The extent of divergence and corresponding overlap is far greater than could be predicted from the extent of terminal ramifications of single thalamocortical axons in area 3b of monkeys (∼600 μm) or of overlap in the cortical projections of adjacent VP cells (∼1.5 mm) (Rausell and Jones, 1995), and far exceeds the “cortical distance limit” set by these constraints, i.e., the extent to which the cortical representation of a body part will expand at the expense of the representation of another part whose input to cortex is removed (Kaas et al., 1983). It is sufficiently great to account for expansions that exceed the distance limit after certain kinds of extensive deafferentation (Garraghty and Kaas, 1991) and can account for the fact that much of the thalamic representation of a body part such as a finger can be destroyed before the representation of that finger in area 3b starts to shrink (Jones et al., 1997). The capacity for the high degree of thalamocortical divergence to maintain one part or expand another part of the cortical representation can only be magnified by comparable divergence in the projections of primary afferent fibers to the dorsal column and principal trigeminal nuclei and of their efferents to VP.
Although there was substantial convergence of the cortical projections of two parts of VPL or VPM, none could be detected in the projections from adjacent parts of VPL and VPM. This is compellingly revealed in Figure 11, where a single injection overlapping the fiber lamina between VPL and VPM led to two, topographically widely separated zones of label in area 3b separated by a zone of label ensuing from a second, isolated injection in VPM. Current evidence indicates that lemniscal afferents (to VPL) and principal trigeminal afferents (to VPM) do not overlap across the border between these two subnuclei of VP (Tracey et al., 1980; Asanuma et al., 1983; Jones et al., 1986). Similarly, the border between the dorsal column–lemniscal and trigeminal representations in areas 3b and 1 of the somatosensory cortex appears to be one that horizontal corticocortical connections (which are widespread within the adjacent hand and face representations) do not cross (Manger et al., 1997).
Lack of divergence and convergence across the border makes it difficult to account for expansion of the representation of the lower part of the face into the silenced representation of the hand in monkeys whose upper limbs had been deafferented for 12 years (Pons et al., 1991) and in which the cells of the VPL hand representation had disappeared by transneuronal degeneration (Rausell et al., 1992). However, in these animals, the mandibular nerve input to the representation of the lower jaw and neck, which normally overlaps an input from the upper cervical nerves (Sherrington, 1939), would have been preserved. This representation, which is probably visible as a narrow, nonlabeled strip between the medial two zones of labeling in Figure 11, has substantial intracortical connections with the upper limb representation (Manger et al., 1997), and the evidence from the present study would imply that its thalamocortical inputs should overlap into the two adjacent labeled zones. Overlap of these projections, as intimated by Lund et al. (1994), and corticocortical connections with the upper limb representation might provide a basis for the expansion.
Footnotes
The experiments on which this study was based were performed in the Department of Anatomy and Neurobiology at the University of California, Irvine, and commenced when E.R. was a postdoctoral researcher supported by Fulbright and Fogarty Fellowships (Rausell and Jones, 1990). This work was supported by Grant NS 21377 from National Institutes of Health, United States Public Health Service. Support for analysis of some of the material was provided by Grant SAF96–0031 from the Spanish Comisión Interministerial de Ciencia y Tecnología and by the former Neural Systems Laboratory, Frontier Research Program in Brain Mechanisms of Mind and Behavior, the Institute for Physical and Chemical Research, Wako, Saitama, Japan. We thank Dr. Tsutomu Hashikawa for assistance. Lincoln Bickford is now a medical student at Stanford University.
Correspondence should be addressed to Dr. Edward G. Jones, Department of Anatomy and Neurobiology, University of California, Irvine, 114 Irvine Hall, Irvine, CA 92697.
Dr. Manger’s present address: Sepulveda Veterans’ Administration Medical Center, North Hills, CA 91343.
REFERENCES
- 1.Asanuma C, Thach WT, Jones EG. Distribution of cerebellar terminations and their relation to other afferent termination in the ventral lateral thalamic region of the monkey. Brain Res Rev. 1983;5:237–265. doi: 10.1016/0165-0173(83)90015-2. [DOI] [PubMed] [Google Scholar]
- 2.Burton H, Jones EG. The posterior thalamic region and its cortical projection in New World and Old World monkeys. J Comp Neurol. 1976;168:249–301. doi: 10.1002/cne.901680204. [DOI] [PubMed] [Google Scholar]
- 3.Clark SA, Allard T, Jenkins WM, Merzenich MM. Receptive fields in the body-surface map in adult cortex defined by temporally correlated inputs. Nature. 1988;332:444–445. doi: 10.1038/332444a0. [DOI] [PubMed] [Google Scholar]
- 4.Darian-Smith C, Darian-Smith I. Thalamic projections to areas 3a, 3b, and 4 in the sensorimotor cortex of the mature and infant macaque monkey. J Comp Neurol. 1993;335:173–199. doi: 10.1002/cne.903350204. [DOI] [PubMed] [Google Scholar]
- 5.Darian-Smith C, Gilbert CD. Axonal sprouting accompanies functional reorganization in adult cat striate cortex. Nature. 1994;368:737–740. doi: 10.1038/368737a0. [DOI] [PubMed] [Google Scholar]
- 6.DeFelipe J, Jones EG. Parvalbumin immunoreactivity reveals layer IV of monkey cerebral cortex as a mosaic of microzones of thalamic afferent terminations. Brain Res. 1991;562:39–47. doi: 10.1016/0006-8993(91)91184-3. [DOI] [PubMed] [Google Scholar]
- 7.Florence SL, Garraghty PE, Wall JT, Kaas JH. Sensory afferent projections and area 3b somatotopy following median nerve cut and repair in macaque monkeys. Cereb Cortex. 1994;4:391–407. doi: 10.1093/cercor/4.4.391. [DOI] [PubMed] [Google Scholar]
- 8.Friedman DP, Jones EG. Thalamic input to areas 3a and 2 in monkey. J Neurophysiol. 1981;45:59–85. doi: 10.1152/jn.1981.45.1.59. [DOI] [PubMed] [Google Scholar]
- 9.Garraghty PE, Kaas JH. Large-scale functional reorganization in adult monkey cortex after peripheral nerve injury. Proc Natl Acad Sci USA. 1991;88:6976–6980. doi: 10.1073/pnas.88.16.6976. [DOI] [PMC free article] [PubMed] [Google Scholar]
- 10.Garraghty PE, Sur M. Morphology of single intracellularly stained axons terminating in area 3b of macaque monkeys. J Comp Neurol. 1990;294:583–593. doi: 10.1002/cne.902940406. [DOI] [PubMed] [Google Scholar]
- 11.Garraghty PE, Hanes DP, Florence SL, Kaas JH. Pattern of peripheral deafferentation predicts reorganizational limits in adult primate somatosensory cortex. Somatosens Motor Res. 1994;11:109–117. doi: 10.3109/08990229409028864. [DOI] [PubMed] [Google Scholar]
- 12.Jenkins WM, Merzenich MM, Ochs MT, Allard T, Guic-Robles E. Functional reorganization of primary somatosensory cortex in adult owl monkeys after behaviorally controlled tactile stimulation. J Neurophysiol. 1990;63:82–104. doi: 10.1152/jn.1990.63.1.82. [DOI] [PubMed] [Google Scholar]
- 13.Jones EG. Cellular organization in the primate postcentral gyrus. In: Franzén O, Westman J, editors. Information processing in the somatosensory system. MacMillan; London: 1991. pp. 95–108. [Google Scholar]
- 14.Jones EG. GABAergic neurons and their role in cortical plasticity in primates. Cereb Cortex. 1993;3:361–372. doi: 10.1093/cercor/3.5.361-a. [DOI] [PubMed] [Google Scholar]
- 15.Jones EG, Burton H. Areal differences in the laminar distribution of thalamic afferents in cortical fields of the insular, parietal and temporal regions of primates. J Comp Neurol. 1976;168:197–248. doi: 10.1002/cne.901680203. [DOI] [PubMed] [Google Scholar]
- 16.Jones EG, Friedman DP. Projection pattern of functional components of thalamic ventrobasal complex on monkey somatosensory cortex. J Neurophysiol. 1982;48:521–544. doi: 10.1152/jn.1982.48.2.521. [DOI] [PubMed] [Google Scholar]
- 17.Jones EG, Wise SP, Coulter JD. Differential thalamic relationships of sensory motor and parietal cortical fields in monkeys. J Comp Neurol. 1979;183:833–882. doi: 10.1002/cne.901830410. [DOI] [PubMed] [Google Scholar]
- 18.Jones EG, Friedman DP, Hendry SHC. Thalamic basis of place and modality-specific columns in monkey somatosensory cortex: a correlative anatomical and physiological study. J Neurophysiol. 1982;48:545–568. doi: 10.1152/jn.1982.48.2.545. [DOI] [PubMed] [Google Scholar]
- 19.Jones EG, Schwark HD, Callahan PJ. Extent of the ipsilateral representation in the ventral posterior medial nucleus of the monkey thalamus. Exp Brain Res. 1986;63:310–320. doi: 10.1007/BF00236848. [DOI] [PubMed] [Google Scholar]
- 20.Jones EG, Manger PR, Woods TM. Maintenance of a somatotopic cortical map in the face of diminishing thalamocortical inputs. Proc Natl Acad Sci USA. 1997;94:11003–11007. doi: 10.1073/pnas.94.20.11003. [DOI] [PMC free article] [PubMed] [Google Scholar]
- 21.Juliano SL, Whitsel BL. A combined 2-deoxyglucose and neurophysiological study of primate somatosensory cortex. J Comp Neurol. 1987;263:514–525. doi: 10.1002/cne.902630405. [DOI] [PubMed] [Google Scholar]
- 22.Juliano SL, Hand PJ, Whitsel BL. Patterns of metabolic activity in somatosensory cortex of monkeys (Macaca fascicularis) subjected to controlled cutaneous stimulation: a 2-deoxyglucose study. J Neurophysiol. 1981;46:1260–1284. doi: 10.1152/jn.1981.46.6.1260. [DOI] [PubMed] [Google Scholar]
- 23.Kaas JH, Merzenich MM, Killackey HP. The reorganization of the somatosensory cortex following peripheral nerve damage in adult and developing mammals. Annu Rev Neurosci. 1983;6:325–356. doi: 10.1146/annurev.ne.06.030183.001545. [DOI] [PubMed] [Google Scholar]
- 24.Kaas JH, Nelson RJ, Sur M, Dykes RW, Merzenich MM. The somatotopic organization of the ventroposterior thalamus of the squirrel monkey, Saimiri sciureus. J Comp Neurol. 1984;226:111–140. doi: 10.1002/cne.902260109. [DOI] [PubMed] [Google Scholar]
- 25.Lund JP, Sun G-D, Lamarre Y. Cortical reorganization and deafferentation in adult macaques. Science. 1994;265:546–548. doi: 10.1126/science.8036500. [DOI] [PubMed] [Google Scholar]
- 26.Manger PR, Woods TM, Jones EG. Representation of face and intra-oral structures in area 3b of macaque monkey somatosensory cortex. J Comp Neurol. 1996;371:513–521. doi: 10.1002/(SICI)1096-9861(19960805)371:4<513::AID-CNE2>3.0.CO;2-7. [DOI] [PubMed] [Google Scholar]
- 27.Manger PR, Woods TM, Muñoz A, Jones EG. Hand/face border as a limiting boundary in monkey somatosensory cortex. J Neurosci. 1997;17:6338–6351. doi: 10.1523/JNEUROSCI.17-16-06338.1997. [DOI] [PMC free article] [PubMed] [Google Scholar]
- 28.Merzenich MM, Kaas JH, Wall J, Nelson RJ, Sur M, Felleman D. Topographic reorganization of somatosensory cortical areas 3B and 1 in adult monkeys following restricted deafferentation. Neuroscience. 1983;8:33–56. doi: 10.1016/0306-4522(83)90024-6. [DOI] [PubMed] [Google Scholar]
- 29.Mountcastle VB, Henneman E. The representation of tactile sensibility in the thalamus of the monkey. J Comp Neurol. 1952;97:409–439. doi: 10.1002/cne.900970302. [DOI] [PubMed] [Google Scholar]
- 30.Nelson RJ, Kaas JH. Connections of the ventroposterior nucleus of the thalamus with the body surface representations in cortical areas 3b and 1 of the cynomolgus macaque (Macaca fascicularis). J Comp Neurol. 1981;199:29–64. doi: 10.1002/cne.901990104. [DOI] [PubMed] [Google Scholar]
- 31.Nelson RJ, Sur M, Felleman DJ, Kaas JH. Representations of the body surface in post-central parietal cortex of Macaca fascicularis. J Comp Neurol. 1980;192:611–643. doi: 10.1002/cne.901920402. [DOI] [PubMed] [Google Scholar]
- 32.Olszewski J (1952) The thalamus of the Macaca mulatta: an atlas for use with the stereotaxic instrument. Basel: S. Karger.
- 33.Poggio GF, Mountcastle VB. The functional properties of ventrobasal thalamic neurons studied in unanesthetized monkeys. J Neurophysiol. 1963;26:775–806. doi: 10.1152/jn.1963.26.5.775. [DOI] [PubMed] [Google Scholar]
- 34.Pons TP, Kaas JH. Connections of area 2 of somatosensory cortex with the anterior pulvinar and subdivisions of the ventroposterior complex in macaque monkeys. J Comp Neurol. 1985;240:16–36. doi: 10.1002/cne.902400103. [DOI] [PubMed] [Google Scholar]
- 35.Pons TP, Garraghty PE, Ommaya AK, Kaas JH, Taub E, Mishkin M. Massive cortical reorganization after sensory deafferentation in adult macaques. Science. 1991;252:1857–1860. doi: 10.1126/science.1843843. [DOI] [PubMed] [Google Scholar]
- 36.Powell TPS, Mountcastle VB. Some aspects of the functional organization of the cortex of the postcentral gyrus of the monkey: a correlation of findings obtained in a single unit analysis with cytoarchitecture. Bull Johns Hopkins Hosp. 1959;105:133–162. [PubMed] [Google Scholar]
- 37.Rausell E, Jones EG. Input-output organization of VPM rods in monkey thalamus. Soc Neurosci Abstr. 1990;16:225. [Google Scholar]
- 38.Rausell E, Jones EG. Histochemical and immunocytochemical compartments of the thalamic VPM nucleus in monkeys and their relationship to the representational map. J Neurosci. 1991;11:210–225. doi: 10.1523/JNEUROSCI.11-01-00210.1991. [DOI] [PMC free article] [PubMed] [Google Scholar]
- 39.Rausell E, Jones EG. Extent of intracortical arborization of thalamocortical axons as a determinant of representational plasticity in monkey somatic sensory cortex. J Neurosci. 1995;15:4270–4288. doi: 10.1523/JNEUROSCI.15-06-04270.1995. [DOI] [PMC free article] [PubMed] [Google Scholar]
- 40.Rausell E, Cusick CG, Taub E, Jones EG. Chronic deafferentation in monkeys differentially affects nociceptive and nonnociceptive pathways distinguished by specific calcium-binding proteins and down-regulates gamma-aminobutyric acid type A receptors at thalamic levels. Proc Natl Acad Sci USA. 1992;89:2571–2575. doi: 10.1073/pnas.89.7.2571. [DOI] [PMC free article] [PubMed] [Google Scholar]
- 41.Recanzone GH, Merzenich MM, Jenkins WM, Grajski KA, Dinse HR. Topographic reorganization of the hand representation in cortical area 3b of owl monkeys trained in a frequency-discrimination task. J Neurophysiol. 1992;67:1031–1056. doi: 10.1152/jn.1992.67.5.1031. [DOI] [PubMed] [Google Scholar]
- 42.Sherrington CS. On the distribution of the sensory nerve-roots. In: Denny-Brown D, editor. Selected writings of Sir Charles Sherrington. Hamish Hamilton; London: 1939. pp. 31–92. [Google Scholar]
- 43.Tracey DJ, Asanuma C, Jones EG, Porter R. Thalamic relay to motor cortex: afferent pathways from brain stem, cerebellum, and spinal cord in monkeys. J Neurophysiol. 1980;44:532–554. doi: 10.1152/jn.1980.44.3.532. [DOI] [PubMed] [Google Scholar]
- 44.Wall JT, Huerta MF, Kaas JH. Changes in the cortical map of the hand following postnatal median nerve injury in monkeys: modification of somatotopic aggregates. J Neurosci. 1992;12:3445–3455. doi: 10.1523/JNEUROSCI.12-09-03445.1992. [DOI] [PMC free article] [PubMed] [Google Scholar]
- 45.Werner G, Whitsel BL. Topology of the body representation in somatosensory area I of primates. J Neurophysiol. 1968;31:856–869. doi: 10.1152/jn.1968.31.6.856. [DOI] [PubMed] [Google Scholar]