Abstract
The turtle papilla neglecta (PN) is a small organ lying in the ventrolateral utricular wall between the posterior crista (PC) and the utriculosaccular foramen. Innervated by a branch of the posterior ampullary nerve, the organ is covered by a cupula extending only a small distance into the endolymphatic space. Although most rotation-sensitive units in the posterior division of the eighth nerve have sensory coding properties expected of PC fibers, a few have unique properties. Intra-axonal labeling studies show that the former are PC units and the latter are PN units. PC units are maximally responsive to head rotations in the posterior canal plane and are sensitive to a combination of angular velocity and angular acceleration. PN units respond maximally to pitch rotations and are sensitive to a combination of angular acceleration and angular jerk. A maximal response to pitches can be related to the location of the PN, which allows it to sample endolymph flow from both vertical semicircular canals. Differences in response dynamics may reflect macromechanics. Because the cupula of each vertical canal occludes the endolymphatic space, its displacement should be proportional to endolymph displacement. In contrast, the PN cupula is probably coupled to endolymph flow by viscous forces, in which case its displacement should be proportional to endolymph velocity. In many vertebrates, the PN is similar to that seen in turtles in its location and in the size and shape of its cupula, which suggests that its function in these other species is also similar.
Keywords: vestibular nerve, membranous labyrinth, papilla neglecta, posterior crista, cupula, endolymph, sensory coding, macromechanics
The papilla neglecta (PN) is a labyrinthine organ present in fish, reptiles, birds, and some mammals and innervated by a branch of the nerve supplying the posterior crista (PC) (Baird, 1974; Lewis et al., 1985). In most vertebrates, the papilla is a small, oval-shaped organ with 20–200 hair cells, covered by a cupula, and located in the ventrolateral wall of the utriculus between the posterior crista and the utriculosaccular foramen. A different arrangement is seen in elasmobranchs, where the papilla or macula as it is sometimes called is situated in or near a duct connecting the posterior canal with the sacculus (Baird, 1974;Corwin, 1978). In addition, the papilla in some elasmobranchs is large, containing anywhere from 2500 to 260,000 hair cells (Corwin, 1978). Within amphibians, a papilla neglecta is present in apodans but not in urodeles or anurans (Baird, 1974; Lombard and Bolt, 1979;Fritzsch and Wake, 1988). It has been proposed that the papilla neglecta in the latter animals has been transformed into the amphibian papilla, an auditory organ peculiar to amphibians (for review, seeFritzsch and Wake, 1988).
Physiological studies in elasmobranchs indicate that the papilla neglecta is sensitive to vibratory and auditory stimuli (Lowenstein and Roberts, 1951; Fay et al., 1975; Corwin, 1981). Its function in other species is unknown. We became interested in the organ while recording from the posterior division of the eighth nerve in turtles. Most rotation-sensitive afferents we encountered had sensory coding properties similar to fibers innervating the posterior crista in other species (Blanks and Precht, 1976). The units were maximally responsive to head rotations in the plane of the posterior semicircular canal and were sensitive to some combination of angular velocity and angular acceleration. In addition, a few rotation-sensitive units had unique properties, unlike any that had previously been described. The unusual units responded maximally to rotations in the pitch plane, rather than in the plane of one of the three semicircular canals. In addition, the sensitivity of the unusual units fell between angular acceleration and angular jerk. Although it has long been established that the response dynamics of canal afferents depart from the expected velocity-sensitive macromechanics of the semicircular canals (Fernández and Goldberg, 1971), the departure in the unusual units was much larger than had ever been encountered (Baird et al., 1988; Honrubia et al., 1989; Boyle et al., 1991). Their unique properties suggested that the unusual units innervated an organ other than a crista. The suggestion was confirmed by intra-axonal labeling, which showed that the more typical units innervated the posterior crista, whereas the atypical units supplied the papilla neglecta.
In this paper, we describe the morphology of the turtle PN, summarize evidence identifying the atypical units as innervating this organ, and compare the response properties of PN and PC afferents. We then consider how the directional properties and response dynamics of PN afferents are related to the location of the organ and to the size and shape of its cupula.
MATERIALS AND METHODS
Animals. We used red-eared turtles,Pseudemys (Trachemys) scripta elegans, of either sex, weighing 150–350 gm with carapace lengths of 10–13 cm.
Anatomical procedures. Animals were killed by decapitation; skin and soft tissue attached to the mandible were removed; and the head was split midsagitally. The two half-heads were immersed in cool (10°C) turtle Ringer’s solution (in mm: 130 NaCl2, 4 KCl, 2.2 MgCl2, 2.8 CaCl2, and 5 HEPES, pH 7.6) (Art and Fettiplace, 1984). The brain and cranial nerves were removed, and the membranous labyrinth was exposed. The half-head was then placed in cool fixative containing 3% paraformaldehyde, 3% glutaraldehyde, and 3% sucrose in 0.1 m cacodylate buffer. In some cases, immersion fixation was supplemented by intralabyrinthine perfusion with the same fixative.
The ear was excised and transferred to fresh fixative for at least 2 hr, after which the membranous labyrinth was dissected free, rinsed in 0.1 m cacodylate buffer, post-fixed in 1% OsO4for 1 hr, and then rinsed in buffer. At this point, tissue intended for scanning electron microscopy went through four steps of the Osmium–Thiocarbohydrazide–Osmium method (Kelley et al., 1973). Specimens were then transferred through a series of graded ethanol concentrations.
Scanning and light microscopy. After ethanol dehydration, tissue was dried using Peldri II (Ted Pella, Inc.) for scanning microscopy or plastic embedded for light microscopy. Tissue intended for scanning microscopy was sputter-coated with gold–palladium and examined in a JEOL 840A scanning electron microscope. Plastic-embedded specimens were sectioned at 1–2 μm with a diamond histoknife on an LKB-Wallac (Gaithersburg, MD) ultratome. Sections were transferred to glass slides, stained with Richardson’s solution (1% azure II, 2% methylene blue, and 2% sodium borate) on a hot plate, and coverslipped.
Confocal microscopy. To visualize the cupulae of the PC and the PN, unfixed labyrinths were injected with 0.1 ml fluorescein-labeled wheat germ agglutinin (FITC-WGA) (Vector Laboratories, Burlingame, CA). Combined with a fluorescent marker, WGA lectin provides an effective staining method of the cupula, otoconia, and otoconial membrane (Gil-Loyzaga et al., 1985). Within 10 min of the injection into the common crus the cupulae showed an intense florescence, whereas the surrounding tissue became only slightly fluorescent. Small windows were cut into the membranous labyrinth to provide unimpeded views. Care was taken not to dislodge the cupulae. Fluorescent images were captured using a Molecular Dynamics (Sunnyvale, CA) 2000 confocal microscope.
Surgical and recording procedures. A method similar to that described by Crawford and Fettiplace (1978) was followed. After decapitation the head was midsagittally sectioned, and the left half-head was placed into fresh turtle Ringer’s solution. To expose the dorsal surface of the posterior division of the eighth nerve, the brainstem was blocked at the levels of the trigeminal nerve rostrally and the glossopharyngeal nerve caudally and then pivoted 90° around the seventh and eighth nerves. The isolated half-head was placed on its lateral surface in a recording chamber. A moist gas mixture (95% O2 and 5% CO2) was passed over the preparation throughout the experiment. The recording chamber was attached to a superstructure on a rotating device, the motion of which was controlled by a velocity servomechanism (Inland 823). By tilting the superstructure, the preparation could be placed in any desired orientation with respect to the rotation axis. Recording microelectrodes were advanced by a screw micrometer drive attached to the top of the recording chamber. For extracellular recordings, micropipettes were filled with 3 m NaCl (20–40 MΩ impedance). Intra-axonal labeling was done with bevelled micropipettes containing 4% biocytin (Molecular Probes, Eugene, OR) in 0.5m KCl and 0.05 m Tris, pH 7.4, (40–80 MΩ impedance).
Physiological testing. Recordings were made from the posterior division of the eighth nerve. Sensitivity to rotations, tilts, and other linear forces was tested as in preceding studies (Goldberg and Fernández, 1975). Acoustic sensitivity was examined with 100–800 Hz tones delivered from a loudspeaker with intensities of 70–90 dB re: 0.0002 dyne/cm2 as measured by a sound level meter placed near the preparation (Brüel and Kjær model 2203). Vibration sensitivity was tested by tapping the superstructure. When monitored with an accelerometer (Brüel & Kjær model 4333), the taps consisted of 100 Hz oscillations decaying over 10–20 cycles with peak accelerations near ±1 g. Only rotation-sensitive units were studied in detail because, as described in Results, they were the only fibers found to innervate the PC and PN.
Rotation-sensitive units were characterized as follows. The head was kept in a position so that the horizontal (rotation) plane corresponded to the pitch plane of the specimen, 45° from the posterior canal plane. A 5 sec sample of background discharge was recorded, as was the response to a 0.3 Hz sinusoidal head rotation. In some units, responses were obtained to rotational sinusoids at frequencies spaced a half-decade apart from 0.1 to 3.0 Hz. Peak head velocities could be as high as 160°/sec (0.1 Hz), 80°/sec (0.3 Hz), 40°/sec (1.0 Hz), and 20°/sec (3.0 Hz). The number of cycles ranged from eight (0.1 Hz) to 256 (3.0 Hz). Care was taken to keep the rotation amplitude sufficiently small so that the responses appeared linear with no signs of excitatory saturation and, in units with an appreciable background discharge, no inhibitory silencing. Fourier analysis was used to extract the fundamental component of the response. A similar analysis was done on the head velocity signal from the tachometer of the servomechanism. Gains were obtained as the ratio of the response amplitude (in spikes per second) to the head velocity amplitude (in degrees per second). For the phase (in degrees), the head velocity phase was subtracted from the response phase; positive phases correspond to phase leads. Further testing was only done on extracellularly recorded units.
Some units were studied with velocity trapezoids, consisting of a stationary period (T1), an ascending velocity ramp (T2), a velocity plateau (T3), a descending velocity ramp (T4), and a final stationary period (T5); T1 = T3 = T5 = 5 sec; T2 = T4 = 1 or 2 sec. Responses to 8–100 consecutive rotations were averaged. Maximum velocities used were 40°/sec for 1 sec ramps and 80°/sec for 2 sec ramps. Actual velocities were set to keep each unit within a linear range and were as small as 2.5°/sec.
Directional properties of units were determined by comparing the responses to 0.3 or 1.0 Hz rotation sinusoids with the head in different tilt positions relative to the rotation plane.
Intracellular labeling. After physiological testing, impaled axons were iontophoretically injected with biocytin. Injection currents were 5 nA, alternating every 500 msec between anodal and cathodal steps. Every 30 sec the resting potential and the size of the action potential were measured. Biocytin injections continued for a total of 10 min (50 nA · min) or until the resting potential fell below −10 mV. We did not attempt to label more than one rotation-sensitive afferent per animal. After a minimum of 2 hr, the tissue was fixed with 2.5% paraformaldehyde and 2.5% glutaraldehyde in 0.1 mphosphate buffer, pH 7.4. The membranous labyrinth and attached nerve branches and brainstem were dissected in toto and placed in fresh fixative overnight, moved to a 30% sucrose solution in phosphate buffer for 12 hr, and then embedded in 12% gelatin. The block was hardened in fresh fixative containing 30% sucrose for not <4 hr, rinsed in fresh 30% phosphate buffer, and serially sectioned at 40 μm on a freezing microtome. To visualize biocytin, sections were incubated in a solution of avidin–biotin–HRP complex (1:50 dilution, Vector) and 0.1% Triton X-100 in 0.1 m phosphate buffer, pH 7.4, for 3 hr, followed by a presoak in 0.05% diaminobenzidine for 30 min to which 0.03% H2O2 was added for 4 min. The sections were rinsed, mounted, dehydrated through graded concentrations of ethanol, and then coverslipped.
Labeled material was examined with a 100× oil immersion, planapochromatic objective (numerical aperture, 1.3) under bright-field illumination. Axons and peripheral arborizations were drawn from serial sections with the aid of a drawing tube (total magnification, 1650×).
Inversion of fractional transfer functions. We needed to obtain the time–domain responses corresponding to a transfer function consisting of a conventional part,H1(s) = s/(s + α)(s + β), multiplied by a fractional operator,H2(s) =sk. From elementary methods, the inverse of H1(s) ish1(t) = [1/(β − α)][β exp(−βt) − α exp(−αt)]. The time–domain equivalent of sk is a fractional derivative, so the overall transfer function has a time–domain representation, h(t) =dkh1(t)/dtk. The fractional derivative of an exponential,dkexp(± αt)/dtk = [exp(± αt)/xk] γ*(−k, ± αt), where γ* is the entire incomplete γ function, which was evaluated from its series expansion (Oldham and Spanier, 1974; Spanier and Oldham, 1987).
Normalized measures of discharge regularity. The coefficient of variation (cv), which provides a measure of discharge regularity, is a function of discharge rate (Goldberg and Fernández, 1971;Goldberg et al., 1984). To obtain a normalized cv independent of discharge rate, we followed a previously described procedure (Goldberg et al., 1984) and calculated a normalized cv*, the cv appropriate to a discharge rate of 20 spikes/sec. This rate was chosen because it was near the mean value obtained from a large sample of rotation-sensitive units.
Determination of response vectors. Responses to 0.3 or 1.0 Hz sinusoidal head rotations were compared after the preparation had been tilted to each of several positions from our standard position. Two tilt planes were used. The first or xy plane explored rotations ranging from pure pitch (x-axis) to pure roll (y-axis). Rotations in the xz plane included pure pitch (x-axis) and pure yaw (z-axis). The gains and phases to the various rotations were used to calculate a response vector of unit length,Vmax = (x, y, z), giving the orientation with respect to the head of the rotation axis leading to maximal responses (Hess and Angelaki, 1993). Positive values of theVmax coordinates indicate excitation by downward pitches (x), leftward (ipsilateral) rolls (y), and counterclockwise (leftward or ipsilateral) yaws (z).
RESULTS
Structure of the papilla neglecta
In turtles, the PN is an epithelial mound lying in the ventrolateral wall of the utriculus, anterior to the PC and immediately posterior to the utriculosaccular foramen and the entrance of the horizontal canal duct (Figs. 1,PN; 2A,B). The mound consists of a neuroepithelium, surrounded by a transitional epithelium (Fig. 2C). A small nerve branch arising from the dorsal surface of the posterior ampullary nerve, midway along its length innervates the neuroepithelium (Fig. 1B). There are 20–30 myelinated nerve fibers in the PN branch (mean ± SD, 26 ± 4; n = 5) and these range in diameter from 1.8 to 8 μm. In comparison, there are ∼800 fibers innervating the PC (Brichta and Peterson, 1994).
Fig. 1.
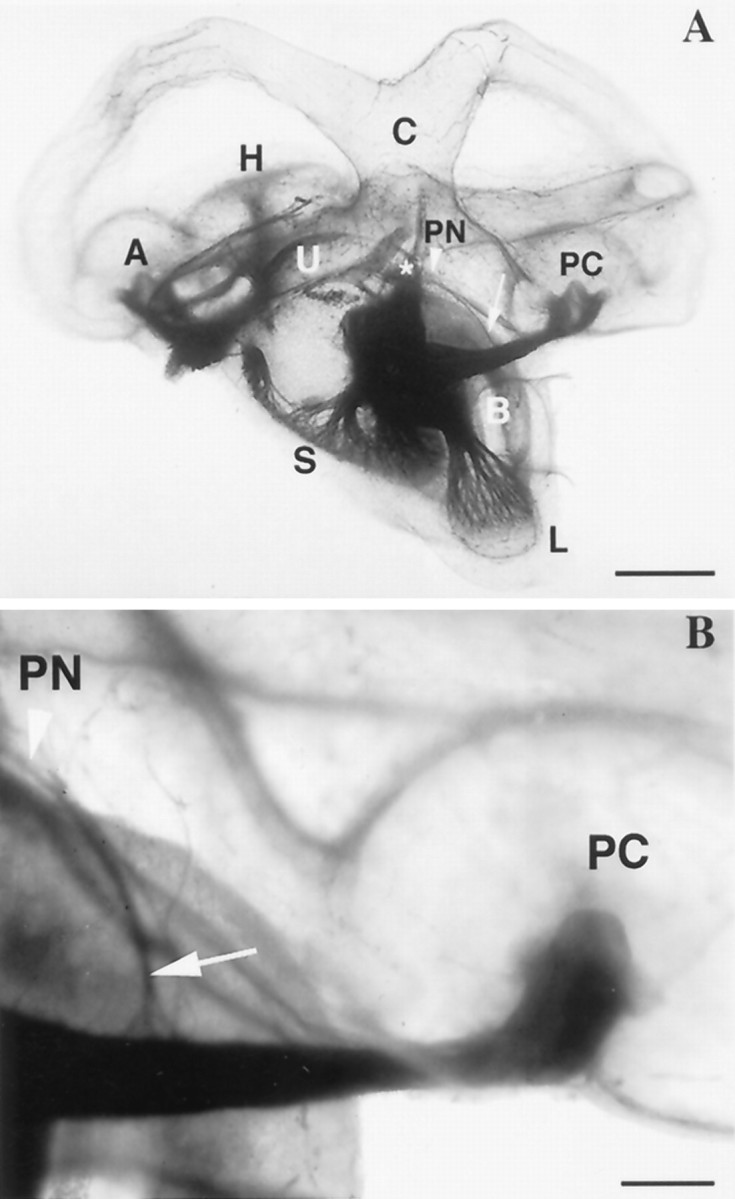
Medial view of the turtle membranous labyrinth and eighth nerve stained for myelin with Sudan Black B (Rasmussen, 1961).A, B, arrowhead, Location of the papilla neglecta (PN) in the ventrolateral wall of the posterior utriculus, below the common crus (C), anterior to the posterior crista (PC), and posterior to the utriculosaccular foramen (*).Arrow points to the small branch of the posterior ampullary nerve innervating the PN. A, Anterior crista;B, basilar papilla; H, horizontal crista;L, lagena; S, sacculus;PC, posterior crista; U, utriculus. Scale bars: A, 1 mm; B, 250 μm.
Fig. 2.
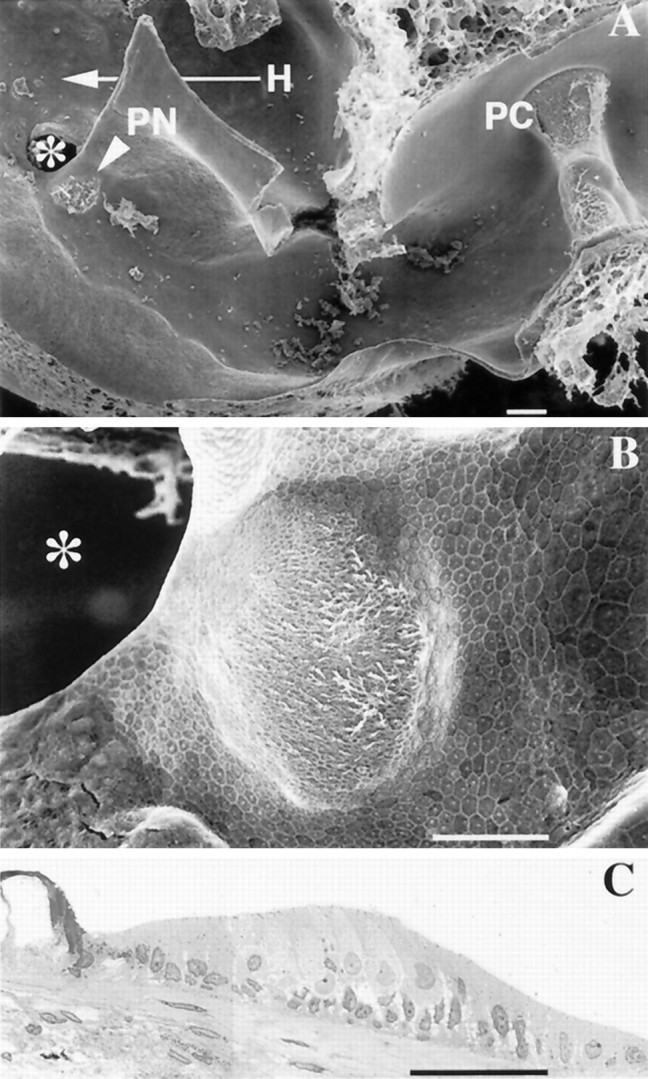
A, B, Scanning electron micrographs of the posterior crista (PC) and papilla neglecta (PN). A, arrowhead, Location of the PN in the wall of the utriculus, posterior to the utriculosaccular foramen (*). The entrance of horizontal canal duct (H) into the utriculus is indicated by the arrow. B, PN is a mound consisting of a neuroepithelium surrounded by a transitional epithelium. Hair bundles have been partially removed by ultrasonication to allow an unimpeded view of the epithelial surface. C, Semithin section of the PN. The organ consists of transitional cells, supporting cells, and hair cells. In this section only type II hair cells are observed. Scale bars: A, 100 μm;B, C, 50 μm.
The neuroepithelium was visualized in scanning electron micrographs (Fig. 2A,B), in which it measured 100 × 150 × 25 μm and contained 175–225 hair cells (Fig.2B). Hair bundles have a nearly identical orientation, similar to that seen in the PC. The kinocilium is located on the side of the hair cell facing toward the posterior canal ampulla and away from the utriculus. As discerned in semithin sections (Fig.2C), most PN hair cells are cylindrically shaped and are presumed to be type II cells. In semithin sections of the PC, type I hair cells can be recognized because their basolateral surfaces are surrounded by calyx endings. Presumed type I cells were not seen in two serially examined PN.
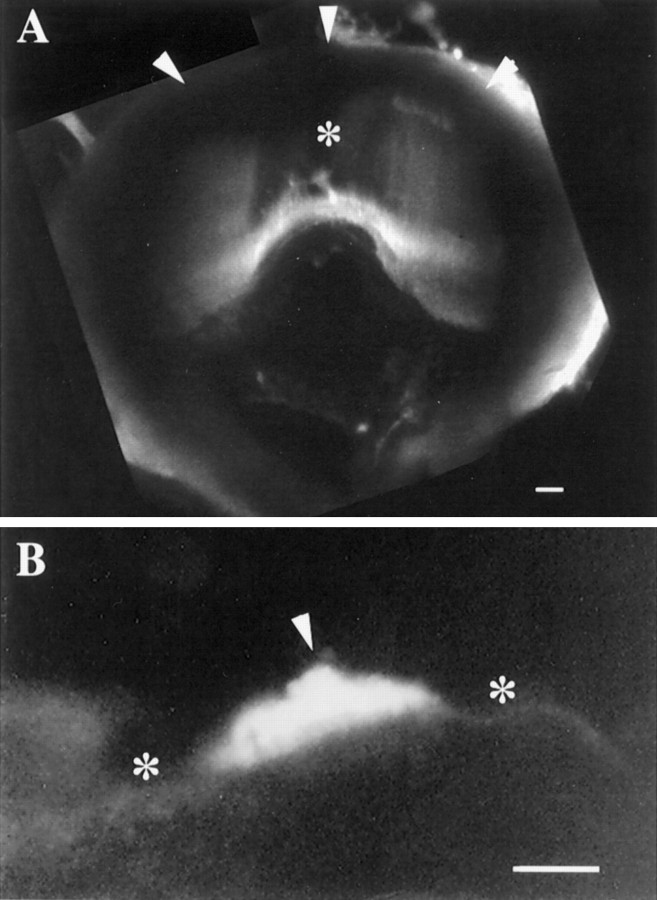
FITC-WGA was used to visualize the PC (Fig.3A) and the PN cupulae (Fig.3B). As is especially clear in Figure 3B, the cupulae were intensely stained by the lectin, whereas the surrounding epithelium was barely fluorescent. Consistent with previous accounts (Steinhausen, 1931; Hillman and McLaren, 1979), the PC cupula extends from the crista to the ampullary roof and occludes the endolymphatic space (Fig. 3A). In contrast, the PN cupula reaches only 60–70 μm into the utricular lumen (Fig. 3B) the diameter of which is 500 μm (Fig. 1A,B). Because the PN cupula does not occlude the lumen, endolymph is free to move over and around it. Otoconia are not present on or near either cupula.
Fig. 3.
Confocal images of the cupulae of the PC and PN stained with FITC-WGA. Each image represents a superimposition of 20 (A) and 8 (B) confocal sections taken at steps of 5 μm. A, PC cupula extends from the crista surface (bottom) to the ampullary roof (top, arrowheads), forming a partition occluding endolymph flow within the posterior ampulla. Less florescence is seen over the middle of the PC (*), where the cupula is relatively thin.B, PN cupula is 35 μm at its thickest point (arrowhead) and may be seen to protrude into the endolymphatic space from the wall of the utricular sac (*). When the height of the neuroepithelium is considered (Fig. 2C), the cupula extends 60–70 μm into the lumen of the posterior utriculus. Scale bars: A, B, 50 μm.
Labeling of physiologically characterized axons
A total of 58 rotation-sensitive units were labeled in the present study. Of these, 54 innervated the PC, and four supplied the PN. Informal testing (see Materials and Methods) indicated that rotation-sensitive units did not respond to head tilts, to centrifugal forces, or to auditory or vibrational stimulation. No rotation-sensitive unit was traced to any other organ innervated by the posterior division of the eighth nerve, including the lagena, the saccular macula, or the basilar papilla. Another 40 auditory, vibration-sensitive, and/or tilt-sensitive units were labeled. None of them went to the PC or the PN.
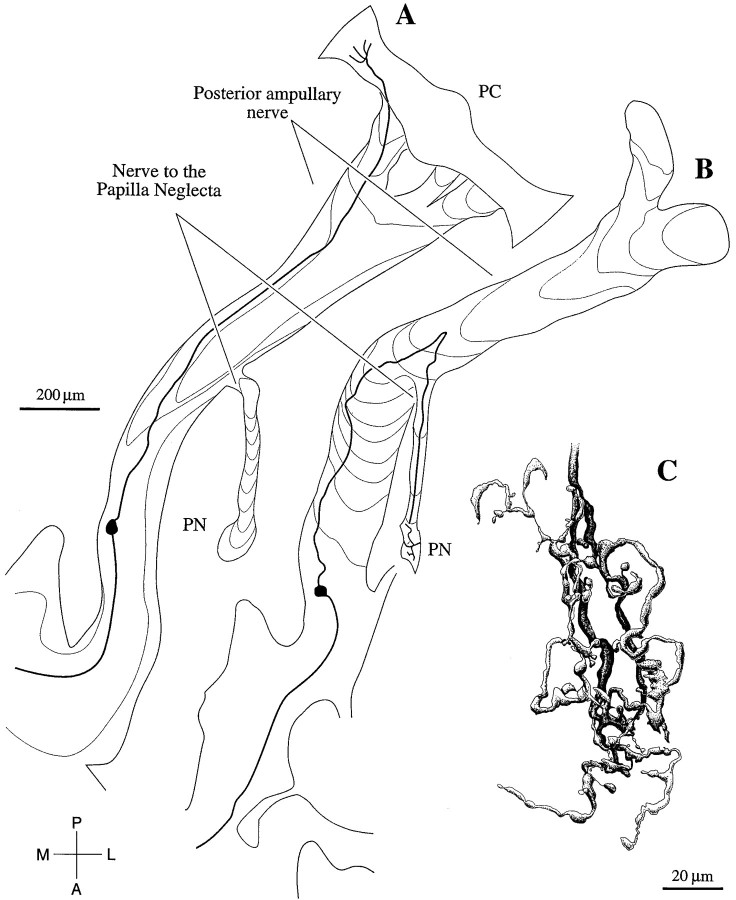
As illustrated by an intracellularly labeled axon (Fig.4B), PN fibers are concentrated on the dorsomedial surface of the ampullary nerve. On reaching the PN branch, they turn sharply in a dorsal direction to exit the main nerve. In contrast, PC fibers (Fig. 4A) continue along the posterior ampullary nerve to reach the posterior crista. Only two of the four labeled PN fibers were sufficiently labeled to reconstruct their terminal arbors within the papilla. An example is seen in Figure 4C. As was also the case for the other reconstructed arbor, there was an extensive terminal tree containing bouton endings and innervating a large fraction of the neuroepithelium. A description of the labeled PC units will be presented elsewhere (A. M. Brichta and J. M. Goldberg, unpublished observations).
Fig. 4.
Reconstructions of two rotation-sensitive axons, intracellularly labeled with biocytin. A, This axon follows the posterior ampullary nerve to the posterior crista (PC). As was the case for another 53 labeled fibers traced to the PC, the axon was sensitive to a combination of angular velocity and angular acceleration. B, This axon leaves the posterior ampullary nerve and runs in a small nerve branch to the papilla neglecta (PN). A total of four labeled fibers traced to the PN were sensitive to a combination of angular acceleration and angular jerk. C, Reconstruction of the terminal field of the axon in B. The terminal field extends almost the entire length of the PN. Scale bars:A, B, 20 μm.
Identification and discharge properties of PN and PC fibers
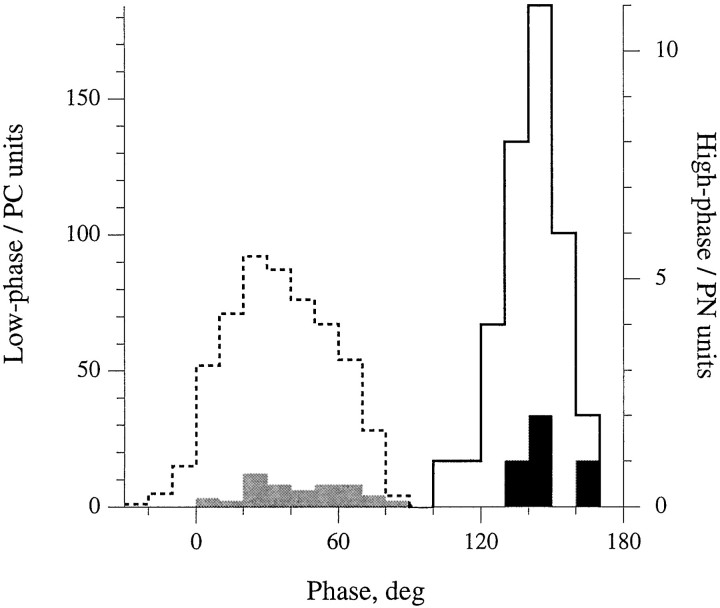
In addition to the 58 labeled units, there were 585 extracellularly recorded, rotation-sensitive units in the study. All of them were tested with 0.3 Hz sinusoidal head rotations (Fig.5). Extracellular units fell into two distinct groups, a low-phase group with phase leads ≤91° and a high-phase group with phase leads ≥104°. Identification of the low-phase group as PC units and the high-phase group as PN units is based on the phases of labeled units. In particular, phases of the 54 labeled PC units ranged from 5–91°; those of the four labeled PN units, from 125–146°. The bimodal shape of the extracellular distribution reinforces the conclusion. Among the extracellular units, the high-phase group made up 33 of 585 or 5.6% of the extracellular sample, slightly larger than the 3.1% expected from the relative numbers of PN and PC fibers.
Fig. 5.
Based on the phase of their response to 0.3 Hz sinusoidal rotations, axons in the posterior ampullary nerve can be distinguished into two groups: low phase group (≤91°, dashed outline, n = 552) and high phase group (≥104°, solid outline, n = 33). Intra-axonally labeled fibers traced to the posterior crista (PC) fell into the low-phase group (light shading, n = 54), whereas labeled fibers traced to the papilla neglecta (PN) fell into the high-phase group (n = 4, dark shading).
PN and PC fibers had similar background discharges with mean (±SD) values for the extracellular samples of 18.3 ± 12.7 (PC units) and 19.2 ± 9.8 spikes/sec (PN units). The normalized cv* varied from <0.2 to 1.0 in both groups. In other populations (Baird et al., 1988; Honrubia et al., 1989), including the present PC population (Brichta and Goldberg, 1996), rotational gain and phase both increase with cv*. The same is true for PN units. Gains at 0.3 Hz were fit by a power law, gain = a (cv*)b, witha = 0.65 ± 0.16 spikes per sec/degrees per sec and b = 0.91 ± 0.29 (n = 31;p < 0.005). Phases at the same frequency were fit by a semilogarithmic relation, phase = a + blog10cv*, with a = 148.1 ± 3.8° andb = 18.8 ± 10.9° (p < 0.10). Although they were not included in the calculations, points for the four labeled PN units were close to the regression lines. Points for the extracellular PN units did not fall into distinct groups based on their cv*, gain, or phase.
Response dynamics
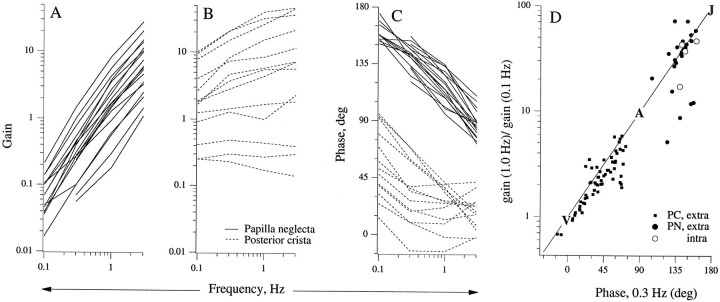
PC and PN units differ in their response dynamics. This can be seen in Figure 6, which compares Bode plots for 18 PN and 13 PC units. The frequency range only extends down to 0.1 Hz, because many PN units became virtually unresponsive at lower frequencies. Results were available for PC units at lower frequencies, typically down to 0.01 Hz.
Fig. 6.
Responses of PC (dashed lines,n = 13) and PN (solid lines,n = 18) units to sinusoidal head rotations, 0.1–3 Hz. Individual units are characterized by their gains in spikes per second/degrees per second (A,B) and phase leads re: head velocity in degrees (C). PN units became insensitive at frequencies <0.1 Hz. A, Gains of PN units increase ∼100-fold as frequency increases from 0.1 to 3 Hz. B, In contrast, gains of PC units increase <10-fold over the same frequency range.C, Throughout the frequency range, PN phases are larger and more tightly distributed than PC phases. PN phases decline by 50° between 0.3 and 3 Hz. A similar frequency-dependent decline is seen in those PC units with large phases at 0.1 and 0.3 Hz. For other PC units, phase remains nearly constant >0.3 Hz. D, The ratio of gains at 0.1 Hz and 1.0 Hz is plotted versus the phase lead at 0.3 Hz.Straight line, Expected relation for a fractional (sk) operator withletters indicating the points corresponding to velocity (k = 0, V), acceleration (k = 1, A), and jerk (k = 2, J) sensitivity.intra, extra, Intracellularly labeled and extracellularly recorded units, respectively.
Response dynamics are relatively uniform in PN units. This is indicated by the similarity in their gain slopes when plotted in double logarithmic coordinates (Fig. 6A) and by the similarity in their phases at single frequencies (Fig. 6C). For almost all PN units, gain increases 100- to 150-fold between 0.1 and 3 Hz, and phase curves vary by only 30° at any particular frequency. In contrast, the gain slopes of PC units vary eightfold, and their phase curves differ by almost 90° at 0.1 and 0.3 Hz (Fig.6B,C). The phase leads of PN units decline as frequency increases (Fig. 6C). Most PC units reach a nearly constant phase at frequencies of 0.3 Hz. The only PC units to show a frequency-dependent phase decline are units with large phase leads at 0.1 and 0.3 Hz.
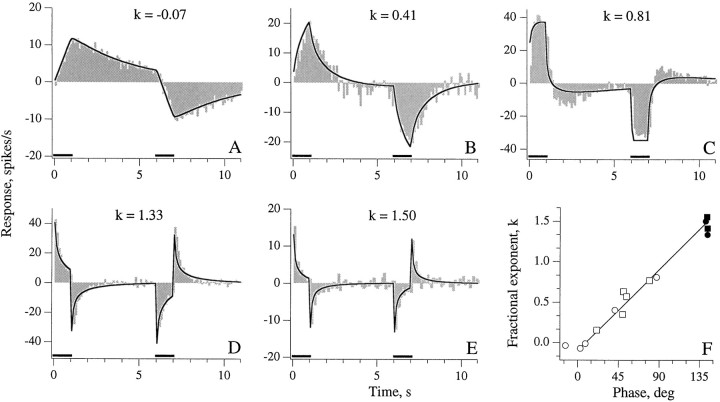
Data from Figure 6A–C are replotted in Figure6D in terms of the relation between the gain slopes and phases for individual units. Most of the points fall close to the straight line expected of fractional (sk) operators. The points corresponding to angular velocity (V), angular acceleration (A), and angular jerk (J) encoding are indicated. PN units encode between A andJ, whereas PC units encode between V andA (Fig. 6D). To verify this interpretation, we used rotation trapezoids with 1 or 2 sec ramps. Figure 7 shows responses for three PC units (Fig. 7A–C) and two PN units (Fig. 7D,E). The first PC unit (Fig. 7A) is velocity-sensitive. Responses during the ramps grow linearly, paralleling angular velocity, and response declines during the following constant velocity periods are exponential and slow. The second PC unit (Fig. 7B) encodes between V and A. During the leading (excitatory) ramp, the response curve is concave downward; during the trailing (inhibitory) ramp, it is concave upward. On transition to constant velocity, responses return rapidly to the baseline, and there is a suggestion of a response reversal. These trends are exaggerated in the third PC unit (Fig. 7C), which encodes near A. Responses rapidly approach their maxima during the ramps and response reversals are evident after the ramps. Trends are even more exaggerated in the two PN units (Fig. 7D,E). Maximum responses occur during the first 0.1 sec bin of each ramp, and the response declines to 10–25% of maximum during the next 0.9 sec. Immediately after each ramp, the response reverses and rapidly approaches the baseline from the opposite direction.
Fig. 7.
Rotation trapezoids with 1 sec leading and trailing ramps (bars, horizontal axes) were used to study response dynamics of PC (A, B, C) and PN (D, E) units. Shaded histograms, Actual responses; curved lines, best-fitting trapezoid responses obtained by inverting text equation 1. The three PC units are arranged to show sensitivities ranging from near velocity to near acceleration. A, Velocity-sensitive PC unit has a response most closely resembling the velocity trapezoid.B, PC unit encoding midway between velocity and acceleration. C, Near acceleration-sensitive PC unit the response of which parallels differentiated version of velocity trapezoid. D, E, Two PN units encode between acceleration and jerk. F, Comparison of fractional exponent (k) values giving best-fitting trapezoid responses and the 0.3 Hz sinusoidal phases for 13 units. Solid symbols, PN; open symbols, PC. Circles, 1 sec ramps;squares, 2 sec ramps. For one PN unit, trapezoids with 1 sec and 2 sec ramps were both tested. Straight line, Expected relation between k (ordinate) and sinusoidal phase (abscissa) derived from text Equation 1.
Actual responses were compared with theoretical responses obtained by inverting the transfer function:
| Equation 1a |
where
| Equation 1b |
gV is a midband velocity gain,TP(s) is a second-order torsion pendulum model with α = 0.39 sec−1 and β = 75 sec−1, and sk is a fractional velocity operator. To determine α, we used a subset of the PC units with the smallest phase leads and found the frequency at which their mean phase curve crossed 45°. β was taken to be the lowest rate constant of the series solution to the Navier–Stokes equation for a circular tube of radius, a. The formula is β =j0,12ν/a2, where j0,1 = 2.4048 is the first zero of theJ0 Bessel function (Batchelor, 1967, p. 194); ν = 1 × 10⁻² cm2/sec is the kinematic viscosity of endolymph, which can be assumed equal to that of water (Money et al., 1971). To account for variations in the radius, β was calculated as the average for 20 equally spaced points around the entire posterior canal ring.
In fitting individual responses, only gV andk were allowed to vary. Equation 1 provides reasonably good fits to the trapezoid responses (Fig. 7) with the possible exception that the reversed responses of Figure 7, B and C, are underestimated. Of particular interest are the values ofk providing best fits, because these exponents provide a convenient way to summarize the response dynamics of different units. In particular, k = 0 corresponds to Vencoding; k = 0.5, halfway between V andA encoding; k = 1.0 corresponds toA encoding; and k = 1.5, halfway between Aand J encoding.
Trapezoid data were available for 10 PC and three PN units. Figure7F compares the values of k, determined by fitting the trapezoid responses of the 13 units, to the phases of their 0.3 Hz sinusoidal responses. The straight line is the relation expected from Equation 1. The values of k for PC units range from near zero to 0.8; those for the three PN units average 1.47 (range, 1.37–1.55). Results are consistent with the conclusion that PC units encode between V and A, whereas PN units encode halfway between A and J.
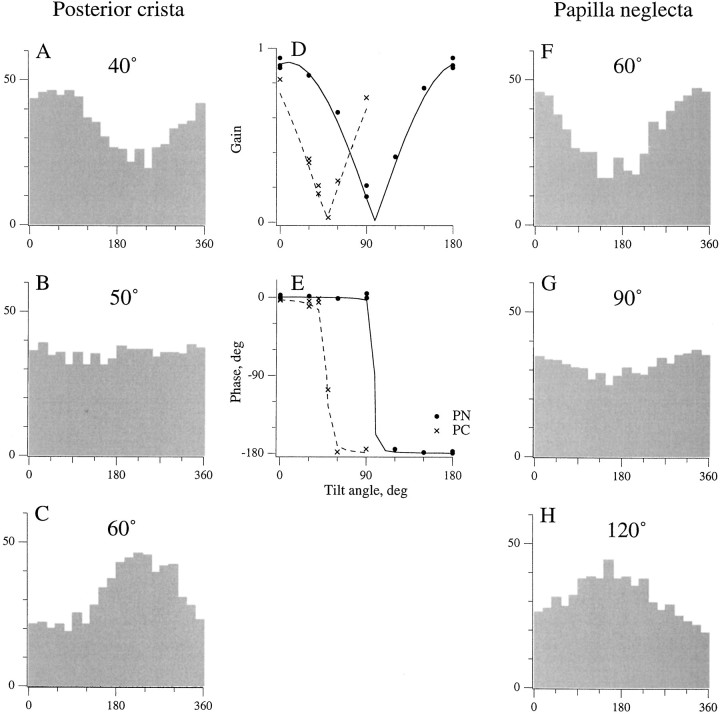
Directional properties
The directional properties of PN and PC units differed. This can be seen by comparing the sinusoidal responses of two such units forxy tilts between 0° (pure pitch) and 90° (pure roll) (Fig. 8). The reversal point for the PC unit is near 50°, whereas that for the PN unit is >90°. Combining the xy results (Fig. 8) with xz results (data not shown) allowed us to compute Vmax response vectors for the two units. Normalized (x, y, z) coordinates were (−0.74, 0.65, 0.17) for the PC unit. The signs of the x andy components imply that the unit was excited by upward pitches and ipsilateral rolls. x and ycoordinates are almost equal in size, indicating that the unit was almost equally sensitive to pitch and roll rotations; the small size of the z component implies a weak sensitivity of yaw rotations. The vector is nearly orthogonal to the plane of the posterior canal (Fig. 9A). It follows that the PC unit is maximally sensitive to rotations near the canal plane.
Fig. 8.
Responses of a PC unit (A–C) and a PN unit (F–H) as the preparation was tilted so that a 1 Hz sinusoidal rotation was a pitch at 0° tilt and a roll at 90° tilt. The response reverses polarity near 50° in the PC unit and between 90 and 120° in the PN unit. Responses were collected along two orthogonal tilt axes. The corresponding gains and phases were used to calculate response vectors for each unit. D, E, Normalized gains and phases of the responses plotted as a function of tilt angle for the two units. Gain is normalized to unity and phase to 0° when the rotation axis and the calculated response vector coincide. Curves are expected gains and phases calculated from best-fitting response vectors.
Fig. 9.
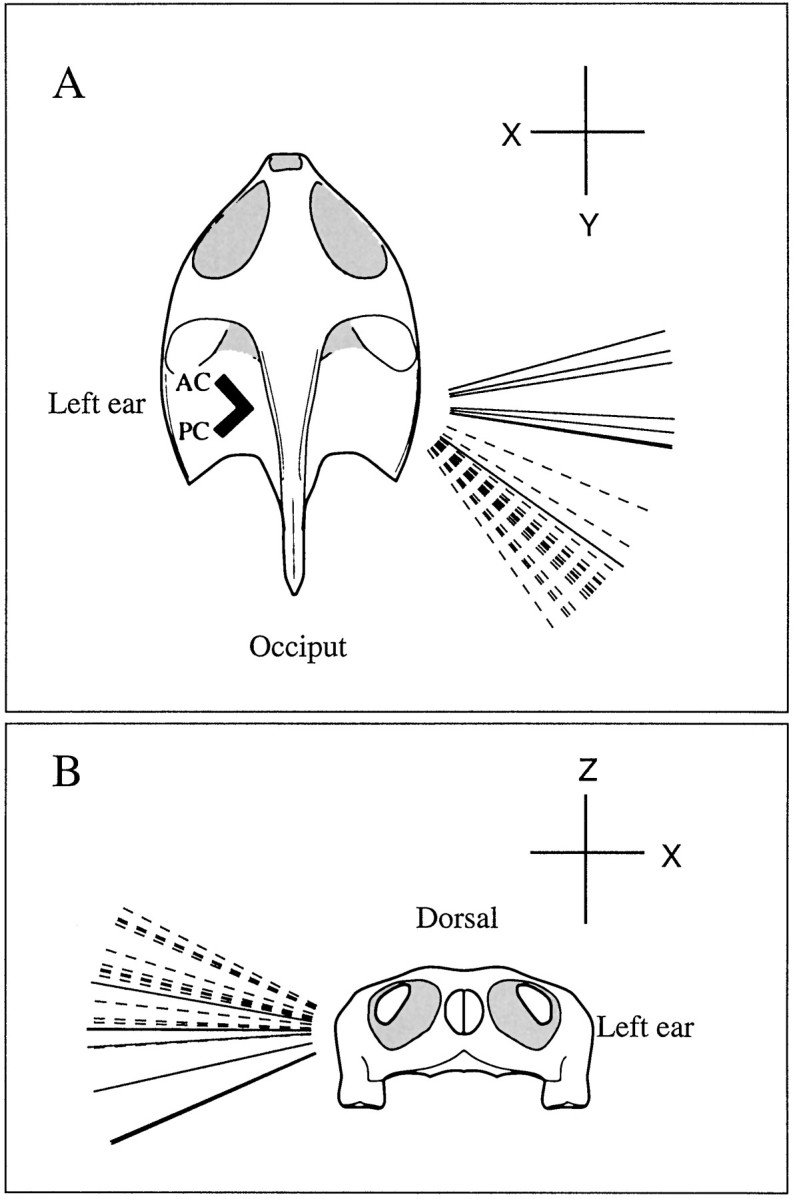
Response vectors for eight PN (solid lines) and 25 PC units (dashed lines) from left ear. Each vector indicates a head-fixed rotation axis. Rotations in the plane perpendicular to the axis give maximal responses for the particular unit. Excitatory directions obtained from the right-hand rule with all vectors pointing away from head. Thick lines inside head (top), Silhouette of the two vertical canals. A, Orientation of vectors in the horizontal plane indicate relative sensitivities to rotations around pitch (X) and roll (Y) axes. PC units respond to rotations in the plane of the posterior canal and are almost equally excited by ipsilateral rolls and upward pitches. PN units respond to rotations in the pitch plane and are excited by upward pitches. B,Orientation of vectors indicate relative sensitivities to rotations around pitch (X) and yaw (Z) axes. Both PC and PN units are much more sensitive to pitches. Although the yaw sensitivity is small for both groups, PC units may be excited by ipsilateral and PN units by contralateral yaw rotations.
Coordinates for the PN unit were (−0.91, −0.14, −0.39). The large size of the x (compared with the y) component means that the unit is much more sensitive to pitches than to rolls. Nose-up pitches are excitatory. A large yaw (z) sensitivity was peculiar to this and to another PN unit encountered in the same preparation.
Directional properties were determined in eight PN units and 25 PC units. Rotations in both the xy and xz planes were studied in 13 units (seven PN and six PC) and in one or the other plane in another 20 units (one PN and 19 PC). Results for the 13 units studied in both planes gave the following mean (±SE)Vmax coordinates of (−0.721 ± 0.022, 0.673 ± 0.016, 0.168 ± 0.024) for PC units and (−0.989 ± 0.025, 0.050 ± 0.114, −0.127 ± 0.087) for PN units. All 33 units were used in constructing vector diagrams (Fig.9A,B). The orientation of its response vector in the horizontal (xy) plane reflects the relative sensitivities of each unit to pitches and rolls (Fig. 9A) The ratio of pitch to roll sensitivity had a mean (±SE) of 1.1 ± 0.10 for 16 PC units and 7.4 ± 1.9 for eight PN units. Relative sensitivities to pitch and yaw rotations, indicated by the vector orientations in the frontal (xz) plane, are similar for the two groups of units, but the groups differ in the signs of their z components (Fig. 9B). Mean (±SE) angles with the horizontal in thexz plane were 16.1 ± 2.2° (11 PC units) and −7.7 ± 4.9° (seven PN units). The negative mean value for the PN units, although suggesting that they might be excited by contralateral yaws, is small and not statistically significant (t test, p > 0.2)
DISCUSSION
Although the PN is widely distributed among vertebrates, its function has remained obscure. Previous functional studies had been confined to elasmobranchs, in which the PN is a vibratory or auditory organ (Lowenstein and Roberts, 1951; Fay et al., 1975; Corwin, 1981). In contrast, our study shows that the PN in turtles resembles the PC (and the other two cristae) in detecting angular head rotations, although at the same time differing from the cristae in its response dynamics and directional properties. In the following sections, we relate the distinctive properties of the turtle PN to its location and to the size and shape of its cupula. This puts us in a position to speculate about the function of the organ in other vertebrates in which there is relevant morphological, but no functional, information.
Response dynamics
PC afferents respond to some combination of angular velocity and angular acceleration, whereas PN units encode almost halfway between angular acceleration and angular jerk. To a first approximation, PN responses can be considered a differentiated version of PC responses. We now argue that the differences in response dynamics can be explained by the macromechanics governing the bulk displacements of the two cupulae. The PC cupula extends to the vault of the ampulla, thereby occluding the ampullary lumen. Angular head movements result in an oppositely directed motion of the endolymph within the posterior canal and a pressure difference across the PC cupula. Assuming that there is no bulging of the ampullary walls, fluid continuity requires that the bulk displacements of the PC cupula and the endolymph are equal. From its location and size, the PN cupula should stick into the endolymph fluid stream without occluding it. The cupula is assumed to be displaced by fluid flow originating in the vertical semicircular canals (see Directional properties). Fluid forces are likely to be viscous and these should be proportional to fluid velocity. Assuming the elastic restoring forces were acting on the PN cupula, its displacement would be proportional to fluid velocity and hence, would be a differentiated version of PC cupular displacement.
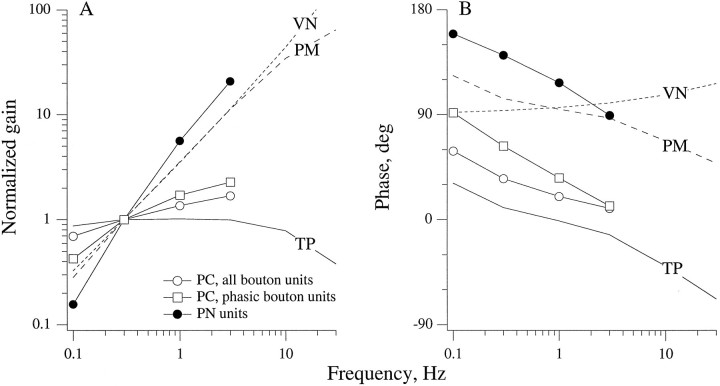
To consider these ideas in more detail, we used a model (Fig.10, VN) originally developed by van Netten (1991) (van Netten and Kroese, 1987) to account for the dynamics of cupular motion in lateral line canal organs. The fluid force acting on the cupula is calculated from Stokes’ analysis of fluid flow past a vibrating sphere. It is assumed that the only restoring force on the cupula is its elastic coupling to the neuroepithelium, presumably contributed by the bending stiffness of the hair bundles. The VN transfer function gives PN cupular displacement relative to endolymph displacement. To obtain a transfer function (PM) relating PN cupular displacement to angular head velocity, we multiply VN by TP, the transfer function (see Eq. 1) relating endolymph flow in the semicircular canals to head velocity. The overall model for PN cupular displacement is PM = VN * TP.
Fig. 10.
Mean Bode plots for three unit samples are compared with three theoretical transfer functions. Unit samples: all PC bouton units (n = 30), the PC bouton units with the largest phase leads at 0.3 Hz (n = 7), and PN units (n = 18). Theoretical transfer functions:TP (torsion-pendulum model), Expected endolymph displacement for semicircular canals re: angular head velocity (see Equation 1b in Results for parameters). VN, expected PN cupular displacement re: endolymph displacement, was calculated from Equation 15 (van Netten, 1991) with viscosity, μ = 1.0 × 10⁻² gm/cm · sec, density, ρ = 1.0 gm/cm3; PN cupular radius, a = 6 × 10⁻³ cm; and PN cupular elasticity,S = 26 dynes/cm. PM, Expected displacement of PN cupula re: angular head velocity was obtained from PM = TP * VN.
Figure 10 compares the behavior of the PM model with the mean response dynamics of PN afferents. Over the frequency range, 0.01–3 Hz, VN can be simulated by an skoperator, k = 1.05, so that PM is close to a differentiated version of TP. The PN afferent gain curve is steeper and the PN afferent phase lead is larger than predicted from PM. Similar discrepancies are seen between PC afferent discharge and TP, the expected mechanical response of the PC cupula. Presumably, the discrepancies for both organs reflect transduction stages between macromechanics and afferent discharge (Baird et al., 1988; Boyle et al., 1991). In the case of the mean PC curve based on all bouton afferents (Fig. 10), the discrepancy can be described by ansk operator, k = 0.27, which predicts a constant phase discrepancy of 24° across frequencies. For PN units and for the most phasic PC bouton units, ansk operator will not suffice, because phase discrepancies decline with increasing frequency. Because their phase curves parallel one another, it might be supposed that similar transduction mechanisms are responsible for the discrepancies in PN and the most phasic PC units.
Directional properties
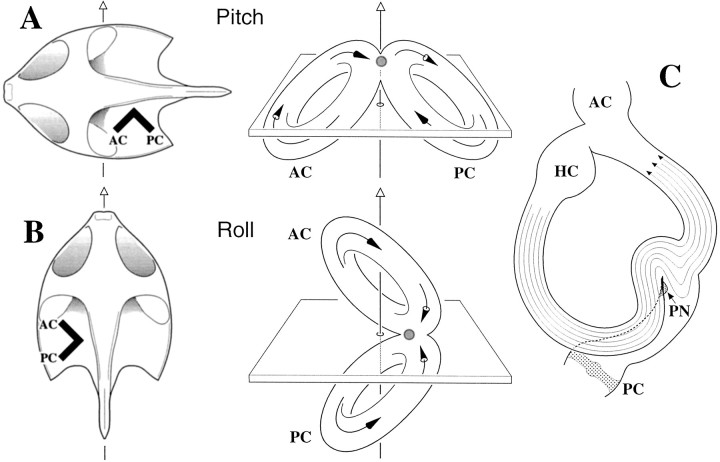
The PN is located between the entrances of the anterior and posterior ampullae into the utriculus and immediately underneath the crus commune (Figs. 1, 11). Because of its location, the PN is in the direct line of endolymph flow from the anterior canal (AC) and posterior canal (PC). A maximal response to pitches is easily explained. During pitches the AC and PC flows will reinforce one another (Fig. 11A), whereas during rolls the two flows will cancel (Fig. 11B). Hair bundle orientation is consistent with both the PN and PC being excited by upward pitches. The PN is relatively insensitive to yaw rotations. A possible reason is that the horizontal canal (HC) duct joins the utriculus in front of the PN, so the latter is not particularly well located to sample HC endolymph flow. Figure 11C illustrates ipsilateral (utriculofugal) HC endolymph flow during contralateral yaw rotations. The flow should displace the PN cupula in an excitatory (posterior) direction as the streamlines spread out from the HC canal duct into the enlarged space of the utriculus. Consistent with this prediction, our data suggest that contralateral yaws have a small excitatory effect on PN units.
Fig. 11.
The papilla neglecta (PN) is suitably positioned to detect flow from both the anterior (AC) and posterior (PC) vertical canals, seen in silhouette in A and B.Arrows with open arrowheads, top, Head rotations. Solid-headed arrows inside membranous labyrinth, Directions of endolymph flow. Shaded circle, Location of PN. A, An upward pitch leads to utriculopetal flow in AC and utriculofugal flow in PC. The AC is inhibited, and the PC is excited. AC and PC flows are in same direction in vicinity of PN. Because the hair bundle orientation is the same for the PN and PC, the PN is excited. B, Contralateral roll leads to utriculopetal flow in both the AC and PC. Both canals are inhibited. AC and PC flows are in opposite directions near PN and should cancel. C, Flow in the horizontal canal (HC) during a contralateral yaw. The posterior ampulla and crista are seen below. Because of its location posterior to the entrance of the horizontal canal duct into the utriculus, the PN is not in the direct line of endolymph flow. Nevertheless, streamlines entering the utriculus may displace the PN cupula in a posterior (excitatory) direction.
Although the scheme summarized in Figure 11 is plausible, there is a need for experimental confirmation of the proposed relation between the pitch sensitivity of the PN and endolymph flow in the two vertical canals.
Comparative considerations
In turtles, the PN is sensitive to rotational head movements in the pitch plane and encodes between angular acceleration and jerk. Two features appear to determine these properties. First, a location between the anterior and posterior ampullae allows the organ to sample fluid flows from both vertical canals and thus to respond to rotations in a plane symmetrically disposed to the AC and PC planes. The other feature, a cupula that can sample fluid flow without occluding it, is considered essential for the organ to encode between angular acceleration and jerk. Both features are present in bony fish, reptiles, birds, and some mammals (Baird, 1974; Lewis et al., 1985), suggesting that the PN in these animals functions as it does in turtles. Among cartilaginous fish, a similar arrangement is found inChimaera but not in elasmobranches (Baird, 1974; Corwin, 1978). In the latter species, the location of the PN is such that it is unlikely to sample fluid flow from any canal. Not surprisingly, the PN of sharks and rays has an entirely different function, involving sensitivity to vibratory or acoustic stimuli (for review, see Corwin, 1981). Correlated with the difference in function, the PN in elasmobranches can be much larger than in other vertebrates (Corwin, 1978), its cupula occludes the endolymphatic space (Vilstrup, 1951), and there are specializations in the parietal cartilage that may facilitate the delivery of acoustic energy to the ear (Corwin, 1981).
A PN is found in several mammals, but is apparently absent in some species (for review, see Lewis et al., 1985). Among mammals, it has been best described in the cat, in which it is quite similar in location, size, and shape to the organ found in lower vertebrates (Gacek, 1961; Montandon et al., 1970; Hoshino and Kodama, 1976). The incidence of a PN in humans is difficult to evaluate from the literature. A PN was found in 17 of 223 temporal bones (Okano et al., 1978), but most of the material in this and other human studies was not serially examined, in which case the PN could have been missed because of its small size. Two other facts about the human PN deserve comment. First, it is located in the posterior ampulla instead of in the utriculus (Montandon et al., 1970; Okano et al., 1978). Second, the human PN is not always innervated by a separate branch of the posterior ampullary nerve and in some cases a separate branch innervates both the PN and a part of the PC (Okano et al., 1978). Based on these two considerations, it has been suggested that the PN is incorporated into the PC in some subjects (Montandon et al., 1970). In such an arrangement, the PN would most likely lose its unusual properties, including its maximal responses to pitches and its distinctive response dynamics. Before this conclusion is reached, however, it would be prudent to confirm that a separate PN is absent in a substantial fraction of humans.
Despite its small size, the PN has kept essentially the same structure in bony fish, reptiles, birds, and some mammals. Its evolutionary persistence suggests that it plays a distinctive role in vestibular processing. The present study shows that the organ in the turtle has unique sensory coding properties. Even so, it remains unclear how the PN innervation could make an impact on central processing when the PC innervation outnumbers it by 30:1 in the turtle and 100:1 in the cat. The numeric disparity would suggest that the central projections of the PN are also unique.
Footnotes
This work was supported by National Institutes of Health Grant DC 02058. At the start of the research, A.M.B. was a Postdoctoral Fellow of the National Institutes of Health. We thank Drs. Bernd Fritzsch, Richard D. Rabbitt, and Anna Lysakowski for helpful comments on a previous version of this paper and Dr. Ellengene Peterson for the use of a confocal microscope at Ohio University.
Correspondence should be addressed to Dr. Alan M. Brichta, Department of Surgery (Otolaryngology, Head and Neck Surgery), University of Chicago, 5841 South Maryland Avenue, Chicago, IL 60637.
REFERENCES
- 1.Art JJ, Fettiplace R. Efferent desensitization of auditory nerve fibre responses in the cochlea of the turtle Pseudemys scripta elegans. J Physiol (Lond) 1984;356:507–523. doi: 10.1113/jphysiol.1984.sp015480. [DOI] [PMC free article] [PubMed] [Google Scholar]
- 2.Baird IL. Anatomical features of the inner ear in submammalian vertebrates. In: Keidel WD, Neff WD, editors. Handbook of sensory physiology. Springer; Berlin: 1974. pp. 159–212. [Google Scholar]
- 3.Baird RA, Desmadryl G, Fernández C, Goldberg JM. The vestibular nerve of the chinchilla. II. Relation between afferent response properties and peripheral innervation patterns in the semicircular canals. J Neurophysiol. 1988;60:182–203. doi: 10.1152/jn.1988.60.1.182. [DOI] [PubMed] [Google Scholar]
- 4.Batchelor GK. An introduction to fluid dynamics. Cambridge UP; Cambridge, UK: 1967. [Google Scholar]
- 5.Blanks RHI, Precht W. Functional characterization of primary vestibular afferents in the frog. Exp Brain Res. 1976;25:369–390. doi: 10.1007/BF00241728. [DOI] [PubMed] [Google Scholar]
- 6.Boyle R, Carey JP, Highstein SM. Morphological correlates of response dynamics and efferent stimulation in horizontal semicircular canal afferents. J Neurophysiol. 1991;66:1504–1521. doi: 10.1152/jn.1991.66.5.1504. [DOI] [PubMed] [Google Scholar]
- 7.Brichta AM, Goldberg JM. Afferent and efferent responses from morphological fiber classes in the turtle posterior crista. Ann NY Acad Sci. 1996;781:183–195. doi: 10.1111/j.1749-6632.1996.tb15701.x. [DOI] [PubMed] [Google Scholar]
- 8.Brichta AM, Peterson EH. Functional architecture of vestibular primary afferents from the posterior semicircular canal of a turtle, Pseudemys (Trachemys) scripta elegans. J Comp Neurol. 1994;344:481–507. doi: 10.1002/cne.903440402. [DOI] [PubMed] [Google Scholar]
- 9.Corwin JT. The relation of inner ear structure to the feeding behavior in sharks and rays. In: Becker RP, Johari O, editors. Scanning electron microscopy. Scanning Electron Microscopy, Inc; Chicago: 1978. pp. 1105–1112. [Google Scholar]
- 10.Corwin JT. Peripheral auditory physiology in the lemon shark: evidence of parallel otolithic and nonotolithic sound detection. J Comp Physiol. 1981;142:379–390. [Google Scholar]
- 11.Crawford AC, Fettiplace R. Ringing responses in cochlear hair cells of the turtle. J Physiol (Lond) 1978;284:120P–122P. [PubMed] [Google Scholar]
- 12.Fay RR, Kendall JI, Popper AN, Tester AL. Vibration detection by the macula neglecta of sharks. Comp Biochem Physiol. 1975;47A:1235–1240. doi: 10.1016/0300-9629(74)90097-8. [DOI] [PubMed] [Google Scholar]
- 13.Fernández C, Goldberg JM. Physiology of peripheral neurons innervating semicircular canals of the squirrel monkey. II. Response to sinusoidal stimulation and dynamics of peripheral vestibular system. J Neurophysiol. 1971;34:661–675. doi: 10.1152/jn.1971.34.4.661. [DOI] [PubMed] [Google Scholar]
- 14.Fritzsch B, Wake MH. The inner ear of gymnophine amphibians and its nerve supply: a comparative study of regressive events in a complex sensory system (Amphibia, Gymnophiona). Zoomorphology. 1988;108:201–217. [Google Scholar]
- 15.Gacek RR. The macula neglecta in the feline species. J Comp Neurol. 1961;116:317–323. doi: 10.1002/cne.901160305. [DOI] [PubMed] [Google Scholar]
- 16.Gil-Loyzaga P, Raymond J, Gabrion J. Carbohydrates detected by lectins in the vestibular organ. Hear Res. 1985;18:269–272. doi: 10.1016/0378-5955(85)90043-7. [DOI] [PubMed] [Google Scholar]
- 17.Goldberg JM, Fernández C. Physiology of peripheral neurons innervating semicircular canals of the squirrel monkey. I. Resting discharge and response to constant angular accelerations. J Neurophysiol. 1971;34:635–660. doi: 10.1152/jn.1971.34.4.635. [DOI] [PubMed] [Google Scholar]
- 18.Goldberg JM, Fernández C. Comparison of the response to angular and linear accelerations of peripheral vestibular neurons in the squirrel monkey. Acta Otolaryngol (Stockh) 1975;80:101–110. doi: 10.3109/00016487509121307. [DOI] [PubMed] [Google Scholar]
- 19.Goldberg JM, Smith CE, Fernández C. Relation between discharge regularity and responses to externally applied galvanic currents in vestibular nerve afferents of the squirrel monkey. J Neurophysiol. 1984;51:1236–1256. doi: 10.1152/jn.1984.51.6.1236. [DOI] [PubMed] [Google Scholar]
- 20.Hess BJ, Angelaki DE. Modelling spatiotemporal properties of directionally sensitive multi-input single-output systems. Biol Cybern. 1993;69:407–414. [PubMed] [Google Scholar]
- 21.Hillman DE, McLaren JW. Displacement configuration of semicircular canal cupulae. Neuroscience. 1979;4:1989–2000. doi: 10.1016/0306-4522(79)90070-8. [DOI] [PubMed] [Google Scholar]
- 22.Honrubia V, Hoffman LF, Sitko S, Schwartz IR. Anatomic and physiological correlates in bullfrog vestibular nerve. J Neurophysiol. 1989;61:688–701. doi: 10.1152/jn.1989.61.4.688. [DOI] [PubMed] [Google Scholar]
- 23.Hoshino T, Kodama A. Scanning electron microscopic study of the cat papilla neglecta. Arch Otorhinolaryngol. 1976;212:141–146. doi: 10.1007/BF00454275. [DOI] [PubMed] [Google Scholar]
- 24.Kelley RO, Dekker RA, Bluemink JG. Ligand-mediated osmium binding: its application in coating biological specimens for scanning electron microscopy. J Ultrastruct Res. 1973;45:254–258. doi: 10.1016/s0022-5320(73)80051-6. [DOI] [PubMed] [Google Scholar]
- 25.Lewis ER, Leverenz EL, Bialek WS. The vertebrate inner ear. CRC; Boca Raton, FL: 1985. [Google Scholar]
- 26.Lombard RE, Bolt JR. Evolution of the tetrapod ear: an analysis and reinterpretation. Biol J Linn Soc. 1979;11:19–76. [Google Scholar]
- 27.Lowenstein O, Roberts TDM. The localization and analysis of the response to vibration from the isolated elasmobranch labyrinth. A contribution to the problem of the evolution of hearing in vertebrates. J Physiol (Lond) 1951;114:471–489. doi: 10.1113/jphysiol.1951.sp004638. [DOI] [PMC free article] [PubMed] [Google Scholar]
- 28.Money KE, Bonen L, Beatty JD, Kuehn LA, Sokoloff M, Weaver RS. Physical properties of fluids and structures of vestibular apparatus of the pigeon. Am J Physiol (Lond) 1971;220:140–147. doi: 10.1152/ajplegacy.1971.220.1.140. [DOI] [PubMed] [Google Scholar]
- 29.Montandon P, Gacek RR, Kimura RS. Crista neglecta in the cat and human. Ann Otol Rhinol Laryngol. 1970;79:105–112. doi: 10.1177/000348947007900110. [DOI] [PubMed] [Google Scholar]
- 30.Okano Y, Sando I, Myers EN. Crista neglecta in man. Ann Otol Rhinol Laryngol. 1978;87:306–312. doi: 10.1177/000348947808700302. [DOI] [PubMed] [Google Scholar]
- 31.Oldham KB, Spanier J. The fractional calculus. Academic; New York: 1974. [Google Scholar]
- 32.Rasmussen GL. A method for staining the statoacoustic nerve in bulk with Sudan Black B. Anat Rec. 1961;139:465–469. doi: 10.1002/ar.1091390403. [DOI] [PubMed] [Google Scholar]
- 33.Spanier J, Oldham KB. An atlas of functions. Hemisphere; New York: 1987. [Google Scholar]
- 34.Steinhausen W. Über den nachweis der bewegung der cupula in der intakten bogengansampulle des labyrinthes bei der naturlichen rotatorischen und calorischen reizung. Pflügers Arch. 1931;222:322–328. [Google Scholar]
- 35.van Netten SM. Hydrodynamics of the excitation of the cupula in the fish canal lateral line. J Acoust Soc Am. 1991;89:310–319. [Google Scholar]
- 36.van Netten SM, Kroese AB. Laser interferometric measurements on the dynamic behaviour of the cupula in the fish lateral line. Hear Res. 1987;29:55–61. doi: 10.1016/0378-5955(87)90205-x. [DOI] [PubMed] [Google Scholar]
- 37.Vilstrup T. The gelatinous substance of the macula neglecta. Ann Otol Rhinol Laryngol. 1951;60:1–17. doi: 10.1177/000348945106000106. [DOI] [PubMed] [Google Scholar]


