

Abstract
Physiological studies of CA3→CA1 synaptic transmission and plasticity have revealed both pre- and postsynaptic effects. Understanding the extent to which individual presynaptic axonal boutons could provide local compartments for control of synaptic efficacy and microconnectivity requires knowledge of their three-dimensional morphology and composition. In hippocampal slices, serial electron microscopy was used to examine a nearly homogeneous population of CA3→CA1 axons in the middle of stratum radiatum of area CA1. The locations of postsynaptic densities (PSDs), vesicles, and mitochondria were determined along 75 axon segments (9.1 ± 2.0 μm in length). Synapses, defined by the colocalization of PSDs and vesicles, occurred on average at 2.7 μm intervals along the axons. Most varicosities (68%) had one PSD, 19% had 2–4 PSDs, and 13% had none. Synaptic vesicles occurred in 90% of the varicosities. One-half (53%) of the varicosities lacked mitochondria, raising questions about their regulation of ATP and Ca2+, and 8% of varicosities contained only mitochondria. Eleven axons were reconstructed fully. The varicosities were oblong and varied greatly in both length (1.1 ± 0.7 μm) and volume (0.13 ± 0.14 μm3), whereas the intervaricosity shafts were narrow, tubular, and similar in diameter (0.17 ± 0.04 μm) but variable in length (1.4 ± 1.2 μm). The narrow axonal shafts resemble dendritic spine necks and thus could promote biochemical compartmentalization of individual axonal varicosities. The findings raise the intriguing possibility of localized differences in metabolism and connectivity among different axons, varicosities, and synapses.
Keywords: CA3, CA1, pyramidal neuron, Schaffer collaterals, boutons en passant, axonal varicosities, presynaptic terminal, postsynaptic density, synaptic vesicles, mitochondria, ultrastructure
The cellular components underlying the neural operations performed by the hippocampus during memory and navigation tasks are becoming elucidated, but gaps remain in our understanding of information flow in this system. The CA3→CA1 projection is significant both for its synaptic plasticity and for the extent of convergence and divergence, which is greater than elsewhere in the trisynaptic circuit (Andersen et al., 1971; Johnston and Amaral, 1997). The number of synapses made by a CA3 cell in area CA1 has been inferred to be ∼20,000 on the basis of light microscopic (LM) counting of axonal varicosities (Andersen et al., 1994). Important factors for CA3→CA1 connectivity are (1) the distribution and composition of varicosities along the CA3 axons, (2) the extent and pattern of axonal branching, and (3) the quantal contents and release probabilities of the synapses.
CA3→CA1 axons (comprising Schaffer collateral and commissural axons) are morphologically heterogeneous. At the LM level, individual CA3→CA1 branches are thin unmyelinated axons with abundantboutons en passant (Ishizuka et al., 1990; Sorra and Harris, 1993; Andersen et al., 1994; Li et al., 1994). Westrum and Blackstad (1962) provided the first electron microscopic (EM) study of stratum radiatum axons, including a 31-section serial analysis spanning ∼1.5 μm with representative wax reconstructions. They described ovoid axonal varicosities separated by variable lengths of axonal shafts. Serial EM studies also have revealed numerous multiple-synapse boutons (MSBs) and established that many of the CA3 axons could make multiple synapses on a single CA1 cell (Sorra and Harris, 1993; Harris, 1995;Woolley et al., 1996).
We sought to answer several fundamental questions about the ultrastructure of CA3→CA1 axons. What is a varicosity? How are varicosities spaced along axons and how are synapses distributed among them? Where are mitochondria located in relationship to synapses? What are the dimensions of varicosities and their constituents? The answers are essential for understanding the relationships between axonal structures and cellular mechanisms of connectivity and plasticity. These questions pertain not only to these axons but to corticostriatal (Kincaid et al., 1998), nigrostriatal (Groves et al., 1994), Ia afferent (Nicol and Walmsley, 1991; Pierce and Mendell, 1993), and other varicosity-rich axons throughout the nervous system.
Reconstruction from serial EM was used to quantify the diversity in components and dimensions of presumed CA3→CA1 axonal shafts and varicosities. Stratum radiatum axons of area CA1 were studied, because the vast majority are CA3→CA1 axons arising from ipsilateral Schaffer collaterals and contralateral commissural axons (for review, seeJohnston and Amaral, 1997). CA3→CA1 axons were identified by the presence of round clear vesicles at asymmetric synapses and were distinguished readily from axons of interneurons, which have flattened pleomorphic vesicles at symmetric synapses (Harris and Landis, 1986). Our strategy was to analyze first a large group of CA3→CA1 axons by inspection via serial EM and then a representative subset by detailed three-dimensional reconstruction. The findings raise the intriguing possibility of substantial differences in metabolism and connectivity among different varicosities along a single axon and among neighboring CA3→CA1 axons.
MATERIALS AND METHODS
Hippocampal slices. Slices were prepared by standard procedures (Harris and Teyler, 1984; Jackson et al., 1993; Sorra and Harris, 1998). Two adult male Long–Evans hooded rats (65- and 66-d-old, 334 and 355 gm, respectively) were anesthetized deeply with pentobarbital (80 mg/kg) and decapitated. The brains were removed, and the hippocampi were dissected free. Four to six transverse 400 μm slices were cut from the middle third of the hippocampi with a tissue chopper (Stoelting, Wood Dale, IL) into ice-cold physiological saline containing (in mm) 117 NaCl, 5.3 KCl, 26 NaHCO3, 1 NaH2PO4, 2.5 CaCl2, 1.3 MgSO4, and 10 glucose, equilibrated with 95% O2/5% CO2, pH 7.4. Slices were transferred to a slice chamber (Stoelting) and placed onto nets over wells with physiological saline at the interface of humidified 95% O2/5% CO2 at 32°C (Fig.1A).
Fig. 1.

Location, orientation, and sectioning of CA1 stratum radiatum samples. The air and netsurfaces are labeled. A, A hippocampal slice, depicting the Schaffer collateral of a CA3 pyramidal neuron projecting to the apical dendrites of a pyramidal neuron in CA1 stratum radiatum. After fixation, the slice was trimmed initially to leave just the central part of area CA1 (bold outline). DG, Dentate gyrus; Sub, subiculum. B, Higher power view of the trimmed area of CA1, showing pyramidal neurons in stratum pyramidale (SP) and their apical dendrites, which are cross-sectioned in the middle third of stratum radiatum (bold outline). C, Thick and thin sections of the block face, spanning the entire thickness of the slice, were examined to ascertain excellent tissue preservation and to determine the optimal level for taking serial thin sections. Then a right-angled trapezoid (bold outline) for serial thin sectioning was created at that level by trimming away surrounding tissue. D, On each serial thin section, micrographs were taken of the same region (bold outline).E, The resulting stack of serial micrographs totaled 107–109 images, with the dimensions indicated. F, The triangulation method used to measure lengths of axons. Thepoints at which the axons exited the stack of images, labeled A and E, and crossed the middle, labeled C, were marked. On overlays, the distances in the x–y plane between the exit points and the middle point were measured (line segments AB andCD). The z-axis differences between the points (line segments BC and DE) were calculated from the measured average section thickness and the number of intervening sections. The sum of the calculated hypotenuses (line segments AC and CE) gave the total length of the axon segment.
Physiological recordings were done to assure slice viability (Harris and Teyler, 1984; Jackson et al., 1993; Sorra and Harris, 1998). Two concentric bipolar stimulating electrodes were positioned 600–800 μm apart in the middle of stratum radiatum on either side of a single extracellular recording electrode. Slices were judged healthy if the stimulus–response curves were sigmoidal and the half-maximal responses remained stable for at least 1 hr before fixation.
Serial electron microscopy. After 1 hr of stable recording of field EPSPs, the slice was fixed rapidly in 6% glutaraldehyde and 4% paraformaldehyde in 100 mm cacodylate buffer for 8 sec under microwave irradiation (Jensen and Harris, 1989), stored overnight in the fixative, and then rinsed in buffer. Each slice was trimmed manually under a dissecting microscope to leave a block of tissue containing area CA1, with the apical dendrites of the pyramidal cells perpendicularly cut in the middle third of stratum radiatum (Fig.1B). Slices were bathed with 1% osmium and 1.5% potassium ferrocyanide in 100 mm cacodylate buffer, cooled in an ice bath to <15°C, and microwaved (Pelco 3450 Laboratory Microwave Processor, Ted Pella, Redding, CA) for 2.5 min at 37°C. After several buffer rinses, they were bathed with 1% osmium in 100 mm cacodylate buffer, cooled, and microwaved for 2.5 min at 37°C. Slices were rinsed four to five times in buffer and twice in water; then they were stained en bloc with 1% aqueous uranyl acetate while being cooled on ice and were microwaved for 2.5 min at 37°C. Two brief water rinses ensued. Samples were dehydrated in an acetone series (50, 70, 90, and 100%) for 40 sec each in the microwave at 37°C. Infiltration began with acetone and 1:1 Epon/Spurr’s resins for 1 hr on a rotator at 37°C, followed by 2:1 acetone/Epon/Spurr’s resins overnight. After replacement with fresh 100% resin for several hours, the samples were embedded in coffin molds, with the dendrites orthogonal to the cutting plane. Samples were cured for 48 hr at 60°C.
The polymerized blocks were examined microscopically to select the target area, located in the middle third of stratum radiatum in CA1 between strata pyramidale and lacunosum moleculare, in an area of CA1 midway between the CA2 and subicular regions. The blocks were trimmed to this level with a Reichert UltraCut S Ultramicrotome, and then several ∼1 μm thick sections and ∼60 nm thin sections were taken. Thick sections were stained with 1% toluidine blue and were examined by LM to ensure that dendrites were cross-sectioned and to guide subsequent trimming to a trapezoidal area for serial sectioning. Thin sections were mounted on Pioloform-coated (SPI Supplies, Westchester, PA) slot grids (Synaptek, Ted Pella) and counterstained with saturated ethanolic uranyl acetate, followed by Reynolds lead citrate, each for 5 min. Sections were examined with a JEOL 1200EX electron microscope (JEOL, Peabody, MA) to choose an area midway between the air and net surfaces of the hippocampal slice for subsequent serial thin sectioning (Fig. 1C). This was a critical step, because the quality of tissue preservation improved in a graded manner from the air and net surfaces toward the middle. At an optimal depth, excellent tissue preservation was judged by the relative absence of dark processes, disrupted PSDs and microtubules, and swollen boutons and mitochondria.
A diamond cutting tool was used to create a raised trapezoid (with sides ∼60 × 30 × 30 × 35 μm) encompassing this area, right-angling one of its sides to enhance the cohesiveness of the series ribbon (Fig. 1C). Serial sections were cut, mounted, and counterstained as above (Fig. 1D). Grids were placed in a grid cassette (Advance Microscopy Techniques, Danvers, MA), stored in numbered gelatin capsules (Electron Microscopy Sciences, Fort Washington, PA), and mounted in a rotating stage to obtain uniform orientation of sections on adjacent grids. The series of sections was photographed at 10,000× magnification (Fig.1D,E). Calibration grids (Ernest Fullam, Latham, NY) were photographed with each series. A cross-sectioned dendrite spanning all sections furnished a fiduciary reference for maintaining a centered field of view. The two samples yielded images of 107 (series LMTN) and 109 (series ZNQB) consecutive serial sections. Section thickness (ST) averaged 64 nm in LMTN and 50 nm in ZNQB, as determined by measuring the diameters (d) of tubular or spherical objects (mostly mitochondria and axons) in the micrographs (x–y plane) and counting the number of sections (n) that they spanned (z-axis); ST = d/n.
Terminology. The following nomenclature was used to describe axonal structures. Axon: Entire structure containing axonal shafts and varicosities. Axon segments: The short (∼10 μm) lengths of axons within the serial EM image stacks. Axonal shafts: Relatively straight, tubular, narrow-diameter portions of the axon, containing one to several microtubules and occasional small membranous organelles. Axonal varicosities: Any swelling of the axon exceeding the typical variation in diameter of the adjacent axonal shafts by more than ∼50%. The presence, but not the absence, of PSDs, vesicles, or mitochondria was used as supportive evidence to identify varicosities. Synaptic bouton: A varicosity with synaptic vesicles and one or more PSDs. A single-synapse bouton (SSB) is associated with one PSD, and amultiple-synapse bouton (MSB) is associated with two or more PSDs. Postsynaptic density (PSD): Osmiophilic sites on dendritic spines or shafts, closely apposed to the synaptic bouton.
Inspective analysis. A large set of axons was analyzed by visual inspection, recording the presence or absence of components and the lengths of the axon segments through serial sections. On a section in the middle of the stack (section number 55), the centrally situated axons were identified and labeled for analysis. Axons were examined along their lengths within the stack of serial images. For each axon segment the number of varicosities was counted, noting for each varicosity whether it was a “complete” varicosity flanked on both sides by axonal shafts or a “partial” varicosity crossing the margin of the image stack. Each complete varicosity was scored for its numbers of PSDs and mitochondria and the presence or absence of vesicles.
Triangulation method for axon length measurement. Because the axon segments followed fairly straight trajectories on the ∼10 μm scale of the image stack, their lengths were measured by a simplified method (Fig. 1F). For each axon segment the x–y positions of the upper and lower points of exit from the image stack and the x–y position on a middle section (section 55) were marked on a transparent overlay. On the overlay the distances from the two exit points to the middle position were measured. The number of sections spanned times the average section thickness gave the z-axis distance between the points. By calculating the lengths of the two hypotenuses connecting each exit point with the middle position, the total axon segment length was obtained as the sum of those two line segments. The degree to which this method approximated the true distance was gauged by comparison to the section-by-section measurements with digital reconstruction (see below). Values obtained by the triangulation method were 99 ± 7% (mean ± SD, n = 11) of the lengths measured by reconstruction, validating the assumption of axonal straightness and the use of this method for these axons.
Digital reconstructive analysis. Eleven of the 75 axons were chosen for detailed three-dimensional reconstruction (eight from series LMTN and three from series ZNQB). The selection was aimed at demonstrating the varieties of varicosities and combinations of PSDs, vesicles, and mitochondria; the dimensions of the components werenot used as selection criteria. Digitally scanned images of the micrographs were aligned in two stages, using IGL Trace software developed by John Fiala (Children’s Hospital Image Graphics Laboratory, Boston, MA). After gross registration of the entire stack of full-field images, subfields with the areas of interest were finely aligned to create a stack of images for each axon. Alignments performed in this manner were precise and efficient, and no images were lost because of poor alignment. Contours of individual axonal shafts, varicosities, PSDs, and mitochondria were traced digitally, and vesicle positions were marked. Lengths of axon segments, shafts, and varicosities were measured directly by summing the line segments between numerous points along the middle of axons throughout their length. The volumes, areas, and total numbers of structures were computed. Contours were displayed three-dimensionally (3D Studio Max 2, Kinetix, San Francisco, CA) without moving, editing, or otherwise altering any data points. Axons, PSDs, vesicles, and mitochondria were rendered with smooth surfaces that were textured and colored to make them more distinguishable.
RESULTS
Inspective three-dimensional analysis of axons via serial EM
The ultrastructural features of axonal shafts and varicosities in stratum radiatum (Fig. 2) were as previously described (Westrum and Blackstad, 1962; Harris and Stevens, 1989; Sorra and Harris, 1993). To quantify the three-dimensional characteristics of CA3→CA1 axons, we first inspected a large number of axons for the presence or absence of features, because this is much faster than detailed three-dimensional reconstruction.
Fig. 2.
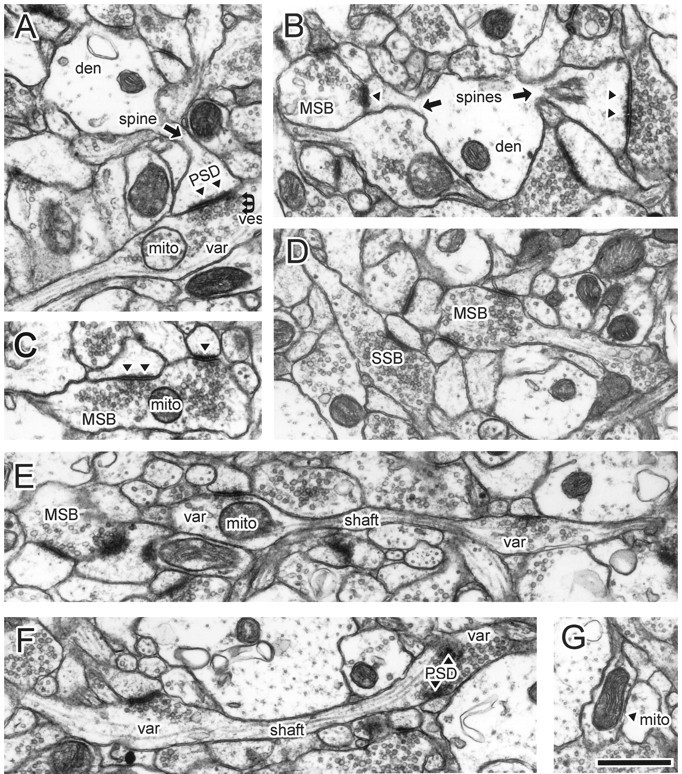
Ultrastructural features of CA3 varicosities and axons in stratum radiatum of area CA1. A, Synaptic bouton synapsing with a dendritic spine. B, A dendrite with two spines receiving input from two boutons, including one MSB. The MSB contained a mitochondrion in nearby sections (data not shown).C, Example of an MSB, with a presynaptic mitochondrion. Inspection of adjacent sections revealed a third PSD. D, Several boutons, including an MSB and SSB. The MSB, but not the SSB, contained out-of-plane mitochondria. E, Longitudinally sectioned axon with two boutons, neither of which had additional PSDs or mitochondria in adjacent images. F, Longitudinally sectioned axon. A mitochondrion occupied the right, but not the left, bouton when it was examined three-dimensionally.G, A varicosity occupied by a single mitochondrion but not associated with PSDs or vesicles. Note that the images shown in the subsequent figures are from different axons. den, Dendritic shaft; mito, mitochondria; MSB, multiple-synapse bouton; PSD, postsynaptic density,filled triangles in B andC; SSB, single-synapse bouton;shaft, axonal shaft (arrows);var, axonal varicosity; ves, vesicles. Scale bar, 1.0 μm.
Axon segments
Seventy-five axons were analyzed in serial sections (50 from set LMTN and 25 from ZNQB). All but three (∼2%) could be followed without difficulty until both ends coursed past the margins of the image stack. The axons followed fairly straight paths, traveling in diverse directions rather than in parallel or in fascicles. The average length of axon segments determined by the triangulation method (see Materials and Methods, Inspective Analysis) was 9.1 ± 2.0 μm (mean ± SD), totaling 674 μm (Table1). No definite axonal bifurcations or terminations were seen in these short segments, in accord with previous EM (Westrum and Blackstad, 1962) and LM observations (Ishizuka et al., 1990; Sorra and Harris, 1993; Li et al., 1994).
Table 1.
Three-dimensional inspective analysis of axons
| Feature | Total | Average1-a | Range |
|---|---|---|---|
| Axon segment length (n = 75) | 674 μm | 9.1 ± 2.0 μm | 4.0–12.8 μm |
| Varicosities/axon segment | 224/75 | 3.0 ± 1.4 | 0–6 |
| Intervaricosity spacing | 674 μm/224 | 3.0 μm | from 1.2 to >7 μmc |
| PSDs/varicosityb | 206/189 | 1.1 ± 0.7 | 0–4 |
| Mitochondria/varicosityb | 95/189 | 0.5 ± 0.6 | 0–3 |
| Mitochondria/axon segment | 95/75 | 1.3 ± 1.0 | 0–4 |
All data here and elsewhere are given as mean ± SD. bBased on numbers of complete varicosities (see Results). cFor spacings >7 μm, the axon segment left the image stack before another varicosity was observed.
Axonal varicosities
A total of 224 varicosities were identified. Because the total axonal length was 674 μm, varicosities were on averagespaced every 3.0 μm along the axons (Table 1). However, the actual spacing of varicosities in individual axon segments varied greatly, with the individual axon segments bearing from zero to six varicosities, with a mean of three. Thirty-five (16%) of the varicosities were visualized only partially because they traversed the image stack margins, and so their components were not analyzed further. The remaining 189 fully visualized varicosities were examined for their composition of PSDs, vesicles, and mitochondria.
PSDs
A total of 206 PSDs were identified (Table 1). The number of PSDs per varicosity ranged from 0 to 4, with an average of 1.1 ± 0.7. The average number of PSDs per synaptic bouton (varicosity with ≥1 PSD) was 1.3 ± 0.5. Of the varicosities, 13% had no PSDs, 68% were SSBs, and 19% were MSBs (Table 2). The MSBs included 15% 2-PSD, ∼3% 3-PSD, and <1% 4-PSD boutons. As a percentage of all PSDs, 62% of the PSDs were on SSBs, and the remaining 38% of PSDs occurred on MSBs, mostly in 2-PSD combinations. Twenty (10%) of the PSDs were in spines with dark cytoplasm, at least some of which probably were caused by distal transection of dendrites during slice preparation.
Table 2.
Varicosities tabulated by content of PSDs and mitochondria
| Number of PSDs | Total | Varicosities (%) | ||||||
|---|---|---|---|---|---|---|---|---|
| Zero | One | Two | Three | Four | ||||
| Zero | 4 | 82 | 14 | 1 | – | 101 | 53 | |
| Number of mitochondria | One | 20 | 44 | 14 | 3 | 1 | 82 | 43 |
| Two | 1 | 3 | 1 | – | – | 5 | ∼3 | |
| Three | – | – | – | 1 | – | 1 | <1 | |
| Total | 25 | 129 | 29 | 5 | 1 | 189 | ||
| Varicosities (%) | 13 | 68 | 15 | ∼3 | <1 | 100 | ||
| PSDs2-a(%) | 63 | 28 | 7 | ∼2 | ||||
The last line gives the numbers of PSDs expressed as a percentage of all PSDs. All other values are expressed as total numbers or percentages of all varicosities.
Mitochondria
The 95 mitochondria found in these axons were distributed unevenly among varicosities and axons (Tables 1, 2). Approximately one-half (53%) of the varicosities (and 59% of the synaptic boutons) were devoid of mitochondria, nearly one-half (44%) of the varicosities were occupied by a single mitochondrion, and a small number contained two or three mitochondria. In individual axon segments, mitochondria varied in abundance from zero to four (Table 1), occupying as few as zero of four to as many as four of four varicosities.
PSD–mitochondria combinations
Overall, there was one mitochondrion per two PSDs. Table 2summarizes the distribution of PSDs and mitochondria in varicosities. Thirteen different combinations occurred. Most often, a varicosity had no mitochondrion and a single PSD (43%) or had one mitochondrion associated with one PSD (24%).
Nonvesicular and non-PSD varicosities
Thirteen percent of the varicosities had no associated PSDs. Most of these (11%) contained one or (rarely) two mitochondria, either with (3%) or without (8%) vesicles. The remaining few 0-PSD varicosities included three axonal swellings devoid of PSDs, vesicles, or mitochondria. Most varicosities (90%) contained vesicles, and a few (4%) contained vesicles without associated PSDs.
Comparison of data sets from two different slices
There were no statistically significant differences (p > 0.5) between sets LMTN and ZNQB for the main results, including axon segment length, varicosity number per axon, and the varicosity spacing along axons. The varicosity subgroups were also strikingly alike (LMTN vs ZNQB): 1-PSD, 68 versus 69%; 2-PSD, 15 versus 17%; 0-mitochondria, 53 versus 54%; 1-mitochondrion, 44 versus 42%; 1-PSD/0-mitochondrion, 42 versus 46%; 1-PSD/1-mitochondrion, 25 versus 22%. Therefore, the data were pooled for the foregoing analyses.
Digital three-dimensional reconstructive analysis
Eleven axons were selected to demonstrate the range of ultrastructural features among axonal shafts and varicosities and to measure the dimensions of axons and their components. The only selection criterion was that the set should include representative examples of the different features and combinations of components found in the inspective analysis. This led to a slight over-representation of MSBs and axons with below-average varicosity spacing, because we wanted to show the range of axonal features rather than just the most prevalent ones. However, the dimensions of axonal components were not used to select axons, permitting a quantitative analysis of dimensions in this part of the study. The main results are shown in Table 3, and the reconstructed images of the axonal membrane contours and components are shown in Figures3-5.
Table 3.
Three-dimensional reconstructive analysis of axons
| Feature | Total | Average3-a | Range |
|---|---|---|---|
| Axon segments | 11 | 9.7 ± 2.5 μm | 5.5 ± 13.7 μm |
| Axonal shafts: | 46 | ||
| Length | 1.36 ± 1.16 μm | 0.06–4.04 μm | |
| Volume | 0.032 ± 0.038 μm3 | 0.002–0.194 μm3 | |
| Diameter | 0.17 ± 0.04 μm | 0.11–0.30 μm | |
| Axonal varicosities: | 41 | ||
| Length | 1.09 ± 0.68 μm | 0.28–2.97 μm | |
| Volume | 0.125 ± 0.144 μm3 | 0.011–0.572 μm3 | |
| Diameter | 0.40 ± 0.13 μm | 0.19–0.69 μm | |
| PSD areas | 42 | 0.026 ± 0.026 μm2 | 0.005–14l μm2 |
| Vesicles (per varicosity) | 5454 | 156 ± 173 | 1–688 |
| Mitochondrial volumes | 18 | 0.024 ± 0.014 μm3 | 0.006–0.053 μm3 |
All data here and elsewhere are given as mean ± SD.
Fig. 3.

Left, Full-field view of a representative micrograph from the stack of images used for three-dimensional reconstructions. The shaft and two varicosities (var) of an axon are indicated. Right, Eight reconstructed axons from series LMTN, at the same scale as the micrograph. Some axons extend beyond the area of the micrograph because of the three-dimensional perspective. The axons travel in many different directions, rather than parallel to each other. Scale bar, 1.0 μm.
Fig. 4.

The membrane contours for 11 reconstructed axon segments, labeled A–K, including eight from series LMTN and three from ZNQB. Axon segments were rotated from their various native positions, as seen in Figure 3, into uniform orientation.
Fig. 5.
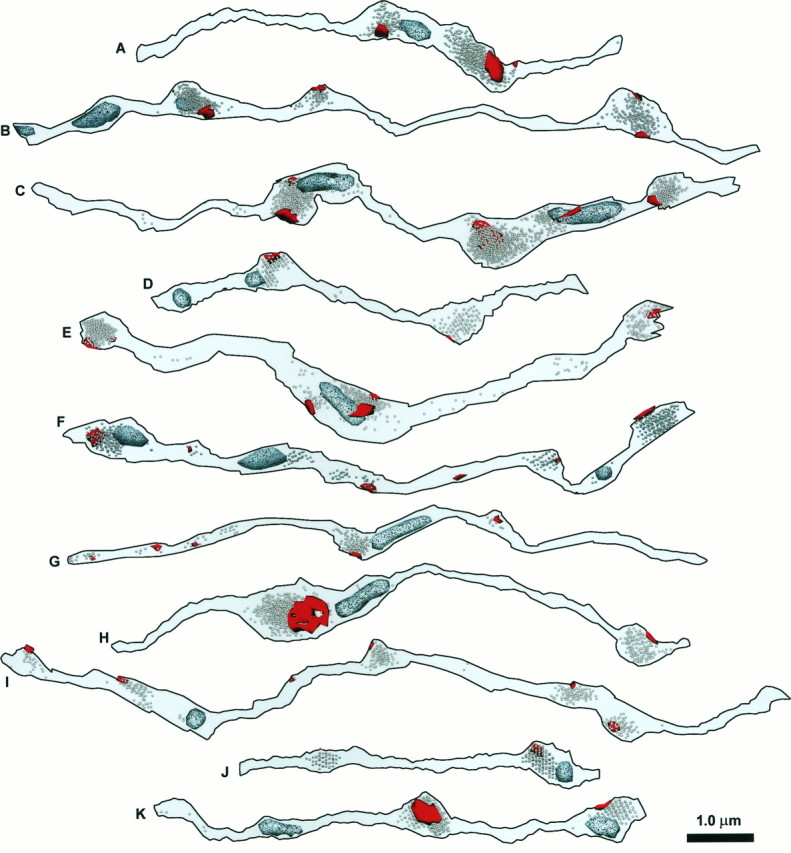
The PSDs (red), vesicles, and mitochondria (speckled, light blue) for the same set of 11 reconstructed axon segments that are shown in Figure4. When they are photocopied, PSDs appear relatively smooth and black, whereas mitochondria are speckled and lighter.
Axonal shafts
Shafts varied little in diameter but considerably in length (Table3). The average diameter of 0.17 ± 0.04 μm was obtained by measuring each shaft in several places on digitally scanned images of the reconstructed axons (Fig. 4). Shaft diameters were alternatively calculated to be 0.16 ± 0.04 μm by assuming that the shafts were isodiametric tubes (a reasonable assumption given the relationship shown in Fig. 6) and deriving the diameter from the measured length and volume. The linearity of the length–volume relationship (r = 0.78;p < 0.0001; Fig. 6, filled circles) indicates that the shaft diameters were indeed tubular and independent of length.
Fig. 6.

Graph of measured lengths versus volumes for axonal shafts (filled circles) and varicosities (open circles). The dotted linerepresents the theoretical length–volume relationship for spherical varicosities; i.e., volume = (4/3) πr3, where r = (varicosity length)/2. Both shafts and varicosities are essentially tubular.
Axonal varicosities
Most of the reconstructed varicosities appeared oblong and tubular, although the smallest were more spherical (Figs. 4,5). Consistent with this, the length–volume relationship for varicosities was also linear (Fig.6, open circles). Direct measurement gave an average varicosity diameter of 0.40 ± 0.13 μm. By comparison, the calculated diameter derived from length and volume was 0.33 ± 0.10 μm. The smaller value agrees with the observation that, although varicosities are more tubular than spherical, they are also oblong and irregular. The varicosities constituted 44% of the total length of the axon segments and 80% of the total volume. Varicosities tended to arise eccentrically from the axonal shafts, which often were aligned along a common axis, as if microtubules ran straight throughout the entire structure.
Organelles
PSD areas and the number of vesicles per bouton varied widely (Table 3) but were closely correlated (r = 0.96;p < 0.0001), consistent with previous observations (Harris and Stevens, 1988, 1989; Pierce and Mendell, 1993; Harris and Sultan, 1995). Varicosity volumes also correlated well with both PSD area (r = 0.88; p < 0.0001) and vesicle number (r = 0.86; p < 0.0001). Mitochondrial volumes also scaled with varicosity size (r = 0.80; p < 0.0001), vesicle number (r = 0.74; p < 0.005), and PSD area (r = 0.74; p < 0.01).
The extra or “obligatory” cytoplasmic volume (Sasaki-Sherrington et al., 1984) around vesicles or mitochondria was assessed in varicosities containing either vesicles or mitochondria. Total vesicle volume was estimated from the total vesicle number and an assumed 28 pl per vesicle (Harris and Sultan, 1995). Vesicles had a 25-fold obligatory volume, whereas that of mitochondria was 2.4-fold, comparable to mitochondria in dendritic varicosities of amacrine cells (Sasaki-Sherrington et al., 1984). The higher value for vesicles may reflect vesicle-associated proteins and the presence of smooth endoplasmic reticulum. Complete analysis of obligatory volumes would entail the measurement of microtubule and smooth endoplasmic reticulum dimensions, beyond the scope of this study.
Spacing of PSDs and mitochondria
Edge-to-edge distances between adjacent PSDs were measured, recognizing that the sample was small and intentionally skewed to include relatively many varicosities and MSBs per axon. The average distance was 1.91 ± 1.27 μm (n = 31; range, 0.26–4.83 μm). PSDs sharing the same varicosity were typically hundreds of nanometers apart (0.74 ± 0.41 μm; range, 0.26–1.54 μm; n = 8) but could be as close to PSDs on another varicosity as to each other. The average distance between PSDs on SSBs was higher (2.32 ± 1.21 μm; range, 0.56–4.83 μm;n = 23).
The edge-to-edge distance between mitochondria was 2.35 ± 1.83 μm (n = 7). When the distances between mitochondria and the ends of axons also were included (i.e., mitochondria were assumed to lie just beyond the stack margins), the value was 3.33 ± 2.39 μm (n = 28; range, 0.60–9.83 μm).
The edge-to-edge distances between PSDs and mitochondria were 0.88 ± 0.74 μm (n = 27; range, 0.18–3.01 μm), consistent with an inter-PSD distance of ∼2 μm and a 2:1 PSD-to-mitochondria ratio. Higher values were obtained if ambiguously situated PSDs (closer to the end of the axon segment than to a mitochondrion) were included. This was done by using two extreme interpretations of their PSD-to-mitochondrion distances, either as equivalent to the PSD-to-end distance (1.04 ± 0.89 μm; maximum, 3.66 μm; n = 42) or to the distance to the nearest observed mitochondrion (2.10 ± 2.08 μm; maximum, 7.30 μm). Thus, mitochondria and PSDs were 1–1.5 μm apart on average, but distances of 4 μm or more were possible.
DISCUSSION
In analyzing the three-dimensional structure of CA3→CA1 axonal shafts and varicosities, we have confirmed and extended the descriptions of Westrum and Blackstad (1962). These axons are complex. Neither varicosities nor synapses were spaced uniformly along the axons. Individual varicosities were associated with 0–4 PSDs, indicating that connectivity can be quite variable even at this level. The dimensions of axonal varicosities and shafts suggest that they could form a series of biochemical compartments. Vesicle numbers varied several hundred-fold. Mitochondria were distributed unevenly among varicosities. A surprising finding was that >50% of varicosities lacked mitochondria.
Possible artifacts
Shrinkage
Measurements made in fixed and dehydrated tissue are subject to uncertainties regarding tissue shrinkage and distortion. Here, measurements are presented without correction for shrinkage, because the magnitude of the effect is unknown and may vary for different preparations and in different tissue planes (Harris, 1994;Trommald et al., 1995). We did, however, calculate the possible impact of 10–25% shrinkage. The frequencies and ratios of varicosity components would not be affected by shrinkage. Measurements of length, area, and volume would be increased proportionally. The only subsequent value that depended on any of these measurements was the estimate of synaptic spacing, the significance of which is discussed below.
Identification
Varicosities were broadly defined both by their dimensions and components. Most were easily discerned by their shape alone, and, in addition, >98% had PSDs, vesicles, or mitochondria. Tiny synaptic boutons, which might have been mistaken for axonal shafts by LM, were detected by the presence of at least one vesicle and a PSD.
Slice preparation
The widespread experimental use of hippocampal slices makes the present analysis especially pertinent. A significant potential difference between healthy slices and perfusion-fixed hippocampus is that slices can have more synapses, which occur on existing synaptic boutons and result in more MSBs (Sorra et al., 1995; Sorra, 1996) (see also Woolley et al., 1996). Thus, the intervaricosity spacing is unlikely to be altered in slices, but the synaptic spacing might be closer than in perfusion-fixed brain. In an earlier three-dimensional study of seven presynaptic boutons from perfusion-fixed hippocampi (Harris and Sultan, 1995), three had no mitochondria. Thus, the absence of mitochondria from approximately one-half of the synaptic boutons is not unique to the slice preparation.
Implications for synaptic connectivity
Determining synaptic spacing along CA3 axons is essential for understanding CA3→CA1 connectivity. Previously, synaptic spacing has been inferred from intervaricosity spacing. Andersen (1975) described an intervaricosity distance of 3–5 μm in an early serial EM analysis. Subsequent estimates have relied on counting varicosities by LM and assuming each to have 1–1.5 synapses, yielding intersynaptic spacings of 7 μm (Ishizuka et al., 1990), 4.3–6.0 μm (assuming 0–40% shrinkage; Sik et al., 1993), 4.4 μm (Li et al., 1994), and from 3.6 ± 0.6 to 4.5 ± 0.8 μm (Andersen et al., 1994). Here, the intervaricosity spacing averaged 3.0 μm, and the intersynaptic spacing, based on the observed PSD frequency, was calculated as 2.7 μm. Allowance for up to 25% possible shrinkage would increase the intersynaptic distance to 3.4 μm. The closer spacing detected by serial EM likely results from synapses being discerned on narrow varicosities that would have eluded detection by LM. The total number of synapses made by a single CA3 axon in the ipsilateral area CA1 can be extrapolated by multiplying synaptic spacing by the total axonal length (Andersen et al., 1994; Li et al., 1994), giving 20,000–30,000 total synapses.
This value is a good working estimate for CA3→CA1 divergence in connectivity. It belies, however, the extreme heterogeneity in synaptic spacing and fails to capture the likely convergence in connectivity between many pairs of CA3 and CA1 cells (Harris, 1995). The edge-to-edge spacing of PSDs varied >20-fold (ranging from 0.3 to >7 μm). A large fraction of the PSDs (∼40%) occurred together in groups of two to four on individual boutons (MSBs). Synapses on MSBs are known to arise from the same or different CA1 pyramidal cells (Sorra and Harris, 1993). Thus, it will be fruitful to explore convergence in CA3→CA1 connectivity at the level of identified cell pairs.
Biophysical implications
The three-dimensional data on varicosity-rich CA3 axons will be ideally suited for biophysical modeling of electrical and diffusion properties once the quantities and distributions of ion channels, pumps, buffers, and other molecules are known. Models of action potential propagation along other varicosity-rich axons exhibit frequent conduction blocks and branch-point failures (Lüscher and Shiner, 1990), which render downstream boutons functionally silent. Determining whether the size and spacing of CA3 axonal varicosities are sufficient to cause conduction blocks will have important functional importance for CA3→CA1 connectivity. The structural variation in the CA3 axons also has significant consequences for diffusion properties. By analogy with dendritic spine necks, axonal shafts could serve to isolate axonal varicosities biochemically (Harris and Stevens, 1989;Koch and Zador, 1993; Zador and Koch, 1994; Shepherd, 1996). Furthermore, diffusion within a varicosity could be nonuniform because varicosities are oblong or tubular and often irregularly shaped. Thus, in addition to the compartmentalization afforded by the narrow axonal shafts, there may be subcompartments within varicosities, which could be of particular importance for synaptic specificity at MSBs.
Mitochondria and synaptic metabolism
Mitochondria in axons were distributed unevenly, as they were elsewhere in the CA1 neuropil (Nafstad and Blackstad, 1966). Indeed, mitochondria occurred in <50% of synaptic boutons. This finding raises several questions regarding energy use and calcium regulation, especially during synaptic activation.
ATP provides the energy to maintain the resting potential and fuels synaptic vesicle cycling (Südhof, 1995). How do varicosities without mitochondria obtain ATP? One source of ATP is through diffusion along the axon from mitochondria in other varicosities. If diffusion is fast, then the ATP concentration will be sustained; if slow, it will diminish with distance from mitochondria. Even if diffusion is normally fast, states of high demand, such as epileptic activity and anoxia, might deplete ATP at critical distances from mitochondria. Alternative sources of ATP might include glycolysis or active transport from neighboring axons, dendrites, or glia (Magistretti and Pellerin, 1996;Wu et al., 1997).
Mitochondrial enzymes are highest in brain regions with high activity (Wong-Riley, 1989; Snodderly and Gur, 1995; Magistretti and Pellerin, 1996). Mitochondrial volume and oxidative activity are greater in the more active tonic than in the less active phasic crayfish motor neurons (Nguyen et al., 1997). Moreover, stimulating the phasic axons increases their mitochondrial oxidative competence (Nguyen and Atwood, 1994). Do mitochondria in CA3→CA1 axons also change with the level of presynaptic activity, consistent with the correlations between mitochondria and varicosity size, vesicle content and PSD number?
Do mitochondria travel to sites of high metabolic demand along CA3 axons, as occurs in other axons and intracellular compartments (Fawcett, 1981; Morris and Hollenbeck, 1993)? Eight percent of the CA3 axonal mitochondria were solitary. Perhaps these were undergoing transport. In cultured hippocampal neurons, 20% of the axonal mitochondria are motile, although they frequently stop and change direction (Overly et al., 1996). If CA3 axonal mitochondria move at typical rates of 0.4 μm/sec (Vale et al., 1985), then they could reach nonmitochondrial synapses on a time scale of seconds.
Mitochondria also regulate presynaptic Ca2+ (Alnaes and Rahamimoff, 1975). They sequester Ca2+ on a relatively slow time scale as compared with synaptic firing (Wang and Thayer, 1996). Without mitochondria, synapses might incur greater fluctuations in Ca2+ and be more prone to Ca2+-mediated toxicity. Presynaptic mitochondria have been implicated as a basis for post-tetanic potentiation (PTP) at the crayfish neuromuscular junction, sequestering Ca2+during tetanic stimulation and releasing them in the post-tetanic phase (Tang and Zucker, 1997). If this also occurs at CA3→CA1 synapses, it raises the intriguing possibility that only ∼50% of the presynaptic boutons will exhibit PTP. Knowing the dynamics of mitochondria in CA3→CA1 axons will be important for understanding whether their nonuniform distribution is a reliable marker of synaptic activity and plasticity.
Footnotes
This work was supported by National Institutes of Health Grants NS21184 and MH/DA57351, with the latter funded jointly by the National Institute of Mental Health, National Institute on Drug Abuse, and NASA (K.M.H.); and by the Mental Retardation Research Center Grant P30-HD18655 (Dr. Joseph Volpe, Principal Investigator). We thank Sergei Kirov for preparing the hippocampal slices, Marcia Feinberg for expert serial EM technical assistance, John Fiala for creation of the IGL Trace reconstruction system, and John Fiala and Karin Sorra for helpful comments on this paper.
Correspondence should be addressed to Kristen M. Harris, Ph.D., Department of Neurology, Children’s Hospital, Enders 208, 300 Longwood Avenue, Boston, MA 02115.
REFERENCES
- 1.Alnaes E, Rahamimoff R. On the role of mitochondria in transmitter release from motor nerve terminals. J Physiol (Lond) 1975;248:285–306. doi: 10.1113/jphysiol.1975.sp010974. [DOI] [PMC free article] [PubMed] [Google Scholar]
- 2.Andersen P. Organization of hippocampal neurons and their interconnections. In: Isaacson RL, Pribram KH, editors. The hippocampus, Vol I. Plenum; New York: 1975. pp. 155–175. [Google Scholar]
- 3.Andersen P, Bliss TVP, Skrede KK. Lamellar organization of hippocampal excitatory pathways. Exp Brain Res. 1971;13:222–238. doi: 10.1007/BF00234087. [DOI] [PubMed] [Google Scholar]
- 4.Andersen P, Trommald M, Jensen V. Low synaptic convergence of CA3 collaterals on CA1 pyramidal cells suggests few release sites. In: Stjärne L, Greengard P, Grillner S, Hökfelt T, Ottoson D, editors. Molecular and cellular mechanisms of neurotransmitter release. Raven; New York: 1994. pp. 341–351. [PubMed] [Google Scholar]
- 5.Fawcett DW. The cell. Saunders; Philadelphia: 1981. [Google Scholar]
- 6.Groves PM, Linder JC, Young SJ. 5-Hydroxydopamine-labeled dopaminergic axons: three-dimensional reconstructions of axons, synapses, and postsynaptic targets in rat neostriatum. Neuroscience. 1994;58:593–604. doi: 10.1016/0306-4522(94)90084-1. [DOI] [PubMed] [Google Scholar]
- 7.Harris KM. Serial electron microscopy as an alternative or complement to confocal microscopy for the study of synapses and dendritic spines in the central nervous system. In: Stevens JK, Mills LR, Trogadis JE, editors. Three-dimensional confocal microscopy: volume investigation of biological specimens. Academic; San Diego: 1994. pp. 421–442. [Google Scholar]
- 8.Harris KM. How multiple-synapse boutons could preserve input specificity during an interneuronal spread of LTP. Trends Neurosci. 1995;18:365–369. doi: 10.1016/0166-2236(95)93930-v. [DOI] [PubMed] [Google Scholar]
- 9.Harris KM, Landis DMD. Membrane structure at synaptic junctions in area CA1 of the rat hippocampus. Neuroscience. 1986;19:857–872. doi: 10.1016/0306-4522(86)90304-0. [DOI] [PubMed] [Google Scholar]
- 10.Harris KM, Stevens JK. Dendritic spines of rat cerebellar Purkinje cells: serial electron microscopy with reference to their biophysical characteristics. J Neurosci. 1988;8:4455–4469. doi: 10.1523/JNEUROSCI.08-12-04455.1988. [DOI] [PMC free article] [PubMed] [Google Scholar]
- 11.Harris KM, Stevens JK. Dendritic spines of CA1 pyramidal cells in the rat hippocampus: serial electron microscopy with reference to their biophysical characteristics. J Neurosci. 1989;9:2982–2997. doi: 10.1523/JNEUROSCI.09-08-02982.1989. [DOI] [PMC free article] [PubMed] [Google Scholar]
- 12.Harris KM, Sultan P. Variation in the number, location, and size of synaptic vesicles provides an anatomical basis for nonuniform probability of release at hippocampal CA1 synapses. Neuropharmacology. 1995;34:1387–1395. doi: 10.1016/0028-3908(95)00142-s. [DOI] [PubMed] [Google Scholar]
- 13.Harris KM, Teyler TJ. Developmental onset of long-term potentiation in area CA1 of the rat hippocampus. J Physiol (Lond) 1984;346:27–48. doi: 10.1113/jphysiol.1984.sp015005. [DOI] [PMC free article] [PubMed] [Google Scholar]
- 14.Ishizuka N, Weber J, Amaral DG. Organization of intrahippocampal projections originating from CA3 pyramidal cells in the rat. J Comp Neurol. 1990;295:580–623. doi: 10.1002/cne.902950407. [DOI] [PubMed] [Google Scholar]
- 15.Jackson PS, Suppes T, Harris KM. Stereotypical changes in the pattern and duration of long-term potentiation expressed at postnatal days 11 and 15 in the rat hippocampus. J Neurophysiol. 1993;70:1412–1419. doi: 10.1152/jn.1993.70.4.1412. [DOI] [PubMed] [Google Scholar]
- 16.Jensen FE, Harris KM. Preservation of neuronal ultrastructure in hippocampal slices using rapid microwave-enhanced fixation. J Neurosci Methods. 1989;29:217–230. doi: 10.1016/0165-0270(89)90146-5. [DOI] [PubMed] [Google Scholar]
- 17.Johnston D, Amaral DG. Hippocampus. In: Shepherd GM, editor. The synaptic organization of the brain. Oxford UP; New York: 1997. pp. 417–458. [Google Scholar]
- 18.Kincaid AE, Zheng T, Wilson CJ. Connectivity and convergence of single corticostriatal axons. J Neurosci. 1998;18:4722–4731. doi: 10.1523/JNEUROSCI.18-12-04722.1998. [DOI] [PMC free article] [PubMed] [Google Scholar]
- 19.Koch C, Zador A. The function of dendritic spines: devices subserving biochemical rather than electrical compartmentalization. J Neurosci. 1993;13:413–422. doi: 10.1523/JNEUROSCI.13-02-00413.1993. [DOI] [PMC free article] [PubMed] [Google Scholar]
- 20.Li X-G, Somogyi P, Ylinen A, Buzsáki G. The hippocampal CA3 network: an in vivo intracellular labeling study. J Comp Neurol. 1994;339:181–208. doi: 10.1002/cne.903390204. [DOI] [PubMed] [Google Scholar]
- 21.Lüscher H-R, Shiner JS. Simulation of action potential propagation in complex terminal arborizations. Biophys J. 1990;58:1389–1399. doi: 10.1016/S0006-3495(90)82485-1. [DOI] [PMC free article] [PubMed] [Google Scholar]
- 22.Magistretti PJ, Pellerin L. Cellular bases of brain energy metabolism and their relevance to functional brain imaging: evidence for a prominent role of astrocytes. Cereb Cortex. 1996;6:50–61. doi: 10.1093/cercor/6.1.50. [DOI] [PubMed] [Google Scholar]
- 23.Morris RL, Hollenbeck PJ. The regulation of bidirectional mitochondrial transport is coordinated with axonal outgrowth. J Cell Sci. 1993;104:917–927. doi: 10.1242/jcs.104.3.917. [DOI] [PubMed] [Google Scholar]
- 24.Nafstad HJ, Blackstad TW. Distribution of mitochondria in pyramidal cells and boutons in hippocampal cortex. Z Zellforsch Mikrosk Anat. 1966;73:234–245. doi: 10.1007/BF00334866. [DOI] [PubMed] [Google Scholar]
- 25.Nguyen PV, Atwood HL. Altered impulse activity modifies synaptic physiology and mitochondria in crayfish phasic motor neurons. J Neurophysiol. 1994;72:2944–2955. doi: 10.1152/jn.1994.72.6.2944. [DOI] [PubMed] [Google Scholar]
- 26.Nguyen PV, Marin L, Atwood HL. Synaptic physiology and mitochondrial function in crayfish tonic and phasic motor neurons. J Neurophysiol. 1997;78:281–294. doi: 10.1152/jn.1997.78.1.281. [DOI] [PubMed] [Google Scholar]
- 27.Nicol MJ, Walmsley B. A serial section electron microscope study of an identified Ia afferent collateral in the cat spinal cord. J Comp Neurol. 1991;314:257–277. doi: 10.1002/cne.903140205. [DOI] [PubMed] [Google Scholar]
- 28.Overly CC, Rieff HI, Hollenbeck PJ. Organelle motility and metabolism in axons vs dendrites of cultured hippocampal neurons. J Cell Sci. 1996;109:971–980. doi: 10.1242/jcs.109.5.971. [DOI] [PubMed] [Google Scholar]
- 29.Pierce JP, Mendell LM. Quantitative ultrastructure of Ia boutons in the ventral horn: scaling and positional relationships. J Neurosci. 1993;13:4748–4763. doi: 10.1523/JNEUROSCI.13-11-04748.1993. [DOI] [PMC free article] [PubMed] [Google Scholar]
- 30.Sasaki-Sherrington SE, Jacobs JR, Stevens JK. Intracellular control of axial shape in non-uniform neurites: a serial electron microscopic analysis of organelles and microtubules in AI and AII retinal amacrine neurites. J Cell Biol. 1984;98:1279–1290. doi: 10.1083/jcb.98.4.1279. [DOI] [PMC free article] [PubMed] [Google Scholar]
- 31.Shepherd GM. The dendritic spine: a multifunctional integrative unit. J Neurophysiol. 1996;75:2197–2210. doi: 10.1152/jn.1996.75.6.2197. [DOI] [PubMed] [Google Scholar]
- 32.Sik A, Tamamaki N, Freund TF. Complete axon arborization of a single CA3 pyramidal cell in the rat hippocampus, and its relationship with postsynaptic parvalbumin-containing interneurons. Eur J Neurosci. 1993;5:1719–1728. doi: 10.1111/j.1460-9568.1993.tb00239.x. [DOI] [PubMed] [Google Scholar]
- 33.Snodderly DM, Gur M. Organization of striate cortex of alert, trained monkeys (Macaca fascicularis): ongoing activity, stimulus selectivity, and widths of receptive field activating regions. J Neurophysiol. 1995;74:2100–2125. doi: 10.1152/jn.1995.74.5.2100. [DOI] [PubMed] [Google Scholar]
- 34.Sorra KE (1996) Synapse structure, function, and plasticity in hippocampal area CA1. PhD thesis, Harvard University.
- 35.Sorra KE, Harris KM. Occurrence and three-dimensional structure of multiple synapses between individual radiatum axons and their target pyramidal cells in hippocampal area CA1. J Neurosci. 1993;13:3736–3748. doi: 10.1523/JNEUROSCI.13-09-03736.1993. [DOI] [PMC free article] [PubMed] [Google Scholar]
- 36.Sorra KE, Harris KM. Stability in synapse number and size at 2hr after long-term potentiation in hippocampal area CA1. J Neurosci. 1998;18:658–671. doi: 10.1523/JNEUROSCI.18-02-00658.1998. [DOI] [PMC free article] [PubMed] [Google Scholar]
- 37.Sorra KE, Allwardt BA, Harris KM. Quantification of dendritic spines and synapses in rat hippocampal slices maintained for variable times in vitro. Soc Neurosci Abstr. 1995;21:712.6. [Google Scholar]
- 38.Südhof TC. The synaptic vesicle cycle: a cascade of protein–protein interactions. Nature. 1995;375:645–653. doi: 10.1038/375645a0. [DOI] [PubMed] [Google Scholar]
- 39.Tang Y-G, Zucker RS. Mitochondrial involvement in post-tetanic potentiation of synaptic transmission. Neuron. 1997;18:483–491. doi: 10.1016/s0896-6273(00)81248-9. [DOI] [PubMed] [Google Scholar]
- 40.Trommald M, Jensen V, Andersen P. Analysis of dendritic spines in rat CA1 pyramidal cells intracellularly filled with a fluorescent dye. J Comp Neurol. 1995;353:260–274. doi: 10.1002/cne.903530208. [DOI] [PubMed] [Google Scholar]
- 41.Vale RD, Schnapp BJ, Reese TS, Sheetz MP. Movement of organelles along filaments dissociated from the axoplasm of the squid giant axon. Cell. 1985;40:449–454. doi: 10.1016/0092-8674(85)90159-x. [DOI] [PubMed] [Google Scholar]
- 42.Wang GJ, Thayer SA. Sequestration of glutamate-induced Ca2+ loads by mitochondria in cultured rat hippocampal neurons. J Neurophysiol. 1996;76:1611–1621. doi: 10.1152/jn.1996.76.3.1611. [DOI] [PubMed] [Google Scholar]
- 43.Westrum LE, Blackstad TW. An electron microscopic study of the stratum radiatum of the rat hippocampus (regio superior, CA1) with particular emphasis on synaptology. J Comp Neurol. 1962;119:281–309. doi: 10.1002/cne.901190303. [DOI] [PubMed] [Google Scholar]
- 44.Wong-Riley MTT. Cytochrome oxidase: an endogenous metabolic marker for neuronal activity. Trends Neurosci. 1989;12:94–101. doi: 10.1016/0166-2236(89)90165-3. [DOI] [PubMed] [Google Scholar]
- 45.Woolley CS, Wenzel HJ, Schwartzkroin PA. Estradiol increases the frequency of multiple synapse boutons in the hippocampal CA1 region of the adult female rat. J Comp Neurol. 1996;373:108–117. doi: 10.1002/(SICI)1096-9861(19960909)373:1<108::AID-CNE9>3.0.CO;2-8. [DOI] [PubMed] [Google Scholar]
- 46.Wu K, Aoki C, Elste A, Rogalski-Wilk AA, Siekevitz P. The synthesis of ATP by glycolytic enzymes in the postsynaptic density and the effect of endogenously generated nitric oxide. Proc Natl Acad Sci USA. 1997;94:13272–13278. doi: 10.1073/pnas.94.24.13273. [DOI] [PMC free article] [PubMed] [Google Scholar]
- 47.Zador A, Koch C. Linearized models of calcium dynamics: formal equivalence to the cable equation. J Neurosci. 1994;14:4705–4715. doi: 10.1523/JNEUROSCI.14-08-04705.1994. [DOI] [PMC free article] [PubMed] [Google Scholar]