Abstract
Cochlear outer hair cells are capable of both mechanical-to-electrical and electrical-to-mechanical transduction. Vibration of their stereocilia by sound is believed to stimulate somatic motility via a receptor potential developed across the basolateral membrane, thereby enhancing the mechanical vibration and increasing the sensitivity and frequency selectivity of the ear. Extrinsic electrical currents, applied at the tops of the cells, also appear to activate motility in vivo, presumably after entering the cell. Earlier experiments suggested such currents might enter through the transduction channels themselves, but an alternative shunt pathway through the membrane capacitance seems more likely on physical grounds. We therefore recorded electrically evoked oto-acoustic emissions while modulating the transduction channels by driving them with low-frequency sound. Recordings of the low-frequency cochlear microphonic provided a measure of the mean electrical conductance through the channels during sound stimulation. Emissions increased during displacement of the basilar membrane toward scala vestibuli, when the channels were biased open, and decreased on the opposite phase, and the modulation of the emission was in direct proportion to the cochlear microphonic. The results are the strongest evidence yet that electrically evoked emissions are generated directly by mechanisms related to cochlear transduction and lead to the surprising conclusion that, for frequencies up to at least 12 kHz, extrinsic electrical currents enter the hair cell predominantly by the resistive pathway through the transduction channels. Alternatively, the results might be consistent with direct modulation of a motility source driven by capacitive currents but whose output depends on the state of the channels.
Keywords: cochlea, electrical stimulation, mechano-transduction channels, outer hair cells, oto-acoustic emissions, active process
The threshold sensitivity and frequency selectivity of the ear relies on the amplification of basilar membrane vibration by the uniquely specialized, outer hair cells (OHC) of the cochlea. There is general consensus that this “cochlear amplifier” (Davis, 1983) incorporates mechanical-to-electrical or “forward” transduction and electrical-to-mechanical or “reverse” transduction (Kim, 1986), linked in a regenerative, feedback loop (Kim et al., 1980; Mountain et al., 1983; Patuzzi and Robertson, 1988; Dallos, 1992; Yates et al., 1992). In forward transduction, the basilar membrane vibrations modulate mechanically gated ion channels in OHC stereocilia (Ohmori, 1988; Jaramillo and Hudspeth, 1991). Modulation of the apical transducer conductance results in voltage fluctuations across the OHC basolateral membrane at the frequency of the sound stimulus (Dallos, 1986; Russell et al., 1986). Transmembrane voltage changes, in turn, are thought to drive a protein-based motor (reverse transduction) located in the lateral cell wall (Santos-Sacchi and Dilger, 1988; Holley and Ashmore, 1990;Hallworth et al., 1993).
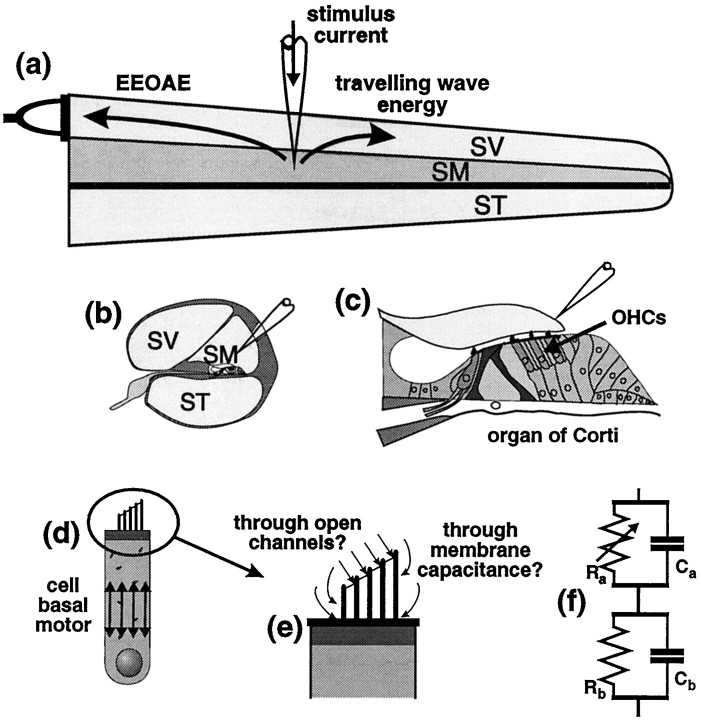
Extrinsically applied electrical currents appear to activate OHC motility at kilohertz frequencies in vivo. Electrically evoked oto-acoustic emissions (EEOAEs) are sounds of very low intensity present in the ear canal when sinusoidal current is passed into the cochlea (Mountain and Hubbard, 1989; Murata et al., 1991; Nuttall and Ren, 1995; Kirk and Yates, 1996) and are assumed to be produced by direct stimulation of the OHC reverse transduction process (Fig.1). Extrinsic currents applied in scala media presumably enter the cell from the apical end, in which the mechanically sensitive transduction channels are located, and then stimulate the motor element by way of the potential developed across the basolateral membrane. Earlier experiments (Kirk and Yates, 1998) suggested that current entered the cell through the transduction channels (Fig. 1). The emissions were attenuated by 4-aminopyridine, a channel blocker, and there were changes in the cochlear electrophysiology that implied an increase in the apical resistance of OHCs. This result is surprising because one would expect current at the frequencies used to enter through the electrical capacitance of the apical membrane (Fig. 1). The electrical impedance of a cell membrane is normally dominated by capacitance at high frequencies (Cole, 1940).
Fig. 1.
Application of alternating current to scala media of the cochlea [as shown in longitudinal section (a), cross section (b) and magnified cross section (c)] produces measurable sound (EEOAEs) in the ear canal. EEOAEs are believed to result from electromotile responses of OHCs (c, d), producing mechanical energy that propagates to the stapes and through the middle ear (a). OHC motility is widely held to underlie the frequency selectivity and threshold sensitivity of hearing. Evidence (see text) points to a voltage-sensitive motor located in the basolateral cell wall (d) and presumably activated during sensory transduction by the cell’s own receptor potential. Extrinsically applied currents may activate a membrane-based motility source through two parallel pathways; either resistive pathways offered by open transduction channels in stereocilia or capacitive pathways through the apical cell membranes (e, f). Modulation of EEOAE waveforms by low-frequency sound is consistent with high-frequency current entering via mechano-sensitive resistive pathways. SV, Scala vestibuli; SM, scala media; ST, scala tympani; Ra, apical resistance;Ca, apical capacitance;Rb, basolateral resistance;Cb, basolateral capacitance.
To gain more insight into how the status of the mechanically sensitive transduction channels might influence OHC motility, we recorded EEOAEs while simultaneously applying a low-frequency acoustical stimulus at moderately high intensities. This modulated the mean conductivity of the channels by amounts estimated from the cochlear microphonic (CM). EEOAEs were amplitude modulated in proportion to the CM, consistent with either the high-frequency extrinsic current gaining access to a membrane-based cellular motor through the forward-transduction channels, or perhaps with a motility source whose output depends directly on the status of the channels.
MATERIALS AND METHODS
Experiments were performed on pigmented guinea pigs (250–350 gm) according to a protocol approved by the National Health and Medical Research Council of Australia and the University of Western Australia. The animals were anesthetized with Nembutal (35 mg/kg i.p. initially; 20 mg/kg after 2.5 hr) and Leptan (Fentanyl citrate and Droperidol; 1.5 ml/kg i.m. repeated at 45 min intervals). They were paralyzed (Alloferin; 0.3 ml/kg i.m.) during data collection to prevent middle ear movement. In unparalyzed animals the anesthetic regimen induced continuous deep anesthesia, evidenced by lack of withdrawal response and absence of spontaneous respiration. During paralysis potentially noxious stimulation produced no change in heart rate.
The basic surgical procedures and the details of electrical and acoustical stimulation and recording have been described (Kirk and Yates, 1996). Briefly, EEOAEs were generated by sinusoidal currents applied through micropipette electrodes (2–4 μm tip diameter, DC resistance 5–10 megohms and filled with 200 mm KCl) placed in scala media in turns 1, 2 or 3 of the cochlea. The electrical stimulation circuit, incorporating voltage amplifier, isolation transformer and micropipette, had a frequency response essentially flat to within a few dB between 1 and 20 kHz. The micropipette electrodes were also used to record the extracellular CM response to the acoustical stimulus. Ear canal emissions and stimulus sound pressure were measured through a condenser microphone (Bruel and Kjaer 4133) in a calibrated ear bar sound system. The condition of the cochlea was monitored throughout experiments using the compound action potential threshold, as described in Kirk and Yates (1996). Electrical and acoustical stimuli were generated and the responses recorded by a desktop computer equipped with a multimedia sound card (Crystal CDB4231) and custom software. EEOAE and CM waveforms were displayed online and stored to disk for later analysis.
Experimental paradigm. Low-frequency tones were used to shift the basilar membrane alternately toward scala vestibuli to produce open bias of forward-transduction channels, and toward scala tympani to produce closed channel bias, during the generation of EEOAEs. Cyclic changes in the position of the basilar membrane and the status of the transduction channels were inferred from the locally recorded CM response to the low-frequency tone (Konishi and Nielsen, 1978; Cheatham and Dallos, 1994).
Electrical stimulation of scala media was paired with acoustical stimulation at a frequency (fa) well below the electrical frequency (fe). The electrical and acoustical stimuli were phase-locked and their frequencies were constrained in the ratio (n + 1/2), so that precisely 2n + 1 cycles of the electrical stimulus accompanied every two cycles of the acoustical frequency. The value of n was chosen according to the desired values of fe and fa and some quantization of the stimulus frequencies was necessary. This frequency ratio ensured that harmonics of the low-frequency acoustical stimulus interleaved with the harmonics of the electrical frequency and with the potential intermodulation frequencies (fe ± mfa).
The CM was recorded over two cycles of the low-frequency tone for a range of sound levels, without electrical stimulation (electrical recordings could not be made during the application of current). The acoustical stimulus was then presented at each of a range of sound intensities in turn, together with the phase-locked electrical stimulus, and the EEOAEs evoked by the electrical stimulus were recorded, again over two cycles of the low-frequency tone. Recordings of the CM and EEOAEs were each averaged for a total of 2–3 sec recording time.
Filtering of the emission waveform. EEOAEs are of very low intensity, typically around 0–30 dB sound pressure level (SPL), whereas the sound level of the low-frequency acoustical stimulus was necessarily much higher. We used a high-quality sound source (Beyer DT48 earphone) but small amounts of harmonic distortion, comparable in magnitude to the emissions, were produced at the highest intensities (above 80–90 dB SPL). We therefore filtered the signals electronically before recording, and numerically during analysis, taking advantage of the frequency-interleaving of the sound harmonics and electrical intermodulation components. The output from the microphone recording the ear canal sound pressure was filtered using a Stanford Research SR650 filter (48 dB per octave) with the high pass set at least three octaves above the frequency of the acoustical stimulus. This removed most of the fundamental and lower harmonics of the acoustical stimulus. The electronically filtered acoustical waveforms were stored and subsequently processed mathematically to remove residual acoustical stimulus contamination and high-level harmonic distortion. The Fourier spectrum of the raw waveform was calculated, and a waveform free of acoustical stimulus contamination was obtained by two methods: (1) by Fourier transforming the waveform into the frequency domain, setting to zero all components at frequencies that were not multiples of the acoustical stimulus frequency (and which interleaved with the EEOAE frequencies), inverse-Fourier transforming back to the time domain and then subtracting from the raw waveform; this removed harmonics of the acoustical stimulus; and (2) by Fourier transforming the waveform into the frequency domain, setting to zero all components other than the fundamental of the electrical stimulus and all intermodulation frequencies with magnitudes >3 dB above the noise level and then inverse transforming back to the time domain (the reconstruction process). This effectively extracts from the recording only those components which are related to the electrical stimulus.
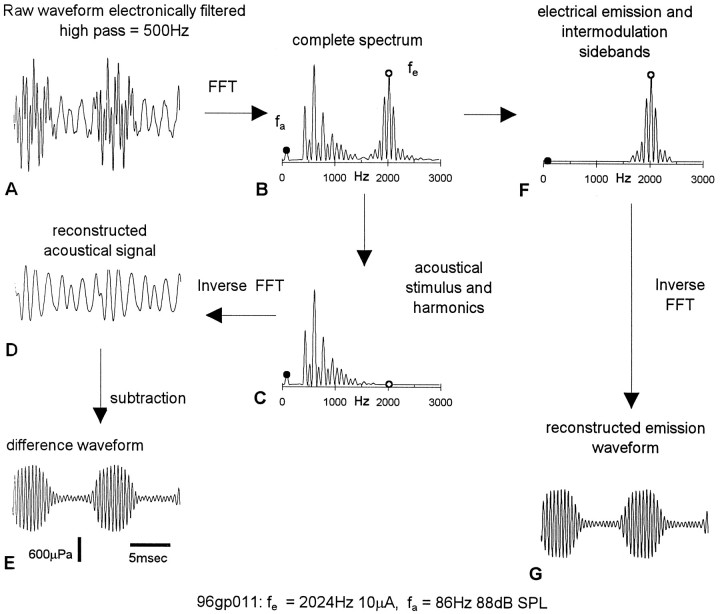
The waveforms resulting from (1) subtraction and (2) reconstruction were compared as a check on the accuracy of the filtering procedures, because they should differ only in their noise components (Fig.2).
Fig. 2.
Typical process of analysis of waveform modulation. A 2024 Hz 10 μA electrical stimulus fe, applied to scala media in turn 2, was paired with an acoustical stimulus fa at 86 Hz, 88 dB SPL. The ear canal sound field, containing the EEOAE and the acoustical stimulus, was electronically high- pass filtered to remove most of the spectral energy at 86 Hz as well as its second and third harmonics. The resulting “raw” waveform (A), consisting of the EEOAE and contamination from higher level harmonic distortion of the acoustical stimulus, had spectral peaks (B) at fe and the intermodulation sideband frequencies and at the harmonic distortion frequencies. Decontaminated EEOAE waveforms were extracted by either (1) subtracting the acoustical contamination from the raw waveform (steps C–E) or (2) reconstruction through inverse Fourier transform from the spectral components at Fe and sideband frequencies (steps F, G).
Fitting the extracellular CM to the EEOAE modulation envelope. In analysis of the stored data each CM record was superimposed over the corresponding EEOAE waveform acquired at the same sound pressure level. Because emission and CM waveforms have no natural scaling relationship, the CM was adjusted in amplitude and vertical offset to obtain the best match between the CM waveform and the modulation envelope of the emission waveform (Fig.3). In addition, a phase realignment of the CM was necessary to compensate for the lag between the CM, recorded instantaneously, and the EEOAE which was delayed by propagation within the cochlea, the middle ear and out to the recording microphone. The delays required to align the CM with modulations in the EEOAE waveform were 100–111 μsec in turn 1, 380–650 μsec in turn 2 and 620–820 μsec in turn 3. These values are comparable with our earlier estimates of the propagation delay of EEOAEs in the guinea pig cochlea (Kirk and Yates, 1996). Only a single set of CM offset and scale factors, determined at the lower stimulus levels, was used for an entire modulation-intensity series
Fig. 3.
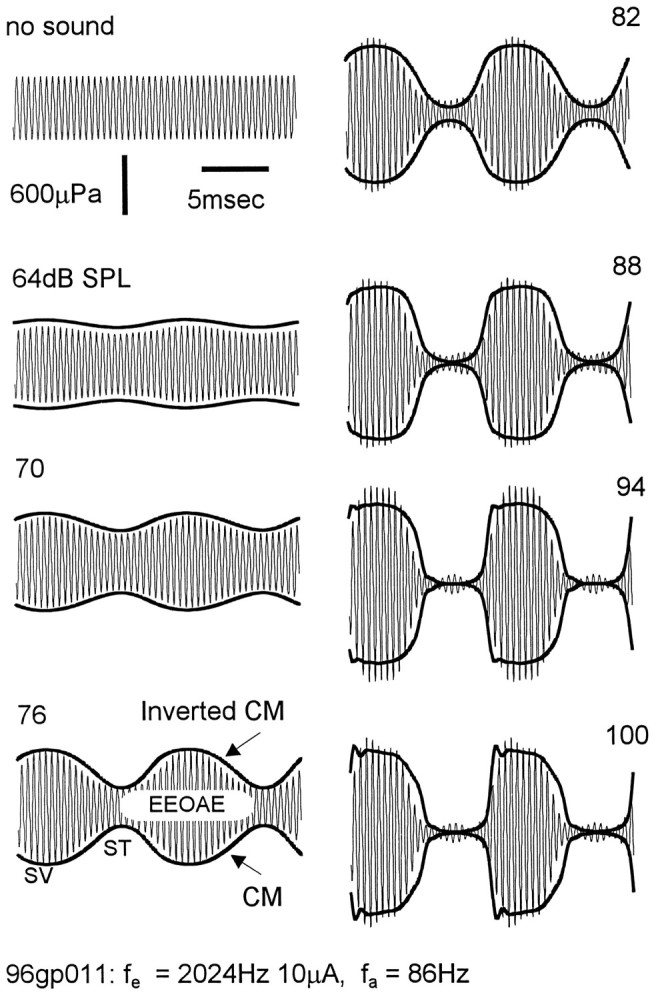
Amplitude modulation of EEOAE waveforms (2024 Hz, 10 mA electrical stimulus) with increasing levels of an 86 Hz tone as indicated in dB SPL. The scala media CM is shown as recorded and as its inverted mirror image (bottom left panel). Negative polarity of the scala media CM corresponds to basilar membrane displacement to scala vestibuli (SV) and positive polarity to scala tympani (ST). CM was shifted in phase by −430 μsec to compensate for the travel time of EEOAE from its generation site in the second turn to the recording microphone, and scaled and offset to fit as closely as possible to the modulation envelope of the EEOAE waveform. Scaling factors and offset were constant over the intensity range.
RESULTS
EEOAE waveforms were amplitude modulated by low-frequency tones, and the modulated waveforms contained spectral components at the intermodulation frequencies fe ± mfa. As shown in Figure 2, the two mathematical techniques (subtraction and reconstruction) used to remove residual contamination by the low-frequency tone and its harmonics from the recorded EEOAE waveforms (see Materials and Methods) produced virtually identical results. In subsequent figures only the reconstructed waveforms are shown.
EEOAE amplitude modulation proportional to CM
The modulation of the EEOAEs followed the OHC transducer conductance, as inferred from the extracellular CM recorded in scala media. This is illustrated by the examples in Figure 3, in which the CM waveforms evoked by the low-frequency tones have been drawn over the EEOAE waveforms. The data are from the second cochlear turn. The 2024 Hz electrical stimulus at 10 μA AC was paired with 86 Hz tones that were applied over the intensity range 64–100 dB SPL. The CM is drawn with its polarity as recorded at the lower boundary of the EEOAE modulation envelope and as an inverted mirror image (reversed polarity) at the upper boundary. These two representations of the CM form a “CM envelope” that expands as the CM goes negative and contracts when it goes positive. The CM waveforms have been scaled in amplitude and vertical offset and shifted in phase to fit the modulations of the EEOAE (see Materials and Methods).
The amplitude of the emission waveform increased during the negative-going phase of the CM and decreased during the positive-going phase; that is, it followed the transducer conductance. Negative CM voltages in scala media reflect displacement of the basilar membrane toward scala vestibuli and an increase in apical transducer conductance, while the positive phase indicates displacement to scala tympani and decreased conductance (Konishi and Nielsen, 1978; Ruggero et al., 1986).
The amplitude of the EEOAE waveform was modulated in close proportion to the amplitude of the CM. At 94 dB SPL, in which the level-dependent growth of the CM, and presumably the low-frequency modulations of the transducer conductance, had saturated, the depth of modulation was 90.5% and the emission amplitude during the contraction phase (scala tympani displacement) was 28% of the amplitude of the unmodulated waveform. There are signs of overmodulation in the detail of the scala tympani phase of the EEOAE waveform at high sound levels. The EEOAE amplitude appears to reach a minimum just before the CM reaches its maximum positive voltage, and then rebounds a small amount when the CM is at its maximum. This overmodulation is not seen in the CM. Departure from simple amplitude modulation at the acoustical frequency and in proportion to the CM potential often appeared at the higher sound levels, but its characteristics were variable (see for example the 94 dB SPL waveform, bottom left panel of Fig.4). We cannot be sure that these variations are true reflections of changes in the transducer conductance (see below).
Fig. 4.
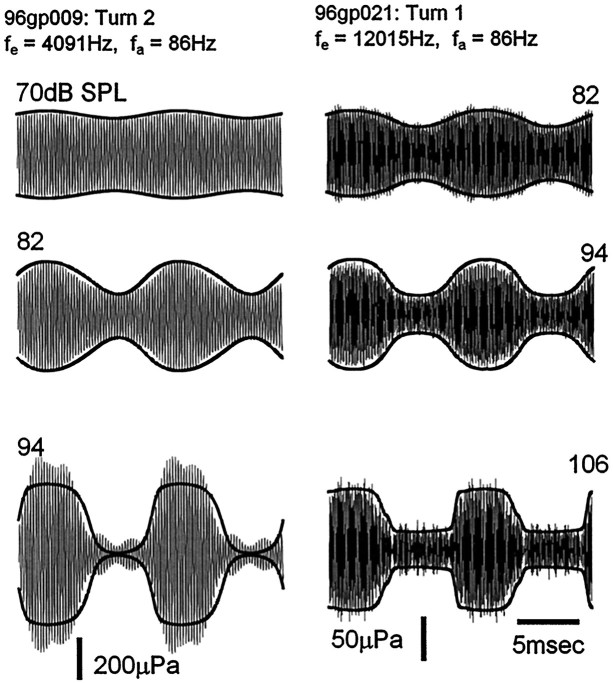
Modulation of EEOAE waveforms at 4091 Hz from turn 2 and 16,756 Hz from turn 1.
Waveform modulation essentially proportional to the instantaneous value of the locally recorded CM was observed over a range of emission frequencies from 1076 to 16,756 Hz. Examples of modulated EEOAE waveforms generated at higher electrical frequencies, 4091 Hz from turn 2 and at 12,015 Hz from turn 1, can be seen in Figure 4. The acoustical stimulus in both cases was 86 Hz. These waveforms show the essential features of the modulation of the lower frequency (2024 Hz) emission in Figure 3. The modulation was proportional to the growth of the CM, except that there was a disproportionate increase (relative to the growth of the CM) in the amplitude of the 4091 Hz waveform at the highest sound level, as well as a secondary modulation pattern at four times the acoustical frequency. Disproportionate growth of the emission at higher sound levels, that can also be seen to a lesser degree in the data of Figure 3, may be related to the phenomenon of acoustical enhancement of EEOAEs (Mountain and Hubbard, 1989; Xue et al., 1993;Kirk and Yates, 1996). More extensive data and discussion of this high-level effect will be presented elsewhere. Note that, whereas the 2024 Hz emission in Figure 3 was modulated by 90% when the CM was saturated, the maximum depth of modulation of the 12,015 Hz EEOAE in Figure 4 was only 65%.
Distorted modulation patterns
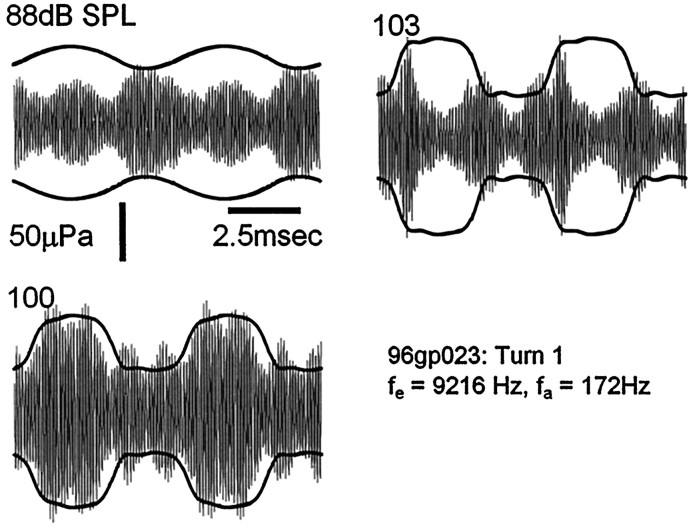
In the apical turns, modulation at frequencies other than the fundamental of the acoustical stimulus was rare, and was never more pronounced than in the example in Figure 4. In the basal cochlear turn, however, quite complicated modulation patterns were relatively common, occurring in ∼30–40% of basal turn EEOAEs and often showing considerable variability depending on the parameters of the acoustical and electrical stimuli. We did not examine this phenomenon in detail, and it was not obvious which factors if any influenced its variability. Data from stimulus combinations that produced grossly distorted modulation patterns from the basal turn were excluded from further analysis. However, to illustrate, Figure5 shows a representative example. In this case an EEOAE at 9216 Hz was measured over two cycles of a 173 Hz tone at 88, 100, and 103 dB SPL. Whereas the modulation envelope of the emission recorded during the 100 dB SPL tone can be fitted reasonably well by the CM, an increase in sound level of only 3 dB produced a grossly distorted modulation pattern with multiple peaks. At 88 dB SPL the emission was modulated at twice the acoustical frequency.
Fig. 5.
Example of the distorted modulation patterns sometimes found in the basal turn. Whereas the EEOAE waveform envelope at fa = 100 dB SPL follows the CM, the waveforms at 88 and 103 dB SPL show complex modulation at multiples of the acoustic frequency.
Some envelope distortion in the modulation patterns might be expected. The exact shapes of the recorded modulated waveforms would be sensitive to small changes in the magnitude and phase of the intermodulation components, and there are at least two reasons to suspect there would be small errors in the measurement of the primary response components. First, the emissions are recorded through a probe microphone that has small inaccuracies associated with its calibration (especially with respect to its phase response), and second, the emissions probably undergo some frequency-response distortion during propagation from the site of stimulation to the microphone. The more pronounced distortion in the modulations observed in the basal turn (Fig. 5) may be a consequence of the deep spectral amplitude notches, of unknown origin but which are typical of EEOAEs from the basal turn (Kirk and Yates, 1996), exaggerating the effects of phase interactions during propagation of the emission. It should also be noted that, for technical reasons, the CM waveforms were recorded without electrical stimulation and may not have reflected precisely the low-frequency changes in the apical conductance during electrical stimulation. We cannot be certain that the electrical stimulus would not alter slightly the response of the forward-transduction mechanism to the low-frequency tone.
Depth of modulation varied with electrical stimulus frequency
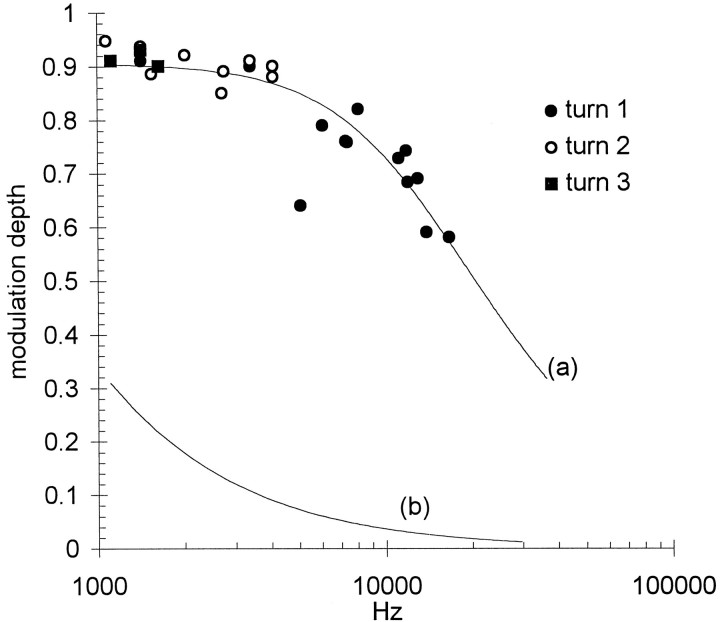
The depth of modulation of the EEOAEs was reduced at higher electrical stimulus frequencies. Figure 6shows modulation amplitudes from turns 1, 2, and 3 pooled from nine preparations, plotted against electrical frequency. All data were obtained from waveforms modulated at sound levels that produced saturation of the locally recorded CM, so each point can be assumed to reflect a similar degree of modulation of the transducer conductance. The range of emission frequencies examined was 1119–1621 Hz in turn 3; 1076–4091 in turn 2; and 1421–16,757 Hz in turn 1. The depth of modulation decreased from 90–95% at the lowest emission frequencies to <60% at the highest frequencies. The solid curve (a) in Figure 6 shows the characteristics, derived by a least squares fit to the data, of a simple low-pass filter. The 3 dB corner frequency of the fitted curve is 13.6 kHz. Curve (b) describes a low-pass filter with a corner frequency of 400 Hz (see Discussion).
Fig. 6.
Modulation depth diminished with increasing emission frequency. EEOAEs from three cochlear turns were modulated at saturating sound levels. Curve (a) describes the frequency response of a simple low-pass filter fitted to the data by the least squares method. The 3 dB corner frequency is 13.6 kHz. Curve (b) describes for comparison (see Discussion) a filter with a corner frequency of 400 Hz.
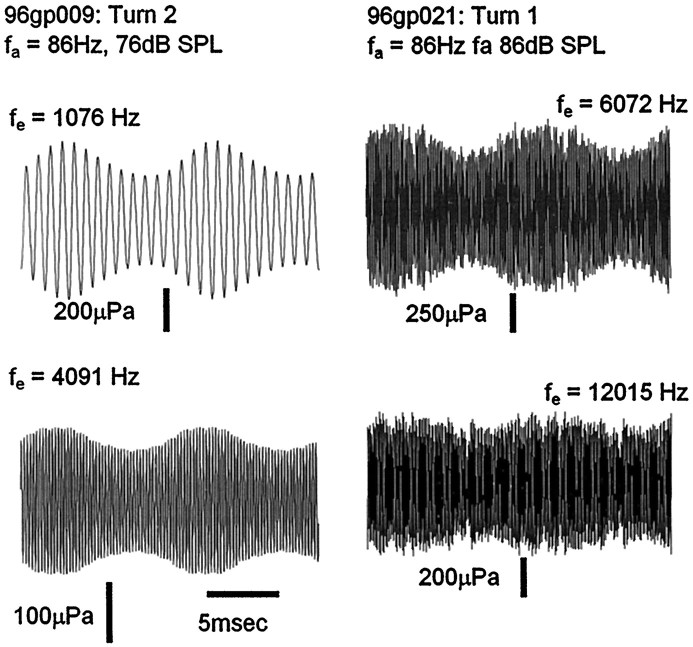
Reduction of amplitude modulation with increasing emission frequency was not unique to the louder bias tones, but was observed over the entire range of sound intensities. Figure7 illustrates this with examples from turn 2 (top panels) and turn 1 (bottom panels). In each turn EEOAEs at different frequencies were modulated by 86 Hz tones at the same nonsaturating sound level. In both turns the modulation depth was smaller at the higher emission frequency.
Fig. 7.
Modulation depth at nonsaturating sound levels was also frequency dependent. The examples shown are from turn 2 (left) and turn 1 (right). Sound levels were 10–15 dB below the levels that produced maximum CM amplitude.
EEOAE generation site
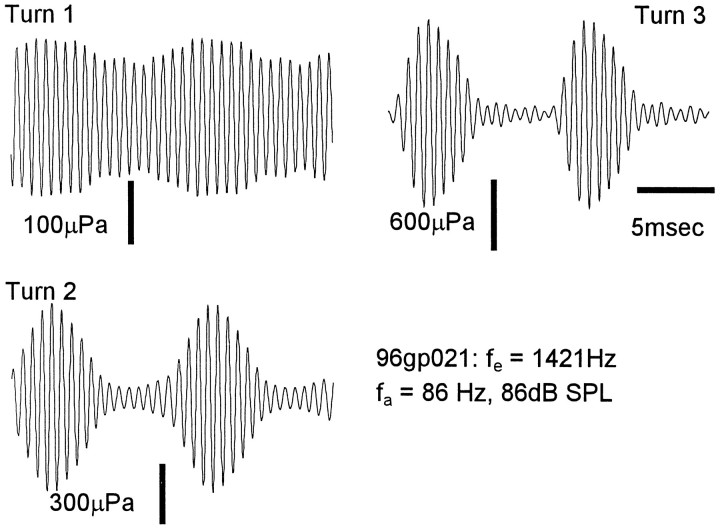
For any given sound level the EEOAE modulation depth varied systematically across different regions of the cochlea. This is shown by the example in Figure 8 in which the emissions were generated by electrical stimulation at 1421 Hz in turns 1, 2, and 3 of the same cochlea, and the 86 Hz biasing tone was at 80 dB SPL. The modulation depth was 31% in turn 1, 88% in turn 2, and 93% in turn 3, reflecting the excitation pattern along the cochlea for the low-frequency biasing tone (Honrubia and Ward, 1968).
Fig. 8.
Depth of modulation varied with generation site. EEOAEs were generated from three turns in the same cochlea, and stimulus parameters were constant.
DISCUSSION
One interpretation of the modulation of EEOAEs by low-frequency sound is that extrinsically applied current gains access to a membrane-based source of motility through forward-transduction channels. Thus the current and hence the EEOAE would be modulated in proportion to the mean conductance, and therefore to the CM, as was observed. This interpretation is supported by our demonstration elsewhere (Kirk and Yates, 1998) that EEOAE amplitude is reduced when the K+ channel blocker 4-aminopyridine is iontophoresed into scala media. Concurrent reductions in the CM and elevation of the DC endocochlear potential were consistent with closed blockade of OHC forward-transduction channels.
In the present study, EEOAEs were modulated by up to 75% at frequencies above 10 kHz. This is surprising, and hard to reconcile with what we would expect to be the electrical characteristics of the apical surface of the OHC. The mechanical-transduction channels are thought to be located at the tips of the stereocilia (Jaramillo and Hudspeth, 1991) and are presumably embedded in a normal bilayer membrane. If so, extrinsically applied currents have at least two, parallel pathways by which they might enter the cell: through resistive pathways offered by open channels, or through the capacitance of the stereocilia membranes. Current passing through the channels would be expected to be dependent on the state (whether open or closed) of the channels but independent of frequency, whereas current through the capacitance would be expected to be independent of the state of the channels but to increase in direct proportion to frequency.
A recent study of the characteristics of OHC mechano-sensitive channels (Géléoc et al., 1997) reported a single-channel conductance of 112 pS with one channel per stereocilium. Using typical parameters for the shape of an OHC stereocilium (length 2.5 μm, diameter 0.25 μm; Lim, 1986), and a membrane capacitance of 1 μF/cm2 (Cole, 1940), we calculate a corner frequency of ∼400 Hz for a single stereocilium. This would be an upper boundary for the whole cell because current could also go through the membrane capacitance of any stereocilium that did not have channels as well as through the capacitance of the apical surface of the cell.
Current through the capacitance should become progressively dominant, increasing at the rate of 6 dB per octave above 400 Hz, even when all transduction channels are fully opened. The membrane capacitance is, in effect, a high-pass filter. The predicted consequence for the modulation of EEOAEs (see curve (b) in Fig. 6) is that above 400 Hz changes in channel state should have progressively less effect on the total current passing into the cell, and hence little effect on the EEOAE, until at around 10 kHz we should see only a few percent of modulation, not over 70% as was observed.
It is conceivable that low-frequency acoustic stimulation could modulate transmission of the EEOAE through the middle ear, but this can be rejected on three grounds. First, the observation that the modulation depth was greater for the more apical electrode sites (Fig.8) is evidence that the modulation depended on the local basilar membrane displacement. Second, modulations of the EEOAE waveforms followed the CM when the CM phase was delayed by amounts consistent with the time taken for the EEOAEs to propagate from the generation site, implying that modulation took place within the cochlea. Third, there is no evidence in the literature that such modulation takes place on the forward transmission through the middle ear at the intensities used in the present study.
Another possibility, that mechanical propagation of electrically evoked motility might be modulated by basilar membrane displacement, is probably remote. To produce the pattern of modulation we observed, the mechanical sensitivity of the basilar membrane would have to be enhanced during scala vestibuli bias and reduced during scala tympani bias. However, Patuzzi et al. (1984) showed that the sensitivity is reduced slightly during bias in either direction. Furthermore, Cheatham and Dallos (1994) found little difference between the CM responses to high-frequency probe tones placed at either the scala vestibuli or scala tympani phase of a low-frequency bias. If the mechanical coupling of reverse transduction is equivalent to the coupling of forward transduction, then this result also argues against the modulation of EEOAEs being attributed to purely mechanical changes.
The intracellular receptor potentials evoked by the low-frequency sound could modulate the electromotile sensitivity. The voltage and displacement function of OHCs in vitro is sigmoidal and asymmetrical about the resting membrane potential (Santos-Sacchi, 1989). The asymmetry is such that the reverse-transduction gain, and possibly the EEOAE amplitude, would increase when the cell is depolarized and decrease with hyperpolarization. Although we cannot rule out this interpretation entirely, we consider it unlikely. The voltage and displacement curve as measured in vitro is extremely broad, extending from −150 to +30 mV about a resting intracellular potential of −70 mV (Santos-Sacchi, 1989), but intracellular receptor potentials are small, at most ±10 mV (Dallos, 1986; Russell et al., 1986). The asymmetry would probably be insignificant over the physiological range. Roddy et al. (1994)estimated that a 10 mV hyperpolarization would reduce an EEOAE by only ∼2 dB. We observed far greater reductions (up to 85% or ∼16 dB) with hyperpolarizing displacements.
The electromotile gain of OHCs in vitro is also sensitive to the cell membrane tension (Kakehata and Santos-Sacchi, 1995), but this too may be an unlikely candidate. If the membrane tension, and hence the electromotile feedback, were differentially influenced by different directions of displacement in vivo, then the basilar membrane sensitivity should vary accordingly. As we noted above, this does not occur (Patuzzi et al., 1984).
We believe the most parsimonious interpretation is that the modulations are related directly to changes in the apical transducer conductance, although we cannot account for modulation of EEOAEs at emission frequencies five octaves or more above the estimated upper-frequency limit. We are not aware of evidence for specializations in the OHC apical membrane that might reduce the electrical capacitance or minimize its effects on the electrical stimulus. The situation parallels that in the cell’s basolateral membrane, in which electrical capacitance should reduce the receptor current drive to the motility mechanism (Santos-Sacchi, 1992) but, assuming basolateral motility is part of the cochlear amplifier, does not appear to do so. A resolution of this paradox, which might also be consistent with the present results, is a motility mechanism in the transduction channel itself, or close to it, rather than in the lateral cell wall (Hudspeth and Gillespie, 1994; Benser et al., 1996; Manley and Gallo, 1997). Conceivably, the output of such a motor could depend directly on the state of the transduction channels, and thus be modulated by low-frequency sound even if the extrinsic current did gain access through the membrane capacitance. However, evidence for such a motor, present in mammalian hair cells and capable of functioning at frequencies within the range of hearing, is virtually nonexistent.Zhang et al. (1997) described a voltage-dependent stereocilia stiffness in isolated guinea pig OHCs, but this phenomenon appeared independent of the transduction mechanism because it persisted in the presence of streptomycin, a known blocker of transduction channels in hair cells. In addition, evidence cited in preceding paragraphs, that neither forward transduction (Cheatham and Dallos, 1994) nor basilar membrane sensitivity (Patuzzi et al., 1984) appears to be differentially sensitive to different directions of displacement, might also argue against direct modulation of a motile element by low-frequency bias.
Although the notion of a stereocilia motor is attractive, the cell body motor has substantial experimental support and enjoys wide acceptance, despite its basic problem. Recently, Dallos and Evans (1995) proposed that the low-pass filtering limitation of the basolateral membrane could be circumvented if the apical and basolateral impedances divided the extracellular receptor potential in scala media in the inverse ratio of the two resistances at low frequencies, and the capacitances at high frequencies. Provided the apical and basolateral time constants were similar, this would apply a reduced, but frequency-independent, sample of the receptor potential to a membrane-based motor by balancing the low-pass filtering effect of the basolateral membrane with the high-pass filtering effect of the apical membrane. Whereas this model offers an elegant solution to the problem of the basolateral filter, it would not predict our results. The resistive and capacitive pathways are supposed to be independent at the extremes of frequency, so modulation of the resistive pathway would affect only low stimulus frequencies whereas high-frequency currents would pass almost entirely through the capacitive pathway. We estimate, using Equation 3 fromDallos and Evans (1995), that the amplitude modulation of a membrane-based motility, generated by modulation of the apical resistive component in this model, would fall off rapidly above a frequency (a few hundred Hz) determined by the reciprocal of the apical time constant. Our observation of 75% modulation above 10 kHz indicates there can be little high-pass filtering at the apical membrane and hence no compensation between the apical and basolateral capacitances.
Our results are the strongest evidence yet that EEOAEs are generated directly by mechanisms related to cochlear transduction. More certain interpretation of their implication for the coupling between forward and reverse transduction must await further elucidation of these processes themselves.
Footnotes
This manuscript was supported by grants from the National Health and Medical Research Council of Australia (Project Grant 960566) and from the University of Western Australia. We are grateful to G. Nancarrow and G. Bennet for technical support and to D. Robertson and two anonymous reviewers for instructive criticism of earlier versions of this manuscript.
Correspondence should be addressed to Dr. D. L. Kirk, Department of Physiology, The University of Western Australia, Nedlands 6907, W.A. Australia.
REFERENCES
- 1.Benser ME, Marquis RE, Hudspeth AJ. Rapid, active hair bundle movements in hair cells from the bullfrog’s sacculus. J Neurosci. 1996;16:5629–5643. doi: 10.1523/JNEUROSCI.16-18-05629.1996. [DOI] [PMC free article] [PubMed] [Google Scholar]
- 2.Cheatham MA, Dallos P. Stimulus biasing—a comparison between cochlear hair cell and organ of corti response patterns. Hear Res. 1994;75:103–113. doi: 10.1016/0378-5955(94)90061-2. [DOI] [PubMed] [Google Scholar]
- 3.Cole KS. Permeability and impermeability of cell membranes for ions. Cold Spring Harb Symp Quant Biol. 1940;8:110–122. [Google Scholar]
- 4.Dallos P. Neurobiology of cochlear inner and outer hair cells: intracellular recordings. Hear Res. 1986;22:185–198. doi: 10.1016/0378-5955(86)90095-x. [DOI] [PubMed] [Google Scholar]
- 5.Dallos P. The active cochlea. J Neurosci. 1992;12:4575–4585. doi: 10.1523/JNEUROSCI.12-12-04575.1992. [DOI] [PMC free article] [PubMed] [Google Scholar]
- 6.Dallos P, Evans BN. High-frequency motility of outer hair cells and the cochlear amplifier. Science. 1995;267:2006–2009. doi: 10.1126/science.7701325. [DOI] [PubMed] [Google Scholar]
- 7.Davis H. An active process in cochlear mechanics. Hear Res. 1983;9:79–90. doi: 10.1016/0378-5955(83)90136-3. [DOI] [PubMed] [Google Scholar]
- 8.Géléoc GSG, Lennan GWT, Richardson GP, Kross CJ. A quantitative comparison of mechanoelectrical transduction in vestibular and auditory hair cells of neonatal mice. Proc R Soc Lond B Biol Sci. 1997;264:611–621. doi: 10.1098/rspb.1997.0087. [DOI] [PMC free article] [PubMed] [Google Scholar]
- 9.Hallworth R, Evans BN, Dallos P. The location and mechanism of electromotility in guinea pig outer hair cells. J Neurophysiol. 1993;70:549–558. doi: 10.1152/jn.1993.70.2.549. [DOI] [PubMed] [Google Scholar]
- 10.Holley MC, Ashmore JF. Spectrin, actin and the structure of the cortical lattice in mammalian cochlear outer hair cells. J Cell Sci. 1990;96:283–291. doi: 10.1242/jcs.96.2.283. [DOI] [PubMed] [Google Scholar]
- 11.Honrubia V, Ward PH. Longitudinal distribution of the cochlear microphonics inside the cochlear duct (guinea pig). J Acoust Soc Am. 1968;44:951–958. doi: 10.1121/1.1911234. [DOI] [PubMed] [Google Scholar]
- 12.Hudspeth AJ, Gillespie PG. Pulling strings to tune transduction: adaptation by hair cells. Neuron. 1994;12:1–9. doi: 10.1016/0896-6273(94)90147-3. [DOI] [PubMed] [Google Scholar]
- 13.Jaramillo F, Hudspeth AJ. Localization of the hair cell’s transduction channels at the hair bundle’s top by iontophoretic application of a channel blocker. Neuron. 1991;7:409–420. doi: 10.1016/0896-6273(91)90293-9. [DOI] [PubMed] [Google Scholar]
- 14.Kakehata S, Santos-Sacchi J. Membrane tension directly shifts voltage dependence of outer hair cell motility and associated gating charge. Biophys J. 1995;68:2190–2197. doi: 10.1016/S0006-3495(95)80401-7. [DOI] [PMC free article] [PubMed] [Google Scholar]
- 15.Kim DO. Active and nonlinear cochlear biomechanics and the role of outer-hair-cell subsystem in the mammalian auditory system. Hear Res. 1986;22:105–114. doi: 10.1016/0378-5955(86)90088-2. [DOI] [PubMed] [Google Scholar]
- 16.Kim DO, Neely ST, Molnar CE, Matthews DO. An active cochlear model with negative damping in the partition: comparison with rhodes ante and post mortem observations. In: van den Brink G, Bilsen FA, editors. Psychophysical, physiological and behavioural studies in hearing. Delft UP; Delft, The Netherlands: 1980. pp. 7–14. [Google Scholar]
- 17.Kirk DL, Yates GK. Frequency tuning and acoustic enhancement of electrically evoked oto-acoustic emissions in the guinea pig cochlea. J Acoust Soc Am. 1996;100:3714–3725. doi: 10.1121/1.417335. [DOI] [PubMed] [Google Scholar]
- 18.Kirk DL, Yates GK. 4-Aminopyridine in scala media reversibly alters the cochlear potentials and suppresses electrically evoked oto-acoustic emissions. Audiol Neuro-Otol. 1998;3:21–39. doi: 10.1159/000013776. [DOI] [PubMed] [Google Scholar]
- 19.Konishi T, Nielsen DW. The temporal relationship between basilar membrane motion and nerve impulse initiation in auditory nerve fibers of guinea pigs. Jpn J Physiol. 1978;28:291–307. doi: 10.2170/jjphysiol.28.291. [DOI] [PubMed] [Google Scholar]
- 20.Lim DJ. Functional structure of the organ of Corti: a review. Hear Res. 1986;22:117–146. doi: 10.1016/0378-5955(86)90089-4. [DOI] [PubMed] [Google Scholar]
- 21.Manley GA, Gallo L. Otoacoustic emissions, hair cells and myosin motors. J Acoust Soc Am. 1997;102:1049–1055. doi: 10.1121/1.419858. [DOI] [PubMed] [Google Scholar]
- 22.Mountain DC, Hubbard AE. Rapid force production in the cochlea. Hear Res. 1989;42:195–202. doi: 10.1016/0378-5955(89)90144-5. [DOI] [PubMed] [Google Scholar]
- 23.Mountain DC, Hubbard AE, McMullen TA. Electromechanical processes in the cochlea. In: de Boer E, Viergever MA, editors. Mechanics of hearing. Martinus Nijhoff; The Hague: 1983. pp. 119–126. [Google Scholar]
- 24.Murata K, Moriyama T, Hosokawa Y, Minami S. Alternating current induced otoacoustic emissions in the guinea pig. Hear Res. 1991;55:201–214. doi: 10.1016/0378-5955(91)90105-i. [DOI] [PubMed] [Google Scholar]
- 25.Nuttall AL, Ren TY. Electromotile hearing - evidence from basilar membrane motion and otoacoustic emissions. Hear Res. 1995;92:170–177. doi: 10.1016/0378-5955(95)00216-2. [DOI] [PubMed] [Google Scholar]
- 26.Ohmori H. Mechanical stimulation and Fura-2 fluorescence in the hair bundle of dissociated hair cells of the chick. J Physiol (Lond) 1988;399:115–137. doi: 10.1113/jphysiol.1988.sp017071. [DOI] [PMC free article] [PubMed] [Google Scholar]
- 27.Patuzzi R, Sellick PM, Johnstone BM. The modulation of the sensitivity of the mammalian cochlea by low frequency tones. III. Basilar membrane motion. Hear Res. 1984;13:19–28. doi: 10.1016/0378-5955(84)90091-1. [DOI] [PubMed] [Google Scholar]
- 28.Patuzzi RB, Robertson D. Tuning in the mammalian cochlea. Physiol Rev. 1988;68:1009–1082. doi: 10.1152/physrev.1988.68.4.1009. [DOI] [PubMed] [Google Scholar]
- 29.Roddy J, Hubbard AE, Mountain DC, Xue S. Effects of electrical biasing on electrically-evoked otoacoustic emissions. Hear Res. 1994;73:148–154. doi: 10.1016/0378-5955(94)90229-1. [DOI] [PubMed] [Google Scholar]
- 30.Ruggero MA, Robles L, Rich NC. Basilar membrane mechanics at the base of the chinchilla cochlea. II. Responses to low-frequency tones and relationship to microphonics and spike initiation in the VIII nerve. J Acoust Soc Am. 1986;80:1375–1383. doi: 10.1121/1.394390. [DOI] [PubMed] [Google Scholar]
- 31.Russell IJ, Cody AR, Richardson GP. The response of inner and outer hair cells in the basal turn of the guinea pig cochlea and in the mouse cochlea grown in vitro. Hear Res. 1986;22:199–216. doi: 10.1016/0378-5955(86)90096-1. [DOI] [PubMed] [Google Scholar]
- 32.Santos-Sacchi J. Asymmetry in voltage-dependent movements of isolated outer hair cells from the organ of Corti. J Neurosci. 1989;9:2954–2962. doi: 10.1523/JNEUROSCI.09-08-02954.1989. [DOI] [PMC free article] [PubMed] [Google Scholar]
- 33.Santos-Sacchi J. On the frequency limit and phase of outer hair cell motility: effects of the membrane filter. J Neurosci. 1992;12:1906–1916. doi: 10.1523/JNEUROSCI.12-05-01906.1992. [DOI] [PMC free article] [PubMed] [Google Scholar]
- 34.Santos-Sacchi J, Dilger JP. Whole cell currents and mechanical responses of isolated outer hair cells. Hear Res. 1988;35:143–150. doi: 10.1016/0378-5955(88)90113-x. [DOI] [PubMed] [Google Scholar]
- 35.Xue SW, Mountain DC, Hubbard AE. Acoustic enhancement of electrically-evoked otoacoustic emissions reflects basilar membrane tuning—experiment results. Hear Res. 1993;70:121–126. doi: 10.1016/0378-5955(93)90056-7. [DOI] [PubMed] [Google Scholar]
- 36.Yates GK, Johnstone BM, Patuzzi RB, Robertson D. Mechanical preprocessing in the mammalian cochlea. Trends Neurosci. 1992;15:57–61. doi: 10.1016/0166-2236(92)90027-6. [DOI] [PubMed] [Google Scholar]
- 37.Zhang M, Evans BN, Dallos P (1997) Voltage-dependent ciliary stiffness in cochlear outer hair cells. Presented at the 20th Annual Midwinter Meeting of the Association for Research in Otolaryngology, St. Petersburg, Florida.


