

Abstract
The time course of Ca2+ channel activation and the amplitude and rate of change of Ca2+ influx are primarily controlled by membrane voltage. G-protein-coupled signaling pathways, however, modulate the efficacy of membrane voltage on channel gating. To study the interactions of membrane potential and G-proteins on Ca2+ influx in a physiological context, we have measured N-type Ca2+ currents evoked by action potential waveforms in voltage-clamped chick dorsal root ganglion neurons. We have quantified the effect of varying action potential waveforms and frequency on the shape of Ca2+ current in the presence and absence of transmitters (GABA or norepinephrine) that inhibit N current. Our results demonstrate that both the profile of Ca2+ entry and the time course and magnitude of its transmitter-induced inhibition are sensitive functions of action potential waveform and frequency. Increases in action potential duration enhance total Ca2+ entry, but they also prolong and blunt Ca2+ signals by slowing influx rate and reducing peak amplitude. Transmitter-mediated inhibition of Ca2+ entry is most robust with short-duration action potentials and decreases exponentially with increasing duration. Increases in action potential frequency promote a voltage-dependent inactivation of Ca2+ influx. In channels exposed to GABA or norepinephrine, however, this inactivation is counteracted by a time- and frequency-dependent relief of modulation. Thus, multiple stimuli are integrated by Ca2+ channels, tuning the profile of influx in a changing physiological environment. Such variations are likely to be significant for the control of Ca2+-dependent cellular responses in all tissues.
Keywords: Ca2+ channel, G-protein-coupled receptor, action potential, modulation, Ca2+ influx, frequency-dependent effects, G-protein
Many physiological processes are triggered by Ca2+ influx through voltage-dependent channels, and the means by which Ca2+ signals bring about differential activation of effector responses is only partially understood. In some cases, selective activation is produced by the simple strategy of physically anchoring effectors in close proximity to a particular channel type (Jorgensen et al., 1989; Robitaille et al., 1990; Haydon et al., 1994; Gao et al., 1997). However, selectivity can also be encoded by tailoring the effector response to a specific rate or frequency of cytosolic Ca2+ concentration change (Gu and Spitzer, 1995; Dolmetsch et al., 1997; Fields et al., 1997; De Konninck and Schulman, 1998). In this case, the kinetics of Ca2+ influx (and the resultant rate of change of Ca2+ concentration) play important roles in determining the magnitude of physiological responses.
The profile of Ca2+ entry through voltage-dependent channels is shaped, in part, by the biophysical properties of the channels themselves. Channel gating (activation and inactivation) varies with changes in membrane potential waveform; thus, factors that affect action potential amplitude, duration, or frequency can produce significant alterations in the rate and time course of Ca2+ entry. In addition, Ca2+influx can be modified by receptor- and G-protein-dependent modulatory pathways that target Ca2+ channels and alter their gating properties (Dolphin, 1995; Jones and Elmslie, 1997; Dunlap and Ikeda, 1998; Ikeda and Dunlap, 1998). Thus, a variety of parameters tailor the profile of Ca2+ influx through voltage-dependent channels and jointly regulate cellular processes in a changing physiological environment.
To gain insight into how membrane potential, channel-gating, and G-protein-dependent modulation change the profile of Ca2+ influx under varying physiological conditions, we have studied Ca2+ currents evoked by action potentials in the somata of embryonic chick dorsal root ganglion (DRG) neurons. The action potential waveform (APW) and frequency were systematically varied under voltage-clamp conditions, and the resulting effects on Ca2+ influx and its G-protein-dependent inhibition were assessed. These cells are advantageous for such studies, because they express a largely homogeneous population of N-type Ca2+ channels (Aosaki and Kasai, 1989; Cox and Dunlap, 1992) that are inhibited by several biophysically and biochemically distinct pathways (Diversé-Pierluissi and Dunlap, 1993; Diversé-Pierluissi et al., 1995, 1997). Our results demonstrate that both the profile of Ca2+ entry and the time course and magnitude of its G-protein-dependent inhibition are sensitive functions of action potential waveform and frequency. Such variations are likely to be important not only for the processing of sensory information delivered to the spinal cord via DRG neurons but also for use-dependent changes in physiological responses generated in any tissue expressing voltage-dependent Ca2+channels.
MATERIALS AND METHODS
Cell culture. Dorsal root ganglia were dissected from single 11- to 12-d-old chicken embryos (Spafas) and incubated for 30 min at 37°C in Ca2+- and Mg2+-free saline containing 0.1% collagenase A (Boehringer Mannheim, Indianapolis, IN). The ∼30 ganglia were washed free of collagenase and placed into 1 ml of culture medium consisting of DMEM supplemented with 10% heat-inactivated horse serum, 5% chicken embryo extract, 50 U/ml penicillin, 50 mg/ml streptomycin, 1 mm glutamine, and nerve growth factor. Ganglia were dissociated mechanically into single cells by passing them several times through a small-bore, fire-polished Pasteur pipette. A small volume (∼100–150 μl) of the single-cell suspension was applied to the center of a 35 mm tissue culture dish coated with rat tail collagen. After incubation for 1 hr in a 37°C CO2incubator (to allow the cells to attach to the substrate), the dishes were flooded with 1.5 ml of culture medium.
Electrophysiological recording and analysis. Standard tight-seal, whole-cell recording methods (Hamill et al., 1981) were used to record Ca2+ currents from cells within 8 hr of their dissociation from intact ganglia. Cells were visualized on the stage of a compound, inverted microscope, and recordings were confined to cells with short or no neurites to ensure adequate spatial control of voltage. All recordings were performed at room temperature. Current-clamp recordings of action potentials were made on cells 1–3 din vitro, using a List Biologic (Campbell, CA) EPC-7 patch-clamp amplifier. For voltage-clamp experiments, pipettes were filled with a solution containing (in mm): 150 CsCl, 10 HEPES, 5 BAPTA, and 5 MgATP, and cells were bathed in 93 NaCl, 50 tetraethylammonium chloride, 1 CaCl2, 25 HEPES, 12.5 NaOH, 5 d-(+)-glucose, and 3 × 10⁻⁴ tetrodotoxin. For current-clamp experiments, pipettes were filled with 140 K-aspartate, 10 KCl, 5 MgCl2, 10 HEPES, and 0.1 EGTA, and cells were bathed in 145 NaCl, 5.2 KCl, 1.8 CaCl2, 0.8 MgCl2, 10 HEPES, and 5 d-(+)-glucose. The pH of all solutions was 7.4.
Pipette resistances varied between 0.8 and 1.5 MΩ when filled with internal solution; access resistances averaged 1.6 ± 0.2 MΩ and were routinely compensated up to >50%. Potentials and currents were applied and/or recorded via an ITC-16 analog-to-digital interface (Instrutech Corp.) and a Macintosh computer running Pulse software (HEKA Electronik). For experiments using rectangular pulses, capacitive transients were canceled with the EPC-7 circuitry, currents were routinely filtered at 3 kHz, and leak currents were subtracted with a standard p/4 protocol using Pulse software. The command waveforms used for APW-evoked currents were taken from sharp electrode or whole-cell recordings of DRG neuron action potentials (at room temperature), using a high input impedance amplifier with a fast slew rate to avoid distortions in time course; the waveforms were then digitally altered to generate families of APWs of varied amplitude and duration. APW-evoked currents, capacitive and leakage currents were generally determined by applying a negative-going APW and subtracted from total membrane current to yield voltage-dependent Ca2+ current (Fig. 1). For certain experiments (noted in legends), ω-conotoxin GVIA (applied at 1 μm at the end of the recording period) was used to distinguish N currents from leakage and capacitive currents as well as Ca2+ currents flowing through non-N channels. Data were digitized at 40–200 kHz (for APW-evoked currents) and 10–20 kHz (for rectangular pulse-evoked currents). Data analysis was performed with IgorPro (Wavemetrics, Lake Oswego, OR); all averaged data are reported as means ± SDs unless otherwise noted.
Fig. 1.
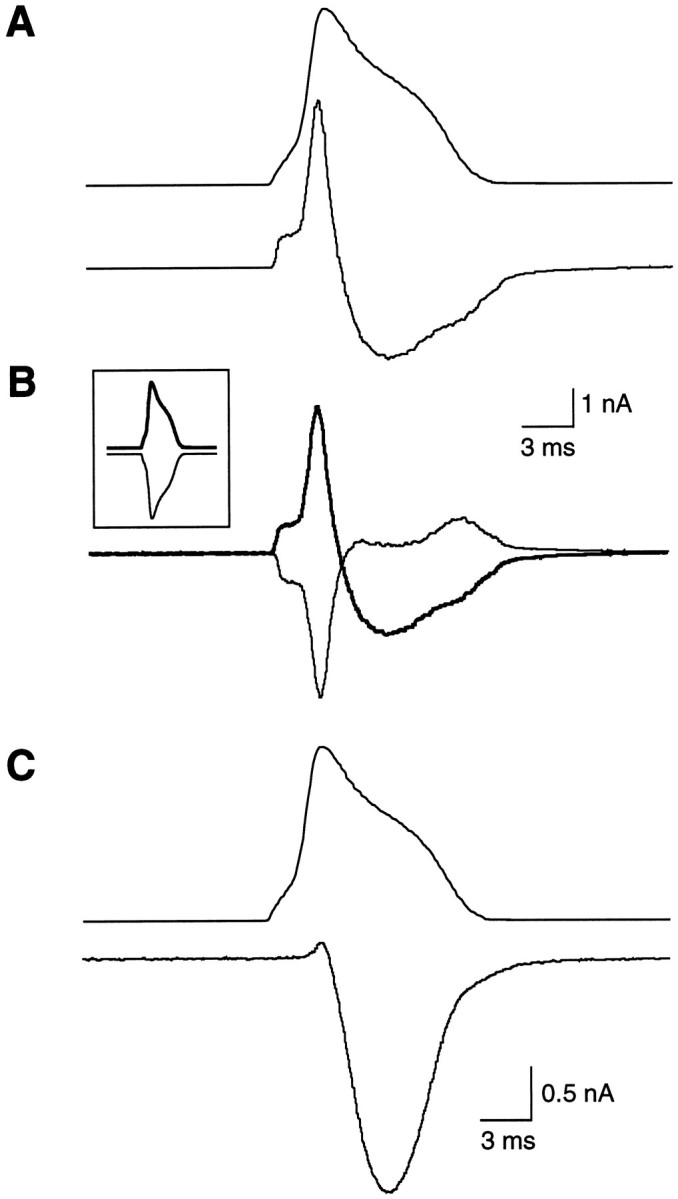
Isolation of APW-evoked Ca2+current in chick DRG neurons. A, Total membrane current (bottom panel) evoked by an APW (top panel) with the following properties: 20 mV peak, 1.6 msec rising phase, and 5.2 msec falling phase. Holding potential, −80 mV. B, Superimposed membrane currents produced by positive (thick line) or negative (thin line) APWs (shown in inset). C, APW (top) and voltage-dependent Ca2+channel current (bottom) determined by the addition of the two membrane currents in B. Current filtered at 1 KHz.
Solutions and chemicals. External solutions were exchanged rapidly by applying slight pressure to one of a linear array of polymer-coated quartz tubes (140 μm inner diameter, Polymicro Technologies, Inc.) containing normal external solution with or without drugs of interest. Solution reservoirs were positioned ∼30 cm above the microscope stage.
Stock solutions (100–10,000×) of drugs were prepared in distilled water except bicuculline (0.1 m HCl), ω-conotoxin GVIA (distilled water containing 1 mg/ml bovine serum albumin), and nimodipine (95% ethanol) and stored at −20°C. Stock solutions of norepinephrine, however, were not stored to avoid oxidation. All working solutions (concentrations noted in text) were made by dilution from stock solutions into external saline immediately before the experiment.
RESULTS
N-type Ca2+ current evoked by action potential waveforms
Whole-cell currents from acutely dissociated embryonic chick DRG neurons were recorded in response to APWs in the presence of Na+ and K+ channel blockers (Fig.1A). Capacitative and leakage currents were estimated using a full-amplitude negative-going APW (Fig. 1B) and subtracted from total current to yield the voltage-dependent Ca2+ current. Inward Ca2+ current was preceded by a small, outward gating current (Jones et al., 1997) and reached a peak during the falling phase of the APW (Fig. 1C), as has been reported by others (Llinas et al., 1982; McCobb and Beam, 1991; Toth and Miller, 1995; Brody et al., 1997).
Pharmacological characterization of the APW-evoked current indicates a dominant component that is sensitive to ω-conotoxin GVIA (the irreversible N channel antagonist). This toxin produced an average maximal inhibition of 87 ± 6% (Fig.2A,C) and a concentration–response relationship that can be well fitted with a single-binding site isotherm with half-maximal inhibition at 53 nm (Fig. 2C).
Fig. 2.

Pharmacological characterization of APW-evoked Ca2+ currents. A, B, Superimposed inward currents evoked by APWs (left) or rectangular pulses (to 0 mV, right) delivered from a holding potential of −80 mV before (CON), after a 3 min application of saturating ω-conotoxin GVIA (A), or during the application of 300 μmCd2+ (B). C, Concentration–response relationships for ω-conotoxin GVIA, Cd2+, and Ni2+ (as marked,n = 3–6 cells per point). Smooth lines represent the least-squares fits to a single binding site equation, % inhibition = (Imax · [Inh])/([Inh] + IC50), whereImax is the maximum inhibition, [Inh] the inhibitor concentration, and IC50 the concentration of inhibitor producing half-maximal blockade. Toxin was applied for the times necessary to approach equilibrium binding; concentrations of 0.03, 0.1, 0.3, 1.0, and 4.0 μm were applied for 20, 20, 6.6. 6.5, and 2 min, respectively. In cells receiving prolonged toxin applications, currents were corrected for rundown (measured in control cells from the same plating at ∼1%/min).
No reversal of ω-CTx GVIA-induced inhibition was observed during 60 min washout of toxin (data not shown). It has been reported that L-type currents in chick DRG neurons are blocked reversibly by ω-CTx GVIA (Aosaki and Kasai, 1989); the irreversibility of toxin blockade in our experiments, therefore, suggests the absence of L channels under our recording conditions. To further confirm the absence of L channels, we used the dihydropyridine antagonist, nimodipine, which maximally inhibits L channel current at a concentration of 100 nm(Triggle and Janis, 1987). When applied at 5 μm, nimodipine was without effect on seven of seven neurons tested (mean current amplitudes, 2.35 ± 0.48 and 2.33 ± 0.46 nA without and with nimodipine, respectively).
Low-voltage-activated (LVA) currents have been shown previously to provide substantial Ca2+ influx during APWs in chick DRG neurons at early stages of development (McCobb and Beam, 1991). Both biophysical and pharmacological means were used to test for the presence of LVA current under our recording conditions. Little rapidly inactivating current (characteristic of LVA channels) was observed with step depolarizations (Fig. 2A, right), suggesting that, if present, the LVA current component was small. To determine whether a small component might be accentuated by APW commands, we exploited the observation that LVA currents are more sensitive to Ni2+ than to Cd2+, whereas HVA channels have the opposite sensitivity (Carbone and Lux, 1984; Fox et al., 1987; Narahashi et al., 1987). We recorded Ca2+ currents from several cells in response to APWs during application of a range of Cd2+ (Fig.2B,C) or Ni2+ (Fig. 2C) concentrations. The IC50 for Ni2+ was 177 μm, ∼100-fold higher than that for Cd2+ (1.5 μm), indicating a predominance of HVA current. Data were well fitted with a single-binding site equation, suggesting that the current did not contain two components with significantly different sensitivities to Ni2+ and Cd2+ (Fig.2C).
APW-evoked Ca2+ currents in our preparation are, thus, largely HVA- and N-type, consistent with results from rectangular pulse experiments (Cox and Dunlap, 1992). The small current that is insensitive to ω-CTx GVIA and nimodipine was not blocked by 1 μm ω-agatoxin IVA, the P/Q channel antagonist (M. AtKisson and K. Dunlap, unpublished observations) and, therefore, most resembles R-type current described in other preparations (Mintz et al., 1992).
GABA inhibits APW-evoked Ca2+ current
Several transmitters, including GABA and norepinephrine (NE), inhibit N-type Ca2+ channels in chick DRG neurons; each transmitter can act via multiple G-protein pathways (Cox and Dunlap, 1992; Diversé-Pierluissi et al., 1995, 1997). One pathway, accounting for a portion of the inhibition, is mediated by a mechanism that (1) produces a slowing in the current activation kinetics; and (2) is attenuated by previous depolarization to positive potentials (Bean, 1989; Elmslie et al., 1990; Luebke and Dunlap, 1994). The contribution of this pathway [termed voltage-dependent (VD) modulation] can be estimated using a two-pulse paradigm (Jones and Elmslie, 1997) in which a conditioning prepulse reverses the transmitter-induced inhibition and returns activation kinetics to control rates (Fig. 3A). Not all inhibition is voltage-dependent in chick DRG neurons, however (Grassi and Lux, 1989; Diversé-Pierluissi and Dunlap, 1993;Luebke and Dunlap, 1994). The magnitude of the voltage-independent (VI) component can be estimated as that fraction of inhibition remaining after conditioning prepulses; VI inhibition varies among cells and, in exceptional cases, represents virtually 100% of the transmitter effect, demonstrated by the absence of kinetic slowing and prepulse-induced facilitation (Luebke and Dunlap, 1994).
Fig. 3.

Voltage-dependent and -independent inhibition produced by GABA. Superimposed current traces (bottom panels) in response to 50 msec rectangular pulses (A) or APWs (B) without (dotted line) or with conditioning pulses (80 mV, 20 msec) preceding the test pulses by 5 msec. Holding potential, −80 mV.Traces: 1, control; 2, control + prepulse; 3, 100 μm GABA;4, GABA + prepulse.
Previous studies have evaluated transmitter-mediated VD and VI inhibition of Ca2+ currents evoked with rectangular voltage steps (Fig. 3A), but little is known about the effects of these inhibitory processes on currents evoked by the more physiological APW. GABA (100 μm) produced an average 50 ± 8% inhibition of peak current (n = 17) evoked by APWs of 5.2 msec duration (Fig. 3). The kinetics of the APW-evoked current in the presence of transmitter were unchanged (Fig.3B), in contrast to the slowing of current activation observed with rectangular pulses (Fig. 3A). Given, however, that slowed gating is a protracted event (with a time constant of 10–15 msec), it would be difficult to observe such effects during the brief activation phases of APW-evoked currents. The presence of VD inhibition can, however, be established using the two-pulse paradigm (Fig. 3B). When the test APW is preceded by 5 msec with a 20 msec conditioning depolarization to 80 mV, the inhibition produced by GABA is reduced to 20 ± 5% (n = 6); that is, at least 60% of the modulatory effect of GABA is voltage-dependent. The prepulse produced little or no effect on unmodulated currents (Fig.3A,B).
To establish optimal conditions for quantitating the proportions of VD and VI inhibition by transmitters, we varied the prepulse amplitude and duration and the interpulse interval and measured their effects on GABA-induced inhibition. With a prepulse duration of 20 msec and an interpulse interval of 5 msec, variations in prepulse amplitude from −80 to 100 mV produced a relief of GABA-induced inhibition that increased with increasing prepulse amplitude. Maximal relief of inhibition was achieved with a prepulse to 80 mV, and the half-maximal effect occurred at 15 mV (Fig.4A). Using a fixed amplitude prepulse to 80 mV and a 5 msec interval, increasing prepulse duration attenuated GABA-induced inhibition; the amount of inhibition decreased exponentially during the first 15–20 msec of prepulse (τ = 3.3 msec) (Fig. 4B).
Fig. 4.

Quantitation of voltage-dependent inhibition. GABA-induced inhibition of APW-evoked current plotted as a function of prepulse amplitude (A), duration (B), or interpulse interval (C). Voltage commands are shown in top panels. Fixed prepulse parameters were as follows:A, 20 msec duration, 5 msec interval; B, 80 mV amplitude, 5 msec interval; and C, 80 mV amplitude, 20 msec duration. Data points in all panelsrepresent means of measurements from four to six cells;lines drawn through data points represent least squares fits to Boltzmann function (V½ = 15 mV; slope = 14 mV) (A) or single exponential functions (B, C; τ = 3.3 msec for B and 28 msec for C).
Prepulses to 80 mV for 20 msec were then used to examine the effect of increasing the interpulse interval from 5 to 80 msec. GABA-induced inhibition was relieved more effectively with shorter intervals; the relationship could be well fit to a single exponential function with a time constant of 28 msec (Fig. 4C). Maximal effects of prepulse were actually observed with no interpulse interval; however, under these conditions, the evaluation of APW-evoked currents was hampered by the tail currents flowing during prepulse repolarization. Our routine analysis, therefore, used a 5 msec interpulse interval, recognizing that, under such conditions, the VD component is underestimated by ∼15%.
Frequency-dependent changes in action potential shape
Given that a portion of transmitter-induced inhibition of N channels is sensitive to voltages and durations typically achieved by action potentials under normal physiological conditions, we explored whether the effects of transmitters vary with changes in action potential waveform and frequency. Initial experiments explored the use-dependent changes in DRG neuron action potentials that can occur under normal physiological conditions in the absence of transmitter. At modest firing frequencies (from 1 to 10 Hz), the amplitude decreased slightly and the duration increased significantly over the first 50 action potentials (Fig.5A)—effects that were accentuated at higher frequencies (Fig. 5B). Given that such changes are possible, we systematically varied action potential shape and frequency to study their effects on VD and VI inhibition produced by transmitters.
Fig. 5.

Frequency-dependent action potential broadening.A, Action potentials recorded from a DRG neuron under current clamp. Current pulses (1 nA, 3 msec) were applied at 1, 3.3, 6.7, and 10 Hz (left to right); the 1st and 50th action potentials are shown superimposed. B, Action potential duration as a function of action potential number, illustrating the progression of frequency-dependent increases in duration. Data points represent means of measurements from three to five cells. Error bars are omitted for clarity.
Inhibition of Ca2+ current as a function of action potential shape
To test for an effect of action potential amplitude on transmitter-induced inhibition, the peak of the command APW was varied from 44 to −6 mV in the absence or presence of 100 μmGABA. VD and VI inhibition were separated using the standard prepulse paradigm outlined above (80 mV, 20 msec, 5 msec interval). As shown in Figure 6, decreasing action potential amplitude had no significant effect on GABA-induced inhibition. This is, perhaps, not surprising: although the amplitude of the action potential was varied over a voltage range that affects GABA-mediated inhibition (Fig. 4A), the time over which the membrane is exposed to such peak depolarizations (<1 msec) is too brief to promote significant relief of inhibition (Fig.4B).
Fig. 6.

APW amplitude does not affect GABA-induced inhibition. A, APWs (top panel) used to evoke Ca2+ currents (amplitudes varied between 44 and −6 mV, duration constant at 2.6 msec); prepulse (80 mV, 20 msec, 5 msec interval) used to separate VD from VI inhibition.Bottom panel, Effect of 100 μm GABA without (2) and with (3) prepulse on currents in response to 44 mV APW; 1, control. B, Plot of total inhibition (○) and inhibition remaining after prepulse (▵). The shaded area represents the VD component of inhibition. Data points represent means ± SDs of measurements from four cells.
In contrast, changes in action potential duration effectively altered GABA-induced inhibition. The duration (from peak to half amplitude on the falling phase) was varied from 0.65 to 31.2 msec (keeping amplitude constant at 33 mV). Longer-duration APWs evoked lower-amplitude currents that activated more slowly (Fig.7A). Peak current decreased approximately exponentially with increases in APW duration, whereas total charge entry increased approximately linearly (Fig.7B). Application of 100 μm GABA decreased Ca2+ currents evoked by all APWs, but the total inhibition varied inversely with duration (Fig.8A,B), a relationship that could be well fitted with a single exponential function (τ = 13 msec). Conditioning prepulses were used to isolate the VI component of inhibition and demonstrate that the APW duration-dependent decrease in inhibition was associated exclusively with the VD component (Fig.8B). Plotted in Figure 8 is peak current; a similar relationship is seen for Ca2+ charge entry (data not shown).
Fig. 7.

Current waveform changes with action potential duration. A, Currents evoked by varying action potential duration (in milliseconds, noted to the left of each trace). APWs are illustrated in the top panel(amplitude, 33 mV; rising phase, 3.2 msec). B, Peak current (•) and total charge entry (or integral of Ca2+ current, ○) plotted as a function of action potential duration. Data points represent means ± SDs of measurements from five to eight cells. C, Ca2+ current activation rate plotted as a function of action potential duration; data are measurements from a single cell.
Fig. 8.

GABA-mediated inhibition changes with action potential duration. Currents evoked by APWs of varying duration (in milliseconds, noted to the left of each trace) in control (largest currents) or during application of 100 μm GABA (smallest currents). B, Total GABA-induced inhibition (○) of peak Ca2+ current or inhibition in presence of prepulse (■)—+80 mV, 20 msec, 5 msec interval—plotted as a function of APW duration. Theline through ○ represents least squares fit to single exponential (τ = 13 msec); through ■ is a straight line. Data points represent means ± SDs of measurements from five to eight cells. The shaded area represents the VD component of inhibition.
AP train-dependent relief of Ca2+current inhibition
Because transmitter-induced inhibition varies during the time course of a single action potential (Fig. 8), and the potential-dependent relief of inhibition persists for some time after membrane repolarization (Fig. 4C), we explored how Ca2+ currents and their modulation were affected by trains of APWs delivered at frequencies within the range of sensory neuron firing rates observed in vivo (Fitzgerald, 1987).
Ca2+ currents inactivate during train of action potentials
Under control conditions, peak Ca2+ current decreased steadily throughout action potential trains and was reduced ∼10% by 15 action potentials delivered at 73 Hz (Fig.9). This phenomenon, termed “preferential closed-state inactivation” by Patil et al. (1998), results from a voltage-dependent inactivation mechanism that proceeds after repolarization and accumulates during the interspike interval.
Fig. 9.

Inactivation of Ca2+ currents evoked by trains of APWs. A, Ca2+currents (bottom panel) evoked by a train of 15 APWs (top panel) delivered at 73 Hz (averages of 5 sweeps). Right panels show superimposed first (thinner lines) and last (thicker lines) traces on expanded time scale. The horizontal dashed line marks amplitude of first APW-evoked current. Leakage subtraction performed using currents remaining after application of 1 μm ω-conotoxin GVIA. B, Peak current (normalized to first current trace in train) as a function of the position in trains in which the interspike potential was −60 (▿), −80 (⋄), −100 (▵), −120 (■), and −140 (○) mV. Data are average values from nine cells each; error bars are omitted for clarity.
The presence of closed-state inactivation complicates measurement of train-dependent effects on transmitter-mediated inhibition of Ca2+ channels. Consistent with Patil et al. (1998), however, we found that the rate of inactivation is significantly slowed at negative potentials; repolarization of the interspike potential to less than −120 mV largely eliminated closed-state inactivation of control currents during the trains (Fig.9B). The effect of action potential trains on transmitter-mediated inhibition of Ca2+ channels could, therefore, be tested in the absence of inactivation by using trains of stimuli with interspike potentials of less than −120 mV.
Train-dependent relief of transmitter action
Experiments used both GABA and NE. Previous results have demonstrated that GABA evokes VD inhibition more strongly than does NE (Diversé-Pierluissi and Dunlap, 1993), and the present results confirm this. Of nine cells tested with 100 μmGABA, all showed VD inhibition (averaging 44.8 ± 5.3% of a total 67% inhibition). Likewise, eight of the nine demonstrated robust relief of inhibition (or facilitation) during a stimulus train; responses varied between 16 and 37% in the eight cells, with an average 21.4% relief of inhibition produced by 15 APWs (Fig.10).
Fig. 10.

AP train-dependent facilitation of GABA-inhibited Ca2+ currents. A, Current traces evoked by trains of 15 APWs (73 Hz) with an interspike potential of −140 mV; shown superimposed are currents (averaged individual traces from eight cells) evoked by the 1st (thin line) and 15th (thick line) APWs delivered before (left) or during (right) application of 100 μmGABA. B, Relative peak amplitudes of currents (normalized to first current peak) as a function of position in APW train. ○, Control current; •, modulated current. Data are means ± SEs for measurements on eight cells.
The facilitation of modulated current during trains of APWs likely reflects a partial reversal of transmitter- or G-protein-mediated VD inhibition. To ensure that the facilitation was not a product simply of smaller amplitude Ca2+ currents flowing through modulated channels, Cd2+ (3 μm) was used to reduced the currents to a level similar to that produced by GABA), and the same train of APWs was applied. Cd2+, at 3 μm, inhibited currents by 58%, and during a train, the currents inactivated at rates indistinguishable from control currents, with no train-dependent facilitation (data not shown). This supports the conclusion that the facilitation of modulated currents during stimulus trains reflects the relief of transmitter-induced VD inhibition.
This conclusion was further tested using NE, which, unlike GABA, produces a wide range of inhibition with a variable ratio of VD and VI components (Diversé-Pierluissi and Dunlap, 1993;Luebke and Dunlap, 1994). A mean 23 ± 10% VD inhibition was evoked by 100 μm NE in 7 of 13 cells, whereas the remainder showed VI inhibition only. Train-dependent relief of inhibition was moderate (mean, 9.7 ± 6.2%) and confined only to cells in which NE evoked a VD component of inhibition (Fig.11). These results demonstrate that facilitation of modulated Ca2+ current during the AP train results from a reversal of VD inhibition rather than from an effect on closed-state inactivation. Consistent with this, we found a tight correlation between the magnitude of VD inhibition produced by the transmitters and the amount of facilitation evoked during action potential trains (Fig. 12).
Fig. 11.

Train-dependent facilitation of NE-inhibited Ca2+ currents. Currents evoked by trains of 15 APWs (73 Hz; interspike potential, −120 mV) were normalized to peak of first current in train and plotted as a function of position in an APW train before (CON) or during (NE) application of 100 μm NE. A, Data from a cell with 33% VD inhibition. B, Data from a cell with 4% VD inhibition.
Fig. 12.

Train-dependent facilitation requires VD modulation. The facilitation of currents evoked by a train of 15 APWs (73 Hz; interspike potential, −120 or −140 mV) plotted as a function of the magnitude of VD inhibition produced by 100 μm NE (•) or GABA (▪). The percentage of facilitation was calculated by % facilitation = 100 − [(p15/p1) · 100], where p15 andp1 are the peak amplitudes of currents evoked by the 1st and 15th APWs, respectively. The percentage of VD inhibition was calculated as % VD inh = [(1 −I3/I1) − (1 −I4/I2)] · 100, where I1,I2,I3, and I4are peak currents evoked by single APWs in control, control + prepulse, GABA, and GABA + prepulse, respectively. The linerepresents linear regression fit; correlation coefficient, 0.95.
Frequency-dependent relief of transmitter action
Because facilitation subsides with time after prepulses (Fig.4C), train-dependent relief of inhibition should be less effective with lower-frequency trains. This is the case (Fig.13). Trains of 15 stimuli delivered at 45 Hz (20 msec interval) were only half as effective at relieving GABA-induced inhibition as were trains delivered at 143 Hz (5 msec interval).
Fig. 13.

Frequency-dependent relief of GABA-mediated inhibition. Maximum inhibition produced by 100 μm GABA plotted as a function of the number of prepulses (80 mV, 2 msec) delivered at two different frequencies (as marked). Data points represent means ± SDs of measurements from four to six cells.
DISCUSSION
We have studied the transmitter-mediated modulation of N-type Ca2+ currents evoked by action potential waveforms and demonstrate that the extent and time course of inhibition produced by GABA and NE depend on both the shape of the action potential and the frequency of firing.
Changes in action potential waveform, such as those seen in our studies, are known to occur under a variety of physiological conditions. Developmental changes in duration can be particularly dramatic; in frog embryos, for example, the duration of Ca2+-dependent action potentials in spinal neurons decreases from >1 sec to 1–2 msec over the course of several hours (Spitzer, 1984). In mammalian and avian DRG neurons, action potential waveforms also vary during development (Spitzer, 1984), are altered by growth factors (Chalazonitis et al., 1987), and differ among groups of sensory afferents responding to different stimulus modalities (Koerber et al., 1995). Acutely, many transmitters are known to reduce action potential duration through inhibition of Ca2+channel and/or enhancement of K+ channel activity (Gage, 1992; Dolphin, 1995), and during trains of stimuli, action potential duration commonly increases twofold or more, often caused by a frequency-dependent inactivation of K+ channels (Aldrich et al., 1979; Jackson et al., 1991; Ma and Koester, 1996). Thus, changes in action potential waveform are ubiquitous and physiologically significant.
Increasing action potential duration generally results in an overall increase in Ca2+ influx, but if the change in duration is large enough, the rate of Ca2+ entry is slowed and peak influx is reduced, as confirmed by the data in Figure7. Such alterations in the profile of Ca2+ influx have significant physiological consequences. Both the rate and the absolute amplitude of Ca2+ influx play a role in determining the magnitude of Ca2+-dependent responses in nerve cell bodies (such as enzyme activation or gene transcription) or in nerve terminals (such as exocytosis) (Spencer et al., 1989; Ghosh et al., 1994; Hsu et al., 1996; Dolmetsch et al., 1997; Fields et al., 1997; De Konninck and Schulman, 1998). In chick DRG neurons, the rate of Ca2+ entry varies exponentially with action potential duration (dropping ∼e-fold with each msec increase in duration, Fig. 7C). Similar reductions in the rate of change in intracellular Ca2+ at the squid giant synapse (keeping the maximum amplitude constant) produces an approximate threefold decrease in transmitter release (Hsu et al., 1996). Simultaneous reductions in amplitude would further magnify effects of changing action potential duration, because exocytosis (and many other Ca2+-dependent physiological processes) varies as a power function of Ca2+ concentration.
Frequency-dependent changes in APW and associated Ca2+ influx are further sculpted by transmitters and G-proteins. GABA reduces peak Ca2+ current in chick DRG neurons by an average of 60% for 0.65 msec APWs, and as action potential duration increases, GABA-induced inhibition drops exponentially, with a time constant of 13 msec. In addition, for any given duration action potential, GABA reduces the rate of Ca2+ influx by twofold to threefold compared with controls. This combination of GABA effects would greatly reduce the overall rise in intracellular Ca2+ and substantially inhibit Ca2+-dependent effector responses. Indeed, GABA is perhaps the most ubiquitous inhibitory transmitter in the nervous system, and G-protein-coupled GABAB receptors are potent presynaptic regulators of exocytotic Ca2+channels and transmitter release (Davies, 1981; Dittman and Regehr, 1996, Takahashi et al., 1998). The fact that all of the same inhibitory machinery is present in neuronal somata strongly implies that Ca2+-dependent processes in addition to exocytosis undergo similar regulation by GABAB and other G-protein-coupled receptors.
Our data show that, under normal physiological conditions, the combined effects of modulatory transmitters such as GABA and NE can vary widely, depending on the excitability of the cell, the exact shape and amplitude of the APW, the presence or absence of tonic AP activity, and the properties of the effector response under study. In cases in which Ca2+ current density is high enough to influence action potential shape (in neuronal somata), the net effect of transmitter on Ca2+ entry can be difficult to predict. Reductions in the rate and amplitude of Ca2+ entry by transmitters and G-proteins, for example, might be partially offset if the transmitter reduces action potential duration (Dunlap and Fischbach, 1978), because shorter-duration action potentials evoke larger and faster Ca2+ currents (Fig. 7). Furthermore, as shown here and elsewhere (Womack and McClesky, 1995; Brody et al., 1997; Williams et al., 1997), frequency-dependent relief of transmitter and G-protein inhibition of Ca2+ channels offers an additional mechanism by which the rate of change of intracellular Ca2+ can be controlled.
Not all studies of G-protein-mediated Ca2+ channel inhibition have demonstrated frequency-dependent changes in modulation (Toth and Miller, 1995). Although the reasons for this are not entirely clear, experimental variability would be anticipated. Our results demonstrate that Ca2+ influx is a complex function of many, interacting parameters, which will undoubtedly vary among preparations. Variations in the complement of ion channels are common, leading to differences in action potential shape and frequency-dependent effects on APW. In addition, different Ca2+ channel types exhibit a variety of biophysical properties (e.g., voltage-dependent gating and inactivation) and respond differentially to both changes in voltage and G-protein activation (Dolphin, 1995; Tsien et al., 1995; Jones and Elmslie, 1997). Finally, the issue of temperature must be considered, as both the gating and modulation of Ca2+ channels are steep functions of temperature (McAllister-Williams and Kelly, 1995a,b;Sabatini and Regehr, 1996). Thus, the precise conditions necessary to bring about frequency-dependent facilitation in one preparation might lead to depression of Ca2+ influx in another preparation expressing different Ca2+channels, modulatory pathways, or effector molecules.
Even in the absence of a changing molecular environment, the modulation of synaptic transmission at individual synapses can show a complex response to changes in firing frequency and/or G-protein activation. The synapse between auditory nerve fibers and cells in the nucleus magnocellularis in the chick is a good example of such a synapse. High-frequency firing rates at which these neurons normally function promote rapid synaptic depression (Trussell et al., 1993). By presynaptically inhibiting transmitter release, GABA slows the rate of synaptic depression, paradoxically prolonging transmission and extending the dynamic range over which the synapse functions (Brenowitz et al., 1998). Thus, GABA inhibits low-frequency transmission and facilitates high-frequency transmission at this synapse.
Taken together, the interactions between the biophysical and biochemical mechanisms regulating Ca2+ channels offer sufficient complexity to precisely tailor Ca2+influx in a changing physiological environment. Future experiments must explore the consequences of such modulation for enzyme activation, gene transcription, membrane excitability, exocytosis, and other cellular responses that are sensitive to changes in intracellular Ca2+.
Footnotes
This work was supported by NS16483, a Jacob Javits Award from the National Institute of Neurological Disorders and Stroke. We thank Michael Goy for critical comments on this manuscript.
Correspondence should be addressed to Kathleen Dunlap, Department of Physiology, Tufts University School of Medicine, 136 Harrison Avenue, Boston, MA 02111.
REFERENCES
- 1.Aldrich RW, Getting PA, Thompson SH. Mechanism of frequency-dependent broadening of molluscan neurone soma spikes. J Physiol (Lond) 1979;291:531–544. doi: 10.1113/jphysiol.1979.sp012829. [DOI] [PMC free article] [PubMed] [Google Scholar]
- 2.Aosaki T, Kasai H. Characterization of two kinds of high-voltage-activated Ca-channel currents in chick sensory neurons. Pflügers Arch. 1989;414:150–156. doi: 10.1007/BF00580957. [DOI] [PubMed] [Google Scholar]
- 3.Bean BP. Neurotransmitter inhibition of neuronal calcium currents by changes in channel voltage dependence. Nature. 1989;340:153–156. doi: 10.1038/340153a0. [DOI] [PubMed] [Google Scholar]
- 4.Brenowitz S, David J, Trussell L. Enhancement of synaptic efficacy by presynaptic GABAB receptors. Neuron. 1998;20:135–141. doi: 10.1016/s0896-6273(00)80441-9. [DOI] [PubMed] [Google Scholar]
- 5.Brody DL, Patil PG, Mulle JG, Snutch TP, Yue DT. Bursts of action potential waveforms relieve G-protein inhibition of recombinant P/Q-type Ca2+ in HEK 293 cells. J Physiol (Lond) 1997;499:637–644. doi: 10.1113/jphysiol.1997.sp021956. [DOI] [PMC free article] [PubMed] [Google Scholar]
- 6.Carbone E, Lux HD. A low voltage-activated, fully inactivating Ca channel in vertebrate sensory neurons. Nature. 1984;310:501–502. doi: 10.1038/310501a0. [DOI] [PubMed] [Google Scholar]
- 7.Chalazonitis A, Peterson ER, Crain SM. Nerve growth factor regulates the action potential duration of mature sensory neurons. Proc Natl Acad Sci USA. 1987;84:289–293. doi: 10.1073/pnas.84.1.289. [DOI] [PMC free article] [PubMed] [Google Scholar]
- 8.Cox DH, Dunlap K. Pharmacological discrimination of N-type from L-type calcium current and its selective modulation by transmitters. J Neurosci. 1992;12:906–914. doi: 10.1523/JNEUROSCI.12-03-00906.1992. [DOI] [PMC free article] [PubMed] [Google Scholar]
- 9.Davies J. Selective depression of synaptic excitation in cat spinal neurones by baclofen: an iontophoretic study. Br J Pharmacol. 1981;72:373–384. doi: 10.1111/j.1476-5381.1981.tb09137.x. [DOI] [PMC free article] [PubMed] [Google Scholar]
- 10.De Konninck P, Schulman H. Sensitivity of CaM Kinase II to the frequency of Ca2+ oscillations. Science. 1998;279:227–230. doi: 10.1126/science.279.5348.227. [DOI] [PubMed] [Google Scholar]
- 11.Dittman JS, Regehr WG. Contributions of calcium-dependent and calcium-independent mechanisms to presynaptic inhibition at a cerebellar synapse. J Neurosci. 1996;16:1623–1633. doi: 10.1523/JNEUROSCI.16-05-01623.1996. [DOI] [PMC free article] [PubMed] [Google Scholar]
- 12.Diversé-Pierluissi M, Dunlap K. Distinct, convergent second messenger systems modulate neuronal calcium currents. Neuron. 1993;10:753–760. doi: 10.1016/0896-6273(93)90175-q. [DOI] [PubMed] [Google Scholar]
- 13.Diversé-Pierluissi M, Goldsmith PK, Dunlap K. Transmitter-mediated inhibition of N-type calcium channels in sensory neurons involves multiple GTP-binding proteins and subunits. Neuron. 1995;14:191–200. doi: 10.1016/0896-6273(95)90254-6. [DOI] [PubMed] [Google Scholar]
- 14.Diversé-Pierluissi M, Remmers AE, Neubig RR, Dunlap K. Novel form of crosstalk between G-protein and tyrosine kinase pathways. Proc Natl Acad Sci USA. 1997;94:5417–5421. doi: 10.1073/pnas.94.10.5417. [DOI] [PMC free article] [PubMed] [Google Scholar]
- 15.Dolmetsch RE, Lewis RS, Goodnow CC, Healy JI. Differential activation of transcription factors induced by Ca2+ response amplitude and duration. Nature. 1997;386:855–858. doi: 10.1038/386855a0. [DOI] [PubMed] [Google Scholar]
- 16.Dolphin AC. Voltage-dependent calcium channels and their modulation by neurotransmitters and G-proteins. Exp Physiol. 1995;80:1–36. doi: 10.1113/expphysiol.1995.sp003825. [DOI] [PubMed] [Google Scholar]
- 17.Dunlap K, Fischbach GD. Neurotransmitters decrease the calcium component of sensory neurone action potentials. Nature. 1978;276:837–839. doi: 10.1038/276837a0. [DOI] [PubMed] [Google Scholar]
- 18.Dunlap K, Ikeda SR. Receptor-mediated pathways that modulate calcium channels. Semin Neurosci. 1998;9:198–208. [Google Scholar]
- 19.Elmslie KS, Zhou W, Jones SW. LHRH and GTPγS modify calcium current activation in bullfrog sympathetic neurons. Neuron. 1990;5:75–80. doi: 10.1016/0896-6273(90)90035-e. [DOI] [PubMed] [Google Scholar]
- 20.Fields RD, Eshete F, Stevens B, Itoh K. Action potential-dependent regulation of gene expression: temporal specificity in Ca2+, cAMP-responsive element binding proteins, and mitogen-activated protein kinase signaling. J Neurosci. 1997;17:7252–7266. doi: 10.1523/JNEUROSCI.17-19-07252.1997. [DOI] [PMC free article] [PubMed] [Google Scholar]
- 21.Fitzgerald M. Cutaneous primary afferent properties in the hind limb of the neonatal rat. J Physiol (Lond) 1987;383:79–92. doi: 10.1113/jphysiol.1987.sp016397. [DOI] [PMC free article] [PubMed] [Google Scholar]
- 22.Fox AP, Nowycky MC, Tsien RW. Kinetic and pharmacological properties distinguishing three types of calcium currents in chick sensory neurones. J Physiol (Lond) 1987;394:140–172. doi: 10.1113/jphysiol.1987.sp016864. [DOI] [PMC free article] [PubMed] [Google Scholar]
- 23.Gage PW. Activation and modulation of neuronal K+ channels by GABA. Trends Neurosci. 1992;15:46–51. doi: 10.1016/0166-2236(92)90025-4. [DOI] [PubMed] [Google Scholar]
- 24.Gao T, Puri TS, Gerhardstein BL, Chien AJ, Green RD, Hosey MM. Identification and subcellular localization of the subunits of L-type calcium channels and adenylyl cyclase in cardiac myocytes. J Biol Chem. 1997;272:19401–19407. doi: 10.1074/jbc.272.31.19401. [DOI] [PubMed] [Google Scholar]
- 25.Ghosh A, Ginty DD, Bading H, Greenberg ME. Calcium regulation of gene expression in neuronal cells. J Neurobiol. 1994;25:294–303. doi: 10.1002/neu.480250309. [DOI] [PubMed] [Google Scholar]
- 26.Grassi F, Lux HD. Voltage-dependent GABA-induced modulation of calcium currents in chick sensory neurons. Neurosci Lett. 1989;105:113–119. doi: 10.1016/0304-3940(89)90021-9. [DOI] [PubMed] [Google Scholar]
- 27.Gu X, Spitzer NC. Distinct aspects of neuronal differentiation encoded by frequency of spontaneous Ca2+ transients. Nature. 1995;375:784–787. doi: 10.1038/375784a0. [DOI] [PubMed] [Google Scholar]
- 28.Hamill OP, Marty A, Neher E, Sakmann B, Sigworth FJ. Improved patch-clamp techniques for high resolution current recording from cells and cell-free membrane patches. Pflügers Arch. 1981;391:85–100. doi: 10.1007/BF00656997. [DOI] [PubMed] [Google Scholar]
- 29.Haydon PG, Henderson E, Stanley EF. Localization of individual calcium channels at the release face of a presynaptic nerve terminal. Neuron. 1994;13:1275–1280. doi: 10.1016/0896-6273(94)90414-6. [DOI] [PubMed] [Google Scholar]
- 30.Hsu SF, Augustine GJ, Jackson MB. Adaptation of Ca2+ triggered exocytosis in presynaptic terminals. Neuron. 1996;17:501–512. doi: 10.1016/s0896-6273(00)80182-8. [DOI] [PubMed] [Google Scholar]
- 31.Ikeda SR, Dunlap K (1998) Voltage-dependent modulation of N-type calcium channels: role of G-protein subunits. Adv Second Messenger Phosphoprotein Res, in press. [DOI] [PubMed]
- 32.Jackson MB, Konnerth A, Augustine GJ. Action potential broadening and frequency-dependent facilitation of calcium signals in pituitary nerve terminals. Proc Natl Acad Sci USA. 1991;88:380–384. doi: 10.1073/pnas.88.2.380. [DOI] [PMC free article] [PubMed] [Google Scholar]
- 33.Jones LP, Patil PG, Snutch TP, Yue DT. G-protein modulation of N-type calcium channel gating current in human embryonic kidney cells (HEK 293). J Physiol (Lond) 1997;498:601–610. doi: 10.1113/jphysiol.1997.sp021886. [DOI] [PMC free article] [PubMed] [Google Scholar]
- 34.Jones SW, Elmslie KS. Transmitter modulation of neuronal calcium channels. J Membr Biol. 1997;155:1–10. doi: 10.1007/s002329900153. [DOI] [PubMed] [Google Scholar]
- 35.Jorgensen AO, Shen AC, Arnold W, Leung AT, Campbell KP. Subcellular distribution of the 1,4-dihydropyridine receptor in rabbit skeletal muscle in situ: an immunofluorescence and immunocolloidal gold-labeling study. J Cell Biol. 1989;109:135–147. doi: 10.1083/jcb.109.1.135. [DOI] [PMC free article] [PubMed] [Google Scholar]
- 36.Koerber HR, Mimics K, Mendell LM. Properties of regenerated primary afferents and their functional connections. J Neurophysiol. 1995;73:693–702. doi: 10.1152/jn.1995.73.2.693. [DOI] [PubMed] [Google Scholar]
- 37.Llinas R, Sugimori M, Simon SM. Transmission by presynaptic spike-like depolarization in the squid giant synapse. Proc Natl Acad Sci USA. 1982;79:2415–2419. doi: 10.1073/pnas.79.7.2415. [DOI] [PMC free article] [PubMed] [Google Scholar]
- 38.Luebke JI, Dunlap K. Sensory neuron N-type calcium currents are inhibited by both voltage-dependent and -independent mechanisms. Pflügers Arch. 1994;428:499–507. doi: 10.1007/BF00374571. [DOI] [PubMed] [Google Scholar]
- 39.Ma M, Koester J. The role of K+ currents in frequency-dependent spike broadening in Aplysia R20 neurons: a dynamic-clamp analysis. J Neurosci. 1996;16:4089–4101. doi: 10.1523/JNEUROSCI.16-13-04089.1996. [DOI] [PMC free article] [PubMed] [Google Scholar]
- 40.McAllister-Williams RH, Kelly JS. The temperature dependence of high threshold calcium channel currents recorded from adult raphe neurones. Neuropharmacology. 1995a;34:1479–1490. doi: 10.1016/0028-3908(95)00130-x. [DOI] [PubMed] [Google Scholar]
- 41.McAllister-Williams RH, Kelly JS. The modulation of calcium currents recorded from adult rat dorsal raphe neurones by 5HT1A receptor or direct G-protein activation. Neuropharmacology. 1995b;34:1491–506. doi: 10.1016/0028-3908(95)00131-o. [DOI] [PubMed] [Google Scholar]
- 42.McCobb DP, Beam KC. Action potential waveform voltage-clamp commands reveal striking differences in calcium entry via low and high voltage-activated calcium channels. Neuron. 1991;7:119–127. doi: 10.1016/0896-6273(91)90080-j. [DOI] [PubMed] [Google Scholar]
- 43.Mintz IM, Adams ME, Bean BP. P-type calcium channels in rat central and peripheral neurons. Neuron. 1992;9:85–95. doi: 10.1016/0896-6273(92)90223-z. [DOI] [PubMed] [Google Scholar]
- 44.Narahashi T, Tsunoo A, Yoshi M. Characterization of two types of calcium channels in mouse neuroblastoma cells. J Physiol (Lond) 1987;383:231–249. doi: 10.1113/jphysiol.1987.sp016406. [DOI] [PMC free article] [PubMed] [Google Scholar]
- 45.Patil PG, Brody DL, Yue DT. Preferential closed-state inactivation of neuronal calcium channels. Neuron. 1998;20:1027–1038. doi: 10.1016/s0896-6273(00)80483-3. [DOI] [PubMed] [Google Scholar]
- 46.Robitaille R, Adler EM, Charlton MP. Strategic location of calcium channels at transmitter release sites of frog neuromuscular synapses. Neuron. 1990;5:773–779. doi: 10.1016/0896-6273(90)90336-e. [DOI] [PubMed] [Google Scholar]
- 47.Sabatini BL, Regehr WG. Timing of neurotransmission at fast synapses in the mammalian brain. Nature. 1996;384:170–172. doi: 10.1038/384170a0. [DOI] [PubMed] [Google Scholar]
- 48.Spencer AN, Przysiezniak J, Acosta-Urquidi J, Basarsky TA. Presynaptic spike broadening reduces junctional potential amplitude. Nature. 1989;340:636–638. doi: 10.1038/340636a0. [DOI] [PubMed] [Google Scholar]
- 49.Spitzer N. Development of voltage-dependent and ligand-gated channels in excitable membranes. Prog Brain Res. 1984;102:169–179. doi: 10.1016/S0079-6123(08)60538-5. [DOI] [PubMed] [Google Scholar]
- 50.Takahasi T, Kajikawa Y, Tsujimoto T. G-protein-coupled modulation of presynaptic calcium currents and transmitter release by a GABAB receptor. J Neurosci. 1998;18:3138–3146. doi: 10.1523/JNEUROSCI.18-09-03138.1998. [DOI] [PMC free article] [PubMed] [Google Scholar]
- 51.Toth PT, Miller RJ. Calcium and sodium currents evoked by action potential waveforms in rat sympathetic neurones. J Physiol (Lond) 1995;485:43–57. doi: 10.1113/jphysiol.1995.sp020711. [DOI] [PMC free article] [PubMed] [Google Scholar]
- 52.Triggle DJ, Janis RA. Calcium channel ligands. Annu Rev Pharmacol Toxicol. 1987;27:347–369. doi: 10.1146/annurev.pa.27.040187.002023. [DOI] [PubMed] [Google Scholar]
- 53.Trussell LO, Zhang S, Raman IM. Desensitization of AMPA receptors upon multiquantal neurotransmitter release. Neuron. 1993;10:1185–1196. doi: 10.1016/0896-6273(93)90066-z. [DOI] [PubMed] [Google Scholar]
- 54.Tsien RW, Lipscombe D, Madison D, Bley K, Fox A. Reflections on Ca2+-channel diversity, 1988–1994. Trends Neurosci. 1995;18:52–54. [PubMed] [Google Scholar]
- 55.Williams S, Serafin M, Muhlethaler M, Bernheim L. Facilitation of N-type calcium current is dependent on the frequency of action potential-like depolarization in dissociated cholinergic basal forebrain neurons of the guinea pig. J Neurosci. 1997;17:1625–1632. doi: 10.1523/JNEUROSCI.17-05-01625.1997. [DOI] [PMC free article] [PubMed] [Google Scholar]
- 56.Womack MD, McClesky EW. Interaction of opioids and membrane potential to modulate Ca2+ channels in rat dorsal root ganglion neurons. J Neurophysiol. 1995;73:1793–1798. doi: 10.1152/jn.1995.73.5.1793. [DOI] [PubMed] [Google Scholar]