Abstract
One must be prudent when selecting potential saccadic targets because the eyes can only move to one location at a time, yet movements must occur quickly enough to permit interaction with a rapidly changing world. This process of efficiently acquiring relevant targets may be aided by advanced planning of a movement toward an upcoming target whose location is gathered via environmental cues or situational experience. We studied how saccadic reaction times (SRTs) and early pretarget neuronal activity covaried as a function of saccadic probability. Monkeys performed a saccadic task in which the probability of the required saccade being directed into the response field of a neuron varied systematically between blocks of trials. We recorded simultaneously the early pretarget activity of saccade-related neurons in the intermediate layers of the superior colliculus. We found that, as the likelihood of the saccade being generated into the response field of the neuron increased, the level of neuronal activity preceding target presentation also increased. Our data suggest that this early activity codes motor preparation because its activity was related to not only the metrics but also the timing of the saccade, with 94% (29/31) of the neurons tested having significant negative correlations between discharge rate and SRT. This view is supported by cases in which exceptionally high levels of pretarget activity were associated with anticipatory saccades into the response field of a neuron that occurred in advance of the target being presented. This study demonstrates how situational experience can expedite motor behavior via the advanced preparation of motor programs.
Keywords: saccade, oculomotor, reaction times, superior colliculus, monkey, motor preparation, gap paradigm, express saccades, target probability, motor learning
Saccades are rapid eye movements that are used to move the high acuity fovea in a serial manner around the visual field. To optimize the extraction of detailed visual information, it is necessary to tailor this motor output to the context of the task (Yarbus, 1967). For example, saccadic reaction times (SRTs) are reduced when the predictability of the upcoming target location increases (Hackman, 1940; Bartz, 1962; Megaw and Armstrong, 1973;Carpenter and Williams, 1995; Paré and Munoz, 1996). Here we describe how the time to the initiation of saccadic eye movements is reduced when previous task experience results in an increase in neural motor preparation signals in advance of the presentation of the saccadic target.
Requin and colleagues (Requin et al., 1991; Riehle and Requin, 1993) have detailed three operational criteria for labeling changes in neuronal discharge as motor preparation. First, the timing of the changes in neuronal discharge must occur during a delay or warning period just before the motor act. Second, the level of neuronal discharge must be modified in a manner that follows the likelihood of a movement being directed into the response field of a neuron. Third, and most importantly, these modulations in discharge rate must predict some attribute of motor performance, which is in our case the SRT.
The superior colliculus (SC) is a neural structure that is involved in the generation of saccadic eye movements (for review, see Sparks and Hartwich-Young, 1989). A subset of saccade-related neurons in the intermediate layers of the SC have early, low-frequency activity in advance of eye movements (Mohler and Wurtz, 1976; Sparks, 1978; Munoz and Guitton, 1991; Glimcher and Sparks, 1992; Munoz and Wurtz, 1995). It has been suggested that this early activity may code attentional shifts (Kustov and Robinson, 1996) and may be involved in the selection of a saccadic movement or target from a number of possible stimuli in a visual array, i.e., related to upcoming saccadic metrics (direction and amplitude) (Glimcher and Sparks, 1992, 1993; Basso and Wurtz, 1997). In a separate study, it was shown that this early activity is correlated inversely with SRT, i.e., related to saccadic timing (Dorris et al., 1997). Although the early activity of these neurons is influenced individually by the factors suggested by these previous studies, all these factors may be incorporated for use in the advanced preparation of movements. The main objective of this study is to determine whether this early, low-frequency activity is consistent with a “motor preparation” signal, a term that encompasses both the timing and metrics of saccadic programming, by fulfilling the three operational criteria outlined above (Requin et al., 1991; Riehle and Requin, 1993).
In this study, we look at how simply varying the probability of the saccade being directed into the response field of a neuron during a block of trials (100, 50, and 0%) influences the relationship between early, pretarget activity of collicular saccade-related neurons and subsequent SRTs. A major advantage our paradigm has when compared with previous studies is that we systematically measure an overt, quantifiable attribute of behavior (i.e., SRT) that may show a relationship with saccadic probability and neuronal discharge. This experiment determines how neuronal signals related to motor preparation can be shaped by contextual factors in a manner that results in an efficiency of behavior.
MATERIALS AND METHODS
Animal preparation. We recorded the extracellular activity of single neurons in the intermediate layers of the SC of two male rhesus monkeys (Macaca mulatta) weighing between 7–9.5 kg each. All procedures were approved by the Queen’s University Animal Care Committee and complied with the guidelines of the Canadian Council on Animal Care. Animals were under the close supervision of the university veterinarian.
The surgical and experimental procedures were described previously (Paré and Munoz, 1996; Dorris et al., 1997). Each monkey underwent a single aseptic surgical session to prepare it for chronic recording of eye position and single neurons. Eye coils were implanted subconjunctivally (Judge et al., 1980) to measure eye position with the magnetic search coil technique. Based on stereotaxic coordinates, two craniotomies were made to allow access to both SCs with microelectrodes. Stainless-steel recording cylinders were positioned over the craniotomies; one centered on the midline and tilted 38° posterior of vertical allowed access to both SCs, and the other centered on the interaural axis and tilted 25° lateral of vertical allowed access to the left SC.
Experimental procedures. Monkeys were seated in a primate chair with their heads firmly attached to the chair for the duration of the experiments via a head holder embedded in the explant. The monkeys faced a tangent screen 86 cm away that spanned ±35° of the central visual field. Behavioral paradigms, visual displays, and storage of both neuronal discharge and eye movement data were under the control of a 486 personal computer running a real-time data acquisition system (REX) (Hays et al., 1982). REX controlled the presentation of the targets through digital-to-analog converters that moved two mirror galvanometers (General Scanning) in orthogonal planes. These mirrors reflected a light-emitting diode (0.3 cd/m2) on the translucent screen in front of the monkey. Horizontal and vertical eye and mirror positions were digitized at 500 Hz. All data analyses were performed off-line.
Single-neuron activity was recorded with tungsten microelectrodes (1–2 MΩ at 1 kHz; Frederick Haer) that were lowered through 23 gauge stainless-steel guide tubes by a hydraulic microdrive (Narishige, Tokyo, Japan) attached to the recording chambers. The guide tubes were held firmly within a delrin grid inside the recording chambers (Crist et al., 1988). Single-neuron discharges were sampled at 1 kHz after passing through a window discriminator (Bak Electronics) that excluded action potentials that did not meet amplitude and time constraints.
Behavioral paradigms. The monkeys were trained to perform the gap paradigm as described previously (Dorris et al., 1997). Each trial was preceded by a 1000 msec intertrial interval during which the screen was illuminated with diffuse white light (1.0 cd/m2) to prevent dark adaptation. The onset of a trial was signaled by the removal of this background light and, after a period of 250 msec, by the appearance of the central fixation point (FP). The monkey had 1000 msec to look at the FP and was required to maintain fixation for 500–1000 msec. The FP was then extinguished, and there was a 200 msec period (gap) during which the animal had to maintain fixation in total darkness before an eccentric target was presented. After target presentation, the monkey had 500 msec to make a saccade to the target and then to maintain fixation for 300–500 msec before a liquid reward was given.
The gap paradigm was used because fixation-related activity in the SC is reduced during the gap period (Dorris and Munoz, 1995; Dorris et al., 1997). The reduction in fixation-related activity is correlated with reduced SRTs, known as the gap effect, and may lead to an increase of low-frequency activity of collicular saccade-related neurons via disinhibition of lateral inhibitory interactions within the SC (Munoz and Istvan, 1998).
Our goal was to determine how pretarget neuronal activity and SRT varied as the probability of the saccade being directed into the response field of a neuron changed. For each neuron studied, we ran blocks of the gap paradigm with three saccadic probability conditions. In the first block (50% condition), the target was presented with equal probability within the center of the response field of a neuron (ON direction) or opposite to the response field of the neuron at the same eccentricity but on the opposite side of the horizontal and vertical meridians (OFF direction). The optimal vectors for our sample of neurons ranged from 3 to 30° in eccentricity. In the second block (100% ON condition), the target was always presented in the ON direction. In the third block (100% OFF condition), the target was always presented in the OFF direction. With few exceptions, we ran blocks of trials in the following order: 100 trials of the 50% condition, 50 trials of the 100% ON condition, and 50 trials of the 100% OFF condition. A small number of neurons (n = 6) were included in our analysis in which all of the blocks were not completed or the blocks were run in a different sequence than that outlined above.
Data analysis. A Sun Sparc2 workstation was used to analyze the data. Computer software determined the beginning and end of each saccade using velocity and acceleration threshold and template-matching criteria (Waitzman et al., 1991). These events were verified by an experimenter to ensure accuracy. Those saccades that ended within the invisible computer-controlled window (usually 3° × 3°) surrounding the final saccadic target with SRTs between 70 and 300 msec were included in further analysis. More than 95% of all responses fulfilled these criteria. For a separate analysis, we divided saccades that landed within the computer window into three categories based on their reaction times. SRTs below 70 msec had an equal probability of being directed toward or opposite the target in the 50% target probability condition, which suggests that these saccades were not target driven. Therefore, those saccades that were initiated between 0 and 69 msec after target presentation and landed within the computer-controlled window (or in the mirror-image location for the 50% condition) were considered “anticipatory.” These trials were excluded from all analyses in which the discharge rate was quantified and were shown only qualitatively (i.e., see Figs. 5, 9, 10). Saccades that were initiated between 70 and 120 msec after target appearance were defined as “express saccades” (Fischer and Boch, 1983). Finally, those saccades initiated 130–180 msec after target appearance were defined as “regular saccades.” These divisions and nomenclature are consistent with those developed by Fischer and colleagues (for review, see Fischer and Weber, 1993) and with previous experiments conducted in our laboratory (Paré and Munoz, 1996; Dorris et al., 1997).
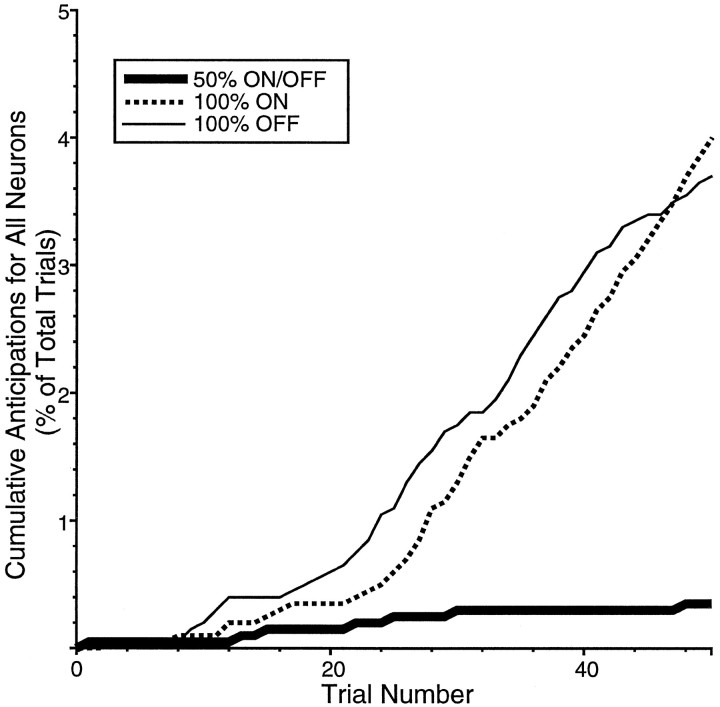
Fig. 5.
Cumulative distribution of anticipatory saccades during the saccadic probability blocks as a percentage of total trials. These saccades were elicited while recording from the population of neurons used in this study in which data for the 50 and 100% ON and the 100% OFF saccadic probability conditions were collected. Saccades were considered anticipations if they were directed toward the location of the eventual target (and also the mirror-image location for the 50% condition) and occurred 0–69 msec after target presentation.
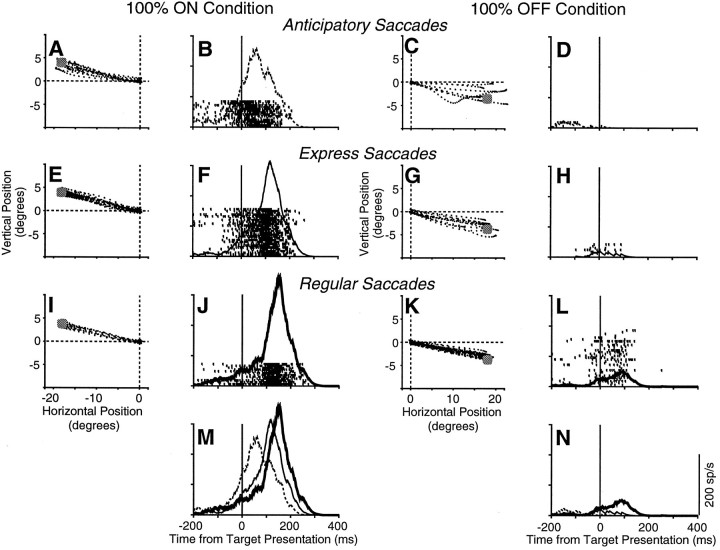
Fig. 9.
Saccadic metrics and the corresponding activity of a buildup neuron for three types of saccades (anticipatory, express, and regular) in the 100% ON and 100% OFF conditions.A–L, Eye position was sampled at 500 Hz and plotted from 20 msec before saccade initiation to 20 msec after saccade end. The gray circle represents target location. Rasters and spike density functions are aligned on target presentation (solid vertical line). M,N, The spike density functions accompanying the three types of saccades are superimposed.
Fig. 10.
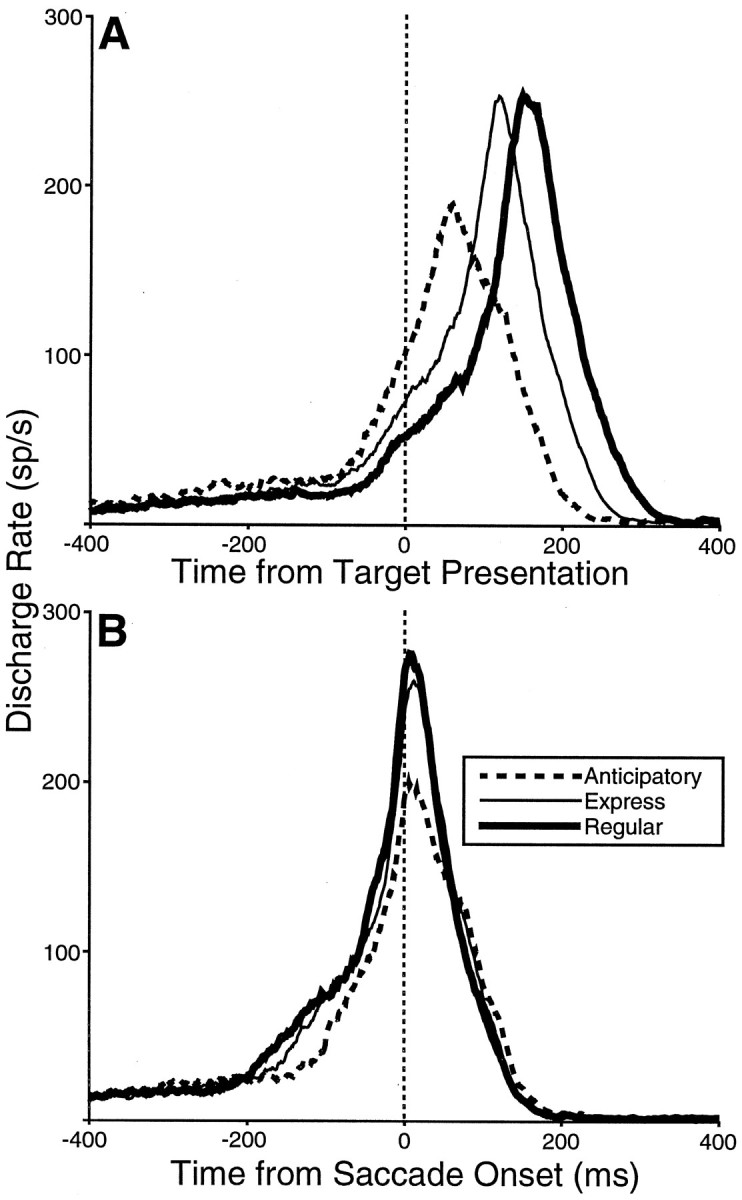
Comparison of the mean spike density functions of anticipatory, express, and regular saccades for the sample of 11 analyzed neurons aligned on target presentation (A) and saccade onset (B) during the 100% ON condition.
The discharge rate of neurons was calculated by convolving each spike train with a postsynaptic activation function with a rise time of 1 msec and a decay time of 20 msec (Hanes and Schall, 1996). For subsequent analysis, neuronal activity was taken as the mean value obtained from the postsynaptic activation function 50–60 msec after target appearance. None of the neurons recorded using the stimulus conditions in this study had target-aligned visual responses that occurred before 65 msec when tested with a Poisson spike train analysis technique (Hanes et al., 1995). Therefore, sampling during this interval yielded the activity of these neurons immediately before any change that could be induced by the appearance of the eccentric target. Our method of determining the neuronal discharge rate just before any influence by the visual stimulus is preferable to finding the instantaneous firing rate. Simply counting spikes in the 50–60 msec epoch on each trial would result in an artificially quantal discharge rate (i.e., 0, 100, and 200 spikes/sec) with each increment of 100 spikes/sec corresponding to an additional spike during this epoch. Using a larger epoch extending before the 50–60 msec epoch would give more weight to the discharge rate, at times preceding target presentation than is warranted.
Trial-by-trial correlations (Pearson’s r) between SRT and discharge rate were calculated for each neuron. From this, the proportion of neurons with statistically significant correlation coefficients (p < 0.01) was calculated for saccades in both the ON and OFF directions.
Neuron classification. The classification of neurons was performed with the data pooled from ON direction gap trials in both the 50 and 100% ON direction blocks of saccadic probability conditions. The optimal response field of a neuron (ON direction) was determined by systematically moving the visual target throughout the visual field until it produced the highest frequency saccadic discharge. We restricted our analysis to a subset of SC saccade-related neurons with early, low-frequency activity that increased during the gap period. We will refer to these neurons as buildup neurons because of the similarity between their discharge during the gap period and that of previously classified buildup neurons (Munoz and Wurtz, 1995; Dorris et al., 1997). However, it must be stressed that one of the defining characteristics of buildup neurons is the presence of open-ended movement fields (Munoz and Wurtz, 1995). The movement fields of the neurons in this study were not explicitly tested. Therefore, the cells reported here may include various classes of saccade-related neurons with early, low-frequency activity reported in previous studies, including buildup neurons (Munoz and Wurtz, 1995), prelude bursters (Glimcher and Sparks, 1992), and quasivisual cells (Mays and Sparks, 1980). To be classified as a buildup neuron for this study, a neuron had to display (1) early, pretarget activity (i.e., buildup activity) during the end of the gap period (50 msec before to 50 msec after target presentation) that was significantly greater than that during visual fixation (the 100 msec preceding FP disappearance) (paired t test, p < 0.01) and (2) saccade-related activity above 100 spikes/sec for saccades into the center of the response field of the neuron.
RESULTS
We recorded 52 neurons from the SC of two monkeys performing at least two saccadic probability conditions. Of these, 31 neurons fulfilled our criteria for classification as buildup neurons and also had sufficient data for detailed analysis.
Neuronal activity and saccadic probability
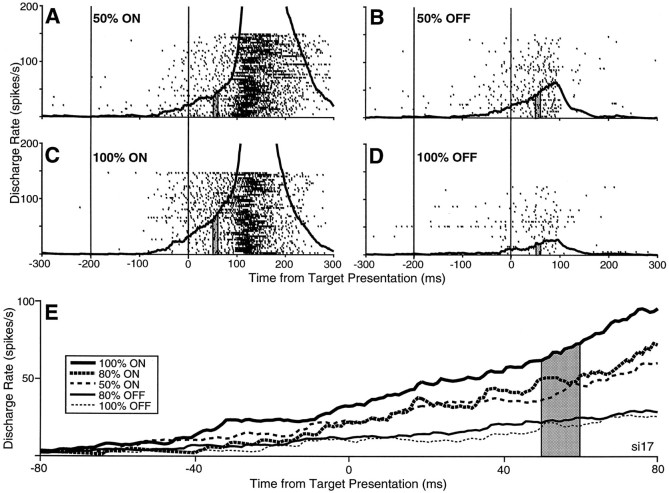
The buildup activity preceding target presentation was modulated by changes in the probability of saccades being directed into the response field of the neuron. The neuron in Figure1 exemplifies a typical buildup neuron in that the low-frequency activity of the neuron increased ∼100 msec into the gap period and the neuron then discharged a high-frequency burst of action potentials for ON direction saccades (Fig.1A,C) and ceased its activity for OFF direction saccades (Fig. 1B,D). The discharge rate at the end of the gap period (Fig.1A–D, right vertical lines) was highest when the saccade was directed in the ON direction (Fig.1C) during the 100% ON condition. The buildup activity was the least when the target was always presented in the OFF direction (Fig. 1D) during the 100% OFF condition, and the activity was intermediate when the saccade was directed with equal probability in the ON or OFF direction during the 50% condition (Fig.1A,B).
Fig. 1.
A–D, The activity of a buildup neuron (si17) during the 50% ON (A), 50% OFF (B), 100% ON (C), and 100% OFF (D) saccadic probability conditions. Only trials in which saccades are target driven are shown (i.e., initiated between 70 and 300 msec and falling within the computer-controlled window). The individual rasters of neuronal discharge and the spike density function are aligned on both fixation point disappearance (left vertical line of eachpanel) and target appearance (right vertical line of each panel). For each condition, the first trial in the block is at the bottomof the raster plot, and the last trial in the block is at thetop. The shaded region 50–60 msec after target appearance represents the epoch in which discharge was sampled for subsequent analysis. E, Spike density functions of the same neuron superimposed for five saccadic probability conditions: 100% ON, 80% ON, 50% ON, 80% OFF, and 100% OFF.
The changes in neuronal activity associated with varying the probability of saccades directed into the response field of the neuron can be seen more clearly in Figure 1E in which the spike density functions from five different blocks of saccade probabilities are superimposed. For this neuron, 100 trials of each of the additional saccadic probability conditions of 80% ON and 80% OFF directions were also collected. During the sampling epoch used in this study (50–60 msec after target presentation), the level of neuronal discharge of this neuron varied systematically with saccadic probability.
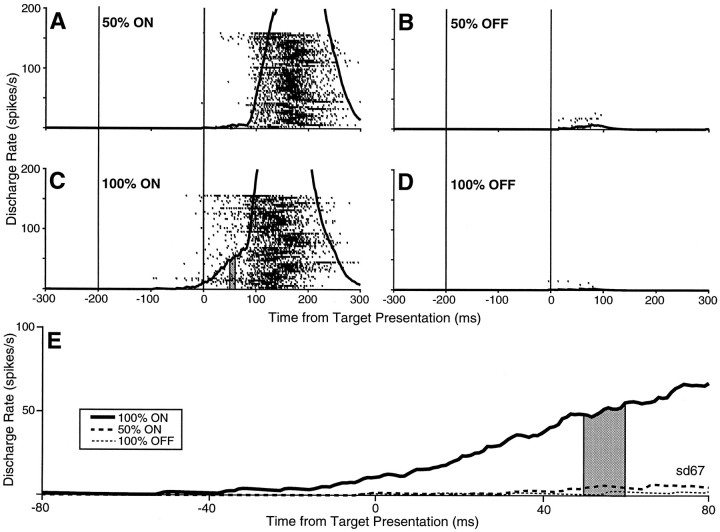
The neuron shown in Figure 2 also had its highest buildup discharge rate for the 100% ON condition (Fig.2C). However, this neuron had almost no buildup discharge for the 100% OFF condition (Fig. 2D) or for the ON and OFF directions of the 50% condition (Fig.2A,B). The waveforms are superimposed in Figure 2E. It was only when the required saccade was fully predictable in the response field of the neuron that the buildup activity of this neuron became notable.
Fig. 2.
A buildup neuron (sd67) with early, pretarget activity that occurs only when the required saccade was directed into the response field of the neuron was fully predictable (100% ON direction). The format is the same as that described in the Figure 1legend.
The data from the entire sample of buildup neurons is shown in Figure3 for each pertinent combination of saccadic probability conditions. Each point in the scatter plots represents the mean discharge rate calculated from the postsynaptic function 50–60 msec after target presentation from each neuron during the last 10 trials of a saccadic probability condition. Sampling at the end of a block of trials represents the period during which saccadic probability was presumably best realized. There are not the same number of neurons in each combination because not all saccadic probability conditions were obtained for each neuron. Consistent with the individual neuron data in Figures 1 and 2, the level of neuronal activity of the sample just before target presentation followed the probability of the required saccade being directed into the response field of the neurons. Neuronal activity was highest for the 100% ON condition, intermediate for the 50% ON and OFF conditions, and lowest for the 100% OFF condition (Fig. 3A–D). The mean discharge rate (±SEM) of the sample for each of the saccadic probability conditions in Figure 3A–D is shown in Figure 3E. There was a statistically significant difference in discharge rate (paired t test, p < 0.0001; 100% ON vs 50% ON, 100% OFF vs 50% OFF, and 100% ON vs 100% OFF) in all cases except when the two directions (ON and OFF) in the 50% condition were compared. This difference was largest between the 100% ON and 100% OFF conditions and intermediate between the 100% ON and 50% ON and the 100% OFF and 50% OFF conditions.
Fig. 3.
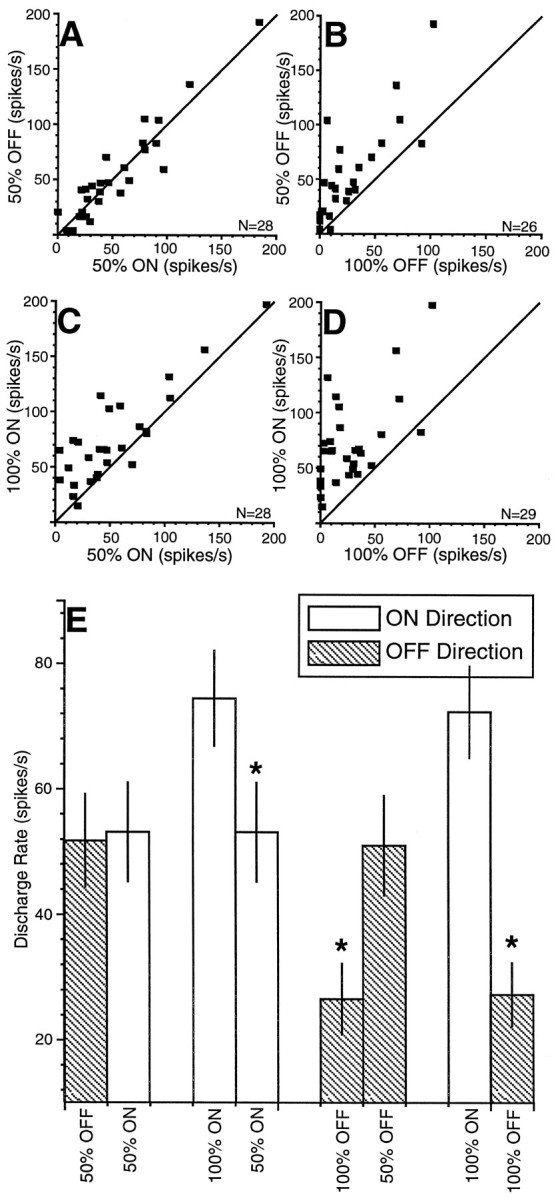
Comparison of discharge rates between different saccadic probability conditions. A–D, Eachpoint represents the mean of the discharge rate in the epoch from 50 to 60 msec after target presentation from the last 10 trials for a single neuron for the specified saccadic probability condition. The equality line (slope = 1) is shown in each scatter plot. E, The mean sample discharge rate (±SEM) for the sample of neurons in each saccadic probability condition is shown (paired t test, *p < 0.0001).
SRT and saccadic probability
In addition to the modulation of discharge rate by saccadic probability (Fig. 3), mean SRT was also similarly modulated (Fig.4). Again each point in the scatter plots (Fig. 4A–D) represents the mean SRT obtained simultaneously during recording of each neuron in the last 10 trials of a saccadic probability block of trials. SRTs were longest when the required saccade had an equal probability of being directed into the ON or OFF direction during the 50% condition and were shortest when the monkey could fully predict where the required saccade would be directed during the 100% ON and 100% OFF conditions. The differences in mean SRT for the sample of neurons were statistically significant (pairedt test, p < 0.0001) when the 50% ON and 100% ON conditions and the 50% OFF and 100% OFF conditions were compared (Fig. 4E). There was no difference in mean SRT (paired t test, p > 0.05) when the two directions (ON and OFF) in either the 50 or 100% conditions were compared.
Fig. 4.
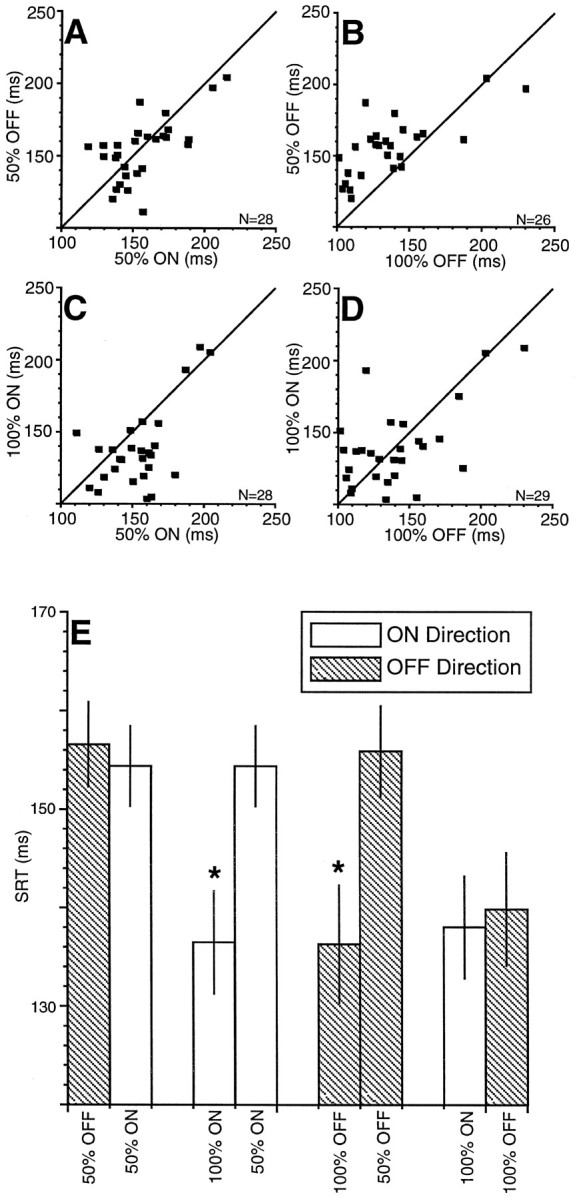
Comparison of SRTs between different saccadic probability conditions for the corresponding neurons and trials shown in Figure 3. The format is the same as that described in the Figure 3legend.
The percentage of anticipatory saccades, with SRTs too short to be elicited by visual stimuli, was also influenced by saccadic probability. Anticipations were defined as those saccades directed to the location of a possible target (i.e., landing within the computer-controlled window surrounding the eventual target or, in addition, the mirror-image location of the target for the 50% condition) that were initiated 0–69 msec after target appearance (see Materials and Methods). In total, ∼3% of saccades were anticipatory. Figure 5 shows the cumulative percentage of anticipations for all neurons as a function of the trial number within the three blocks of saccadic probability conditions. During the 50% condition, very few anticipations were elicited. In the 100% ON and 100% OFF conditions, there were few anticipations for the first 20–25 trials, but the number of anticipations increased after this point as indicated by the increase in the slope of the curves in Figure5.
Correlation between neuronal activity and SRT
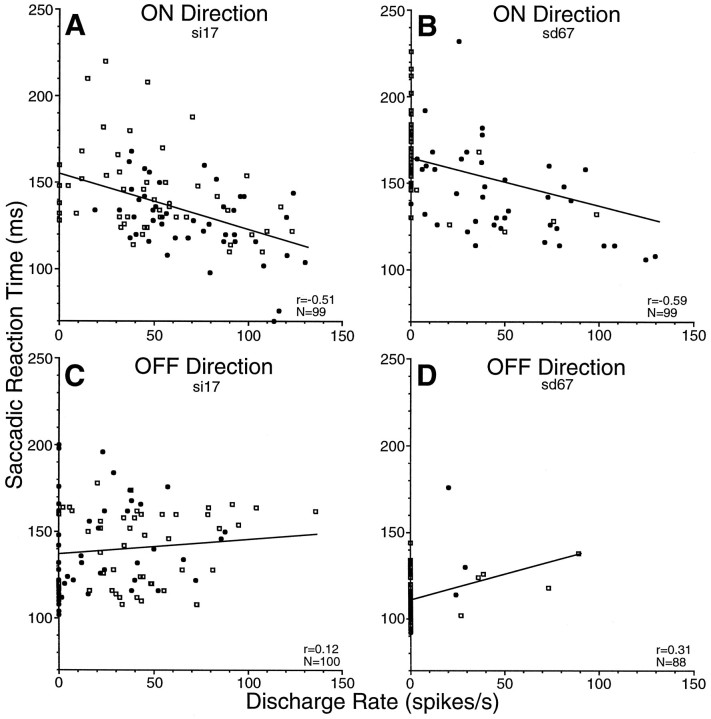
If the buildup activity of SC neurons was modulated with saccadic probability, how did that influence behavior? Figure6 shows how SRTs varied with changes in buildup neuron activity on a trial-by-trial basis for the two neurons shown in Figures 1 and 2. The data for the ON direction (Fig.6A,B) were obtained for ON direction saccades in the 50 and 100% ON conditions, and the data for the OFF direction (Fig. 6C,D) were obtained for OFF direction saccades in the 50 and 100% OFF conditions. For saccades in the ON direction, both neurons had a significant (Fisher’sr to z test, p < 0.01) negative correlation between neuronal discharge and SRT. Therefore, as the buildup activity of these buildup neurons increased, SRTs were reduced. In the OFF direction, there was a nonsignificant correlation for one neuron (Fig. 6C) and a significant positive correlation for the other neuron (Fig. 6D). For this latter neuron, however, nearly all trials had no discharge rate for the OFF direction (see Fig. 2), so the significance of the correlation is questionable.
Fig. 6.
Correlations between SRT and discharge rate of the two buildup neurons shown in Figures 1 (si17) and 2 (sd67). Each datapoint was collected from a single trial.A, B, Data in the ON direction were collected from the 50% (squares) and 100% (filled circles) ON conditions. C,D, Data in the OFF direction were collected from the 50% (squares) and 100% (filled circles) OFF conditions.
Histograms of the correlation coefficients for all neurons are shown in Figure 7 for three different sampling epochs to demonstrate the evolution of the proposed motor preparation signal during the gap paradigm. Those neurons with significant correlations (p < 0.01, Fisher’s rto z test) are depicted with hatched bars. The strongest correlations were observed during the pretarget epoch (50–60 msec after target appearance). In the ON direction (Fig.7A), nearly all neurons (29/31 or 94%) had significant negative correlations. In the OFF direction (Fig. 7B), nearly one-half of the neurons (15/31 or 48%) had significant positive correlations, and a minority of neurons had significant negative correlations (2/31 or 6%). The mean correlation coefficient in the ON direction was −0.43, and in the OFF direction it was 0.18. The proportion of significant correlations and the deviation of the mean of the correlations from zero decreased as discharge rate was sampled earlier in time from target presentation. During the gap epoch (0–10 msec before target presentation), less than one-half of the neurons (13/29 or 45%) had significant negative correlations in the ON direction (Fig. 7C), and the mean correlation coefficient of the sample was −0.24. In the OFF direction (Fig. 7D), a minority of neurons had significant correlations (positive correlation, 3/29 or 10%; negative correlation, 1/29 or 3%), and the mean of the correlations was 0.0. During the fixation epoch (0–10 msec before fixation point disappearance), there was virtually no correlation between discharge rate and SRT. In the ON direction (Fig.7E), only a few neurons showed a significant correlation (positive correlation, 1/24 or 4%; negative correlation, 2/24 or 8%), and the mean of the correlations was −0.05. In the OFF direction (Fig.7F), only one neuron had a significant correlation between discharge rate and SRT (1/24 or 4%), and the mean correlation was 0.01. Note that the number of neurons was not consistent in all epochs because some neurons lacked any discharge in one or both directions during the epoch and therefore determining a correlation coefficient was not possible.
Fig. 7.
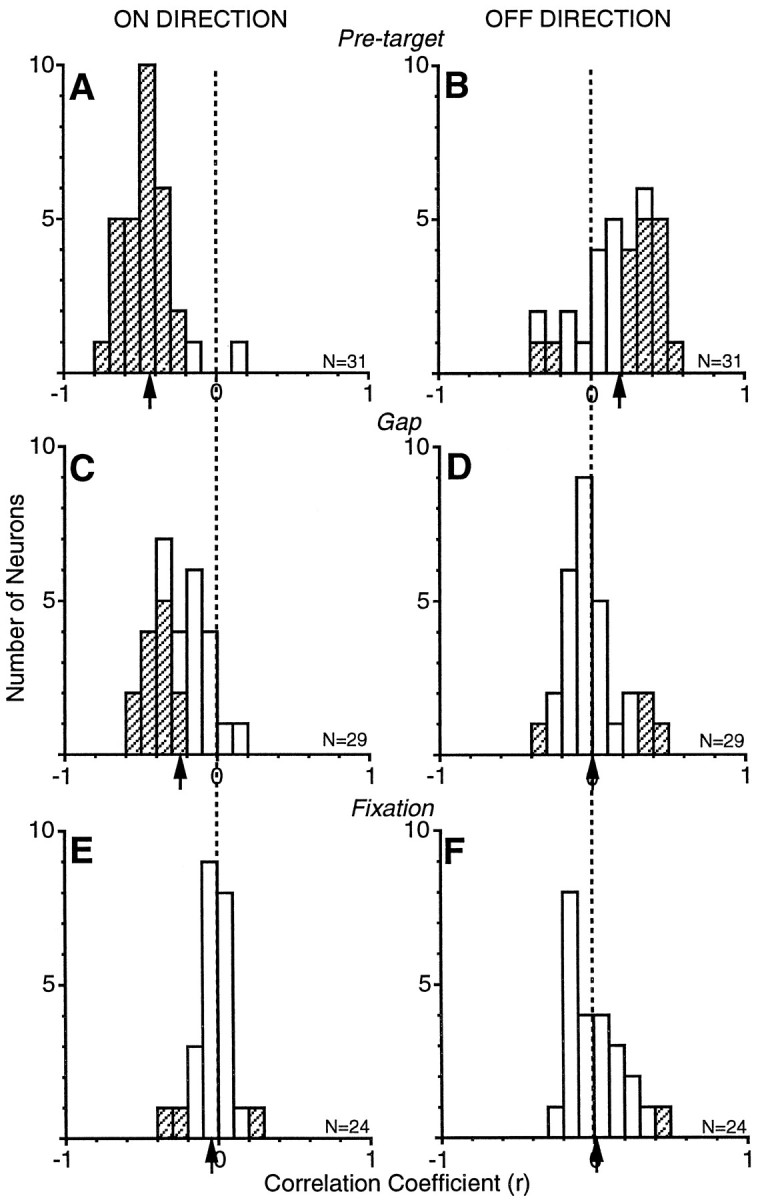
Correlation coefficient distributions of discharge rate versus SRT in the ON and OFF directions from the sample of buildup neurons. Discharge rates were sampled during a pretarget epoch (A, B; 50–60 msec after target presentation), a gap epoch (C, D; 0–10 msec before target presentation), and a fixation epoch (E, F; 0–10 msec before fixation point disappearance. Hatched bars represent statistically significant correlations (p < 0.01). Arrows depict the mean correlation coefficient for each condition.
Covariation of discharge rate and behavior across conditions
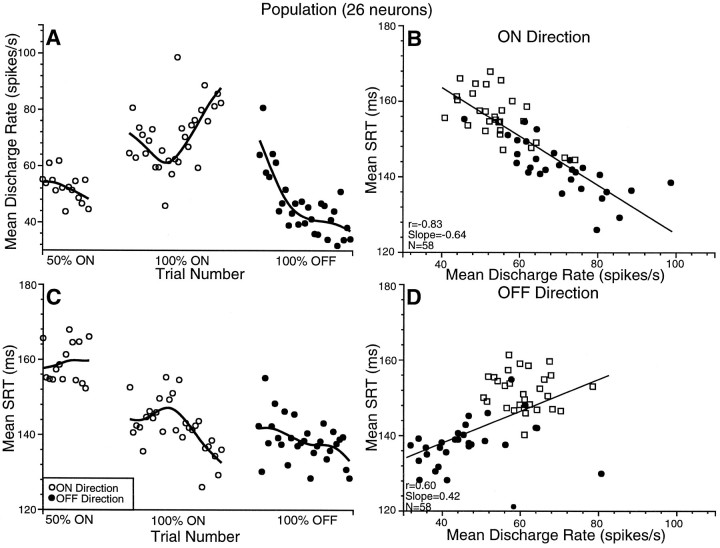
We looked at how neuronal discharge and SRT covaried over each saccadic probability condition for the population (Fig.8). Each point on the graphs represents the mean discharge rate or mean SRT from 26 neurons for a trial. Each successive data point along the x-axis in Figure 8,A and C, represents the mean data from the following trial. All neurons used in this analysis were tested on the 50% ON condition, followed by the 100% ON condition, and finally on the 100% OFF condition. Between each saccadic probability condition there was an ∼1 min break in recording (denoted by the space between each saccadic target probability condition in Fig. 8) as the experimenter modified variables for the upcoming block of trials. For Figure 8, A and C, the 16th–30th correct ON direction trials are shown for the 50% condition, followed by the 1st–29th correct ON and OFF direction trials for the 100% ON and 100% OFF conditions, respectively. The data from the first 15 correct ON trials in the 50% condition are not shown because we did not control for the influence of the paradigm that occurred before this block of trials. Furthermore, only data in which the trial number was completed during the recording of all neurons are included in this analysis. Therefore, only data up to the 30th correct trial are shown in this figure. It should be noted that for each data point we are taking the mean of the nth correct trial. If the monkey did not perform a trial correctly by anticipating where the target would appear, we excluded these trials. These rare anticipation trials (Fig.5) (<2% of saccades in the first 30 trials of each block) should have a minimal effect.
Fig. 8.
A, C, Covariation of population discharge rate (A) and SRTs (C) during the evolution of blocks of trials in the different saccadic probability conditions. Each datapoint in A and Crepresents the mean discharge rate or mean SRT from 26 buildup neurons on successive correct trials. The gap between datapoints and splines along the x-axis represents switching saccadic probability blocks. Data for the ON direction are plotted as empty circles, and data for the OFF direction are plotted as filled circles. A spline function is fit through the data in each block of trials (de Boor, 1978). B, D, The correlation between mean discharge rate and mean SRT for the 26 neurons for successive trials in the ON (B) and OFF (D) directions for the combined 50% (squares) and 100% (filled circles) conditions.
Mean discharge rate (Fig. 8A) and mean SRT (Fig.8C) covaried in two ways during the transition from one saccadic probability condition to another. First, there was a somewhat instantaneous step change as the monkey switched from one saccadic probability condition to another. Another slower transition evolved during a block of trials. For the ON direction trials in the 50% condition, discharge rate decreased slightly from the 16th to the 30th trial, and the corresponding SRTs increased slightly. When the saccadic probability condition switched from the 50 to the 100% ON condition, there was a large jump in discharge rate on the first trial and a corresponding reduction in SRTs. As the 100% ON condition block progressed, discharge rate decreased, and SRT increased until approximately correct trial 13. Thereafter, the discharge rate steadily increased as SRTs decreased until correct trial 29. The transition from the 100% ON to the 100% OFF probability condition was marked by a smaller instantaneous decrease in discharge rate beginning on the first trial. However, the discharge rate decreased dramatically as the block evolved. The corresponding SRTs were marked by a modest increase in SRT in the OFF direction beginning on the first trial, with a small reduction in SRT as the block progressed.
The large jumps in both early discharge rate and SRT on the first trial when changing from one saccadic probability block to another were likely caused by the monkey’s expectation of the saccadic target in the ON direction because of the methods used to isolate neurons. When searching for neurons, targets were presented repeatedly in the response field of the neuron (i.e., 100% ON condition) that elicited saccades that triggered the most intense discharge to aid in isolating a neuron. Therefore, during the short delay (∼1 min) before the initiation of a new block of trials, the monkey may have assumed the target and the required saccade would be in the ON direction because that was the “default” condition during that electrode penetration. Therefore, the discharge rate and SRTs did not initially reflect the saccadic probability associated with the saccades directed anywhere in the visual field, but instead they were skewed toward the 100% ON condition.
Mean discharge rate and SRT remained tightly correlated throughout these transitions for both the ON and OFF directions for the population of 26 neurons (Fig. 8B,D). In the ON direction (Fig. 8B), the buildup activity was negatively correlated with SRT (r = −0.83;p < 0.0001) (for the first 29 correct ON trials of both the 50 and 100% ON conditions). In the OFF direction (Fig.8D), a significant correlation was also obtained between discharge rate and SRT (r = 0.60;p < 0.0001) (for the first 29 correct OFF trials of both the 50 and 100% OFF conditions), but in this case it was a positive correlation.
Comparison of discharge rate for anticipations and target-triggered saccades
As stated earlier, the main goal of this paper was to determine whether the early, low-frequency activity of SC saccade-related neurons codes motor preparation. Dorris et al. (1997) have shown that these neurons have more activity before express saccades (SRT, 70–120 msec) than before regular saccades (SRT, 130–180 msec). Therefore, in those rare cases in which an anticipatory saccade was elicited, we would predict that buildup neurons should be accompanied by an excessive amount of activity that triggers a movement before information regarding target location reaches the SC. For buildup activity to code motor preparation, the activity of these neurons must also be related to saccadic metrics. Therefore, for saccades of the same latencies, we would expect differential buildup activity for saccades in the ON and OFF directions.
Figure 9 shows the saccadic metrics and the corresponding activity from a single neuron during the 100% ON and 100% OFF conditions. The trials have been segregated into anticipatory, express, and regular saccades (see Materials and Methods), and the activity is aligned on target presentation. The waveforms for the three types of saccades are superimposed at the bottom of the figure (Fig.9M,N).
The end positions (absolute value of the difference between the end position of primary saccade and target position) for the three classes of saccades are similar in the ON direction (Fig.9A,E,I) (Kruskal–Wallis ANOVA on ranks, H = 5.88;p > 0.05) and in the OFF direction (Fig.9C,G,K) (Kruskal–Wallis ANOVA on ranks, H = 5.93; p > 0.05). There is slightly more scatter in the end positions for anticipatory saccades (Fig. 9A,C) as would be expected from saccades that are not visually triggered. In all cases, saccades are directed near the proper target position regardless of saccadic class.
Buildup activity was modulated by both saccadic timing and metrics. In the ON direction, the buildup activity of the neuron preceding target presentation is higher for anticipatory (Fig. 9B) compared with express saccades (Fig. 9F), and the activity is higher for express compared with regular saccades (Fig.9J). The effect of saccadic timing on buildup discharge can be seen clearly when the three waveforms are superimposed (Fig. 9M). In the OFF direction, overall buildup activity is less, and the opposite pattern of buildup activity occurs in relation to saccadic timing. Anticipatory saccades (Fig.9D) have less activity than express saccades (Fig.9H) that, in turn, have less activity than regular saccades (Fig. 9L). Therefore, modulations in buildup activity are not caused solely by saccadic timing but also by saccadic metrics because saccades occurring within the same range of latencies for each of the three saccadic classes have drastically different buildup activity whether the upcoming saccadic metric is directed in the ON or OFF direction. Although we have data only from two target locations (i.e., ON and OFF directions), our results are in agreement with other studies that have systematically varied the location and number of saccadic targets and found that the early, low-frequency activity of saccade-related collicular neurons is influenced by saccadic metrics (Glimcher and Sparks, 1992; Basso and Wurtz, 1997).
In total, only 11 of our neurons had at least five of each type of saccade in the 100% ON condition and were included in the analysis of the three classes of saccades. Analysis of the 100% OFF condition is not included here because not enough neurons had five trials in each saccade class for both directions. The mean spike density functions calculated from the 11 neurons for anticipatory, express, and regular saccades are shown in Figure 10. The buildup activity for the mean of this sample is highest at the time of target presentation for anticipatory, intermediate for express, and the least for regular saccades (Fig. 10A). The higher buildup activity preceding anticipatory saccades occurred well before target appearance. When the waveforms were aligned on saccade onset (Fig. 10B), it becomes clear that the peak burst activity is greatest for target-triggered (regular and express saccades) and least for anticipatory saccades.
DISCUSSION
We have shown that saccade-related neurons in the intermediate layers of the monkey SC have activity preceding target presentation that is related to both saccadic metrics and timing. We propose that this early, pretarget activity represents a motor preparation signal for saccades to a specific location. Riehle and Requin (1993) proposed three criteria for labeling neuronal activity as preparatory. First, the timing of neuronal activity must occur during the period just before the motor act. A defining characteristic of buildup neurons is that their activity increased during the gap period when fixation point removal could act as a warning or timing signal for the impending target. Second, the level of neuronal activity must vary in accordance with the predictability of the impending movement. The amount of pretarget activity of our neurons mimicked the probability of the saccade being directed into the response field of the neuron (Figs.1-3). The third criterion for labeling neuronal activity as preparatory is that the activity must predict motor performance. The pretarget activity of buildup neurons was correlated with SRT (Figs.6-8). In fact, as the pretarget activity increased during blocks of trials in which target location was certain, it was related to the incidence of anticipatory saccades; ON direction anticipatory saccades were accompanied by an excessive amount of buildup activity (Figs. 9,10).
Our conclusion that the early, low-frequency activity of buildup neurons codes for motor preparation differs from previous interpretations that have suggested that this activity is related to attentional mechanisms (Kustov and Robinson, 1996), target selection (Basso and Wurtz, 1997), or movement selection (Glimcher and Sparks, 1992, 1993). Although these processes influence the early activity of buildup neurons, they all may be subprocesses of the larger process of motor preparation that we argue is the role of this early activity. Although we agree that buildup activity codes both target and movement selection, we feel that by not taking into account the relationship between pretarget buildup activity and the timing of saccades these labels are only partially complete.
It still may be argued that pretarget buildup activity may represent visuospatial attention because attention can code for a specific location and evidence shows that attentional shifts to target locations result in a reduction in SRTs (Posner, 1980). It has been suggested either that the segregation of attentional processes from motor preparation may be intractable or that these processes may be one and the same (Klein, 1980; Rizzolatti et al., 1987; Hoffman and Subramaniam, 1995; Kowler et al., 1995; Sheliga et al., 1995;Kustov and Robinson, 1996). We suggest that attention, as defined by improved sensory processing of certain objects or areas of the visual field, can be measured with improved sensory processing by either improved detection or discrimination of visual stimuli. However, measuring attention with speeded motor responses cannot segregate sensory processes from motor processes. Therefore, until a definitive answer to the separation or unification of the processes of attention and motor preparation is known, we suggest that measurements of changes in sensory processing should be labeled attention, whereas measurements of changes in motor responses should be labeled motor preparation.
That the pretarget activity of buildup neurons is involved in motor preparation is further corroborated by anatomical studies. These neurons are located in the intermediate layers of the SC that are organized into a saccadic motor map (Robinson, 1972), and they project via the crossed predorsal bundle to the brainstem reticular formation (Istvan et al., 1994; Gandhi and Keller, 1997) where saccadic eye movements are generated. Therefore, because of the evidence that the intermediate layers of the SC have a large motor role in generating eye movements and the strong correlations that exist between discharge rate and saccadic metrics and timing (Figs. 6-10), we propose that motor preparation is the term that best describes the activity of these neurons.
Glimcher and Sparks (1992, 1993) demonstrated convincingly that the early, low-frequency collicular activity codes saccadic metrics, but they argue that this activity does not code the timing of saccade initiation. Because the onset of the prelude activity did not have a fixed temporal relationship to movement initiation, such as occurs with the saccade-related burst of SC neurons, they claimed that this activity is unrelated to movement initiation (Glimcher and Sparks, 1993). We agree that the onset of early collicular activity occurs at a variable time preceding movement initiation, and this variable onset is based primarily on task-dependent factors. However, they failed to relate the level of collicular activity to saccadic timing at the time the cue for movement initiation was given. Glimcher and Sparks (1993)then conducted two experiments to test explicitly whether electrically induced low-frequency activity in the intermediate layers of the SC would affect either saccadic metrics or timing. In the first experiment, the metrics of spontaneous saccades were more likely directed toward the stimulated location, whereas the timing of the first saccade from an arbitrary point in time was unchanged. Our data would suggest that only those voluntary saccades directed toward the stimulated collicular location would have reduced latencies, whereas voluntary saccades directed elsewhere would have increased latencies (see Figs. 6-8). The result would be that the average latency of saccades would remain constant. In their second experiment, they only analyzed the metrics of saccades directed toward locations in the visual field different from the stimulated location and ignored the data concerning saccades directed to the stimulated region. The analysis of these ON direction saccades is crucial to Glimcher and Sparks’s (1993) argument that low level collicular activity does not influence the timing of movement initiation.
The task-dependent nature of the early pretarget activity of buildup neurons is exemplified by the neuron shown in Figure 2. If this neuron was only tested under conditions in which target location was randomized (i.e., the 50% condition), the early, pretarget activity would not have been observed. It was not until the required saccade into the response field of the neuron was fully predictable that pretarget activity became evident. This task-dependent nature of buildup activity was noted previously (Basso and Wurtz, 1997). The task dependency of buildup activity is also evident in the strength of the correlations between discharge rate and SRT (Figs. 6, 7) compared with the correlations obtained in a previous experiment (Dorris et al., 1997). In the present experiment, 94% of the neurons had significant correlation coefficients with a mean coefficient of −0.43 for saccades in the ON direction, whereas, using similar gap conditions in the previous study, only 41% of the neurons had significant correlation coefficients with a mean coefficient of −0.23. The main cause for this difference was the increased range of discharge rates and SRTs in the present study that resulted from varying the saccadic probability compared with the narrow range of discharge rates and SRTs obtained in the previous study (Dorris et al., 1997). It is difficult for correlations to reach statistical significance unless there is sufficient spread in the measured variables. Another cause for this difference between studies was that there was a larger number of saccades used for calculating each correlation coefficient in the present study.
A body of literature has developed over the years describing how movement predictability affects saccadic (Hackman, 1940; Bartz, 1962;Megaw and Armstrong, 1973; Carpenter and Williams, 1995; Paré and Munoz, 1996) and manual (Hick, 1952; Lecas et al., 1986; Megaw and Armstrong, 1973) reaction times and can influence saccadic metrics (He and Kowler, 1989). Recently, Carpenter and Williams (1995) developed a model in which variability in SRTs was explained in terms of a decision signal rising toward a threshold level after presentation of a visual stimulus. When this decision signal surpassed a certain threshold level, a saccade was elicited. The model predicted that variations in SRT were a function of both the level of the decision signal before target presentation, which in turn was a function of saccadic probability, and the rate of rise of this decision signal. Hanes and Schall (1996) found evidence that the rate of rise of the activity toward the saccadic threshold of movement cells in the frontal eye fields was modulated in relation to SRT, whereas they saw no evidence of variable baseline activity. Although testing between these two models was not a direct goal of this paper, we found changing baseline levels of buildup neuron activity with changing saccadic probabilities (Figs. 1-3, 8) that may represent a physiological correlate for varying baseline levels of the decision signal proposed by Carpenter and Williams (1995) under similar conditions. Subtle differences in the rate of rise toward saccadic threshold were observed in these neurons for different saccadic latency classes (Fig. 10B) similar to that observed by Hanes and Schall (1996). A specific test of these two models should be conducted in future studies of SC buildup neuron discharge.
The SC has traditionally been considered a structure involved solely in the generation of reflexive, orienting saccades. However, recent studies demonstrate that early collicular activity is influenced by such cognitive influences as attentional shifts (Kustov and Robinson, 1996), movement selection (Glimcher and Sparks, 1992), target uncertainty (Basso and Wurtz, 1997), and, in this study, saccadic probability. What all these factors have in common is that they contain information that can be used for advanced motor preparation, thus optimizing motor output for the different tasks that confront the oculomotor system. The role of collicular buildup neurons may be to integrate a variety of sensory and cognitive signals and in this way to act as a final decision maker leading the initiation of saccadic eye movements.
Footnotes
This work was supported by a group grant from the Medical Research Council (MRC) of Canada. M.C. Dorris was supported by a Queen’s University graduate fellowship. D.P. Munoz is an MRC scientist and a fellow of the EJLB Foundation. We thank A. Lablans, K. Moore, and D. Hamburger for technical assistance and J. Broughton, B. Corneil, S. Everling, and M. Paré for commenting on an earlier version of this manuscript.
Correspondence should be addressed to Dr. Douglas P. Munoz, Department of Physiology, Queen’s University, Kingston, Ontario, Canada, K7L 3N6.
REFERENCES
- 1.Bartz A. Eye-movement latency, duration, and response time as a function of angular displacement. J Exp Psychol. 1962;64:318–324. doi: 10.1037/h0043475. [DOI] [PubMed] [Google Scholar]
- 2.Basso MA, Wurtz RH. Modulation of neuronal activity by target uncertainty. Nature. 1997;389:66–69. doi: 10.1038/37975. [DOI] [PubMed] [Google Scholar]
- 3.Carpenter RHS, Williams MLL. Neural computation of log likelihood in control of saccadic eye movements. Nature. 1995;377:59–62. doi: 10.1038/377059a0. [DOI] [PubMed] [Google Scholar]
- 4.Crist CF, Yamasaki DSG, Komatsu H, Wurtz RH. A grid system and a microsyringe for single cell recording. J Neurosci Methods. 1988;26:117–122. doi: 10.1016/0165-0270(88)90160-4. [DOI] [PubMed] [Google Scholar]
- 5.de Boor C. A practical guide to splines. In: LaSalle J, Sirovich L, Whitham G, editors. Applied mathematical sciences, Vol 27. Springer; New York: 1978. [Google Scholar]
- 6.Dorris MC, Munoz DP. A neural correlate for the gap effect on saccadic reaction times in monkey. J Neurophysiol. 1995;73:2558–2562. doi: 10.1152/jn.1995.73.6.2558. [DOI] [PubMed] [Google Scholar]
- 7.Dorris MC, Paré M, Munoz DP. Neuronal activity in monkey superior colliculus related to the initiation of saccadic eye movements. J Neurosci. 1997;17:8566–8579. doi: 10.1523/JNEUROSCI.17-21-08566.1997. [DOI] [PMC free article] [PubMed] [Google Scholar]
- 8.Fischer B, Boch R. Saccadic eye movements after extremely short reaction times in the monkey. Brain Res. 1983;260:21–26. doi: 10.1016/0006-8993(83)90760-6. [DOI] [PubMed] [Google Scholar]
- 9.Fischer B, Weber H. Express saccades and visual attention. Behav Brain Sci. 1993;16:553–610. [Google Scholar]
- 10.Gandhi NJ, Keller EL. Spatial distribution and discharge characteristics of superior colliculus neurons antidromically activated from the omnipause region in monkey. J Neurophysiol. 1997;78:2221–2225. doi: 10.1152/jn.1997.78.4.2221. [DOI] [PubMed] [Google Scholar]
- 11.Glimcher PW, Sparks DL. Movement selection in advance of action in superior colliculus. Nature. 1992;355:542–545. doi: 10.1038/355542a0. [DOI] [PubMed] [Google Scholar]
- 12.Glimcher PW, Sparks DL. Effects of low-frequency stimulation of the superior colliculus on spontaneous and visually guided saccades. J Neurophysiol. 1993;69:954–964. doi: 10.1152/jn.1993.69.3.953. [DOI] [PubMed] [Google Scholar]
- 13.Hackman R. An experimental study of variability in ocular latency. J Exp Psychol. 1940;27:546–558. [Google Scholar]
- 14.Hanes DP, Schall JD. Neural control of voluntary movement initiation. Science. 1996;274:427–430. doi: 10.1126/science.274.5286.427. [DOI] [PubMed] [Google Scholar]
- 15.Hanes DP, Thompson KG, Schall JD. Relationship of presaccadic activity in frontal eye field and supplementary eye field to saccade initiation in macaque: Poisson spike train analysis. Exp Brain Res. 1995;103:85–96. doi: 10.1007/BF00241967. [DOI] [PubMed] [Google Scholar]
- 16.Hays AV, Richmond BJ, Optician LM (1982) A UNIX-based multiple process system for real-time data acquisition and control. W ESCON Conf Proc 2:1–10.
- 17.He P, Kowler E. The role of location probability in the programming of saccades: implications for “center-of-gravity” tendencies. Vision Res. 1989;29:1165–1181. doi: 10.1016/0042-6989(89)90063-1. [DOI] [PubMed] [Google Scholar]
- 18.Hick WE. On the rate of gain of information. Q J Exp Psychol. 1952;4:11–26. [Google Scholar]
- 19.Hoffman JE, Subramaniam B. The role of visual attention in saccadic eye movements. Percept Psychophys. 1995;57:787–795. doi: 10.3758/bf03206794. [DOI] [PubMed] [Google Scholar]
- 20.Istvan PJ, Dorris MC, Munoz DP. Functional identification of neurons in the monkey superior colliculus that project to the paramedian reticular formation. Soc Neurosci Abstr. 1994;20:141. [Google Scholar]
- 21.Judge SJ, Richmond BJ, Chu FC. Implantation of magnetic search coils for measurement of eye position: an improved method. Vision Res. 1980;20:535–538. doi: 10.1016/0042-6989(80)90128-5. [DOI] [PubMed] [Google Scholar]
- 22.Klein RM. Does oculomotor readiness mediate cognitive control of visual attention? In: Nickerson R, editor. Attention and performance, VIII. Erlbaum; Hillsdale, NJ: 1980. pp. 259–276. [Google Scholar]
- 23.Kowler E, Anderson E, Dosher B, Blaser E. The role of attention in the programming of saccades. Vision Res. 1995;35:1897–1916. doi: 10.1016/0042-6989(94)00279-u. [DOI] [PubMed] [Google Scholar]
- 24.Kustov AA, Robinson DL. Shared neural control of attentional shifts and eye movements. Nature. 1996;384:74–77. doi: 10.1038/384074a0. [DOI] [PubMed] [Google Scholar]
- 25.Lecas J, Requin J, Anger C, Vitton N. Changes in neuronal activity of the monkey precentral cortex during preparation for movement. J Neurophysiol. 1986;56:1680–1702. doi: 10.1152/jn.1986.56.6.1680. [DOI] [PubMed] [Google Scholar]
- 26.Mays LE, Sparks DL. Dissociation of visual and saccade-related responses in superior colliculus neurons. J Neurophysiol. 1980;43:207–232. doi: 10.1152/jn.1980.43.1.207. [DOI] [PubMed] [Google Scholar]
- 27.Megaw E, Armstrong W. Individual and simultaneous tracking of a step input by the horizontal saccadic eye movement and manual control systems. J Exp Psychol. 1973;100:18–28. doi: 10.1037/h0035447. [DOI] [PubMed] [Google Scholar]
- 28.Mohler CW, Wurtz RH. Organization of monkey superior colliculus: intermediate layer cells discharging before eye movements. J Neurophysiol. 1976;39:722–744. doi: 10.1152/jn.1976.39.4.722. [DOI] [PubMed] [Google Scholar]
- 29.Munoz DP, Guitton D. Control of orienting gaze shifts by the tectoreticulospinal system in the head-free cat. II. Sustained discharges during motor preparation and fixation. J Neurophysiol. 1991;66:1624–1641. doi: 10.1152/jn.1991.66.5.1624. [DOI] [PubMed] [Google Scholar]
- 30.Munoz DP, Istvan PJ. Lateral inhibitory interactions in the intermediate layers of the monkey superior colliculus. J Neurophysiol. 1998;79:1193–1209. doi: 10.1152/jn.1998.79.3.1193. [DOI] [PubMed] [Google Scholar]
- 31.Munoz DP, Wurtz RH. Saccade-related activity in monkey superior colliculus. I. Characteristics of burst and buildup cells. J Neurophysiol. 1995;73:2313–2333. doi: 10.1152/jn.1995.73.6.2313. [DOI] [PubMed] [Google Scholar]
- 32.Paré M, Munoz DP. Saccadic reaction time in the monkey: advanced preparation of oculomotor programs is primarily responsible for express saccades occurrence. J Neurophysiol. 1996;76:3666–3681. doi: 10.1152/jn.1996.76.6.3666. [DOI] [PubMed] [Google Scholar]
- 33.Posner MI. Orienting of attention. Q J Exp Psychol. 1980;32:3–25. doi: 10.1080/00335558008248231. [DOI] [PubMed] [Google Scholar]
- 34.Requin J, Brener J, Ring C. Preparation for action. In: Jennings JR, Coles MGH, editors. Psychophysiology of human information processing. Wiley; New York: 1991. pp. 357–448. [Google Scholar]
- 35.Riehle A, Requin J. The predictive value for performance speed of preparatory changes in neuronal activity of the monkey motor and premotor cortex. Behav Brain Res. 1993;53:35–49. doi: 10.1016/s0166-4328(05)80264-5. [DOI] [PubMed] [Google Scholar]
- 36.Rizzolatti G, Riggio L, Dascola I, Umilta C. Reorienting attention across the horizontal and vertical meridians: evidence in favor of a premotor theory of attention. Neuropsychologia. 1987;25:31–40. doi: 10.1016/0028-3932(87)90041-8. [DOI] [PubMed] [Google Scholar]
- 37.Robinson DA. Eye movements evoked by collicular stimulation in the alert monkey. Vision Res. 1972;12:1795–1808. doi: 10.1016/0042-6989(72)90070-3. [DOI] [PubMed] [Google Scholar]
- 38.Sheliga BM, Riggio L, Rizzolatti G. Spatial attention and eye movements. Exp Brain Res. 1995;105:261–275. doi: 10.1007/BF00240962. [DOI] [PubMed] [Google Scholar]
- 39.Sparks DL. Functional properties of neurons in the monkey superior colliculus: coupling of neuronal activity and saccade onset. Brain Res. 1978;156:1–16. doi: 10.1016/0006-8993(78)90075-6. [DOI] [PubMed] [Google Scholar]
- 40.Sparks DL, Hartwich-Young R. The deep layers of the superior colliculus. In: Wurtz RH, Goldberg ME, editors. The neurobiology of saccadic eye movements. Elsevier; Amsterdam: 1989. pp. 213–255. [PubMed] [Google Scholar]
- 41.Waitzman DM, Ma TP, Optician LM, Wurtz RH. Superior colliculus neurons mediate the dynamic characteristics of saccades. J Neurophysiol. 1991;66:1716–1737. doi: 10.1152/jn.1991.66.5.1716. [DOI] [PubMed] [Google Scholar]
- 42.Yarbus A. Eye movements and vision. Plenum; New York: 1967. [Google Scholar]


