

Abstract
The leaner (tgla) mutation in mice results in severe ataxia and an overt neurodegeneration of the cerebellum. Positional cloning has revealed that the tglamutation occurs in a gene encoding the voltage-activated calcium channel α1A subunit. The α1A subunit is highly expressed in the cerebellum and is thought to be the pore-forming subunit of P- and Q-type calcium channels. In this study we used both whole-cell and single-channel patch-clamp recordings to examine the functional consequences of the tglamutation on P-type calcium currents. High-voltage-activated (HVA) calcium currents were recorded from acutely dissociated cerebellar Purkinje cells of homozygous leaner (tgla/tgla) and age-matched wild-type (+/+) mice. In whole cell recordings, we observed a marked reduction of peak current density in tgla/tgla Purkinje cells (−35.0 ± 1.8 pA/pF) relative to that in +/+ (−103.1 ± 5.9 pA/pF). The reduced whole-cell current in tgla/tgla cells was accompanied by little to no alteration in the voltage dependence of channel gating. In both genotypes, HVA currents were predominantly of the ω-agatoxin-IVA–sensitive P-type. Cell-attached patch-clamp recordings revealed no differences in single-channel conductance between the two genotypes and confirmed the presence of three distinct conductance levels (9, 13–14, and 17–18 pS) in cerebellar Purkinje cells. Analysis of patch open-probability (NPo) revealed a threefold reduction in the open-probability of channels in tgla/tgla patches (0.04 ± 0.01) relative to that in +/+ (0.13 ± 0.02), which may account for the reduced whole-cell current in tgla/tgla Purkinje cells. These results suggest that the tgla mutation can alter native P-type calcium channels at the single-channel level and that these alterations may contribute to the neuropathology of the leaner phenotype.
Keywords: Purkinje cell, calcium channel, single channel, leaner, neurological mutant, mouse
The leaner (tgla) mutation in mice results in a severe ataxia and an overt neurodegeneration of the cerebellum. It has recently been identified that both tgla and the allelic mutation tottering (tg) occur in a gene encoding the calcium channel α1Asubunit (Fletcher et al., 1996). The α1A protein is one of five pore-forming α1 subunits (A–E) that make up neuronal voltage-activated calcium channels (Tsien et al., 1991;Perez-Reyes and Schneider, 1994). The α1A subunit is widely expressed throughout the CNS with the greatest expression observed in the cerebellum (Mori et al., 1991; Starr et al., 1991;Westenbroek et al., 1995; Fletcher et al., 1996). Although considerable debate continues on the subject (Berrow et al., 1997; Moreno et al., 1997), electrophysiological experiments suggest that α1Ais the pore-forming subunit of P-type (Stea et al., 1994; Gillard et al., 1997) and/or Q-type (Sather et al., 1993; Zhang et al., 1993) calcium channels.
Fletcher et al. (1996) have revealed that the tg mutation results in a single amino acid substitution in the extracellular region linking the domains IIS5 and IIS6 of the α1A subunit. The tgla mutation occurs in a splice donor consensus sequence and results in an out-of-frame splicing event. The aberrant splicing produces two distinct transcripts, both predicted to yield novel α1A subunits with truncated C-terminal tails (Fletcher et al., 1996). It has recently been shown that neither α1A mRNA expression, assessed via in situhybridization, nor α1A protein expression, assessed via immunohistochemistry, is altered in the cerebella of homozygous tgla/tgla mice (Lau et al., 1998). However, it remains unknown what effect, if any, the tgla mutation has on P- and Q-type calcium channel function. It has been proposed that truncated α1Aproteins such as those predicted from the tgladefect may not form functional channels or may form channels displaying a pathological increase in function (Miller, 1997).
Cerebellar Purkinje cells represent an ideal environment in which to examine the function of α1A-containing calcium channels. High-voltage-activated (HVA) calcium currents in Purkinje cells are primarily of the ω-agatoxin-IVA– (Aga-IVA) sensitive P-type (Mintz et al., 1992a,b). Calcium currents recorded in Purkinje cells are nearly insensitive to both ω-conotoxin-GVIA (CTX-GVIA) and the dihydropyridines, suggesting little contribution of N- and L-type calcium channels to the whole-cell current (Regan, 1991; Regan et al., 1991). Here we use both whole-cell and cell-attached patch-clamp recordings to assess the effects of the tglamutation on the function of α1A-containing calcium channels in acutely dissociated Purkinje cells of homozygous tgla/tgla mice. The present study represents a unique opportunity to examine the functional consequences of a calcium channel mutation in native cells.
MATERIALS AND METHODS
Animals. Male and female control (+/+), heterozygous tottering (tg/+), and heterozygous leaner (tgla/+) mice, on the C57BL/6J background, were originally obtained from the The Jackson Laboratory (Bar Harbor, ME) and bred to produce either control (+/+), homozygous tottering (tg/tg), or homozygous leaner (tgla/tgla) offspring. All mice were housed in a constant temperature (23–24°C), constant humidity (45–50%) room, with a 12 hr light/dark cycle, and were allowed access to food (Wayne rodent chow) and water ad libitum. tgla/tgla mice become extremely ataxic beginning at postnatal day 10. All tgla/tgla mice were supplemented with hand feeding of human infant formula four times a day, starting at postnatal day 15 or 16, and were hand fed until postnatal day 50. In addition to hand feeding, the leaner mice had constant access to water (via a water bottle and sipper tube located very close to the bottom of the cage) and rodent chow (both dry and moistened) on the bottom of the cage. The moistened rodent chow was changed twice a day.
Isolated cells. Mice were anesthetized with isofluorane and decapitated. Cerebella were removed and placed in an icy sucrose solution similar to that described by Reynolds et al. (1992). The solution contained (in mm): 248 sucrose, 26 NaHCO3, 10 glucose, 5 KCl, 2 MgCl2, 1 CaCl2 and 1 Na-pyruvate, pH 7.4. Parasagittal cerebellar slices (450 μm) were cut on a McIlwain tissue chopper and were held at room temperature in oxygenated sucrose solution. Slices were enzymatically treated in the sucrose solution with 0.4–0.5 mg/ml Protease type XXIII (Sigma, St. Louis, MO) for 20 min at 35–36°C.
Cerebellar slices were transferred to DMEM (Life Technologies, Gaithersburg, MD) and were mechanically triturated through a series of fire-polished Pasteur pipettes to isolate individual Purkinje cells. Isolated cells were then dispersed onto the floor of a recording chamber pretreated with 0.1% Alcian blue solution to facilitate cell adhesion. Purkinje cells were identified morphologically by their large somata and single stumps of apical dendrite (Regan, 1991).
Data acquisition and analysis. Whole-cell and cell-attached patch-clamp recordings (Hamill et al., 1981) were performed with an Axopatch 200A amplifier (Axon Instruments, Foster City, CA). For both recordings, patch electrodes were pulled from borosilicate glass (#7052; Garner Glass Company, Claremont, CA) on a Flaming/Brown micropipette puller (Sutter Instruments, Novato, CA). Electrodes were coated with wax to reduce stray capacitance and were fire polished to final resistances of 2–5 MΩ.
For whole-cell recordings, cell capacitance was used as an indicator of cell size and was read directly from the potentiometer after capacity transients were nullified. Cell capacitance and series resistance were adjusted as necessary throughout the recordings, with series resistance generally compensated >80%. Data were low-pass filtered at 2 kHz and acquired at a sampling rate of 5–10 kHz.
All whole-cell current measurements were made relative to baseline. In most cases, currents were normalized to current density (pA/pF) by dividing by cell capacitance. In time-course experiments, currents were normalized to I/Imax, whereImax is the largest current in the experiment. To measure voltage-dependent inactivation, we used a double-pulse protocol similar to that described previously (Murchison and Griffith, 1996). To analyze voltage-dependent inactivation, we fit current–voltage plots with a single Boltzmann distribution. Voltage of half-inactivation (V1/2) was determined for individual cells and averaged.
For cell-attached single-channel recordings, all currents were low-pass filtered at 2 kHz and acquired at a sampling rate of 10 kHz. Currents were evoked with 300 msec voltage steps to the indicated potentials delivered at 4 sec intervals. Capacitive transients were partially nullified during current recordings. The remaining capacitive currents and leak currents were removed by subtracting the average of blank sweeps. Single-channel records were analyzed using Pclamp6 software (Axon Instruments). Unitary current amplitudes were calculated as the arithmetic mean of cursor measurements when the number of openings was low. For kinetic analysis, open and closed events were determined with a 50% threshold-crossing method in which a minimal resolvable duration of 200 μsec was required for openings and closings. This duration was set at 1.25× the rise time calculated for a 2 kHz filter (Colquhoun and Sigworth, 1983). Patch open-probability was calculated asNPo where N refers to the number of channels in the patch. Only patches in which one channel was apparent were included in our analysis, with the absence of simultaneous channel openings used as an indicator of single-channel activity. NPo was calculated as (To)/(To +Tc), where Toequals total open time during a sweep andTc equals total closed time during a sweep. Open-time histograms were fitted with a single exponential using a Levenberg–Marquardt chi-square minimization method. All statistical comparisons used an independent Student’s t test. Statistical significance was based on p < 0.05, with all averaged values reported as mean ± SE.
Solutions and drugs. Solutions were designed to maximize Ba2+ current through calcium channels while minimizing contaminating conductances. For whole-cell recordings, cells in the recording chamber were continuously perfused with an external solution containing (in mm): 140 NaCl, 3 KCl, 2 CaCl2, 1.2 MgCl2, 10 HEPES, and 33 d-glucose, pH 7.4 with NaOH (310–330 mOsm). Before whole-cell recordings, the external solution was exchanged for a modified recording solution containing (in mm): 132 NaCl, 2 BaCl2, 2 MgCl2, 10 HEPES, 33 d-glucose, 10 tetraethylammonium chloride (TEA-Cl), and 0.0005 tetrodotoxin (Calbiochem, La Jolla, CA), pH 7.4 with NaOH (310–330 mOsm). For cell-attached recordings, the membrane potential was zeroed with a high K+ solution containing (in mm): 140 K-aspartate, 5 MgCl2, 20 HEPES, 10d-glucose, 0.5 EGTA, and 0.0005 tetrodotoxin, pH 7.4 with KOH (310–330 mOsm).
For whole-cell recordings, the internal pipette solution contained (in mm): 110 Cs-acetate, 15 CsCl, 10 TEA-Cl, 2 MgCl2, 20 HEPES, 10 EGTA, 4 Mg-ATP, and 0.1 Na-GTP, pH 7.2 with CsOH (290–310 mOsm). For cell-attached recordings, the internal pipette solution contained (in mm): 110 BaCl2, 15 CsCl, 15 TEA-Cl, and 10 HEPES, pH 7.4 with CsOH (320 mOsm).
In whole-cell experiments, calcium channel antagonists ω-conotoxin-GVIA (Alamone Labs, Jerusalem, Israel), nifedipine (dissolved in 0.2% ethanol and 0.1% ethylene glycol), and cadmium chloride were bath applied in the recording solution as noted. The nifedipine vehicle had no effect on HVA calcium currents in either phenotype. ω-Agatoxin-IVA (Calbiochem) was dissolved in recording solution and applied through a drug-barrel pipette positioned adjacent to the recording electrode. For whole-cell experiments involving ω-conotoxin-GVIA and ω-agatoxin-IVA, 0.1 mg/ml cytochrome C was added to the recording solution to saturate nonspecific peptide-binding sites. For cell-attached recordings, nifedipine (10 μm) was included in the internal pipette solution. Salts and other chemicals were obtained from Sigma except as noted.
RESULTS
Whole-cell currents in leaner and wild-type mice
Whole-cell barium currents through HVA calcium channels were recorded from acutely dissociated Purkinje cells from leaner (tgla/tgla) and wild-type (+/+) mice. Purkinje cells were identified morphologically by their characteristic appearance after dissociation (see Materials and Methods). After establishment of the whole-cell voltage clamp, currents were elicited by voltage steps to −10 mV delivered at 12 sec intervals. To minimize any low-voltage-activated (LVA) current that might be present (Kaneda et al., 1990; Mouginot et al., 1997), we held cells at −60 mV, a potential known to inactivate fully the LVA currents in Purkinje cells (Regan, 1991). Because the phenotypic abnormalities in tgla/tgla mice are not apparent before 10 d of age (Herrup and Wilczynski, 1982), we limited our investigation to cells from mice between 18 and 35 d of age. Figure 1Ashows typical current traces recorded from tgla/tgla and +/+ Purkinje cells of similar capacitance. The current is notably reduced in amplitude for the tgla/tgla Purkinje cell. There was a statistically significant reduction in HVA currents in tgla/tgla cells (−511 ± 30 pA; n = 46) compared with that in +/+ cells (−1602 ± 96 pA; n = 45; p < 0.001). This reduction in current observed in tgla/tgla did not result from reduced cell size, because there was no statistical difference in cell capacitance between tgla/tgla(14.7 ± 0.4 pF; n = 46) and +/+ (15.6 ± 0.3 pF; n = 45) cells. Figure 1B shows peak currents of the two genotypes normalized to current density (pA/pF) and displayed across a range of ages. There was a statistically significant reduction in peak current density in tgla/tgla cells (−35.0 ± 1.8 pA/pF; n = 46) relative to that in +/+ cells (−103.1 ± 5.9 pA/pF; n = 45; p< 0.001). These data were collected from Purkinje cells of 26 leaner mice (17 litters) and 27 wild-type mice (19 litters). The current reduction in tgla/tgla Purkinje cells persisted past 40 d of age, when neurodegeneration of Purkinje cells is expected to begin in tgla/tgla mice (Herrup and Wilczynski, 1982). The inset provides a box plot summary of the distribution of peak current densities (pA/pF) in tgla/tgla and +/+ mice between 18 and 35 d of age.
Fig. 1.

HVA calcium currents recorded from wild-type (+/+) and leaner (tgla/tgla) Purkinje cells. A, Currents were elicited by a depolarizing test pulse to −10 mV (40 msec) from Vh = −60 mV. Voltage protocol is shown at top. B, Peak currents from +/+ and tgla/tglaPurkinje cells were divided by cell capacitance and reported as current densities (pA/pF). Peak current densities for individual cells were plotted versus days of age. Inset, Box plot summary for current densities in +/+ (shaded) and tgla/tgla (open) Purkinje cells is shown. Box boundaries represent 25th and 75th percentiles. The horizontal line within eachbox represents the median percentile, andextended lines represent 10th and 90th percentiles. Thefilled square within the box represents the mean, and asterisks and filled diamonds (below and above extended lines) represent 1st and 99th percentiles, respectively. There is a statistically significant difference (p< 0.001) between the means for +/+ (−103.1 ± 5.9 pA/pF;n = 45 cells) and tgla/tgla (−35.0 ± 1.8 pA/pF; n = 46 cells) Purkinje cells.
To determine whether a current reduction was unique to tgla/tgla Purkinje cells, we also recorded HVA currents from Purkinje cells of tg/tg mice. Currents were recorded from Purkinje cells of tg/tg mice between 28 and 35 d of age when the phenotype is readily identifiable. Using the same voltage protocol mentioned above [step depolarizations from a holding potential (Vh) of −60 to −10 mV delivered at 12 sec intervals], we found no significant difference in current density between +/+ (−103.1 ± 5.9 pA/pF;n = 45 cells) and tg/tg (−88.0 ± 5.1 pA/pF;n = 12 cells, 9 mice, 6 litters) Purkinje cells (data not shown). Apparently, the tg mutation and resultant single amino acid substitution on the extracellular IIS5–IIS6 linking region of the α1A subunit are not reflected in a reduced current density. Thus it seems likely that the tgla mutation altering the cytoplasmic C-terminal region of α1A leads to the distinct current reduction observed in tgla/tgla Purkinje cells.
Voltage-dependent activation
A possible explanation for the difference in HVA currents between the wild-type and leaner genotypes may be alterations in the voltage dependence of channel gating. Therefore, we sought to characterize the voltage dependence of current activation in tgla/tgla and +/+ Purkinje cells. Current–voltage relationships for tgla/tgla and +/+ Purkinje cells were examined using both voltage-step and voltage-ramp protocols. Figure 2A shows superimposed current traces from tgla/tgla and +/+ cells generated by a series of voltage steps delivered at 8 sec intervals. Currents were normalized to current densities and plotted against membrane potential in Figure 2B. Averaged HVA current densities in cells from tgla/tglaand +/+ mice both reached a maximum after voltage steps to −10 mV. We observed no significant difference in the voltage of half-activation (V1/2) in tgla/tgla cells (V1/2, −16.3 ± 0.8 mV; n = 16) relative to that in +/+ cells (V1/2, −18.3 ± 0.7 mV; n = 15; p > 0.05). However, a slight alteration in the slope of the activation curve was observed for tgla/tgla cells (k, 5.5 ± 0.3 mV; n = 16) relative to that for +/+ cells (k, 4.5 ± 0.2 mV; n= 15; p < 0.05). Because the reduction in current density in leaner cells persists across nearly all sampled membrane potentials, it is unlikely the current reduction in Figure 1 results from incomplete channel activation. Because HVA currents may display current- and/or voltage-dependent inactivation during the course of the step protocol, current–voltage relationships were also constructed with 400 msec voltage ramps. Figure 2C shows current traces generated by voltage ramps in tgla/tgla and +/+ cells of similar size. Similar to the voltage-step data in Figure2B, the averaged-ramp data in Figure2D shows a reduced current-density in tgla/tgla relative to that in +/+, with very little change in voltage of activation.
Fig. 2.

Current–voltage relationships in +/+ and tgla/tgla Purkinje cells.A, Representative current traces are shown for +/+ and tgla/tglaPurkinje cells. Currents were elicited by voltage steps from −80 to +30 mV (200 msec) delivered at 8 sec intervals with Vh = −60 mV. Voltage protocol is shown at top.B, Currents were divided by cell capacitance and reported as current densities (pA/pF). Current density ± SE was plotted versus test voltage. There are statistically significant differences (p < 0.002) in current densities between +/+ (n = 15 cells, 10 mice, 8 litters) and tgla/tgla(n = 16 cells, 8 mice, 7 litters) Purkinje cells from −30 to +30 mV. Inset, The scaled activation curve for tgla/tgla cells is superimposed on the +/+ activation curve. C, Representative current traces are shown for +/+ and tgla/tgla Purkinje cells. Currents were elicited by voltage ramps from −80 to +30 mV (400 msec) with Vh = −60 mV. Voltage protocol is shown attop. D, Currents were divided by cell capacitance and reported as current densities (pA/pF). Current densities were averaged and plotted versus membrane voltage. SEs are shown at peak current densities.
Voltage-dependent inactivation
A characteristic of voltage-activated calcium channels is voltage-dependent inactivation. Because the reduced current amplitude in leaner Purkinje cells could be explained by a change in voltage-dependent inactivation, we investigated whether this property was altered in tgla/tgla relative to +/+ Purkinje cells. To compare voltage dependence of inactivation, we used a double-pulse protocol similar to that described previously (Murchison and Griffith, 1996). Figure3A shows 24 superimposed current traces for tgla/tgla and +/+ cells of similar capacitance. Currents were normalized to the maximum current in each episode (I/Imax) and plotted versus conditioning pulse potential. The curves were fit with a single Boltzmann distribution. Figure 3B shows averaged inactivation curves for tgla/tglaand +/+ Purkinje cells. There was no significant difference in V1/2 for tgla/tgla cells (V1/2, −18.8 ± 1.3 mV; n = 7) relative to that for +/+ cells (V1/2, −21.8 ± 0.7 mV; n = 6; p > 0.05). Likewise, there was no significant difference in the slope factor of the inactivation curves for tgla/tglacells (k, 10.3 ± 0.7 mV; n = 7) relative to that for +/+ cells (k, 13.3 ± 2.0 mV;n = 6; p > 0.05). It should be noted that during the course of the inactivating protocol, there appeared to be some current-dependent inactivation as described previously for Purkinje cells (Regan, 1991). This was more apparent for wild type than for leaner, because the currents were always larger in amplitude in +/+ cells. The current inactivated by the depolarizing conditioning pulses never fully recovered, even after returning to a hyperpolarized resting potential.
Fig. 3.

Voltage-dependent inactivation in +/+ and tgla/tgla Purkinje cells.A, Inactivation records show 24 superimposedtraces of currents elicited by a depolarizing test pulse to −10 mV (120 msec). Before the test pulse, a 2 sec conditioning pulse varying in 5 mV increments between −110 and +5 mV was given.B, Voltage-dependent inactivation curves in +/+ and tgla/tgla Purkinje cells are shown. Currents were measured near the end of the pulse and were normalized to the maximum current in each record. Normalized currents ± SE were plotted versus conditioning voltage and fit with a Boltzmann distribution. Inset, Normalized activation curves are superimposed for +/+ and tgla/tgla Purkinje cells.
Although this analysis suggests voltage-dependent inactivation is unlikely to account for the generalized current reduction in tgla/tgla Purkinje cells, it is possible that a holding potential of −60 mV may introduce steady-state inactivation that is not alleviated by the 2 sec conditioning pulse. An increased degree of steady-state inactivation of tgla/tgla calcium channels would leave them less fully available for opening and could account for the current reduction. To address this issue, we compared the degree of steady-state inactivation relieved after hyperpolarizing the holding potential of tgla/tgla and +/+ Purkinje cells from −60 to −80 mV. HVA currents were elicited from a holding potential of −60 mV as described above, the holding potential was then hyperpolarized to −80 mV, and HVA currents were elicited. In both genotypes, HVA currents increased after hyperpolarization, with a maximum relief of inactivation usually observed by 1 min. Figure 4 shows the time course of relief of steady-state inactivation for a +/+ (Fig.4A) and a tgla/tgla (Fig.4B) Purkinje cell. After maximal relief of steady-state inactivation, the relative increase in HVA current densities was comparable. In eight +/+ cells, average HVA current density increased from −102.5 ± 14.8 to −133.5 ± 17.8 pA/pF (30% increase). In nine tgla/tgla cells, average HVA current density increased from −35.4 ± 4.8 to −44.7 ± 4.9 pA/pF (26% increase). These results indicate a similar degree of steady-state inactivation of tgla/tgla and +/+ calcium channels when held at −60 mV and suggest this is unlikely to account for the generalized reduction in HVA currents.
Fig. 4.
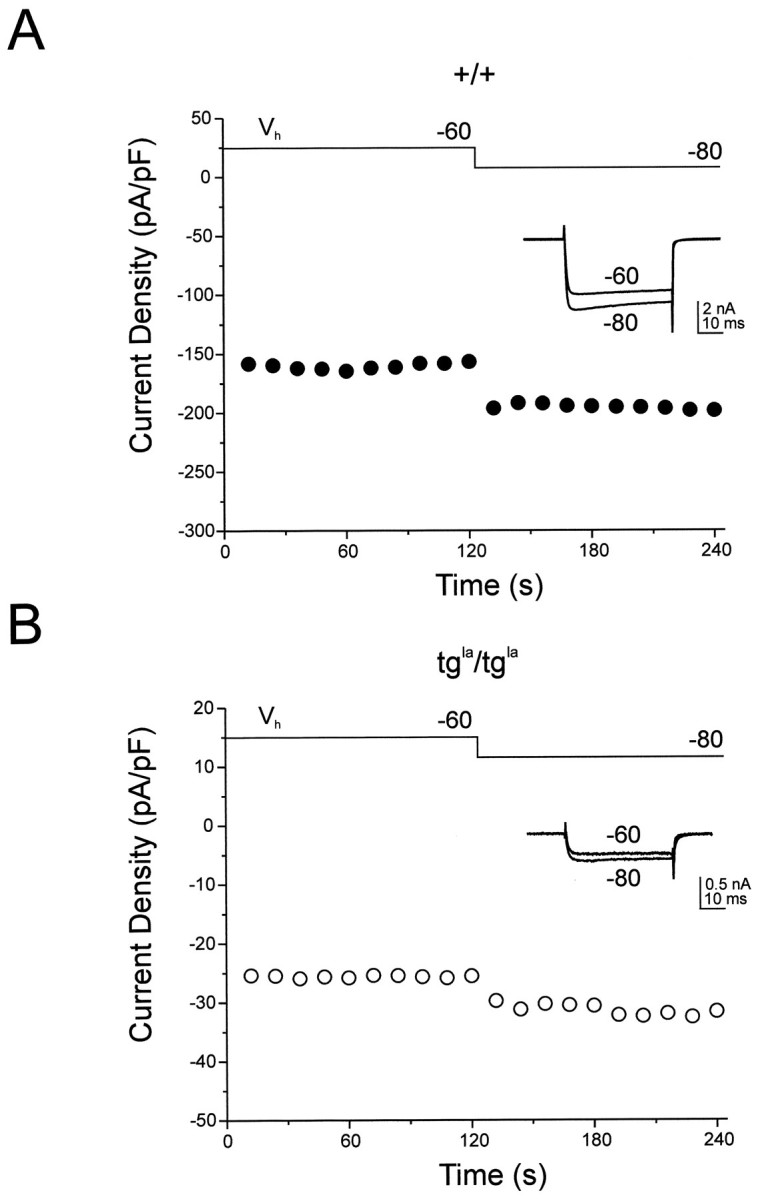
Relief of steady-state inactivation in +/+ and tgla/tgla Purkinje cells. Currents were elicited by a depolarizing test pulse to −10 mV from the indicated Vh. Currents were divided by cell capacitance and reported as current density. A, Time course of relief of steady-state inactivation after changing Vh from −60 to −80 mV is shown for a +/+ Purkinje cell. B, Time course of relief of steady-state inactivation after changing Vhfrom −60 to −80 mV is shown for a tgla/tgla Purkinje cell.Insets, Superimposed current traceselicited from holding potentials of −60 and −80 mV are shown.
Pharmacology of HVA currents
HVA currents in Purkinje cells are predominately of the Aga-IVA–sensitive P-type. Approximately 90% of the HVA current in Purkinje cells is insensitive to either dihydropyridines or CTX-GVIA, suggesting very little contribution of L-and N-type channels (Regan, 1991; Regan et al., 1991; Mintz et al., 1992b). We investigated the pharmacological profile of HVA currents in tgla/tgla and +/+ Purkinje cells by applying nifedipine, CTX-GVIA, and Aga-IVA, antagonists of L-, N-, and P- and Q-type calcium channels, respectively.
As in previous experiments, HVA currents were elicited by test pulses to −10 mV. To ascertain the time course of block by calcium channel antagonists, currents were elicited continuously at 12 sec intervals. A baseline recording of 10 min was taken before bath application of nifedipine or CTX-GVIA to distinguish between current rundown and antagonist blockade. For both tgla/tgla (n = 9) and +/+ (n = 7) cells, the effect of CTX-GVIA was indistinguishable from the current rundown observed during the experiment, suggesting neither genotype exhibits a notable amount of N-type current. To ensure the concentration of CTX-GVIA used possessed reasonable activity, we applied the toxin to medial septum/diagonal band neurons on the same days of use. CTX-GVIA (500 nm) rapidly blocked ∼40% of HVA current in these neurons (data not shown), consistent with previous findings (Murchison and Griffith, 1996).
Unlike the results with CTX-GVIA, modest block by nifedipine was noticeable in both genotypes. There was no difference in either the development or magnitude of nifedipine block between tgla/tgla (6.2 ± 2.1%;n = 9) and +/+ (7.2 ± 2.4%; n = 6) cells. For both genotypes, the block was not fully reversible and in some cells could not be clearly distinguished from current rundown. Figure 5C summarizes the effects of the N- and L-type calcium channel antagonists. Bar graphs represent the current fraction remaining after application of the antagonists, with block by CTX-GVIA nominally 5%. Taken together, these data suggest that ∼90% of the HVA current in both genotypes is of the non-N–, non-L–type. Thus, it seems unlikely that tgla/tgla Purkinje cells develop additional N- or L-type calcium channels to compensate for the decrease in α1A-mediated current.
Fig. 5.

Antagonist block of HVA current in +/+ and tgla/tgla Purkinje cells. Currents were elicited by depolarizing test pulses to −10 mV (40 msec) from Vh = −60 mV at 12 sec intervals. A, Time course of block by Aga-IVA is shown for a +/+ Purkinje cell.Inset, Superimposed current records showtraces before and after application of Aga-IVA (100 nm). B, Time course of block by Aga-IVA is shown for a tgla/tgla Purkinje cell. Inset, Superimposed current records showtraces before and after application of Aga-IVA (100 nm). C, Current fractions in +/+ (shaded) and tgla/tgla (open) Purkinje cells are shown. Bar graphs with error bars show current remaining after maximum blockade. Percent blockade was corrected for gradual current rundown. The effect of CTX-GVIA was indistinguishable from current rundown in both +/+ (n = 7 cells) and tgla/tgla (n= 9 cells) Purkinje cells (nominally 5%). There were no significant differences in the amount of current blockade by nifedipine in +/+ (n = 6 cells) and tgla/tgla (n= 9 cells) cells or by Aga-IVA in +/+ (n = 4) and tgla/tgla (n= 5 cells) cells.
We used Aga-IVA to confirm that the HVA current recorded in tgla/tgla and +/+ Purkinje cells was mediated by α1A-containing channels. We applied 100 nm Aga-IVA via a single-barrel drug pipette positioned adjacent to the test cell. Although this concentration is too high to differentiate P-type from Q-type channels (Birnbaumer et al., 1994), Purkinje cells are thought to possess the former (Llinas et al., 1989,1992; Regan, 1991; Usowicz et al., 1992). Figure 5, A andB, shows the time course of block by Aga-IVA in +/+ and tgla/tgla cells, respectively. Neither the development nor the magnitude of block by Aga-IVA appeared to differ between the two genotypes. The insets in Figure 5,A and B, show superimposed current traces recorded before and after application of 100 nm Aga-IVA. This concentration of Aga-IVA (100 nm) routinely blocked 80–95% of the HVA current in both genotypes. The average amount of block by Aga-IVA was not different in +/+ (85.9 ± 2.9%;n = 4) and tgla/tgla (85.5 ± 2.1%;n = 5) Purkinje cells (Fig. 5C). For both genotypes, maximal blockade was consistent with that reported previously (Mintz et al., 1992a,b), in which Aga-IVA concentrations between 60 and 200 nm blocked 85–100% of the HVA current in rat Purkinje cells. In both genotypes, Aga-IVA at concentrations as low as 20 nm was sufficient to block 75–80% of the HVA current over a longer time course (data not shown). Cadmium (100 μm) blocked the remaining current in both genotypes. These results suggest little difference in sensitivity to Aga-IVA and confirm the presence of P-type calcium current in both tgla/tgla and +/+ Purkinje cells.
Single-channel conductance
Unitary current recordings were made from cell-attached patches of tgla/tgla and +/+ Purkinje cells to examine properties of single-channel currents. The patch potential was maintained at −60 mV, and currents were elicited by 300 msec voltage steps to the indicated potentials. We first sought to compare the single-channel conductance of the HVA channels in tgla/tgla cells with that in +/+ cells, because an alteration in this property might account for the reduced whole-cell current. Figure 6shows examples of current traces recorded in a tgla/tgla (Fig.6A) and a +/+ (Fig. 6C) patch. With 110 Ba2+ as charge carrier and 10 μmnifedipine included in the patch pipette, we observed current openings to three distinct amplitude levels. Consistent with a previous study, these three current levels were present throughout the 300 msec voltage step and were apparent when the holding potential varied from −60 to −90 mV (Usowicz et al., 1992). When plotted against test potential, currents from 12 +/+ patches yielded slope conductances of 9, 14, and 17 pS (Fig. 6B) with unitary currents of 0.65, 1.14, and 1.62 pA at −10 mV. For eight tgla/tgla patches, slope conductances were 9, 13, and 18 pS (Fig. 6D) with unitary currents of 0.64, 1.13, and 1.62 pA at −10 mV. This suggests that no difference in slope conductance exists between +/+ and tgla/tgla channels. For both genotypes, the slope conductances are in excellent agreement with the 9, 14, and 19 pS conductances previously ascribed to native P-type channels in cerebellar Purkinje cells (Usowicz et al., 1992).
Fig. 6.

Conductance of single calcium channels in +/+ and tgla/tgla Purkinje cells. Single-channel currents were recorded from cell-attached patches with 110 mm Ba2+ in the patch pipette. Currents were elicited by 300 msec steps to the indicated potential from a holding potential of −60 mV at 4 sec intervals. Currents were low-pass filtered at 2 kHz and digitally acquired at 10 kHz.A, Single-channel current records from a +/+ patch are shown. Three open levels are indicated on the bottom trace. B, Single-channelI–V plot yields three distinct slope conductances as labeled. C, Single-channel current records from a tgla/tgla patch are shown. Open levels are indicated on the bottom trace. D, Single-channelI–V plot yields three distinct slope conductances as labeled.
Because the patch potential in the above analysis was −60 mV, it is highly unlikely the lowest conductance level represents a T-type channel. Additionally, the currents recorded showed little to no time-dependent inactivation, further arguing against the presence of T-type channels. Although conductances of 18–19 pS are in the range reported for L-type channels (Bean, 1989), the presence of 10 μm nifedipine in the patch pipette eliminates their presence. The unitary conductances are also in the range reported for N-type channels (Fox et al., 1987). However, the virtual insensitivity of whole-cell currents to 500 nm CTX-GVIA suggests that the mouse Purkinje cells in our study lack any substantial N-type current. Although we observed patches from both genotypes with superimposed openings indicative of the presence of multiple channels, we limited our analysis to patches in which only a single channel was apparent. Therefore it seems probable that the three conductance levels we observed represent subconductance levels of a single type of calcium channel, most likely the P-type channel as described previously (Usowicz et al., 1992).
Open-probability
Another possible explanation for the reduced whole-cell current observed in tgla/tgla Purkinje cells is a reduction in channel open-probability. We sought to compare patch NPo for tgla/tgla and +/+ Purkinje cells. From a patch potential of −60 mV, currents were elicited with 300 msec voltage steps to −10 mV. Routinely, >40 individual current sweeps were averaged to determine NPo for a patch. For nine +/+ patches, the mean NPoequaled 0.13 ± 0.02. For nine tgla/tgla patches, we observed a significant reduction in NPo (0.04 ± 0.01; p < 0.001). Figure7 shows 10 consecutive sweeps for a +/+ patch in which NPo = 0.10 (Fig.7A) and for a tgla/tgla patch in whichNPo = 0.02 (Fig. 7C). For both patches shown in Figure 7, A and C,NPo is plotted against sweep episode in Figure 7, B and D, respectively. Figure7D demonstrates that the general reduction inNPo observed in tgla/tgla patches is not attributable to a preponderance of blank sweeps. For the 45 sweeps displayed for the tgla/tgla patch in Figure 7D, three blank sweeps were observed. For the 45 sweeps displayed for the +/+ patch in Figure 7B, no blank sweeps were observed. This is consistent with the other patches in the analysis, in which the occurrence of blank sweeps was slightly higher for tgla/tgla (7%) than for +/+ (2%) patches.
Fig. 7.

Patch open-probability (NPo) for cell-attached patches of +/+ and tgla/tgla Purkinje cells. Currents were elicited by 300 msec steps to −10 mV from a holding potential of −60 mV at 4 sec intervals. Currents were low-pass filtered at 2 kHz and digitally acquired at 10 kHz. Currents are displayed here with a 1 kHz filter imposed. A, Ten consecutive current traces recorded from a +/+ patch are shown. B, For the +/+ patch in A,NPo has been calculated for individual sweeps. NPo is displayed for 45 consecutive sweeps in which the total patchNPo is 0.10. C, Ten consecutive current traces recorded from a tgla/tgla patch are shown.D, For the tgla/tgla patch inC, NPo is displayed for 45 consecutive sweeps in which the total patchNPo is 0.02.
The mean open time of the channels in tgla/tgla and +/+ patches was assessed by plotting the open-time histograms. For construction of open-time histograms, openings to all conductance levels were included. The distributions were generally well described by a single exponential. Figure 8 shows current traces for a +/+ (Fig. 8A) and a tgla/tgla (Fig. 8C) patch. The open-time histograms for the patches in Figure 8,A and C, are presented in Figure 8, Band D, respectively. Note the difference in number of events for the tgla/tgla patch relative to that for the +/+ patch. For the +/+ patch in Figure8B, the fit of the open-time histogram yields a time constant of 0.19 msec. For the tgla/tgla patch in Figure8D, a time constant of 0.15 msec was calculated. These fits were representative of the two genotypes, with the average time constant for +/+ patches equal to 0.18 ± 0.01 and that for tgla/tgla patches equal to 0.15 ± 0.01. These open times are consistent with previous examination (Usowicz et al., 1992). Although mean open times do not appear substantially different for the two genotypes,NPo is markedly reduced in cell-attached patches from tgla/tgla Purkinje cells. This generalized reduction in NPomay explain the significant diminution in whole-cell current observed in tgla/tgla Purkinje cells.
Fig. 8.

Mean open times of calcium channels from +/+ and tgla/tgla Purkinje cells. Calcium currents were elicited by 300 msec steps to −10 mV from a holding potential of −60 mV at 4 sec intervals. Currents were low-pass filtered at 2 kHz and digitally acquired at 10 kHz. A, Single-channel current records from a +/+ patch. B, Open-time histogram for the +/+ patch shown in A, fitted with a single exponential. C, Single-channel current records from a tgla/tgla patch.D, Open-time histogram for the tgla/tgla patch shown inC, fitted with a single exponential.
DISCUSSION
The tgla mutation occurs in a gene encoding the α1A calcium channel subunit (Fletcher et al., 1996). Based on electrophysiological recordings (Sather et al., 1993; Zhang et al., 1993; Stea et al., 1994; Gillard et al., 1997) and anatomical localization (Stea et al., 1994; Westenbroek et al., 1995), α1A is thought to be the pore-forming subunit of P- and/or Q-type voltage-activated calcium channels. The tgla mutation results in an out-of-frame splicing event and is predicted to yield novel α1A subunits with truncated C-terminal tails. Recent evidence shows that neither α1A mRNA expression nor α1A protein expression are altered in the cerebella of homozygous tgla/tgla mice (Lau et al., 1998). In this study we demonstrate the effects of the tgla mutation on P-type calcium channel function in cerebellar Purkinje cells.
The tgla mutation causes a distinct reduction in whole-cell P-type calcium current in Purkinje cells of 18–35-d-old tgla/tgla mice, an age range when the leaner phenotype is readily identifiable. A recent report has shown that whole-cell calcium currents are reduced in Purkinje cells of 7–9-d-old tgla/tgla mice (Lorenzon et al., 1998), an age range that precedes the cerebellar cell loss and ataxia characteristic of the leaner phenotype. The reduced current we observed is accompanied by little to no effect on the voltage dependence of channel gating or on antagonist sensitivity. Whole-cell current I is given by the product of single-channel unitary current i, the number of functional channels N, and channel open-probabilityPo: I =iNPo. We examined properties of single channels to determine whether an alteration in one of the these parameters might underlie the reduced whole-cell current in tgla/tgla Purkinje cells. We observed no difference in single-channel conductances between the two genotypes. Our observations confirm the presence of three distinct conductance levels in cerebellar Purkinje cells, with the three levels being consistent with the previously described subconductance levels of native P-type channels (Usowicz et al., 1992). Amplitude histograms (data not shown) reveal that all three conductance levels appear in approximately the same proportions in the two genotypes, with the lower two levels predominating. Thus, it is highly unlikely a change in unitary current accounts for the reduced whole-cell current in tgla/tgla Purkinje cells.
Analysis of patch NPo with cell-attached recordings revealed marked differences for +/+ and tgla/tgla Purkinje cells. Relative to +/+, there was a threefold lower probability of opening observed in tgla/tgla patches. Interestingly, the observance of lower probability was not reflected in a reduction of channel mean open time. Rather, the reduction inNPo seems to result from a lower frequency of channel opening in tgla/tglapatches. It should be noted that because of the extremely low probability of channel opening observed, it is difficult to know with certainty the number of channels within individual patches (Colquhoun and Hawkes, 1990; Horn, 1991). However, because it was possible to clearly discern patches with multiple channels, we are confident our analysis of open-probability is a reasonable reflection of single-channel activity. Thus, these results suggest that a lower channel open-probability is likely to underlie the reduction of whole-cell currents recorded in tgla/tgla Purkinje cells. We have not, however, unequivocally eliminated the possibility that a reduction in the number of functional channels may contribute to both the reduced whole-cell current and the reduced patch open-probability. An interesting observation was the higher frequency of inactive patches from tgla/tgla Purkinje cells. Of 41 tgla/tgla patches examined, slightly more than half lacked activity or displayed activity so low as to not be distinguishable from random noise. This lack of activity prevailed even at extremely hyperpolarized patch potentials (negative to −90 mV). By contrast, only 3 of 24 +/+ patches lacked activity. The absence of activity did not obviously correlate with the positioning of the patch pipette on the cell soma. Although the differential observation of inactive patches may be accounted for by subtle differences in pipette tip diameter and pipette positioning, it does raise the possibility of reduced functional channels on the membrane of tgla/tgla Purkinje cells.
The functional consequences of the leaner mutation may help elucidate the putative role of the C-terminal tail in modulating calcium channel function. Discrete structural motifs of α1 proteins play vital roles in influencing channel gating, ion selectivity, and antagonist binding (Catterall and Striessnig, 1992; Mori et al., 1996). The functional significance of the C terminal has only recently been explored, however. In cardiac L-type channels, the C-terminal region seems to play an important regulatory role in both channel gating and channel availability (Wei et al., 1994; Klockner et al., 1995; Soldatov et al., 1997). Amino acid deletions in the C terminal from rabbit cardiac α1C result in a four- to sixfold increase in current density without changing the number of functional channels (Wei et al., 1994). The increase in current density has been attributed to an increased Po. A similar increase in current density as well as a slight alteration in the voltage dependence of inactivation results from removal of part of the C terminal from the human cardiac α1C subunit (Klockner et al., 1995). In contrast to these results, our analysis reveals that truncations in the α1A subunit result in a marked decrease in current density because of a reducedPo. It should be noted, however, that the truncated tails resulting from the tgla mutation are also predicted to have novel amino acid sequences. Such alterations could interfere with essential cytoplasmic interactions of the C terminal responsible for normal channel gating and channel availability, thus leading to a reducedPo.
The present study demonstrates in native cells the functional consequences of tgla, a mutation in the α1A calcium channel subunit. Although the functional properties of α1A appear significantly altered in tgla/tgla Purkinje cells, less obvious is how these alterations ultimately lead to the severe cerebellar ataxia and degeneration of cerebellar neurons observed in tgla/tgla mice (Herrup and Wilczynski, 1982). Interestingly, there seems to be a close association between mutations in α1A and the presence of cerebellar ataxia. In humans, separate mutations in α1A lead to the disorders autosomal dominant cerebellar ataxia (Zhuchenko et al., 1997), episodic ataxia type-2, and familial hemoplegic migraine (Ophoff et al., 1996). Whether any of these mutations effect calcium channel function in a manner similar to that of tglaremains uncertain. In any regard, our results represent an important first step in determining the functional consequences of mutations in the α1A subunit and suggest these neurological mutations can alter native P-type calcium channels at the single-channel level.
Footnotes
This work was supported in part by National Institutes of Health Grants AG07805 (W.H.G.) and NS01681 (L.C.A.) and by Texas A&M University Interdisciplinary Research Initiatives (W.H.G. and L.C.A.).
Correspondence should be addressed to Dr. William H. Griffith, Department of Medical Pharmacology and Toxicology, College of Medicine, Texas A&M University Health Science Center, College Station, TX 77843-1114.
REFERENCES
- 1.Bean BP. Classes of calcium channels in vertebrate cells. Annu Rev Physiol. 1989;51:367–384. doi: 10.1146/annurev.ph.51.030189.002055. [DOI] [PubMed] [Google Scholar]
- 2.Berrow NS, Brice NL, Tedder I, Page KM, Dolphin AC. Properties of cloned rat α1A calcium channels transiently expressed in the COS-7 cell line. Eur J Neurosci. 1997;9:739–748. doi: 10.1111/j.1460-9568.1997.tb01422.x. [DOI] [PubMed] [Google Scholar]
- 3.Birnbaumer L, Campbell KP, Catterall WA, Harpold MM, Hofmann F, Horne WA, Mori Y, Schwartz A, Snutch TP, Tanabe T, Tsien RW. The naming of voltage-gated calcium channels. Neuron. 1994;13:505–506. doi: 10.1016/0896-6273(94)90021-3. [DOI] [PubMed] [Google Scholar]
- 4.Catterall WA, Striessnig J. Receptor sites for Ca2+ channel antagonists. Trends Pharmacol. 1992;13:256–262. doi: 10.1016/0165-6147(92)90079-l. [DOI] [PubMed] [Google Scholar]
- 5.Colquhoun D, Hawkes AG. Stochastic properties of ion channel openings and bursts in a membrane patch that contains two channels: evidence concerning the number of channels present when a record containing only single openings is observed. Proc R Soc Lond [Biol] 1990;240:453–477. doi: 10.1098/rspb.1990.0048. [DOI] [PubMed] [Google Scholar]
- 6.Colquhoun D, Sigworth F. Fitting and statistical analysis of single-channel records. In: Sakman B, Neher E, editors. Single-channel recording. Plenum; New York: 1983. pp. 191–263. [Google Scholar]
- 7.Fletcher CF, Lutz CM, O’Sullivan TN, Shaughnessy JD, Hawkes R, Frankel WN, Copeland NG, Jenkins NA. Absence epilepsy in tottering mutant mice is associated with calcium channel defects. Cell. 1996;87:607–617. doi: 10.1016/s0092-8674(00)81381-1. [DOI] [PubMed] [Google Scholar]
- 8.Fox A, Nowycky MC, Tsien RW. Single-channel recordings of three types of calcium channels in chick sensory neurones. J Physiol (Lond) 1987;394:173–200. doi: 10.1113/jphysiol.1987.sp016865. [DOI] [PMC free article] [PubMed] [Google Scholar]
- 9.Gillard SE, Volsen SG, Smith W, Beattie RE, Bleakman D, Lodge D. Identification of pore-forming subunit of P-type calcium channels: an antisense study on rat cerebellar Purkinje cells in culture. Neuropharmacology. 1997;36:405–409. doi: 10.1016/s0028-3908(97)00046-4. [DOI] [PubMed] [Google Scholar]
- 10.Hamill OP, Marty A, Neher E, Sakmann B, Sigworth F. Improved patch-clamp techniques for high-resolution current recordings from cells and cell-free patches. Pflügers Arch. 1981;391:85–100. doi: 10.1007/BF00656997. [DOI] [PubMed] [Google Scholar]
- 11.Herrup K, Wilczynski SL. Cerebellar cell degeneration in the leaner mutant mouse. Neuroscience. 1982;7:2185–2196. doi: 10.1016/0306-4522(82)90129-4. [DOI] [PubMed] [Google Scholar]
- 12.Horn R. Estimating the number of channels in patch recordings. Biophys J. 1991;60:433–439. doi: 10.1016/S0006-3495(91)82069-0. [DOI] [PMC free article] [PubMed] [Google Scholar]
- 13.Kaneda M, Wakamori M, Ito C, Akaike N. Low-threshold calcium current in isolated Purkinje cell bodies of rat cerebellum. J Neurophysiol. 1990;63:1046–1051. doi: 10.1152/jn.1990.63.5.1046. [DOI] [PubMed] [Google Scholar]
- 14.Klockner U, Mikala G, Varadi G, Schwartz A. Involvement of the carboxyl-terminal region of the α1 subunit in voltage-dependent inactivation of cardiac calcium channels. J Biol Chem. 1995;270:17306–17310. doi: 10.1074/jbc.270.29.17306. [DOI] [PubMed] [Google Scholar]
- 15.Lau FC, Abbott LC, Rhyu IJ, Kim DS, Chin H (1998) Expression of calcium channel α1A mRNA and protein in the leaner mouse (tgla/tgla) cerebellum. Mol Brain Res, in press. [DOI] [PubMed]
- 16.Llinas R, Sugimori M, Lin J-W, Cherskey B. Blocking and isolation of a calcium channel from neurons in mammals and cephalopods utilizing a toxin fraction (FTX) from funnel web spider poison. Proc Natl Acad Sci USA. 1989;86:1689–1693. doi: 10.1073/pnas.86.5.1689. [DOI] [PMC free article] [PubMed] [Google Scholar]
- 17.Llinas R, Sugimori M, Hillman DE, Cherskey B. Distribution and functional significance of the P-type, voltage-dependent Ca2+ channels in the mammalian central nervous system. Trends Neurosci. 1992;15:351–355. doi: 10.1016/0166-2236(92)90053-b. [DOI] [PubMed] [Google Scholar]
- 18.Lorenzon NM, Lutz CM, Frankel WN, Beam KG. Altered calcium channel currents in Purkinje cells of the neurological mutant mouse leaner. J Neurosci. 1998;18:4482–4489. doi: 10.1523/JNEUROSCI.18-12-04482.1998. [DOI] [PMC free article] [PubMed] [Google Scholar]
- 19.Miller RJ. Calcium channels prove to be real headache. Trends Neurosci. 1997;20:189–192. doi: 10.1016/s0166-2236(96)01037-5. [DOI] [PubMed] [Google Scholar]
- 20.Mintz IM, Venema VJ, Swiderek KM, Lee TD, Bean BP, Adams ME. P-type calcium channels blocked by the spider toxin ω-Aga-IVA. Nature. 1992a;355:827–829. doi: 10.1038/355827a0. [DOI] [PubMed] [Google Scholar]
- 21.Mintz IM, Adams ME, Bean BP. P-type calcium channels in rat central and peripheral neurons. Neuron. 1992b;9:85–95. doi: 10.1016/0896-6273(92)90223-z. [DOI] [PubMed] [Google Scholar]
- 22.Moreno H, Rudy B, Llinas R. β subunits influence the biophysical and pharmacological differences between the P- and Q-type calcium currents expressed in a mammalian cell line. Proc Natl Acad Sci USA. 1997;94:14042–14047. doi: 10.1073/pnas.94.25.14042. [DOI] [PMC free article] [PubMed] [Google Scholar]
- 23.Mori Y, Friedrich T, Kim M-S, Mikami A, Nakai J, Ruth P, Boss E, Hofmann F, Flockerzi V, Furuichi T, Mikoshiba K, Imoto K, Tanabe T, Numa S. Primary structure and functional expression from complementary DNA of a brain calcium channel. Nature. 1991;350:398–402. doi: 10.1038/350398a0. [DOI] [PubMed] [Google Scholar]
- 24.Mori Y, Mikala G, Varadi G, Kobayashi T, Koch S, Wakamori M, Schwartz A. Molecular pharmacology of voltage-dependent calcium channels. Jpn J Pharmacol. 1996;72:83–109. doi: 10.1254/jjp.72.83. [DOI] [PubMed] [Google Scholar]
- 25.Mouginot D, Bossu J-L, Gahwiler BH. Low-threshold currents in dendritic recordings from Purkinje cells in rat cerebellar slice cultures. J Neurosci. 1997;17:160–170. doi: 10.1523/JNEUROSCI.17-01-00160.1997. [DOI] [PMC free article] [PubMed] [Google Scholar]
- 26.Murchison D, Griffith WH. High-voltage activated calcium currents in basal forebrain neurons during aging. J Neurophysiol. 1996;76:158–174. doi: 10.1152/jn.1996.76.1.158. [DOI] [PubMed] [Google Scholar]
- 27.Ophoff RA, Terwindt GM, Vergouwe MN, van Eijk R, Oefner PJ, Hoffman SMG, Lamerdin JE, Mohrenweiser HW, Bulman DE, Ferrari M, Haan J, Lindhout D, van Ommen G-JB, Hofker MH, Ferrari MD, Frants RR. Familial hemiplegic migraine and episodic ataxia type-2 are caused by mutations in the calcium channel gene CACNL1A4. Cell. 1996;87:543–552. doi: 10.1016/s0092-8674(00)81373-2. [DOI] [PubMed] [Google Scholar]
- 28.Perez-Reyes E, Schneider T. Calcium channels: structure, function, and classification. Drug Dev Res. 1994;33:295–318. [Google Scholar]
- 29.Regan LJ. Voltage-dependent calcium currents in rat cerebellar vermis. J Neurosci. 1991;11:2259–2269. doi: 10.1523/JNEUROSCI.11-07-02259.1991. [DOI] [PMC free article] [PubMed] [Google Scholar]
- 30.Regan LJ, Sah DYW, Bean BP. Ca2+ channels in rat central and peripheral neurons: high-threshold current resistant to dihydropyridine blockers and ω-conotoxin. Neuron. 1991;6:269–280. doi: 10.1016/0896-6273(91)90362-4. [DOI] [PubMed] [Google Scholar]
- 31.Reynolds JN, Prasad A, MacDonald JF. Ethanol modulation of GABA receptor-activated Cl− currents in neurons of the chick, rat and mouse central nervous system. Eur J Pharmacol. 1992;224:173–181. doi: 10.1016/0014-2999(92)90802-b. [DOI] [PubMed] [Google Scholar]
- 32.Sather WA, Tanabe T, Zhang J-F, Mori Y, Adams ME, Tsien RW. Distinctive biophysical and pharmacological properties of class A (BI) calcium channel α1 subunits. Neuron. 1993;11:291–303. doi: 10.1016/0896-6273(93)90185-t. [DOI] [PubMed] [Google Scholar]
- 33.Soldatov NM, Zuhlke RD, Bouron A, Reuter H. Molecular structures involved in L-type calcium channel inactivation. J Biol Chem. 1997;272:3560–3566. doi: 10.1074/jbc.272.6.3560. [DOI] [PubMed] [Google Scholar]
- 34.Starr TVB, Prystay W, Snutch TP. Primary structure of a calcium channel that is highly expressed in the rat cerebellum. Proc Natl Acad Sci USA. 1991;88:5621–5625. doi: 10.1073/pnas.88.13.5621. [DOI] [PMC free article] [PubMed] [Google Scholar]
- 35.Stea A, Tomlinson WJ, Wah Soong T, Bourinet E, Dubel SJ, Vincent SR, Snutch TP. Localization and functional expression of a rat brain α1A calcium channel reflect similarities to neuronal Q- and P-type channels. Proc Natl Acad Sci USA. 1994;91:10576–10580. doi: 10.1073/pnas.91.22.10576. [DOI] [PMC free article] [PubMed] [Google Scholar]
- 36.Tsien RW, Ellinor PT, Horne WA. Molecular diversity of voltage-dependent Ca2+ channels. Trends Pharmacol. 1991;12:349–354. doi: 10.1016/0165-6147(91)90595-j. [DOI] [PubMed] [Google Scholar]
- 37.Usowicz MM, Sugimori M, Cherskey B, Llinas R. P-type calcium channels in the somata and dendrites of adult cerebellar Purkinje cells. Neuron. 1992;9:1185–1199. doi: 10.1016/0896-6273(92)90076-p. [DOI] [PubMed] [Google Scholar]
- 38.Wei X, Neely A, Lacerda AE, Olcese R, Stefani E, Perez-Reyes E, Birnbaumer L. Modification of Ca2+ channel activity by deletions at the carboxyl terminus of the cardiac α1 subunit. J Biol Chem. 1994;269:1635–1640. [PubMed] [Google Scholar]
- 39.Westenbroek RE, Sakurai T, Elliot EM, Hell JW, Starr TVB, Snutch TP, Catterall WA. Immunochemical identification and subcellular distribution of the α1A subunits of brain calcium channels. J Neurosci. 1995;15:6403–6418. doi: 10.1523/JNEUROSCI.15-10-06403.1995. [DOI] [PMC free article] [PubMed] [Google Scholar]
- 40.Zhang J-F, Randall AD, Ellinor PT, Horne WA, Sather WA, Tanabe T, Schwartz TL, Tsien RW. Distinctive pharmacology and kinetics of cloned neuronal Ca2+ channels and their possible counterparts in mammalian CNS neurons. Neuropharmacology. 1993;32:1075–1088. doi: 10.1016/0028-3908(93)90003-l. [DOI] [PubMed] [Google Scholar]
- 41.Zhuchenko O, Bailey J, Bonnen P, Ashizawa T, Stockton DW, Amos C, Dobyns WB, Subramony SH, Zoghbi HY, Lee CC. Autosomal dominant cerebellar ataxia (SCA6) associated with small polyglutamine expansions in the α1A-voltage-dependent calcium channel. Nat Genet. 1997;15:62–69. doi: 10.1038/ng0197-62. [DOI] [PubMed] [Google Scholar]