

Abstract
Responses of low-frequency neurons in the inferior colliculus (IC) of anesthetized guinea pigs were studied with binaural beats to assess their mean best interaural phase (BP) to a range of stimulating frequencies. Phase plots (stimulating frequency vs BP) were produced, from which measures of characteristic delay (CD) and characteristic phase (CP) for each neuron were obtained. The CD provides an estimate of the difference in travel time from each ear to coincidence-detector neurons in the brainstem. The CP indicates the mechanism underpinning the coincidence detector responses. A linear phase plot indicates a single, constant delay between the coincidence-detector inputs from the two ears. In more than half (54 of 90) of the neurons, the phase plot was not linear. We hypothesized that neurons with nonlinear phase plots received convergent input from brainstem coincidence detectors with different CDs. Presentation of a second tone with a fixed, unfavorable delay suppressed the response of one input, linearizing the phase plot and revealing other inputs to be relatively simple coincidence detectors. For some neurons with highly complex phase plots, the suppressor tone altered BP values, but did not resolve the nature of the inputs. For neurons with linear phase plots, the suppressor tone either completely abolished their responses or reduced their discharge rate with no change in BP. By selectively suppressing inputs with a second tone, we are able to reveal the nature of underlying binaural inputs to IC neurons, confirming the hypothesis that the complex phase plots of many IC neurons are a result of convergence from simple brainstem coincidence detectors.
Keywords: binaural hearing, interaural phase differences, inferior colliculus, phase plots, convergent binaural input, suppressor tones
Localization of low-frequency (<1500 Hz) sounds in azimuth is based on the sensitivity of the auditory system to small differences in the timing of the sound at each ear (Rayleigh, 1907). At low frequencies, these time differences give rise to interaural phase differences (IPDs). Neurons in the medial superior olive (MSO) of the superior olivary complex (SOC) receive excitatory input from both ears via axons of different lengths, providing the basis for a mechanism first proposed by Jeffress (1948), in which a series of coincidence detectors, fed by delay lines, convert interaural time differences (ITDs) into changes in neuronal discharge rate (Goldberg and Brown, 1969; Yin and Chan, 1990; Spitzer and Semple, 1995, Batra et al., 1997). In this simple model, coincidences result in maximal or peak discharge rates (peak-type). The difference in the conduction time from each ear [the characteristic delay (CD)] offsets the time delay caused by the sound source location. The CD can be estimated from the slope of the function relating best interaural phase to stimulus frequency (the phase plot) which, for simple coincidence detectors, is a linear function. Other neurons, either in the MSO or in the lateral superior olive (LSO) are believed to receive excitation from one ear and inhibition from the other to produce sensitivity to interaural time differences (Goldberg and Brown, 1969; Finlayson and Caspary, 1991; Batra et al., 1997; Joris, 1996): coincidental arrival of the activity from contralateral ear inhibits the response elicited by the ipsilateral ear to give a CD at a minimum in the discharge rate (trough-type).
Although the SOC is the primary site of binaural interactions, the inferior colliculus (IC; the target nucleus for the brainstem neurons) has been the subject of the majority of studies of low-frequency binaural hearing (Yin and Kuwada, 1983a,b; Kuwada et al., 1987, 1989;Palmer et al., 1990, McAlpine et al., 1996). Many IC neurons show either nonlinear phase plots or linear phase plots whose CD is at neither a peak nor a trough in the delay function (intermediate-type). Such phase plots are incompatible with simple coincidence detection when the inputs are matched in frequency. A likely explanation for their appearance in the IC is the convergence of inputs from the lower brainstem nuclei onto single IC neurons (Beyerl, 1978; Adams, 1979;Brunso-Bechtold et al., 1981).
Here, we investigate whether such convergence provides an adequate explanation for nonlinear and intermediate-type phase plots in the IC. By selectively inactivating inputs to an IC neuron using a suppressor tone, we can reveal the delay characteristics of its other inputs. The data are consistent with the hypothesis that nonlinear and intermediate-type phase plots result from convergence, at the level of the IC, of inputs from coincidence detectors in the lower brainstem. After selective suppression, the neurons often showed linear phase plots, indicative of simple peak-type or trough-type behavior.
MATERIALS AND METHODS
Preparation and recording. Recordings were made from the right IC of 300–400 gm guinea pigs anesthetized with Urethane (1.3 gm/kg in 20% solution) with additional analgesia obtained using phenoperidine (1 mg/kg). A premedication of atropine sulfate (0.06 mg/kg) was administered to reduce bronchial secretions. Supplementary doses of Urethane (one-half to one-third of the induction dose) or phenoperidine were administered when required. All animals were tracheotomised, and core temperature was maintained at 37°C with a heating blanket and rectal probe. Most animals respired spontaneously, but a few were artificially respired with 95% O2 and 5% CO2, and end-tidal CO2 was monitored.
All experiments were conducted in a sound-attenuating chamber. The animals were placed in a stereotaxic frame with hollow earbars into which fitted 12.7 mm Brüel and Kjær condenser earphones, and 1 mm probe tubes fitted to 12.7 mm Brüel and Kjær microphones. In every experiment the probe tube microphone was used to calibrate the sound system in decibels re: 20 μPa a few millimeters from the tympanic membrane. The sound systems for each ear were flat to within ±5 dB from 100–10,000 Hz and were matched to within ±2 dB.
A silver wire electrode was placed on the round window of one side via a hole in the posterior aspect of the bulla, and the threshold of the cochlear action potential evoked by short tone pips (10 msec duration, 1 msec rise–fall time) was measured automatically as a function of frequency (from 500–30,000 Hz) periodically throughout the experiment to monitor the condition of the cochlea. A thin (0.5 mm diameter) polythene tube was sealed into the bulla of both sides to provide pressure equalization while maintaining closed-field recording conditions. Threshold elevations were generally either caused by deterioration of the preparation, which affected both ears equally, or build-up of fluid in the bulla. Given that the presence of the silver wire was a major cause of condensation and capillary action in causing the fluid build-up, monitoring of one ear only to detect systemic changes was considered sufficient.
Single-neuron action potentials were recorded using tungsten-in-glass microelectrodes (Merrill and Ainsworth, 1972; Bullock et al., 1988). After positioning the electrode stereotaxically to ∼2 mm above the surface of the IC, it was advanced in a dorsal-to-ventral direction using a Burleigh IW-700/710 Inchworm from outside the recording chamber.
Stimulus production and presentation. Stimuli were delivered separately to each ear via attenuators and closed-field sound systems. Search stimuli consisted of 50 msec bursts of white noise presented diotically. When a single neuron was isolated, its best frequency (BF) and threshold to binaural tones at zero interaural delay were determined audiovisually. The binaural frequency versus level response area of the neuron was then mapped for frequencies from two octaves above to four octaves below the BF of the neuron and in 5 dB steps from 20 dB below the audiovisually determined threshold at BF up to full-system output.
Binaural beats were used to examine the interaural delay sensitivity of IC neurons. Binaural beats are produced when tones of different frequencies are presented, one to each ear, using closed-field speakers (Yin and Kuwada, 1983a). The frequency difference causes the tones to move in and out of phase with each other, and the rate at which this occurs, equal to the frequency difference between the two tones, is known as the beat frequency. In the present study, the signal delivered to the left ear (contralateral to the recording site) was always 1 Hz greater than that delivered to the right (ipsilateral) ear. This resulted in the phase at the contralateral ear “leading” that at the ipsilateral ear during the first half-cycle. The total duration of each beat stimulus was 3000 msec and, with the entire range of possible IPDs being presented over each 1000 msec interval (1 Hz), this produced three complete cycles of IPD for every repetition of the beat stimulus. Ten repetitions of the three-cycle beat stimulus were presented, and the mean best phase (BP) and the vector strength (R) of the response to binaural beats, binned using 100 bins per cycle of IPD, were calculated from the middle two cycles of the beat response (from 0.5 to 2.5 cycles), using the method described by Goldberg and Brown (1969). The plots of the resulting IPD functions were binned using 50 bins per cycle of IPD for the sake of clarity. Binaural beats were presented over a range of different carrier frequencies, including BF, to examine the delay sensitivity as a function of the stimulating frequency. The number of frequencies examined ranged from 7 to 24, with a mean of 12 frequencies examined per neuron. Responses to binaural beats were measured at 50 Hz intervals, except for neurons with very low BFs (<200 Hz), in which responses were measured at 25 Hz intervals. From the responses at each frequency, the CD and characteristic phase (CP) values of the neurons were calculated. The CD is calculated as the slope of the plot of stimulating frequency versus BP, and the CP, the intersection of the regression line with the phase (ordinate) axis, gives an indication of the type of interaction. CD and CP values were obtained from the weighted, multiple regression of the resulting phase plots in a similar manner to that described by Kuwada et al. (1987) andSpitzer and Semple (1995), in which each data point in the phase plot was weighted by the vector strength of the response (Bevington and Robinson, 1992). Phase plots were considered linear if the linear regression component exceeded the 0.005 level of significance, and no other higher-order regression component was significant at this level. A CP close to zero indicates that the CD occurs near the peak of the delay function, a CP close to 0.5 indicates that the CD occurs near a trough in the delay function, and a CP between these values indicates that the CD occurs on the slope of the delay function (Rose et al., 1966; Yin and Kuwada, 1983b). Neurons with CPs within ±0.1 cycles of zero or 1.0 were classified as peak-type, and those with CPs within ± 0.1 cycles of ± 0.5 were classified as trough-type. All other neurons were classified as intermediate-type.
Suppressing binaural inputs with a worst-delay tone.Responses to binaural beats were also examined in the presence of a second tone with a fixed delay, chosen to suppress selected binaural inputs. The second, suppressing tone was presented at the same level as the binaural beat stimulus (usually +20 dB re: threshold). The frequency was chosen by visual inspection of the phase plot to be (1) effective in driving the neuron at some IPD and (2) within a relatively linear region of the phase plot. The fixed delay for the tone was selected to be the delay at which the neuron responded least (i.e., its worst, or most unfavorable, delay) judged from its binaural beat response at that frequency. The suppressor tone was presented simultaneously (summed electronically) with the binaural beat stimulus that was used to measure the delay sensitivity to the other frequencies. The BP and vector strength were again calculated from the middle two cycles of the response to the beats in the presence of the suppressor and, where possible, values of CD and CP were obtained.
RESULTS
Responses from 90 delay-sensitive neurons in the IC of 30 guinea pigs were examined using binaural beats. Phase plots for representative IC neurons are shown in Figure 1. Those on the top row (Figs. 1A–C) were linear according to our criterion and, thus, could be characterized by a single fixed delay, the CD. Forty percent (36 of 90) of IC neurons we recorded had linear phase plots; 22 neurons were peak-type (Fig.1A), 2 were trough-type (Fig. 1B), and 12 were intermediate-type (Fig. 1C). Those in the bottom row (Figs. 1D–F) are nonlinear and, as such, cannot be described as having a CD; the regression lines fitted to these plots serve merely to highlight the extent to which the phase plot deviated from linearity. Nonlinear phase plots accounted for 60% (54 of 90) of neurons recorded in our study. Thus, only 27% (24 of 90) of our sample had phase plots explicable in terms of simple brainstem coincidence detection (i.e., peak-type or trough-type).
Fig. 1.

Phase plots of six representative IC neurons. Those in the top row(A–C) were linear according to our criterion (see Materials and Methods), indicating peak-type (A), trough-type (B), or intermediate-type (C) responses. Those in thebottom row (D–F) were nonlinear. The regression lines for the nonlinear phase plots serve to highlight how poorly they fit the data.
We hypothesize that neurons with complex or intermediate-type phase plots receive convergent input from more than one binaural coincidence detector in the brainstem. The top part of Figure2 illustrates this hypothesis and the effect that it has on ITD processing in the IC. The diagram on the left of the panel is a schematic representation of two binaural inputs from the brainstem converging onto the same IC neuron in the midbrain. Shown in the middle of the top part are individual frequency versus level response areas of the brainstem inputs, as well as that of the IC neuron, whose response area is the combined response area of the two inputs. The IPD functions on the right illustrate the IPD sensitivity in response to a binaural beat at a particular frequency and level (solid dot inside response areas), for the two brainstem neurons, and the IPD sensitivity of the IC neuron which, once again, reflects the sum of the two inputs. It is this combining of IPD sensitivity from different binaural brainstem inputs that we hypothesize is responsible for the appearance of complex or intermediate-type phase plots. The bottom part of Figure 2 illustrates how this hypothesis might be tested. The schema is the same as in the top part of Figure 2, except that now another stimulus has been added. This stimulus, denoted by an asterisk in the response areas, is a tone fixed at its worst ITD, and it sits inside the response area of one of the brainstem inputs only. In the ideal scenario, the presumed effect is to suppress the response of that brainstem input. It thus no longer influences the response of the IC neuron. This suppression is reflected in the response of the IC neuron to binaural beats, which now shows the same IPD sensitivity as the remaining, unsuppressed brainstem input.
Fig. 2.

Schematic representation of the convergence hypothesis and how it has been tested. See Results for description.
We tested our hypothesis by examining the responses of 42 IC neurons to concurrent presentation of suppressor tones and binaural beats. Of these, 37 of 42 were defined as “complex,” having either nonlinear or intermediate-type phase plots, and 5 were “pure,” having either peak-type or trough-type phase plots.
IC neurons with linear peak-type or trough-type phase plots
Figure 3 shows responses from an IC neuron to binaural beats at 62 dB sound pressure level (SPL). The neuron responded to binaural beats at this stimulus level from 100 to 275 Hz, and responses were obtained at 25 Hz intervals. The resulting phase plot (Fig. 3A) indicates a CD of +853 μsec and a CP of −0.02, characteristic of peak-type units. The discharge of the unit to binaural beats as a function of time is shown as a peristimulus time histogram (PSTH) in Figure 3C for binaural beats at 225 Hz, in which responses to binaural beats presented alone are shown by the open bars. Because the stimulus is a 1 Hz binaural beat, the abscissa performs the function of both a time and an IPD axis; 3 sec of stimulus equates to three complete cycles of IPD. The open bars in Figures 3D–F show IPD histograms of the response at three frequencies: 225 (Fig. 3D, the same data as in Fig.3C), 200 (Fig. 3E), and 250 (Fig.3F) Hz. Finally, the data from all the different frequencies that contributed to the phase plot are plotted in Figure3B as a function of the interaural delay and indicate that the delays of the maxima at each frequency are closely aligned. When a 250 Hz suppressor was presented at its worst delay (+2674 μsec) and 62 dB SPL, no responses were evoked at any of the frequencies tested (125, 150, 172, or 225 Hz). This reflected the general ease with which we were able to suppress responses to binaural beats using worst delay tones. When a 125 Hz suppressor was presented at its worst delay (+4489 μsec) and 62 dB SPL, responses to binaural beats were evoked at 200, 225, and 250 Hz, but not at any other frequencies. These responses are shown as lines in Figures 3C–F. Clearly, they are attenuated relative to the response to the binaural beats alone. A similar pattern was observed for the other pure peak-type neurons examined. Responses were very poor, or completely absent, when a suppressor tone was presented simultaneously at the same stimulus level. Figure 3G replots the phase plot of Figure3A, but with the mean BP values to binaural beats alone at 200, 225, and 250 Hz now shown as open squares and the mean BP values obtained at these frequencies in the presence of the 125 Hz suppressor shown as circles. There is little change in the BP values in the presence of the suppressor.
Fig. 3.

Responses of an IC neuron with simple peak-type behavior. A, Phase plot constructed from BP indicates a CD of +853 μsec and a CP of −0.02. B, ITD functions constructed from the response to binaural beats (see Materials and Methods). C, PSTH showing the response to binaural beats at 225 Hz presented alone or simultaneously with a 125 Hz suppressor tone. D–F, IPD histograms showing the response to binaural beats at 225 (D), 200 (E), and 250 (F) Hz, presented either alone (open bars) or in the presence of the 125 Hz suppressor (lines). G, Phase plot showing the new mean BP values as open circles and the old values asopen squares.
A similar reduction in discharge without altering the BP is shown in Figure 4 for a linear, trough-type neuron; CP, 0.50; CD, −298 μsec (Fig. 4A, phase plot). The CD is indicated on the ITD functions in Figure4B by the vertical line. The PSTHs in Figure4C show the response to three cycles of a 1 Hz binaural beat at the BF of the neuron (478 Hz), either presented alone (open bars) or in the presence of a 300 Hz suppressor at worst delay (lines) and 61 dB SPL. Figures4D–F show IPD histograms for the binaural beat alone (open bars) or in the presence of increasing levels of suppressor (lines). As the level of the suppressor was increased, the discharge rate evoked by binaural beats was progressively reduced to that at the trough until, for the highest level suppressor (66 dB SPL; Fig. 4G), the neuron was not sensitive to the IPD. However, despite the progressive reduction in the discharge rate with increasing suppressor level, the BP to the 478 Hz beats remained unaltered (Fig. 4H).
Fig. 4.

Responses of an IC neuron with simple trough-type behavior. A, Linear phase plot with a CD of −298 μsec and a CP of +0.50. B, ITD functions constructed from the response to binaural beats and highlighting the symmetrical arrangement of the discharge rate peaks around the trough in the discharge rate.C, PSTH of the response to binaural beats at BF (478 Hz,open bars) and to binaural beats presented simultaneously with a 300 Hz suppressor (lines) at 61 dB SPL. D–G, IPD histograms to binaural beats at BF (open bars) and to binaural beats presented simultaneously with the suppressor (lines) at levels of 46 (D), 56 (E), 61 (F), and 66 (G) dB SPL. H, Plot of the BP at BF as a function of suppressor level. NDS, Not delay-sensitive.
Convergence of peak-type inputs
In Figure 5A, the phase plot shows that, for this neuron, BP first increased for frequencies up to 500 Hz, but then decreased with increasing frequency up to 800 Hz. Although fitting a single regression line to these data points gives a CD of +100 μsec and a CP of 0.06 (indicating a peak-type input), the linear fit is not significant at the 0.005 level. Alternatively, fitting two lines to the phase plot (Fig. 5B) gives two values of CD; a peak-type response (CP, −0.08) with a CD of +471 μsec over the lower-frequency region (250–500 Hz) and an intermediate-type response (CP, +0.22) with a CD of −134 μsec over the upper-frequency region (500–800 Hz, open circles). Neither approach is entirely satisfactory: either the IC neuron receives a single peak-type input with a poor linear fit, or it receives two inputs, one a peak-type and one an intermediate-type. The two linear fits independently meet our statistical criterion for linearity, but one is not consistent with simple coincidence detection. An alternative hypothesis is that two or more simple binaural inputs converge onto the IC neuron to produce the complex phase plot. As we demonstrate below, suppressing one input produces data consistent with this hypothesis.
Fig. 5.

A, Phase plot of an IC neuron with a BF of 679 Hz. B, Identical phase plot to that inA, except that here the phase plot has been divided into two local regions, each of which has been fitted with a regression line. C, PSTH of the response to binaural beats at 500 Hz alone (open bars) or presented simultaneously with a 300 Hz suppressor at worst delay (lines).D–G, IPD histograms to binaural beats (open bars) presented with the 300 Hz suppressor for binaural beat frequencies of 500 (D), 550 (E), 600 (F), and 650 (G) Hz. H, Phase plot showing BPs from the original phase plot in A (open squares) and BPs for the four frequencies in the presence of the worst delay tone (open circles). CD and CP values for the upper-frequency regions are shown (see Results for details).
Figure 5C shows the PSTH of the responses to three cycles of the 1 Hz binaural beats at 500 Hz either presented alone (open bars) or presented with a 300 Hz suppressor at worst delay (lines). At ∼300 Hz, the phase plot (Fig. 5B) is linear with a slope suggesting a single peak-type input, which dominates that frequency region. From the period histograms in Figures5D–G, it is clear that the effect of the 300 Hz suppressor on the response of the neuron to binaural beats was frequency dependent. At 500 Hz, the discharge rate was reduced (Fig.5D, compare line with open bars), and the peak response occurred earlier, resulting in a shift in the BP (Fig. 5H, open circles). This shift was significant using a modified t test at thep < 0.05 level. We infer from this that the response of the lower-frequency input that contributes at 500 Hz is reduced by the suppressor, and the response is then dominated by a second, putative input. Both the reduction in discharge rate and the change in BP decreased as the frequency moved away from that of the suppressor until, at 650 Hz (Fig. 5G), neither the discharge rate nor the BP response was altered by the addition of the suppressor. The new BP values for the four retested frequencies in Figure 5Halign with those over the upper-frequency region of the original phase plot. Under the influence of the suppressor, instead of showing intermediate-type behavior with a negative slope (Fig.5B), the upper-frequency data indicate a peak-type input (CP, +0.02) with a CD of +126 μsec.
A further example is shown in Figure 6. The phase plot of this neuron met the criterion for a linear peak-type response (CP, +0.06) with a CD of +294 μsec (Fig.6A). However, a detailed analysis of its responses with and without suppression reveals evidence of more than one binaural input. Figure 6B indicates that the delay functions did not align around the peak in the discharge rate (compare Fig. 3B). The lowest two frequencies (Fig.6B, delay functions with open circles) had almost identical best delays, as calculated using the vector-averaging method (+670 μsec to within a couple of microseconds). However, the peaks of the delay functions at other frequencies did not align at this delay, despite the obviously strong delay tuning at each frequency. The upper-frequency region (400–600 Hz), depicted by filled circles in Figure 6B, was closely aligned around +400 μsec, whereas the intermediate frequencies (250–400 Hz) showed peaks of their delay functions (no symbols) between +550 and +394 μsec. When a 600 Hz suppressor was presented, and the middle-frequency range was reexamined (Fig.6C–H, lines), the BP values (Fig.6I, open circles) shifted upwards to align with those of the lowest two frequencies producing a peak-type response (CP, −0.02) with a CD of +762 μsec over the lower-frequency region (150–400 Hz). The delay functions for these frequencies are shown in Figure 6J. Linearity analysis of the BP values over this region (150–400 Hz) revealed that when binaural beats were presented alone, this region alone was not linear (i.e., not significant to the p < 0.005 level), but when the suppressed BP values between 250 and 400 Hz were used in the analysis, the 150–400 Hz region met the linearity criteria. Using a 200 Hz suppressor, responses were, to a lesser extent, shifted in the opposite direction (Figs. 6G,H, gray bars; Fig. 6I, crosses) to align more with BPs over the upper-frequency range (450–600 Hz). Over a local, high-frequency region of the phase plot, the data were consistent with a second peak-type input (CP, −0.01), having a CD of +421 μsec >350–600 Hz (Fig. 6K, ITD functions). Note that the CDs of the putative inputs exposed by the suppression are both longer than that of the combined phase plot in Figure6A.
Fig. 6.

A, Linear phase plot of a peak-type (CP, +0.06) neuron with a CD of +294 μsec. B, ITD functions for all of the frequencies examined in A using binaural beats, open circles are 150 and 200 Hz,lines only are 250–350 Hz, filled circles are 400–600 Hz. Vertical line indicates the CD. C, PSTH of the response to 1 Hz binaural beats at 324 Hz and 70 dB SPL (open bars) alone and presented simultaneously with a 600 Hz suppressor (lines).D, IPD histogram constructed from the response in partC. E–H, Responses to binaural beats at 70 dB SPL alone (open bars) and presented simultaneously with a 600 Hz suppressor (lines) or a 200 Hz suppressor (gray bars) for stimulus frequencies of 250 (E), 300 (F), 350 (G), and 400 (H) Hz.I, Phase plot showing BPs from the original phase plot in A that were not reexamined with a suppressor (filled circles), those that were reexamined in conjunction with the 600 Hz suppressor (open circles), and the 200 Hz suppressor (crosses). J, ITD functions for the putative lower-frequency input. K, ITD functions for the putative upper-frequency input.
Convergence of peak-type and trough-type inputs
Figure 7 shows data from an IC neuron with a complex phase plot (Fig. 7A). PSTHs or period histograms to binaural beats alone (Fig. 7C–H,open bars) indicate that the response to each cycle of IPD was dominated by a main peak in the discharge rate, but, at most frequencies, there was also a strong second “lobe” of activity evoked during each cycle. The second lobe had the effect of shifting mean BP values upwards and away from those that would be predicted by the main response peak of the discharge pattern alone. This main response peak dominated the response for frequencies at either end of the phase plot and was consistent with an underlying peak-type input (Fig. 7B, ITD functions). Lines in Figure7C–H show responses to binaural beats in the presence of a 400 Hz suppressor, a frequency at which the response was dominated by the main peak of the response (data not shown). In the presence of the suppressor, BP values were shifted dramatically upwards to give a trough-type response (CP, +0.41), with a CD of +138 μsec (Fig. 7I, open circles). Figure7J shows ITD functions constructed from the response to binaural beats + suppressor, clearly demonstrating the revealed trough-type behavior. Subtracting the revealed trough-type ITD functions in Figure 7J from the original ITD functions in Figure 7B leaves ITD functions (Fig. 7K) that reflect the peak-type response evident in the original functions, shifted downwards as a result of the elevated baseline response in Figures 7C–H. The gray bars in Figure 7, C and D, indicate a repeat measure of the response to binaural beats alone, obtained after the response to binaural beats and the suppressor indicating that the responses were stable over time.
Fig. 7.
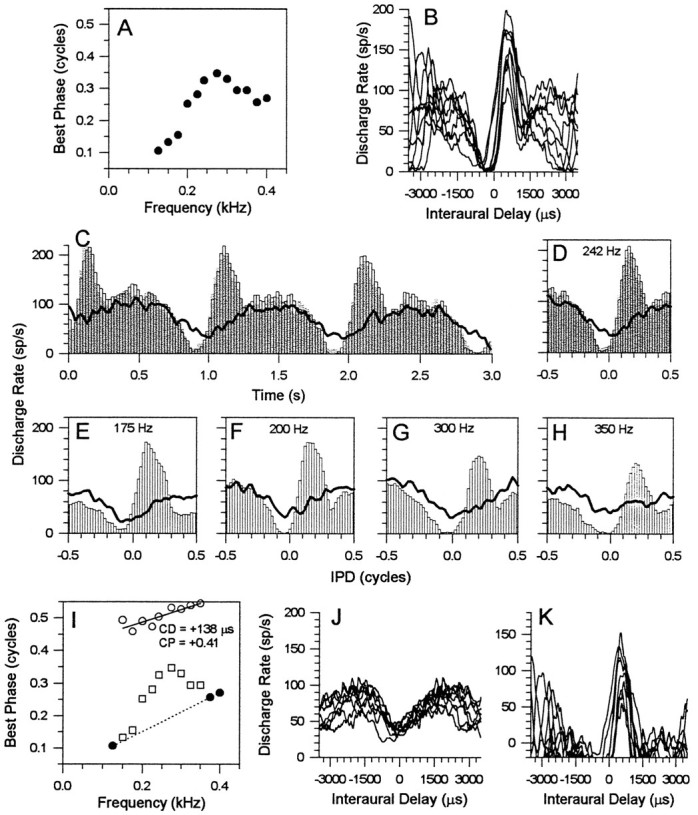
A, Complex, nonlinear phase plot for an IC neuron with a BF of 242 Hz. B, ITD functions constructed from the response to binaural beats. C, PSTH of the response to binaural beats at BF (242 Hz) presented alone (open and gray bars) or presented simultaneously with a 400 Hz suppressor (lines).D, IPD histograms constructed from the PSTH responses in part C. E–H, IPD histograms for stimulus frequencies of 175 (E), 200 (F), 300 (G), and 350 (H) Hz. I, Phase plot showing BPs from the original phase plot in A(open squares) and BPs in the presence of the suppressor (open circles). The dotted regression line at the bottom of the phase plot indicates a possible slope for the putative peak-type input, the input that dominates the frequencies at either end of the phase plot.J, ITD functions of the revealed trough-type input.K, ITD functions of the main peak-type input, derived by subtracting the ITD functions of the trough-type input in partJ from the ITD functions in part B.
Thus, the most parsimonious explanation of the complex phase plot of Figure 7A is convergence from a peak-type input and a trough-type input from the brainstem onto a single neuron in the IC.
Convergence explains linear intermediate-type phase plots
One class of linear phase plot that requires explanation because it is inconsistent with the simple coincidence detection model is the intermediate-type. As with linear peak-type and trough-type phase plots, intermediate-type phase plots are characterized by a CD, but one that occurs somewhere between the peak and the trough of the delay function.
Figure 8 shows responses from an IC neuron with an intermediate-type phase plot (Fig. 8A, CP, +0.35) and a CD of −112 μsec. The PSTH (Fig. 8C, BF response) and the IPD histograms (Figs.8D–H) to binaural beats and the ITD functions (Fig. 8B) provide an explanation for this behavior. As with the example in Figure 7, there is a secondary lobe of activity that shifted mean BP values away from those associated with the peak-type behavior of the major peak in the response. Unlike the previous examples, there are no parts of the phase plot that are indicative of simple peak-type or trough-type behavior. This suggests that the responsive areas of the putative inputs to this IC neuron are completely overlapping. Nevertheless, suppression with a 450 Hz tone revealed evidence of a peak-type input for this neuron. The lines in Figures 8C–H indicate that the suppressor abolished the main peak of the response, leaving a peak-type input (Fig. 8I, open circles) with a CP of +0.96 and a CD of −1644 μsec. This is confirmed by the ITD functions in Figure 8J. When a 200 Hz suppressor was used, BP values were shifted in the opposite direction (Fig.8I, crosses), toward values consistent with the main peak in the ITD functions, although this shift was not enough to produce a peak-type phase plot. Subtracting the ITD functions in Figure 8J from those in Figure8B produces the ITD functions in Figure8K, which provides supporting evidence that a peak-type input is present.
Fig. 8.
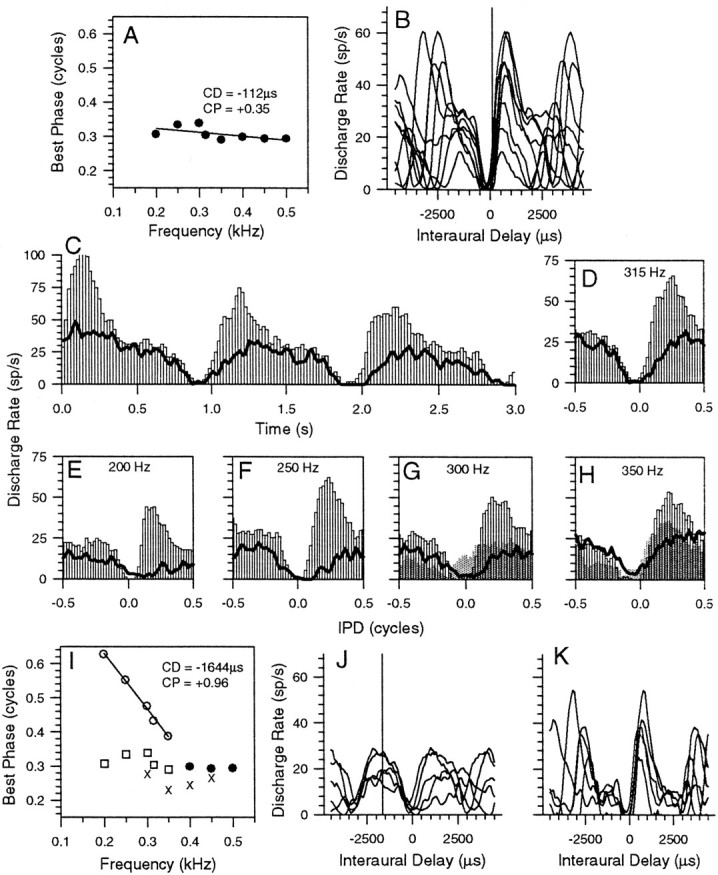
Same format as in Figure 7, showing responses of an IC neuron with an intermediate-type phase plot with a CD of −112 μsec and a CP of +0.35 (A). B, ITD functions showing the main response peak and a secondary lobe of activity at each frequency. PSTH (C) and IPD histogram (D) of the response to 67 dB SPL binaural beats at 315 Hz either presented alone (open bars) or in conjunction with a 450 Hz suppressor (lines). E–H, IPD histograms of the response to binaural beats at 315 Hz either presented alone (open bars) or in conjunction with a 450 Hz suppressor (lines) or a 200 Hz suppressor (gray bars) for stimulus frequencies of 200 (E), 250 (F), 300 (G), and 350 (H) Hz.I, Phase plot showing BPs from the original phase plot in A for frequencies not reexamined (filled circles), frequencies that were reexamined (open squares), and those BPs obtained in the presence of the suppressor (open circles).J, ITD functions of the revealed peak-type input.K, ITD functions that remain after subtracting the ITD functions of the peak-type input in part J from the ITD functions in part B.
Figure 9 shows a second example of a neuron with an intermediate-type phase plot (Fig. 9A), having a CP of +0.20 and a CD of +102 μsec. For this neuron, the PSTH (Fig. 9C) and the IPD histograms in response to binaural beats (Figs. 9D–H) show only a single peak in the discharge rate for each cycle of IPD; unlike in Figure 8, there is no secondary lobe of activity influencing the mean BP values. Responses to binaural beats were reexamined in the presence of a 100 Hz suppressor. At the lowest frequency examined (150 Hz), the response was completely demodulated, and no IPD-sensitive component was evident. However, as the frequency was increased, the response became increasingly IPD-sensitive, and the BP was shifted toward lower IPD values, such that IPDs that previously evoked no activity now strongly activated the neuron in the presence of the suppressor (Fig.9C–H, lines). The higher frequencies indicated peak-type behavior (CP, +0.03 over the range of 350–550 Hz), with a CD of +210 μsec. We suggest that this IC neuron receives a delay-sensitive inhibitory input that counters an excitatory input. At the lowest frequencies (up to 300 Hz), the suppressor tone is only partially successful in suppressing the inhibitory input and, as a result, BPs (Fig. 9I, open circles) were only partially shifted. For frequencies >300 Hz, however, the suppression of the inhibitory input was complete, and BPs were shifted to indicate a peak-type. This explanation is supported by Figure9J, which shows ITD functions for those frequencies >300 Hz in Figure 9I. The ITD functions are clearly symmetrical around a peak (at +210 μsec) in the discharge rate, and this accounts for the peak-type behavior. A possible explanation for this behavior is that excitatory and inhibitory inputs, whose frequency representation overlaps completely, are present. The possibility of this scenario existing in the IC, which is consistent with recent explanations by other researchers, is examined further in the Discussion.
Fig. 9.

Similar format to those in Figures 7 and 8 showing responses of an IC neuron with an intermediate-type phase plot with a CD of +102 μsec and a CP of +0.20 (A).B, ITD functions of all frequencies. PSTH (C) and IPD histogram (D) of the response to binaural beats at 250 Hz either presented alone (open bars) or in conjunction with a 100 Hz suppressor (lines). E–H, IPD histograms of the response to binaural beats either presented alone (open bars) or in conjunction with the suppressor (lines) for stimulus frequencies of 150 (E), 350 (F), 450 (G), and 550 (H) Hz.I, Phase plot showing BPs from the original phase plot in A for frequencies not reexamined (filled circles), frequencies that were reexamined (open squares), and those BPs obtained in the presence of the suppressor (open circles).J, ITD functions of the revealed peak-type input.
Responses of the population of IC neurons to suppressive tones
Table 1 summarizes the initial phase plots that were observed for the 43 neurons examined with the suppressor tone and the inputs revealed after suppression. The number of neurons in each category of initial phase plot is indicated at the head of each column. Of the 37 complex (intermediate-type or nonlinear) neurons examined with the suppressor method, we were able to demonstrate for 46% (17 of 37) of them the existence of at least one input that accorded with the Jeffress model of coincidence detection. However, for neurons in which we were unable to demonstrate unequivocally the presence of a simple input, changes nevertheless were observed. These neurons are categorized as having “no resolution” in the bottom row of Table 1. Changes such as these fell into three main categories. The first category contained those neurons for which shifts in responses were observed over a range of frequencies, but although the change was in the direction of a peak or trough, the simple response type was not fully resolved. A common observation with these neurons was that increasing the level of the suppressor in an attempt to remove more of the response of one putative input often had a completely suppressive effect, either demodulating the response completely or reducing the response to the baseline. Thus, for a further 19% (7 of 37) of neurons we judged the change to be consistent with evidence of a simpler underlying input. In each case, the change was toward that expected of a peak-type response, but no definitive classification of type was assigned. In the second category, changes were seen at one or two frequencies that looked to be consistent with a single input (i.e., one peak of a multipeaked response was abolished), but no consistent evidence of change was observed at other frequencies. Again, by increasing the level of the suppressor, the response was usually abolished completely without revealing a simple input. In the third category, responses were complex to start with and, after suppression with a worst-delay tone, remained complex throughout, despite changes at some frequencies.
Table 1.
Summary of initial phase plots and the inputs revealed after suppression
| Revealed inputs | Original phase plot | ||
|---|---|---|---|
| Linear peak/trough-type 5 (3 +2) | Intermediate-type 7 | Nonlinear/complex 30 | |
| Single peak-type | 3 | 3 | 3 |
| Single trough-type | 2 | 4 | |
| Peak-type + peak-type | 3 | ||
| Peak-type + trough-type | 4 | ||
| Partial resolution (of peak-type) | 3 | 4 | |
| No resolution | 1 | 12 | |
The columns show the classification of the initial phase plots for 42 neurons examined using the suppression technique. The rows indicate the effect of the suppressor tone on the phase plot in revealing the underlying inputs that contribute to the phase plots observed. Single peak-type and single trough-type classifications indicate that the nature of only one input was revealed.
DISCUSSION
We have demonstrated that nonlinear and intermediate-type linear phase plots of IC neurons are consistent with summation of binaural inputs from simple brainstem coincidence detectors, as suggested previously (Yin et al., 1986, 1987; Kuwada et al., 1987; Batra et al., 1989). Because even those IC neurons whose phase plots are linear by our criteria may receive convergent binaural input, detailed analyses are required to judge whether single or multiple inputs to an IC neuron are present. The novel aspect of the current study is the selective suppression of one of the putative convergent inputs to the IC to reveal the characteristics of the remaining inputs.
Using suppressor tones to determine the binaural inputs to IC neurons
The effect of suppressor tones on peak-type neurons with linear phase plots (Figs. 3, 4, reduced discharge rate without a shift in BP) is quite difficult to explain. If the addition of the suppressor tone merely introduced extra spikes by linear superposition (Yin et al., 1986, 1987), the response of the binaural processor to binaural beats would not be reduced. Rather, the extra spikes should coincide with spikes caused by the beat at all delays. Thus, there would be a demodulation of the beat response with discharge rates in the troughs increasing without a change in discharge rate at best delay. This is not observed. Because the stimulus to each ear is a two-tone complex, the effect may reflect the action of two-tone suppression on the discharge of auditory nerve fibers (Arthur et al., 1971): a second tone below BF could reduce the number of spikes from each ear reaching the coincidence detector. Alternatively, rather than a simple reduction in the number of spikes evoked, synchrony capture (or synchrony suppression; Rose et al., 1967, 1974; Javel, 1981) may lead to increased effectiveness of the suppressor over the binaural beat. Certainly, a synchrony-capture argument appears sufficient for the trough-type neuron shown in Figure 4. Here, the suppressor dominates the synchronization at the input of the coincidence detector and reduces the discharge rate for all IPDs to that at the trough IPD.
It seems unlikely that two-tone suppression could explain all of the phase shifts we have observed in the absence of convergent input to the IC. If the suppressor caused complete synchrony capture in the auditory nerve (Rose et al., 1967; Javel, 1981), there would have been no response to the binaural beat and, hence, no best IPD. Alternatively, if the suppressor had no effect on synchronization to the beat component, the best IPD would be unaffected. Between these extremes, where both tones are represented, synchrony suppression might have a role to play. However, in these experiments there was no fixed phase relation between the suppressor and the binaural beat tones because of the large frequency difference. Therefore, systematic phase shifts in a particular direction are unlikely.
It appears that two-tone suppression cannot explain effects in the absence of convergence beyond the coincidence detectors. However, if we assume convergence, synchrony capture may be important for switching off one of the inputs to the IC. Both binaural beat and suppressor will activate inputs whose response areas overlap, but the more effective tone will dominate the phase locking to the exclusion of the other (Rose et al., 1967; Javel, 1981). Thus, the input to the “suppressed” SOC neuron will be dominated by the anti-phase suppressor tone and hardly affected by the binaural beat tone.
Our ability to deconstruct complex phase plots of IC neurons into simpler phase plots that reflect the underlying inputs from brainstem nuclei is critically dependent on being able to suppress selectively an input, while leaving other inputs largely intact. Initially, we chose suppressors from a local region of the phase plot that showed peak-type or trough-type behavior, i.e., in which the response locally is characteristic of simple coincidence detection. In such cases, the suppressor often completely suppressed one input to reveal another peak-type or trough-type input. However, even when suppressor was chosen from a linear frequency region that was not peak-type or trough-type, or was nonlinear, simple peak-type or trough-type inputs were often revealed.
Most functional studies of IC inputs have used pharmacological techniques (Faingold et al., 1991; Sally and Kelly, 1992; Yang et al., 1992; Kelly and Sally, 1993; Park and Pollak, 1993) over which the present method has some advantages. First, it is technically straightforward; it does not require any neuropharmacological agent to be delivered to either the IC or the nuclei that project to it, to block neurotransmitter release or destroy neurons. Second, it is reversible simply by switching off the second tone. Kainic acid lesions are irreversible, and neuropharmacological agents applied by iontophoresis require extensive recovery times. Third, the data are consistent with the hypothesis that the effect is site-specific. The presumed site for the effect of the suppressor tone is the SOC, specifically on those neurons that project to the IC neuron under study.
One disadvantage is that it may not always be possible to suppress completely any one of the inputs. This is particularly the case for some neurons with highly complex phase plots, or with linear, intermediate-type phase plots.
Sources of binaural projections to the IC
There are numerous binaural projections into the IC, including three direct projections: the ipsilateral MSO, the ipsilateral and contralateral LSO, and at least three indirect sources, including the ipsilateral and contralateral dorsal nucleus of the lateral lemniscus (DNLL) and the contralateral IC.
The most likely source of excitatory binaural inputs to IC neurons are the MSO and the LSO. MSO neurons are largely peak-type (Batra et al., 1995; Spitzer and Semple, 1995), showing maxima in their delay functions at positive CDs (Yin and Chan, 1990). In the present study, all linear peak-type neurons had positive CDs, consistent with a projection from the ipsilateral MSO. Neurons in the low-frequency lobe of the LSO, which projects to both contralateral and ipsilateral IC, may be either peak-type or trough-type (Joris and Yin, 1995).
The data shown in Figure 9 suggested that inhibitory effects also play a role in shaping some phase plots. There are at least two sources of delay-sensitive inhibitory input to IC neurons. First, the LSO provides direct inhibitory synapses in IC (Brunso-Bechtold et al., 1994; Oliver et al., 1995). Second, IC neurons may receive inhibitory input from the DNLL, particularly high-frequency neurons sensitive to interaural level differences and to ITDs in the envelopes of high-frequency stimuli (Kidd and Kelly, 1996), and low-frequency neurons sensitive to ITD (Brugge et al., 1970, Fitzpatrick et al., 1996). However, whether the source of inhibition is direct or indirect, suppression probably occurs at the level of the primary binaural neurons in the SOC. In the case of binaural inhibitory inputs derived directly from the SOC, suppression reduces their output as well as their inhibitory effect in the IC. In the case of inhibition mediated through the an indirect pathway, suppression reduces the excitatory input, which in turn reduces any inhibitory effect on target neurons in the IC.
Interestingly, the form of the response shown in Figure 9 is remarkably similar to that suggested in a possible model for IC neurons that show “sawtooth” ITD functions (Kuwada et al., 1997). These authors suggested that DNLL inputs might sharpen the tuning of the IC neurons, effectively removing the excitatory responses at particular IPDs. Consistent with this, in Figure 9, the effect of adding the suppressor was to expand the range of IPDs to which the neuron responded on one flank of the delay function only (compare Fig. 8 in Kuwada et al., 1997). This supports our interpretation that the inhibitory input was suppressed to reveal the nature of the excitatory input.
Convergence and the role of delay-sensitive neurons in the IC
One possible role of convergence of delay-sensitive inputs from the brainstem onto IC neurons is the processing of auditory motion. Many neurons in the IC are sensitive to the depth and direction of dynamic IPD cues (Spitzer and Semple, 1993), whereas most neurons in the MSO are not (Spitzer and Semple, 1992). In addition, MSO neurons insensitive to dynamic IPD cues have phase-locked monaural inputs, consistent with them being primary binaural neurons, whereas the few MSO neurons that are sensitive to motion cues have nonphase-locked inputs (M. W. Spitzer and M. N. Semple, personal communication), consistent with them receiving descending input, possibly from the IC. We are investigating the responses of IC neurons to binaural beats and auditory motion stimuli, using the second-tone paradigm to determine whether the enhanced sensitivity to motion depends on convergent input from brainstem coincidence detectors.
Footnotes
We thank the two anonymous reviewers who provided insightful and useful comments. We especially thank David Marshall for his advice on data analysis.
Correspondence should be addressed to Dr. David McAlpine, Department of Biomedical Science, University of Sheffield, Western Bank, Sheffield, S10 2TN, UK.
Dr. Jiang’s present address: Department of Otorhinolaryngology, Head and Neck Surgery, Queens Medical Centre, Nottingham, UK.
REFERENCES
- 1.Adams JC. Ascending projections to the inferior colliculus. J Comp Neurol. 1979;183:519–538. doi: 10.1002/cne.901830305. [DOI] [PubMed] [Google Scholar]
- 2.Arthur RM, Pfeiffer RR, Suga N. Properties of “two-tone inhibition” in primary auditory neurones. J Physiol (Lond) 1971;212:593–609. doi: 10.1113/jphysiol.1971.sp009344. [DOI] [PMC free article] [PubMed] [Google Scholar]
- 3.Batra R, Kuwada S, Stanford TR. Temporal coding of envelopes and their interaural delays in the inferior colliculus of the unanaesthetized rabbit. J Neurophysiol. 1989;61:257–268. doi: 10.1152/jn.1989.61.2.257. [DOI] [PubMed] [Google Scholar]
- 4.Batra R, Fitzpatrick DC, Kuwada S (1995) Relationship of synchrony to ipsilateral and contralateral tones to ITD-sensitivity in the superior olivary complex. Abstr Eighteenth Meeting of the Association for Research in Otolaryngology 18:62.
- 5.Batra R, Kuwada S, Fitzpatrick DC. Sensitivity to interaural temporal disparities of low- and high-frequency neurones in the superior olivary complex. I. Heterogeneity of responses. J Neurosci. 1997;79:1222–1236. doi: 10.1152/jn.1997.78.3.1222. [DOI] [PubMed] [Google Scholar]
- 6.Bevington PR, Robinson DK. ) Data reduction and error analysis for the physical sciences. McGraw-Hill; New York: 1992. [Google Scholar]
- 7.Beyerl BD. Afferent projections to the central nucleus of the inferior colliculus in the rat. Brain Res. 1978;145:209–223. doi: 10.1016/0006-8993(78)90858-2. [DOI] [PubMed] [Google Scholar]
- 8.Brugge JF, Anderson DJ, Aitkin LM. Responses of neurons in the dorsal nucleus of the lateral lemniscus of cat to binaural tonal stimulation. J Neurophysiol. 1970;33:441–458. doi: 10.1152/jn.1970.33.3.441. [DOI] [PubMed] [Google Scholar]
- 9.Brunso-Bechtold JK, Thompson GC, Masterton RB. HRP study of the organization of auditory afferents ascending to central nucleus of inferior colliculus in cat. J Comp Neurol. 1981;197:705–722. doi: 10.1002/cne.901970410. [DOI] [PubMed] [Google Scholar]
- 10.Brunso-Bechtold JK, Linville MC, Henkel CK. Terminal types on ipsilaterally and contralaterally projecting lateral superior olive cells. Hear Res. 1994;77:99–104. doi: 10.1016/0378-5955(94)90257-7. [DOI] [PubMed] [Google Scholar]
- 11.Bullock D, Palmer AR, Rees A. A compact and easy to use tungsten-in-glass microelectrode manufacturing workstation. Med Biol Eng Comput. 1988;26:669–672. doi: 10.1007/BF02447511. [DOI] [PubMed] [Google Scholar]
- 12.Faingold CL, Anderson CAB, Caspary DM. Involvement of GABA in acoustically evoked inhibition in inferior colliculus neurons. Hear Res. 1991;52:201–216. doi: 10.1016/0378-5955(91)90200-s. [DOI] [PubMed] [Google Scholar]
- 13.Finlayson PG, Caspary DM. Low-frequency neurons in the lateral superior olive exhibit phase-sensitive binaural inhibition. J Neurophysiol. 1991;65:598–605. doi: 10.1152/jn.1991.65.3.598. [DOI] [PubMed] [Google Scholar]
- 14.Fitzpatrick DC, Kuwada S (1996) Sensitivity to interaural time differences (ITDs) in the dorsal nucleus of the lateral lemniscus (DNLL) of the unanaesthetised rabbit. Abstr Nineteenth Meeting of the Association for Research in Otolaryngology 19:192.
- 15.Goldberg JM, Brown PB. Response of binaural neurons of dog superior olivary complex to dichotic tonal stimuli: some physiological mechanisms of sound localization. J Neurophysiol. 1969;32:613–636. doi: 10.1152/jn.1969.32.4.613. [DOI] [PubMed] [Google Scholar]
- 16.Javel E. Suppression of auditory nerve responses I: temporal analysis, intensity effects and suppression contours. J Acoust Soc Am. 1981;69:1735–1745. doi: 10.1121/1.385953. [DOI] [PubMed] [Google Scholar]
- 17.Jeffress LA. A place theory of sound localization. J Comp Physiol Psychol. 1948;61:468–486. doi: 10.1037/h0061495. [DOI] [PubMed] [Google Scholar]
- 18.Joris PX. Envelope coding in the lateral superior olive. II. Characteristic delays and comparisons with responses in the medial superior olive. J Neurophysiol. 1996;76:2137–2156. doi: 10.1152/jn.1996.76.4.2137. [DOI] [PubMed] [Google Scholar]
- 19.Joris PX, Yin TCT. Envelope coding in the lateral superior olive. I. Sensitivity to interaural time differences. J Neurophysiol. 1995;73:1043–1062. doi: 10.1152/jn.1995.73.3.1043. [DOI] [PubMed] [Google Scholar]
- 20.Kelly JB, Sally SL. Effects of superior olivary complex lesions on binaural responses in rat auditory cortex. Brain Res. 1993;605:237–250. doi: 10.1016/0006-8993(93)91746-f. [DOI] [PubMed] [Google Scholar]
- 21.Kidd SA, Kelly JB. Contribution of the dorsal nucleus of the lateral lemniscus to binaural responses in the inferior colliculus of the rat: interaural time delays. J Neurosci. 1996;16:7390–7397. doi: 10.1523/JNEUROSCI.16-22-07390.1996. [DOI] [PMC free article] [PubMed] [Google Scholar]
- 22.Kuwada S, Stanford TR, Batra R. Interaural phase-sensitive units in the inferior colliculus of the unanesthetized rabbit: effects of changing frequency. J Neurophysiol. 1987;57:1338–1360. doi: 10.1152/jn.1987.57.5.1338. [DOI] [PubMed] [Google Scholar]
- 23.Kuwada S, Batra R, Stanford TR. Monaural and binaural response properties of neurons in the inferior colliculus of the rabbit: effects of sodium pentobarbital. J Neurophysiol. 1989;61:269–282. doi: 10.1152/jn.1989.61.2.269. [DOI] [PubMed] [Google Scholar]
- 24.Kuwada S, Batra R, Fitzpatrick DC. Neural processing of binaural temporal cues. In: Gilkey RH, Anderson TR, editors. Binaural and spatial hearing in real and virtual environments. Erlbaum; Mahwah, NJ: 1997. pp. 399–426. [Google Scholar]
- 25.McAlpine D, Jiang D, Palmer AR. Interaural delay sensitivity and the classification of low best-frequency binaural responses in the inferior colliculus of the guinea pig. Hear Res. 1996;97:136–152. [PubMed] [Google Scholar]
- 26.Merrill EG, Ainsworth A. Glass-coated platinum-coated tungsten microelectrodes. Med Biol Eng. 1972;10:662–627. doi: 10.1007/BF02476084. [DOI] [PubMed] [Google Scholar]
- 27.Palmer AR, Rees A, Caird D. Interaural delay sensitivity to tone and broad band signals in the guinea-pig inferior colliculus. Hear Res. 1990;50:71–86. doi: 10.1016/0378-5955(90)90034-m. [DOI] [PubMed] [Google Scholar]
- 28.Park TJ, Pollak GD. GABA shapes sensitivity to interaural intensity disparities in the mustache bat’s inferior colliculus: implications for encoding sound location. J Neurosci. 1993;13:2050–2067. doi: 10.1523/JNEUROSCI.13-05-02050.1993. [DOI] [PMC free article] [PubMed] [Google Scholar]
- 29.Oliver DL, Beckius GE, Shneiderman A. Axonal projections from the lateral and medial superior olive to the inferior colliculus of the cat: a study using electron microscopic autoradiography. J Comp Neurol. 1995;360:17–32. doi: 10.1002/cne.903600103. [DOI] [PubMed] [Google Scholar]
- 30.Rayleigh L. On our perception of sound direction. Philos Mag. 1907;13:214–232. [Google Scholar]
- 31.Rose JE, Gross NB, Geisler CD, Hind JE. Some neural mechanisms in the inferior colliculus of the cat which may be relevant to localization of a sound source. J Neurophysiol. 1966;29:288–314. doi: 10.1152/jn.1966.29.2.288. [DOI] [PubMed] [Google Scholar]
- 32.Rose JE, Brugge JF, Anderson DJ, Hind JE. Phase locked response to low-frequency tones in single auditory nerve fibers of the squirrel monkey. J Neurophysiol. 1967;30:769–793. doi: 10.1152/jn.1967.30.4.769. [DOI] [PubMed] [Google Scholar]
- 33.Rose JE, Kitzes LM, Gibson MM, Hind JE. Observations on phase-sensitive neurons of the anteroventral cochlear nucleus of the cat: nonlinearity of cochlear output. J Neurophysiol. 1974;37:218–253. doi: 10.1152/jn.1974.37.1.218. [DOI] [PubMed] [Google Scholar]
- 34.Sally SL, Kelly JB. Effects of superior olivary complex lesions on binaural responses in rat inferior colliculus. Brain Res. 1992;572:5–18. doi: 10.1016/0006-8993(92)90444-e. [DOI] [PubMed] [Google Scholar]
- 35.Spitzer MW, Semple MN. Responses to time-varying Interaural phase disparity in gerbil superior olive: evidence for hierarchical processing. Soc Neurosci Abstr. 1992;18:149. [Google Scholar]
- 36.Spitzer MW, Semple MN. Responses of inferior colliculus neurones to time-varying interaural phase disparity: effects of shifting the locus of virtual motion. J Neurophysiol. 1993;69:1245–1263. doi: 10.1152/jn.1993.69.4.1245. [DOI] [PubMed] [Google Scholar]
- 37.Spitzer MW, Semple MN. Neurons sensitive to interaural phase disparity in gerbil superior olive: diverse monaural and temporal response properties. J Neurophysiol. 1995;73:1668–1690. doi: 10.1152/jn.1995.73.4.1668. [DOI] [PubMed] [Google Scholar]
- 38.Yang L, Pollak GD, Resler C. GABAergic circuits sharpen tuning curves and modify response properties in the mustache bat inferior colliculus. J Neurophysiol. 1992;68:1760–1774. doi: 10.1152/jn.1992.68.5.1760. [DOI] [PubMed] [Google Scholar]
- 39.Yin TCT, Chan JCK. Interaural time sensitivity in medial superior olive of cat. J Neurophysiol. 1990;64:465–488. doi: 10.1152/jn.1990.64.2.465. [DOI] [PubMed] [Google Scholar]
- 40.Yin TCT, Kuwada S. Binaural interaction in low-frequency neurons in inferior colliculus of the cat. II. Effects of changing rate and direction of interaural phase. J Neurophysiol. 1983a;50:1000–1019. doi: 10.1152/jn.1983.50.4.1000. [DOI] [PubMed] [Google Scholar]
- 41.Yin TCT, Kuwada S. Binaural interaction in low-frequency neurons in inferior colliculus of the cat. III. Effects of changing frequency. J Neurophysiol. 1983b;50:1020–1042. doi: 10.1152/jn.1983.50.4.1020. [DOI] [PubMed] [Google Scholar]
- 42.Yin TCT, Chan JCK, Irvine DRF. Effects of interaural time delays of noise stimuli on low-frequency cells in the cat’s inferior colliculus. I. Responses to wideband noise. J Neurophysiol. 1986;55:280–300. doi: 10.1152/jn.1986.55.2.280. [DOI] [PubMed] [Google Scholar]
- 43.Yin TCT, Chan JCK, Carney LH. Effects of interaural time delays of noise stimuli on low-frequency cells in the cat’s inferior colliculus. III. Evidence for cross-correlation. J Neurophysiol. 1987;58:562–583. doi: 10.1152/jn.1987.58.3.562. [DOI] [PubMed] [Google Scholar]