

Abstract
We analyzed changes in the expression of mRNAs for the axonal growth-promoting cell recognition molecules L1.1, L1.2, and neural cell adhesion molecule (NCAM) after a rostral (proximal) or caudal (distal) spinal cord transection in adult zebrafish. One class of cerebrospinal projection nuclei (represented by the nucleus of the medial longitudinal fascicle, the intermediate reticular formation, and the magnocellular octaval nucleus) showed a robust regenerative response after both types of lesions as determined by retrograde tracing and/orin situ hybridization for GAP-43. A second class (represented by the nucleus ruber, the nucleus of the lateral lemniscus, and the tangential nucleus) showed a regenerative response only after proximal lesion. After distal lesion, upregulation of L1.1 and L1.2 mRNAs, but not NCAM mRNA expression, was observed in the first class of nuclei. The second class of nuclei did not show any changes in their mRNA expression after distal lesion. After proximal lesion, both classes of brain nuclei upregulated L1.1 mRNA expression (L1.2 and NCAM were not tested after proximal lesion). In the glial environment distal to the spinal lesion, labeling for L1.2 mRNA but not L1.1 or NCAM mRNAs was increased. These results, combined with findings in the lesioned retinotectal system of zebrafish (Bernhardt et al., 1996), indicate that the neuron-intrinsic regulation of cell recognition molecules after axotomy depends on the cell type as well as on the proximity of the lesion to the neuronal soma. Glial reactions differ for different regions of the CNS.
Keywords: CNS regeneration, teleost, Mauthner cell, L1, NCAM, axotomy
Axonal regrowth after a lesion depends on the balance of axonal growth-promoting and growth-inhibiting molecules expressed by the glial environment of severed axons (Schwab et al., 1993; Martini, 1994) and on neuron-intrinsic properties, such as the capability to (re)express molecules associated with axonal growth (Fawcett, 1992). Recently it has been demonstrated by retrograde tracing that neurons in some cerebrospinal projection nuclei consistently regenerate their axons after a distal lesion of the spinal cord in adult zebrafish (Becker et al., 1997). In contrast, the individually identifiable Mauthner cell showed no axonal regrowth to the level of tracer application, ∼3.5 mm caudal to the lesion site.
The capacity for axonal regrowth by a third group of nuclei remains questionable (Becker et al., 1997). In unlesioned control animals, most spinal axons of neurons in these nuclei, although reaching the level of spinal cord transection, did not reach the more caudal application site of the retrograde tracer. Thus, even if these neurons had regrown their axons to the original length they would not have been detected (Becker et al., 1997). We therefore have decided to use an alternative strategy to detect a regenerative response in axotomized neurons. The growth-associated protein 43 (GAP-43) is a widely accepted marker of axonal growth (Skene, 1989) and has recently been shown to promote axonal growth (Aigner et al., 1995; Holtmaat et al., 1995; Shea and Benowitz, 1995; Strittmatter et al., 1995). Assessing changes in the expression of GAP-43 mRNA after axotomy offers the possibility to confirm our previous findings and to gain additional information on the response to a spinal lesion of those cerebrospinal projection neurons of which the regenerative potential could not be determined previously.
To identify additional molecular correlates of successful axonal regeneration, both in the environment of the lesioned axons and in the axotomized neurons, we examined the expression of the mRNAs encoding L1.1, L1.2, both of which are closely related to mouse L1 (Tongiorgi et al., 1995), and the zebrafish neural cell adhesion molecule (NCAM) which is closely related to the mammalian and avian NCAM (Bernhardt et al., 1996). These three recognition molecules of the immunoglobulin (Ig) superfamily (Reichardt et al., 1990; Schachner et al., 1990;Rathjen et al., 1992) were chosen because they are known to promote neurite outgrowth in vitro (Appel et al., 1993; Sandig et al., 1994; Zhao and Siu, 1995) and are upregulated during axonal regrowth by both regenerating neurons (Bastmeyer et al., 1990;Vielmetter et al., 1991; Becker et al., 1993; Bernhardt et al., 1996) and glial cells (Nieke and Schachner, 1985; Daniloff et al., 1986;Martini and Schachner, 1988; Bernhardt et al., 1996).
After a distal spinal lesion, the neurons in those brain nuclei that had previously been shown to regenerate their spinal projections strongly upregulated the expression GAP-43, L1.1, and L1.2 but not NCAM mRNAs. In contrast, expression of these mRNAs was not significantly increased in the brain nuclei for which axonal regrowth could previously not be determined. However, after a more proximal spinal lesion, which axotomized similar numbers of neurons as the distal lesion, L1.1 and GAP-43 mRNA expression was found to be strongly upregulated in these nuclei. Concomitantly, axonal regrowth could be demonstrated. The Mauthner cell, which regrew its axon in some cases after proximal lesion, showed only a slight upregulation of GAP-43 mRNA expression and no increase in the expression of mRNAs for cell recognition molecules. In the spinal cord caudal to the lesion site, L1.2 but not L1.1 or NCAM mRNA expression was increased in putative glial cells.
MATERIALS AND METHODS
Animals. Adult zebrafish, Danio rerio(n = 88; body length, 2–3 cm), were analyzed in this study. They were taken from our breeding colony or bought at a local pet shop. Before surgery, fish were kept in groups of 10 animals on a 14 hr light/10 hr dark cycle and at a temperature of 28.5 °C.
Antibodies. The mouse monoclonal antibody 4C4 is a marker of macrophages/microglial cells in fish and was a gift of Dr. J. Scholes (University College, London). The antibody CON1, an axonal marker in zebrafish (Bernhardt et al., 1990), was a gift from Dr. J. Y. Kuwada (University of Michigan, Ann Arbor).
cRNA probes. Digoxigenin (DIG)-labeled cRNA sense and antisense probes for L1.1 mRNA and L1.2 mRNA were generated as described previously (Tongiorgi et al., 1995). The L1.1 probe comprises part of the third Ig-like domain at its 5′ end and includes ∼400 base pairs of the 3′ noncoding region. The L1.2 probe comprises part of the fifth fibronectin type III (FN III)-like domain at its 5′ end and includes the transmembrane and cytoplasmic regions but not the noncoding region (Tongiorgi et al., 1995; Bernhardt et al., 1996). Two additional L1.2 probes, one including all six FN III-like domains and the second one the five Ig-like domains, yielded the same results. The NCAM probe, comprising the second to fifth Ig-like domain, thus detecting all major splice variants of NCAM mRNA, was derived from a zebrafish clone that was a gift of Dr. D. Grunwald (University of Utah). Generation of the zebrafish GAP-43 probe has also been reported previously (Reinhard et al., 1994).
Spinal cord lesion. Spinal cord transection was performed as described previously (Becker et al., 1997). Briefly, fish were anesthetized by immersion in 0.033% aminobenzoic acid ethylmethylester (MS222; Sigma, St. Louis, MO) for 5 min. A longitudinal incision was made at the side of the fish to expose the vertebral column, which was then cut either at a level halfway between the dorsal fin and the operculum, i.e., 3.5 mm caudal to the brainstem/spinal cord transition zone [level 2, distal lesion (see Fig. 1)], or at the level of the operculum, corresponding to the brainstem/spinal cord transition zone [level 1, proximal lesion (see Fig. 1)]. Wounds were sealed with histoacryl (B. Braun, Melsungen, Germany), and the fish were kept at room temperature after surgery for 6–12 weeks.
Fig. 1.
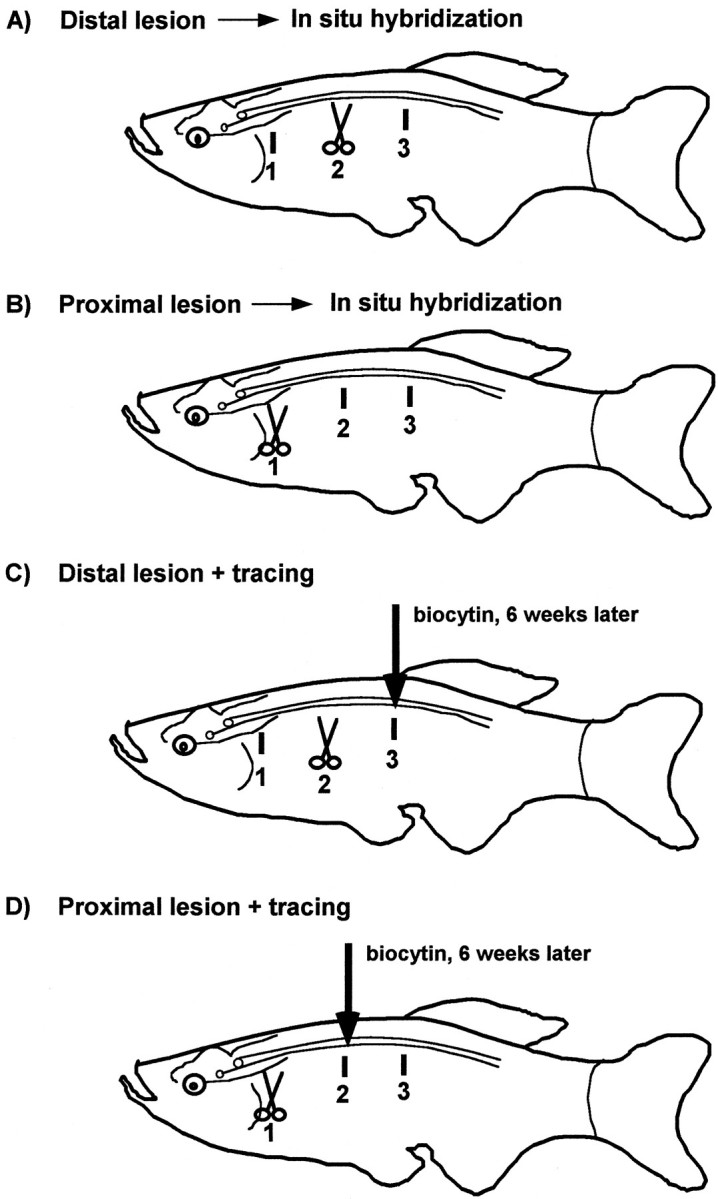
A–D, Schematic representation of different experiments. Different lesion or tracing levels are indicated by numbers 1–3. A, B, To analyze changes in the expression of cell recognition molecules by in situ hybridization, spinal cords of fish were transected (scissors) either at level 2 (distal lesion, A) or at level 1 (proximal lesion, B). C, D, To assess regenerative success, 6 or more weeks after spinal cord transection, neurons in the brain were retrogradely labeled from level 3 after transection at level 2 (C) (published previously in Becker et al., 1997) or from level 2 after transection at level 1 (D).
In situ hybridization. Nonradioactive detection of mRNAs in sections of adult zebrafish CNS was performed as published previously (Bernhardt et al., 1996). Briefly, consecutive coronal 14-μm-thick sections of brains and spinal cords were cut from fresh-frozen tissue on a cryostat. The sections were fixed overnight in 4% paraformaldehyde in PBS, pH 7.3, acetylated, dehydrated, air-dried, prehybridized for 3 hr at 37°C, and hybridized with the DIG-labeled probes at 55°C overnight. After extensive washing (3 × 90 min at 55°C), alkaline phosphatase-coupled anti-DIG Fab fragment antibodies (Boehringer Mannheim, Mannheim, Germany) were applied overnight. Antibody-binding was detected using an alkaline phosphatase reaction with nitro blue tetrazolium and 5-bromo-4-chloro-3-indolyl phosphate as substrates. Developing times were 3–6 hr for the brains and 18–48 hr for the spinal cords to enhance the relatively weak upregulation of mRNA expression in the spinal cord. Sense probes, developed in parallel under the same conditions as the antisense probes, never showed any labeling (see Fig.3D). Control and lesioned fish were analyzed in the same experiments on the same microscopic slides. Sections were viewed and photographed using differential interference contrast microscopy, to visualize anatomical landmarks. To further facilitate the anatomical analysis, cell nuclei were fluorescently labeled by adding ∼1 mg/l bisbenzimide (Hoechst 33258, Sigma) to the final washing solution after the alkaline phosphatase reaction. For all probes (GAP-43, L1.1, L1.2, NCAM) at least three brains for each time point were analyzed after distal lesion at 7 and 14 d post-lesion. For determination of L1.1 mRNA expression in the brain after distal lesion, three brains for each time point were additionally analyzed at 2, 3, and 56 d post-lesion, and one brain was analyzed at 84 d post-lesion. After proximal lesion, the regulation of expression of GAP-43 and L1.1 mRNAs was examined in three brains for each time point and probe at 7 and 14 d post-lesion. At least three control brains were included for each RNA probe. For the analysis of L1.1, L1.2, and NCAM mRNA expression in the spinal cord, at least three unlesioned control and three lesioned distal spinal cords were analyzed for each probe at 7 and 14 d post-lesion.
Fig. 3.
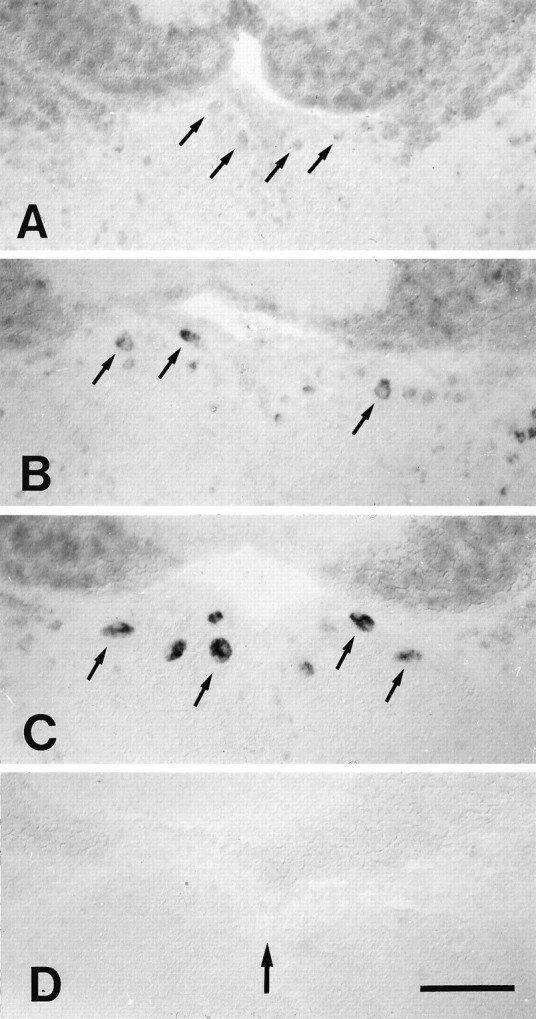
A–D, Expression of L1.1 mRNA in the nucleus of the medial longitudinal fascicle was rapidly upregulated after distal spinal cord transection. All images are cross sections; dorsal is up. Small arrows indicate individual cells in the nucleus of the medial longitudinal fascicle. Large arrow in D indicates the position of the brain midline for all panels. A, In situlabeling was faint in unlesioned controls. B, Labeling was increased at 3 d post-lesion. C, In situ labeling was very strong at 14 d post-lesion.D, The L1.1 sense RNA probe showed no staining. Scale bar (shown in D for A–D): 100 μm.
Whole-mount in situ hybridization followed by immunohistochemistry was performed on embryonic zebrafish (27 hr post-fertilization) as described previously (Tongiorgi et al., 1995). DIG-labeled probes were detected with the alkaline phosphatase reaction as described above, yielding a blue reaction product. After this procedure, immunocytochemistry for the CON1 antigen was performed on the same embryos using diaminobenzidine as substrate for horseradish peroxidase, resulting in a brown reaction product.
Quantification. The quantification of mRNA expression byin situ hybridization is not straightforward. The strength of the hybridization signal can vary as a result of the time during which the tissue was stored, even at −80°C, of individual batches of cRNA probe, of slight variations in section thickness, etc. To arrive at an objective evaluation of the changes in mRNA expression, we chose two complementary approaches, one qualitative, the other quantitative. In the qualitative assessment, a brain nucleus was scored as having significantly upregulated a specific mRNA when the in situlabeling intensity throughout the nucleus was clearly increased as compared with the unlesioned control, in at least two consecutive sections. In the case of the L1.1, L1.2, and NCAM mRNAs, an additional frame of reference was provided by populations of neurons that constitutively displayed intense labeling with the respective mRNA probes and that were not axotomized by the lesion (e.g., neurons in motor nuclei in the brain for the L1.1 and L1.2 mRNA probes, and cerebellar Purkinje cells for the NCAM probe).
To examine the validity of the qualitative assessment, we also counted all cellular profiles that displayed strong GAP-43 and L1.1 mRNA labeling in the nuclei of interest, in both unlesioned control and experimental animals at 7 and 14 d post-lesion. The counts were performed in all animals for which complete series of sections through the brain were available. Anatomical landmarks used to delineate the brain nuclei were the same as those used for anatomical tracing (Becker et al., 1997). Because the same cell can be counted twice (or more) in adjacent sections, the number of cellular profiles we determined does not directly correspond to the absolute number of labeled cells (Coggeshall and Lekan, 1996).
Cells were scored as having upregulated L1.1 mRNA expression if they displayed labeling intensity equal to or greater than the constitutively L1.1-expressing cells in the motor nuclei of the same animal. Because there are no populations of cells that constitutively express high levels of GAP-43 mRNA, we had to use a different criterion to evaluate changes in GAP-43 mRNA expression. All cells that showed stronger labeling than cells in the tectum opticum or the cerebellum of the same animal were counted.
Because counting criteria were different for L1.1 and GAP-43 mRNA-expressing cells, the numbers obtained by the counts cannot be compared directly. Also, the counts based on in situlabeling of the cryosections (thickness, 14 μm) cannot be related directly to those obtained by retrograde axonal tracing performed on vibratome sections (thickness, 50 μm). This is because the counting error (see above) depends on the section thickness and is greater for thin than for thick sections (Coggeshall and Lekan, 1996). To allow for a comparison between the different data sets we have determined an induction index. This relative value is independent of the counting protocol and also takes into account that different numbers of neurons will be axotomized by lesions at different spinal levels. The induction index is defined as [(n in situ 1)/(n in situ 2)]/[(n retrograde 1)/(n retrograde 2)], where (n in situ 1) and (n in situ 2) are the numbers of cellular profiles showing strongin situ labeling after level 1 and level 2 lesion, respectively, and (retrograde 1) and (retrograde 2) are the numbers of cellular profiles retrogradely labeled from level 1 and level 2, respectively, in unlesioned control fish. An induction index >1 indicates that a specific mRNA is upregulated in a higher proportion of cells in a particular nucleus after level 1 than after level 2 lesion, independent of differences in the number of axotomized neurons. For example, an induction index of 5 indicates that five times more cells are induced to express high levels of a specific mRNA after a proximal than after a distal lesion. An induction index of 1 means that proximal and distal lesions do not differ in their potency to induce the upregulation of a certain mRNA. An induction index <1 means that a proximal lesion induces mRNA upregulation less efficiently than a distal lesion.
Axonal tracing. Tracing of axons was performed as described previously (Becker et al., 1997). Briefly, 6 weeks after spinal cord transection at level 2 for distal lesions or level 1 for proximal lesions, anesthetized fish received a second spinal cord transection at level 3 (∼3.5 mm caudal to level 2) for distal lesions (see Fig.1C) or level 2 for proximal lesions (see Fig.1D). A small piece of gelatin foam (gel foam; Upjohn, Kalamazoo, MI) soaked with biocytin (Sigma) was applied to the transection site. After 24 hr, fish were perfused with 2% paraformaldehyde/2% glutaraldehyde in PBS, pH 7.3. Brains were sectioned at 50 μm on a vibratome, and the signal was developed using the Vectastain ABC-kit (Vector Laboratories, Burlingame, CA) with diaminobenzidine as substrate.
Neuroanatomy. Brain structures were identified using the zebrafish brain atlas (Wullimann et al., 1996). Neuronal profiles in different brain nuclei in axonal tracing experiments were counted without corrections for split somata as described previously (Becker et al., 1997) (see also above).
RESULTS
We have previously presented evidence for differences in the regenerative capacity of different classes of cerebrospinal projection neurons (Becker et al., 1997). One aim of the present study was to extend these results, by additional experiments using retrograde tracing and by analyzing GAP-43 mRNA expression. The main focus was on the question of whether a relationship exists between successful axonal regrowth and a neuron’s capacity to upregulate the expression of specific cell recognition molecules.
To test this hypothesis, three classes of brain nuclei were analyzed after lesion on the basis of the previous study (Becker et al., 1997): (1) brain nuclei with demonstrated regenerative capacity; (2) brain nuclei for which the response to axotomy could previously not be determined; and (3) the individually identifiable Mauthner cell. The expression patterns of the recognition molecules were examined byin situ hybridization, after two types of spinal lesions: (1) at the same distal spinal level as in the previous study and (2) after a more proximal lesion (Fig.1A,B) (see Material and Methods). Additionally, to complement our previous study of axonal regrowth after a distal spinal lesion (Becker et al., 1997), axonal regrowth after the proximal lesion was determined by retrograde tracing (Fig. 1C,D).
Brain nuclei with demonstrated regenerative capacity
Axonal regrowth
Neurons in the nucleus of the medial longitudinal fascicle, the intermediate reticular formation, and the magnocellular octaval nucleus had previously been shown to consistently regrow axons to a level 3.5 mm caudal to the site of the distal transection (Becker et al., 1997). In the following, these two spinal levels will be referred to as level 3 and level 2, respectively. Here we show that axonal regeneration also occurs after a proximal lesion (n = 7 animals), at the hindbrain–spinal cord boundary (Table1). This lesion site will be referred to in the following as level 1; it is located ∼3.5 mm rostral to level 2. After lesion at level 1, neurons were traced from level 2 (Fig.1C,D).
Table 1.
Comparison of numbers of neuronal profiles back-labeled from different spinal levels in unlesioned control animals and animals with transected spinal cord
| Level 1 | Level 2 | Level 3 | |||||
|---|---|---|---|---|---|---|---|
| Unlesioned control (n = 5 animals) | Unlesioned control (n = 9 animals) | After proximal (level 1) lesion (n = 7 animals) | % of control | Unlesioned control (n = 13 animals) | After distal (level 2) lesion (n = 23 animals) | % of control | |
| Brain nuclei responding similarly to proximal and distal lesion | |||||||
| NMLF | 59.0 ± 15.66 | 47.2 ± 14.39 | 15.1 ± 8.73 | 32 | 27.4 ± 12.02 | 9.0 ± 7.39 | 33 |
| IMRF | 61.2 ± 10.32 | 51.2 ± 10.11 | 25.9 ± 10.30 | 51 | 43.5 ± 13.39 | 17.9 ± 12.07 | 41 |
| MaON | 29.4 ± 6.11 | 27.6 ± 6.93 | 10.9 ± 7.80 | 39 | 22.5 ± 7.78 | 9.7 ± 7.16 | 43 |
| Brain nuclei responding differently to proximal and distal lesion | |||||||
| NR | 11.2 ± 5.50 | 8.4 ± 3.59 | 1.0 ± 1.41 | 11 | 2.6 ± 3.77 | 0.1 ± 0.44 | 4 |
| NLL | 6.8 ± 6.53 | 5.0 ± 4.07 | 0.7 ± 1.25 | 14 | 0.2 ± 0.39 | 0.1 ± 0.35 | 501-a |
| T | 10.0 ± 6.67 | 4.1 ± 6.93 | 0.6 ± 1.51 | 15 | 3.3 ± 4.17 | 0.0 ± 0.00 | 0 |
| Mauthner cell | |||||||
| MAC | 1.6 ± 0.89 | 2.0 ± 0.00 | 0.4 ± 0.79 | 20 | 1.7 ± 0.72 | 0.0 ± 0.00 | 0 |
Average numbers of cellular profiles retrogradely labeled from the different spinal levels are indicated (with SD). Columns headed “% of control” give the percentage of neurons with axons that reached the level of tracer application after spinal cord lesion, relative to unlesioned control animals. NMLF, Nucleus of the medial longitudinal fascicle; IMRF, intermediate reticular formation; MaON, magnocellular octaval nucleus; NR, nucleus ruber; NLL, nucleus of the lateral lemniscus; T, tangential nucleus; MAC, Mauthner cell. Except for the number of neuronal profiles labeled from level 2 after lesion at level 1, the data were taken from Becker et al. (1997).
The 50% value for neurons back-labeled from level 3 after lesion at level 2 is irrelevant because the projection to level 3 in unlesioned control fish is too small to make this a meaningful calculation.
The proportion of neurons that grew their axons beyond the lesion site to the level of tracer application was similar in both sets of experiments. After level 2 lesions, 33% of the neurons in the nucleus of the medial longitudinal fascicle that normally project to level 3 had regenerated axons. For neurons in the intermediate reticular formation, this proportion was 41%, and in the magnocellular octaval nucleus it was 43% (Table 1). After lesions at level 1, the number of neurons projecting from the nucleus of the medial longitudinal fascicle to level 2 was 32% of that in unlesioned fish. For the intermediate reticular formation the proportion was 51%, and for the magnocellular octaval nucleus it was 32% (Table 1). This indicates that the regenerative success of axotomized neurons in the three nuclei is independent of the distance between the soma and the lesion site.
Expression of mRNAs
GAP-43 proved to be a reliable marker of a regenerative response in the three nuclei. In both lesion paradigms, and correlating with successful axonal regeneration, the intensity of GAP-43 mRNA labeling was always (n = 4 animals) markedly increased in the nucleus of the medial longitudinal fascicle (Fig.2E,F, and see Fig.6D,F), the intermediate reticular formation (Fig. 2G,H), and the magnocellular octaval nucleus (data not shown).
Fig. 2.
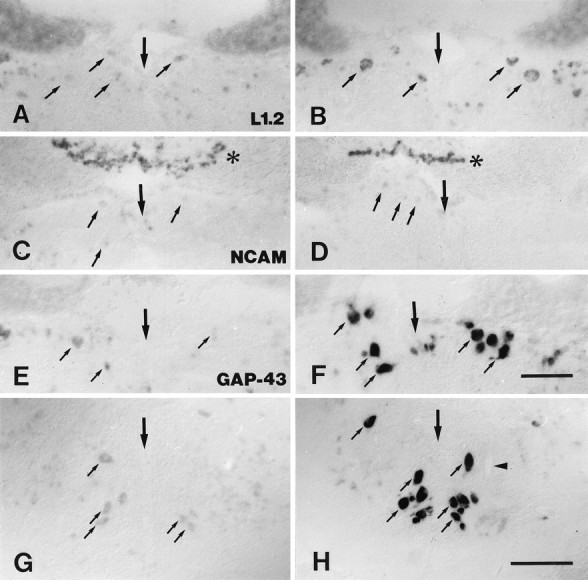
A–H, Cerebrospinal projection nuclei differ in the expression of different mRNAs 14 d after distal spinal cord transection. Expression of L1.2 (A, B), NCAM (C, D), and GAP-43 (E–H) mRNAs in the nucleus of the medial longitudinal fascicle (A–F) and the intermediate reticular formation (G, H). All images are cross sections; dorsal is up. Large arrows indicate the brain midline. Small arrows point out individual neurons in the nucleus of the medial longitudinal fascicle (A–F) and in the intermediate reticular formation (G, H). A, B, Expression of L1.2 mRNA was increased in lesioned animals (B) as compared with unlesioned controls (A). C, D, NCAM mRNA expression was not increased in lesioned animals (D) as compared with unlesioned controls (C).Asterisks indicate the overlying Purkinje cells of the cerebellum that constitutively show intense NCAM mRNA labeling.E–H, In lesioned animals, there was a strong upregulation of GAP-43 mRNA expression in the nucleus of the medial longitudinal fascicle (F), compared with unlesioned control fish (E) and in the intermediate reticular formation (H), compared with unlesioned controls (G).Arrowhead in H points at a part of the ventral Mauthner cell dendrite. Scale bars: A–F (shown in F), 100 μm; G, H (shown inH), 150 μm.
Fig. 6.
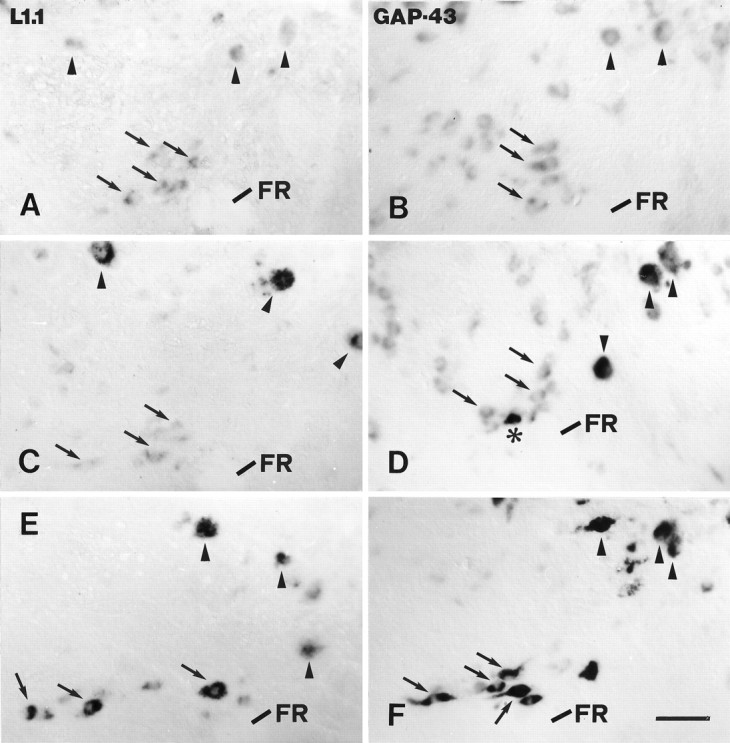
A–F, Expression of L1.1 and GAP-43 mRNA in the nucleus ruber was not significantly upregulated after distal but was upregulated after proximal lesion. L1.1 (A, C, E) and GAP-43 (B, D, F) mRNA expression in the nucleus ruber in unlesioned control fish (A, B), 14 d after distal lesion (C, D), and 14 d after proximal lesion (E, F) are shown. All images are cross sections; dorsal is up, lateral is left. Arrows depict individual neurons of the nucleus ruber. Arrowheads indicate individual neurons of the nucleus of the medial longitudinal fascicle. The fasciculus retroflexus (FR) is indicated as an anatomical landmark. A, B, In unlesioned control fish, labeling for L1.1 (A) and GAP-43 mRNAs (B) was weak. C, D, After distal lesion, expression of L1.1 (C) and GAP-43 mRNAs (D) was not significantly upregulated in the nucleus ruber but was upregulated in the nucleus of the medial longitudinal fascicle. Asterisk in Dindicates one of the few cells in the nucleus ruber that was strongly labeled for GAP-43 mRNA after distal lesion (see Results). E, F, After proximal lesion, neurons in the nucleus ruber were strongly labeled for L1.1 (E) and GAP-43 mRNAs (F). The increase in L1.1 and GAP-43 mRNA expression in individual cells in the nucleus ruber (arrows) after proximal lesion (E, F) was comparable to the increase in the nucleus of the medial longitudinal fascicle (arrowheads). Scale bar (shown in F for A–F): 50 μm.
To determine whether an upregulation of cell recognition molecules occurs during axonal regrowth, expression of L1.1, L1.2, and NCAM mRNAs was analyzed by in situ hybridization. At 7–14 d after a level 2 lesion, expression of L1.1 (Figs.3, 4,5) (n = 14 animals) and L1.2 (Fig. 2A,B) (n = 12 animals) mRNAs was consistently increased in the three nuclei when compared with unlesioned control fish. No such upregulation was observed for NCAM mRNA expression (Fig. 2C,D) (n = 13 animals). At 7–14 d after a level 1 lesion, only the expression of L1.1 mRNA was assayed. It was always found to be strongly increased (Fig. 6E) (n = 9 animals).
Fig. 4.

A, B, L1.1 mRNA expression was strongly increased in the magnocellular octaval nucleus after distal spinal cord transection. All images are cross sections; dorsal is up, lateral is left. A, Unlesioned control;B, 14 d post-lesion. Arrows point to individual neurons in the magnocellular octaval nucleus. The sensory root of the facial nerve (VIIs) is indicated as an anatomical landmark. In situ labeling after spinal cord transection (B) was very strong, compared with unlesioned controls (A). Scale bar (shown inB for A and B): 50 μm.
Fig. 5.
A–F, Expression of L1.1 mRNA was increased between 3 and 56 d after distal lesion. All images are cross sections; dorsal is up. A, Unlesioned control;B, 3 d post-lesion; C, 7 d post-lesion; D, 14 d post-lesion; E, 56 d post-lesion; F, 84 d post-lesion.Large arrows indicate the midline of the brain.Small arrows point to individual cells in the intermediate reticular formation. Asterisks indicate the trigeminal motor nucleus, which constitutively shows intense labeling for L1.1 mRNA as an internal positive control.Arrowheads in A, C, D, andF indicate the ventral dendrite of the Mauthner cell as an additional landmark. A, Labeling was faint in unlesioned controls. B–E, Expression of L1.1 mRNA was increased between 3 and 56 d post-lesion. F, Staining intensity was similar to that in unlesioned controls at 84 d post-lesion (compare with A). Scale bar (shown in F for A–F): 150 μm.
In unlesioned control animals as well as in lesioned fish, strong labeling for L1.1 and L1.2 mRNAs was found in motor nuclei of cranial nerves, including the oculomotor nucleus, the nucleus Edinger-Westphal (data not shown), the dorsal and ventral trigeminal motor nucleus (Fig.5A–F), the facial motor nucleus, and the vagal motor nucleus (data not shown). Strong in situ labeling of NCAM mRNA was always detected in cerebellar Purkinje cells and possibly eurydendroid cells (Fig. 2C,D). Because all of the above neuronal cell types were not axotomized by the spinal lesion and did not show any obvious difference in labeling intensity between unlesioned control fish and those that had received spinal cord transection, they served as internal standards.
The regulation of L1.1 mRNA expression after level 2 lesions was studied in greater detail. It was found to be the same for all three nuclei. Upregulation of mRNA expression was first detectable at 3 d post-lesion (Fig. 5A,B). After 7–14 d (Fig.5C,D) the intensity of the in situ signal was comparable to that in the motor nuclei (the internal standard; see above). Intense labeling was still observed after 56 d (Fig.5E), whereas after 84 d it had declined and was again comparable to that seen in unlesioned control animals (Fig.5F).
To check the validity of the qualitative assessment, we counted the cellular profiles labeled strongly with the GAP-43 and L1.1 probes (see Material and Methods). In all three nuclei and after both types of lesions, the number of cellular profiles that were strongly labeled for L1.1 and GAP-43 mRNA, respectively, was substantially increased compared with unlesioned controls (Table2). The induction indices (see Material and Methods) were close to 1 for both mRNA probes (Table 2). This indicates that the proportions of cells induced to increase expression of L1.1 and GAP-43 mRNA, respectively, were similar after distal and proximal lesions. This is consistent with similar rates of axonal regrowth after both types of lesion.
Table 2.
Quantitative evaluation of GAP-43 and L1.1 mRNA expression of different brain nuclei after proximal (level 1) and distal (level 2) lesion
| GAP-43 | L1.1 | |||||||
|---|---|---|---|---|---|---|---|---|
| Unlesioned control (n = 3 animals) | Level 1 lesion (n = 4 animals) | Level 2 lesion (n = 4 animals) | Induction index | Unlesioned control (n = 3 animals) | Level 1 lesion (n = 3 animals) | Level 2 lesion (n = 3 animals) | Induction index | |
| Brain nuclei responding similarly to proximal and distal lesion | ||||||||
| NMLF | 12.3 ± 11.67 | 110.0 ± 24.68 | 70.0 ± 20.72 | 1.3 | 3.3 ± 1.52 | 53.0 ± 12.66 | 51.3 ± 8.50 | 0.8 |
| IMRF | 9.6 ± 6.44 | 136.3 ± 46.32 | 83.0 ± 11.60 | 1.4 | 5.3 ± 4.73 | 64.7 ± 18.84 | 60.3 ± 14.98 | 0.9 |
| MaON | 8.0 ± 4.36 | 46.0 ± 14.10 | 48.5 ± 6.36 | 0.9 | 5.3 ± 3.50 | 34.3 ± 4.94 | 26.7 ± 8.14 | 1.2 |
| Brain nuclei responding differently to proximal and distal lesion | ||||||||
| NR | 1.7 ± 2.88 | 37.3 ± 10.80 | 7.3 ± 8.80 | 3.8 | 0.6 ± 1.14 | 23.7 ± 7.50 | 2.0 ± 1.73 | 8.9 |
| NLL | 2.0 ± 3.46 | 51.7 ± 8.46 | 8.0 ± 5.52 | 4.8 | 0.6 ± 1.14 | 23.7 ± 12.66 | 4.3 ± 1.52 | 4.1 |
| T | 4.0 ± 2.01 | 19.75 ± 25.26 | 1.5 ± 1.90 | 5.4 | 0.0 ± 0.00 | 2.0 ± 1.73 | 1.0 ± 1.00 | 0.8 |
Average numbers of cellular profiles showing high intensity of GAP-43 and L1.1 mRNA labeling are given (with SD). The induction index is a measure that compares the effectiveness of distal and proximal lesions to induce upregulation of a specific mRNA. It compensates for different numbers of neurons being axotomized after the two types of lesion (for calculation see Material and Methods). Abbreviations of brain nuclei are the same as in Table 1.
We conclude that cerebrospinal projection neurons upregulate the expression of specific mRNAs during axonal regeneration, including L1.1 and L1.2 but not NCAM. Thereby they differ from retinal ganglion cells, which upregulate the expression of all three mRNAs during axonal regrowth (Bernhardt et al., 1996). The onset of the upregulation may coincide with the initiation of axonal regrowth (cf. Bernhardt et al., 1996). The regulation of L1.1 mRNA expression corresponded well with the recovery of swimming behavior (Becker et al., 1997).
Brain nuclei of uncertain regenerative capacity
Axonal regrowth
As representatives of the class of brain nuclei for which axonal regrowth could not be demonstrated after level 2 lesions, the nucleus ruber, the nucleus of the lateral lemniscus, and the tangential nucleus were chosen (Becker et al., 1997). In the present study, we investigated axonal regrowth by neurons in these nuclei after level 1 lesions by retrograde tracing from level 2 (Fig.1D).
After level 1 lesions, spinal projections from the nucleus ruber to level 2 were reestablished in part in four of seven fish, from the nucleus of the lateral lemniscus in two of seven fish, and from the tangential nucleus in one of seven fish (Fig.7A,B). The percentage of neurons in the nucleus ruber that had regrown an axon to level 2 was 11% of normal (Table 1); for the nucleus of the lateral lemniscus it was 14% (Table 1), and for the tangential nucleus it was 15% (Table1). Thus, axonal regrowth can be elicited also in the nucleus ruber, the nucleus of the lateral lemniscus, and the tangential nucleus. But the rates of axonal regrowth (11–15%) are less than half of those observed for the nucleus of the medial longitudinal fascicle, the intermediate reticular formation, and the magnocellular octaval nucleus, both after level 1 (32–51%) and level 2 (33–43%) lesions.
Fig. 7.

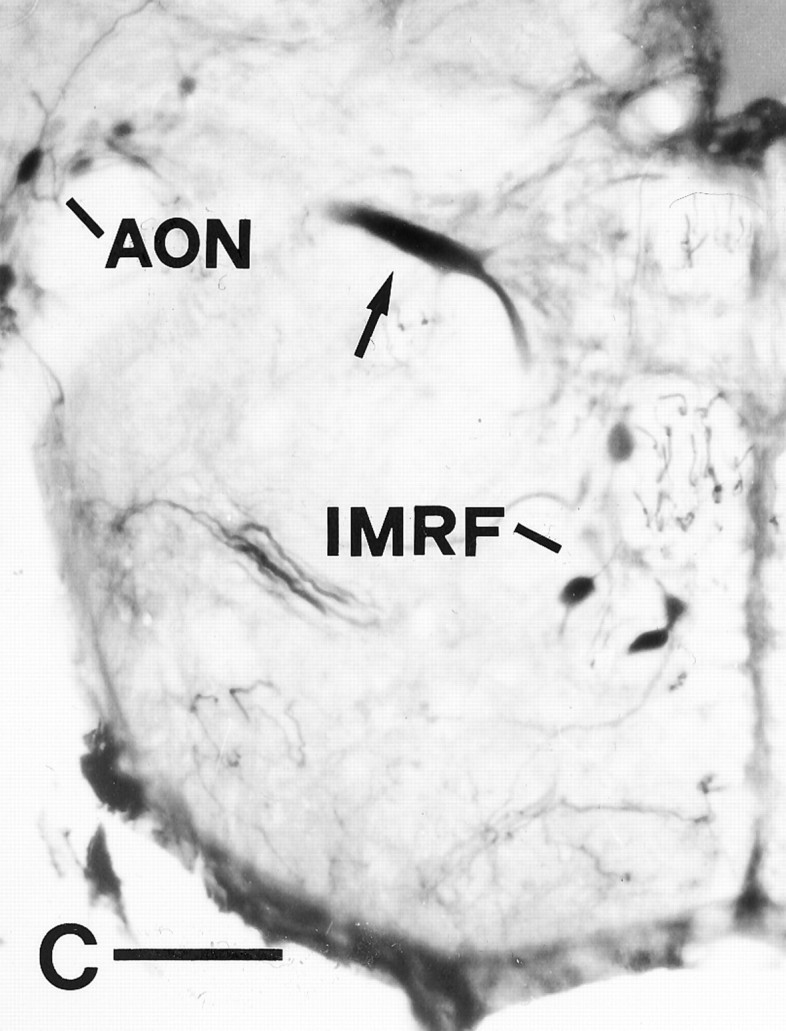
A–C, Retrograde axonal tracing (as described in Fig. 1) demonstrates axonal regrowth from the nucleus ruber, the nucleus of the lateral lemniscus, and the Mauthner cell after proximal lesion. All images are cross sections; dorsal is up, lateral is left. A, One neuron was labeled in the nucleus ruber (arrow), in addition to neurons in the nucleus of the medial longitudinal fascicle (arrowheads). B, Arrowdepicts one labeled neuron in the nucleus of the lateral lemniscus, in a dorsomedial position to the lateral longitudinal fascicle (LLF). C, The Mauthner cell (arrow) was retrogradely traced in addition to neurons in the anterior octaval nucleus (AON) and the intermediate reticular formation (IMRF). Scale bar (shown in C): A, B, 50 μm;C, 100 μm.
Expression of mRNAs
As already described for the nucleus of the medial longitudinal fascicle, the intermediate reticular formation, and the magnocellular octaval nucleus, increased expression of GAP-43 mRNA correlated with axonal regrowth also in the nucleus ruber, the nucleus of the lateral lemniscus, and the tangential nucleus. In none of the animals examined (n = 4) at 7–14 d after level 2 lesions did the nucleus ruber (Fig. 6B,D), the nucleus of the lateral lemniscus (Fig. 8D,E), and the tangential nucleus (not illustrated) show any significant upregulation of GAP-43 mRNA expression, with the exception of an occasional individual neuron (Fig. 6D). In contrast, at 7 and 14 d after level 1 lesions, GAP-43 mRNA expression was strongly upregulated in the nucleus ruber and the nucleus of the lateral lemniscus in all fish (n = 4) examined (Figs.6F, 8F). In the tangential nucleus, upregulation was likewise observed, but less frequently (two of four fish). It has to be noted that for the nucleus ruber and the nucleus of the lateral lemniscus, the number of neurons projecting to spinal levels 1 and 2 are not substantially different. The nucleus ruber projects to level 1 with an average of 11.2 neurons and to level 2 with an average of 8.5 neurons. The nucleus of the lateral lemniscus projects to level 1 with 6.8 neurons and to level 2 with 5.0 neurons (Table 1). Thus, both level 1 and level 2 lesions will axotomize similar numbers of neurons in these two nuclei. However, the tangential nucleus projects to level 1 with 10 neurons but to level 2 with only 4.1 neurons. The lack of a significant GAP-43 response after level 2 lesion, despite similar numbers of neurons being axotomized by both lesion paradigms in two of these nuclei, indicates that the distal lesion probably did not lead to regenerative axonal growth in these three nuclei (see Discussion).
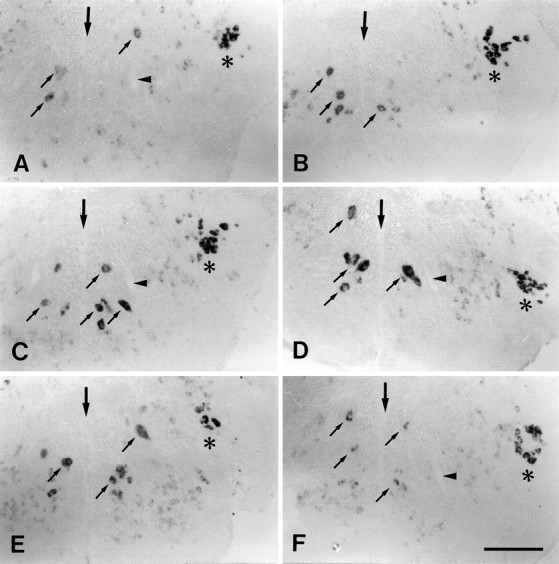
Fig. 8.

A–F, Expression of L1.1 and GAP-43 mRNAs in the nucleus of the lateral lemniscus was not significantly upregulated after distal but was upregulated after proximal lesion.In situ labeling of L1.1 (A–C) and GAP-43 (D–F) mRNAs, in unlesioned control fish (A, D), after distal (B, E) and proximal lesion (C, F) is shown. All images are cross sections; dorsal is up, lateral is left. Dashed lines outline the border of the lateral longitudinal fascicle as an anatomical landmark. Arrows point out individual cells in the nucleus of the lateral lemniscus. A–C, Labeling of L1.1 mRNA after distal lesion (B) was comparable to that in unlesioned controls (A), but it was strongly increased after proximal lesion (C). D–F, Intensity of labeling for GAP-43 mRNA was not increased after distal (E) but was increased after proximal lesion (F) as compared with unlesioned controls (D). Scale bar (shown in F forA–F): 50 μm.
The expression of the mRNAs encoding the three cell recognition molecules followed the pattern of GAP-43 mRNA expression. After level 2 lesions, no significant upregulation of L1.1 (n = 14 animals), L1.2 (n = 12 animals), or NCAM (n = 13 animals) mRNA expression was observed, as shown for L1.1 in the nucleus ruber (Fig. 6A,C) and the nucleus of the lateral lemniscus (Fig. 8A,B). An exceptional upregulation of L1.1 mRNA expression was observed in the nucleus ruber in only in 1 of 14 animals.
After level 1 lesions, only L1.1 mRNA expression was assayed. At 7 and 14 d post-lesion, it was generally upregulated in the nucleus ruber [eight of nine fish (Fig. 6E)] and in the nucleus of the lateral lemniscus [seven of nine fish (Fig.8C)]. The intensity of the in situ labeling of individual neurons after proximal lesion was comparable to that of neurons in the nucleus of the medial longitudinal fascicle (Fig.6E). In neurons of the tangential nucleus, L1.1 mRNA expression was upregulated in only one of nine fish.
Counting the number of cellular profiles that were strongly labeled for L1.1 and GAP-43 mRNA in the three nuclei of uncertain regenerative capacity revealed a substantial increase after proximal but not after distal lesion, with one exception: there was no significant, lesion-induced increase of L1.1 mRNA in the tangential nucleus (Table2). The induction index (see Material and Methods) for GAP-43 varied between 3.8 and 5.4. (Table 2). This indicates that approximately four times as many cells upregulated GAP-43 mRNA expression after a proximal as compared with a distal spinal lesion. Similarly, in the nucleus ruber and the nucleus of the lateral lemniscus, the induction index for L1.1 indicates a four- to eightfold increase in the number of cells expressing high levels of L1.1 mRNA after a proximal compared with a distal lesion (Table 2). The index value of 0.8 for the tangential nucleus (Table 2) reflects the poor induction of L1.1 mRNA expression after both types of lesion.
Thus, in contrast to the brain nuclei of demonstrated regenerative capacity, a lesion closer to the neuronal somata is more likely to induce the upregulation of GAP-43 mRNA in all three brain nuclei of uncertain regenerative capacity. This is also true for L1.1 mRNA in the nucleus ruber and the nucleus of the lateral lemniscus but not in the tangential nucleus. A regenerative response may not be elicited as frequently after level 1 lesion in the tangential nucleus as in the nucleus ruber or the nucleus of the lateral lemniscus. This interpretation is consistent with the finding that an upregulation of GAP-43 mRNA was observed in this nucleus only in two out of four animals.
The Mauthner cell
Axonal regrowth
Mauthner cells are a bilateral pair of cerebrospinal projection neurons that could be individually identified in all preparations. Their axons normally project to the most caudal spinal cord but were never observed to regrow to level 3 after level 2 lesions (Becker et al., 1997). In contrast, here we found that after level 1 lesions Mauthner axons regrew in two of seven fish (one Mauthner cell in one fish and both Mauthner cells in another fish) (Fig. 7C). The proportion of Mauthner cells that projected to level 2 after level 1 lesions was 20% of the number of Mauthner cells that projected to level 2 in unlesioned animals (Table 1). This value is intermediate between those of the two classes of brain nuclei described above.
Expression of mRNAs
Concomitant with the lack of axonal regrowth after level 2 lesions, there was no upregulation of GAP-43 mRNA expression in the four animals analyzed (Fig.9A,B,D,E). Surprisingly, given that Mauthner cells occasionally regrew their axons after level 1 lesions, we did not find a significant upregulation of GAP-43 mRNA expression after level 1 lesions at 7 and 14 d post-lesion, even if in some cases after level 1 lesion staining appeared slightly stronger than in unlesioned control fish (Fig. 9C,F). However, this increase in labeling was much less than that observed in other axotomized neurons (Fig. 9G).
Fig. 9.
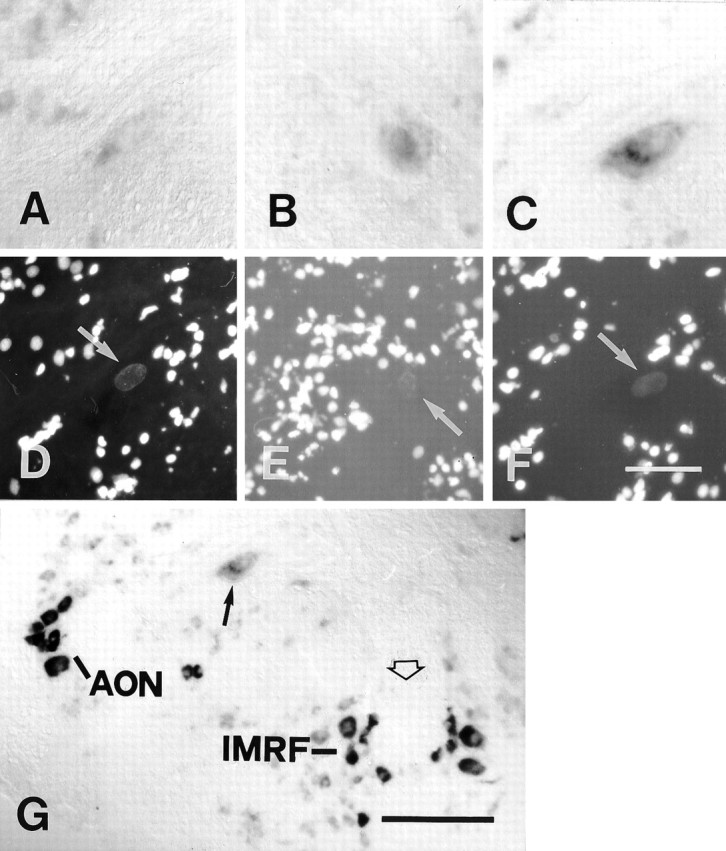
A–G, Labeling for GAP-43 mRNA in the Mauthner cell was not significantly increased after distal and proximal lesion. All images are cross sections. A–C andG show in situ hybridization;D–F show nuclear fluorescence images corresponding toA–C and are included for orientation.Arrows in D–F point to the cell nucleus of the Mauthner cell. A, D, In an unlesioned control animal only weak in situ labeling was detected.B, E, At 14 d after a distal lesion, in situ labeling was faint. C, F, G, At 14 d after a proximal lesion, a slight increase in in situlabeling was seen occasionally (C, F). This increase appeared very weak, however, when compared with that in axotomized neurons that regenerated their axons consistently (seeG, a low-power view of the same section), i.e., the anterior octaval nucleus (AON) or the intermediate reticular formation (IMRF).Arrow in G points out the Mauthner cell, and the open arrow in G depicts the midline of the brain. Scale bar (shown in F forA–F): 50 μm; G, 150 μm.
In contrast to GAP-43, we never observed even a small increase in labeling intensity of the mRNAs for the three cell recognition molecules, neither after level 2 lesion for L1.1, L1.2, or NCAM nor after level 1 lesion for L1.1 (Fig.10A–H). This indicates that the Mauthner cell may be exceptional in that axonal regrowth after level 1 lesion can take place without a conspicuous upregulation of GAP-43 mRNA expression and without upregulation of L1.1 mRNA expression.
Fig. 10.

A–H, No upregulation of L1.1 mRNA expression was observed for the Mauthner cell after distal and proximal lesion. All images are cross sections; A, E, unlesioned control; B, F, distal lesion, 3 d post-lesion; C, G, distal lesion, 7 d post-lesion; D, H, proximal lesion, 7 d post-lesion; E–H, the nuclear fluorescence images corresponding to A–D. Arrows point to the cell nucleus of the Mauthner cell. Staining intensity was extremely low in unlesioned controls (A, E), 3 d (B, F) and 7 d after distal lesion (C, G), as well as 7 d after proximal lesion (D, H). Scale bar (shown in H forA–H): 50 μm.
Expression of L1.1 mRNA in the Mauthner cell during development
Because we could not detect upregulation of L1.1 mRNA expression by the Mauthner cell under any experimental condition, we investigated whether it expressed L1.1 mRNA during embryonic axonal growth. In whole-mount in situ hybridizations of 27-hr-old zebrafish, the Mauthner cell was identified by its typical axon trajectory, as revealed by the antibody CON1, which labels a subset of axons in embryonic zebrafish (Bernhardt et al., 1990). The Mauthner cell, as well as other projection neurons in the reticular formation, were intensely labeled for L1.1 mRNA during the period of axonogenesis (Fig.11).
Fig. 11.
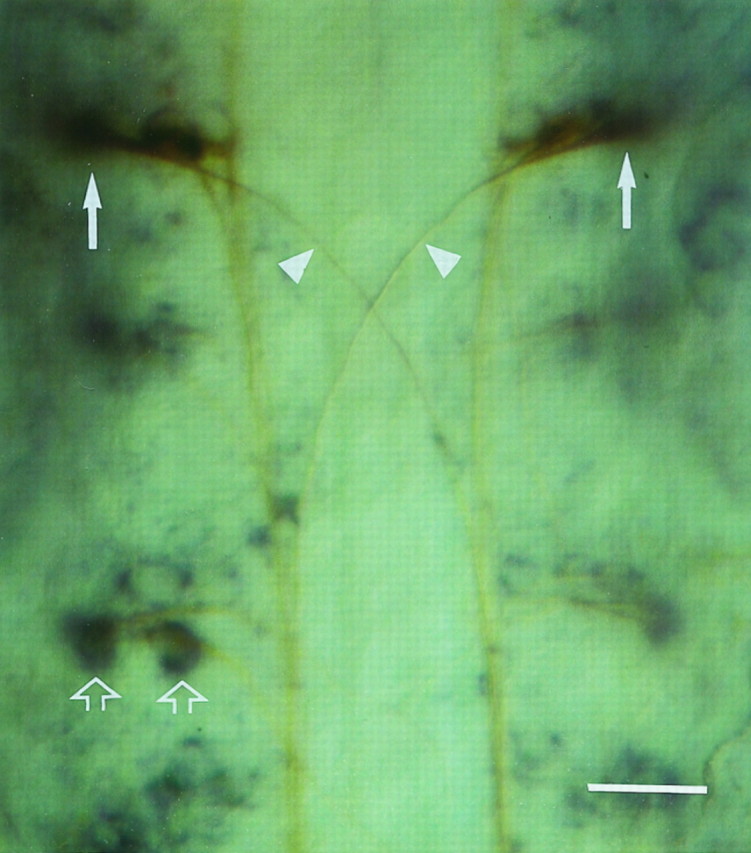
The Mauthner cell and other reticular projection neurons were strongly labeled for L1.1 mRNA during development. Whole-mount preparation shows expression of L1.1 mRNA in the Mauthner cells (arrows) and other reticular neurons (open arrows) in the brainstem of an embryonic zebrafish 27 hr after fertilization. Rostral is up. For identification of the Mauthner cells, the in situ hybridization (blue reaction product) was followed by immunohistochemistry with the antibody CON1 (brown reaction product). CON1 reveals the large decussating Mauthner axons (arrowheads). Scale bar, 25 μm.
We conclude that except for the Mauthner cell, upregulation of GAP-43, L1.1, and L1.2 but not NCAM mRNA expression correlates with axonal regrowth for all brain nuclei investigated.
Expression of L1.1, L1.2, and NCAM mRNAs in the environment of the spinal cord caudal to the lesion
We analyzed the expression of L1.1, L1.2, and NCAM mRNAs in the white matter of the spinal cord, 1–3 mm caudal to a level 2 lesion (Fig. 1). We found increased expression of L1.2 but not L1.1 or NCAM mRNAs in small cells in the spinal white matter at 7 and 14 d post-lesion (Fig.12A,B). These cells were found throughout the white matter, but most frequently in the lateral funiculi. To further characterize these cells, immunocytochemical labeling with the macrophages/microglial cells marker 4C4 (see Materials and Methods) and in situhybridization for L1.2 mRNA were combined. These experiments revealed no overlap of the two signals (data not shown), indicating that cells expressing L1.2 mRNA were not macrophages/microglial cells. We conclude from the location of these cells in the white matter that they were not neurons but were probably glial cells.
Fig. 12.

A, B, L1.2 mRNA was upregulated in glial cells in the spinal white matter caudal to the lesion site. All images are cross sections; dorsal is up. Asterisksindicate melanocytes covering the dorsal aspect of the spinal cord.A, Unlesioned control; B, 14 d post-lesion. Labeling of L1.2 mRNA was increased in small cells in the white matter (B, arrows) and in cells in the gray matter in the spinal cord caudal to a distal lesion (B) as compared with unlesioned controls (A). Scale bar (shown in B): 100 μm.
Expression of L1.2 in the environment of the regenerating axons could potentially promote axonal growth.The finding that the expression of L1.1 and NCAM mRNAs was not upregulated demonstrates an interesting difference between glial cells in the spinal cord and the optic nerve. In the latter, putative glial cells showed strong expression of all three mRNAs after a lesion (Bernhardt et al., 1996).
In the spinal gray matter, strong expression of L1.1, L1.2, and NCAM mRNAs could be detected, in both control and lesioned fish. Some of the cells constitutively expressing these mRNAs were probably motor neurons, as indicated by their location and large size (Fetcho and Faber, 1988; Van Raamsdonk et al., 1996). A weak upregulation of L1.1 (data not shown) and L1.2 (Fig. 12A,B) but not NCAM (data not shown) mRNAs was observed in the gray matter after spinal cord transection. The identity of these cells is unclear. They could be additional motor neurons that were axotomized because of inadvertent damage to the ventral root by the spinal lesion, or they could be axotomized interneurons with ascending axons (Bernhardt et al., 1990,1992).
DISCUSSION
Different classes of cerebrospinal projection neurons as well as putative glial cells in the spinal cord were shown to upregulate the expression of specific cell recognition molecules after a spinal cord transection in adult zebrafish. In some classes of neurons, this molecular response to axotomy was independent of the lesion paradigm. In others it depended on the relative proximity of the lesion to the soma. There was a good correlation between the increased expression of mRNAs for specific cell recognition molecules and axonal regrowth, as demonstrated by retrograde axonal tracing or deduced from the increased expression of GAP-43 mRNA. One exception to this rule appears to be the Mauthner cell, which did not show an obvious molecular response to axotomy but did show a limited capacity for axonal regeneration.
The capacity to increase GAP-43 mRNA expression correlates with the capacity to regrow an axon
The populations of cerebrospinal projection neurons in the zebrafish that have been found, by retrograde axonal tracing, to regrow their axons after axotomy were also found to express elevated levels of GAP-43 mRNA after axotomy. Increased expression of GAP-43 mRNA has previously been found to correlate with successful axonal regrowth in many classes of neurons (Skene, 1989; Tetzlaff et al., 1994; Vaudano et al., 1995; Benowitz and Routtenberg, 1997), including retinal ganglion cells of zebrafish (Bormann et al., 1998). In populations of neurons that are intrinsically capable of axonal regrowth, strong upregulation of GAP-43 mRNA can even occur when axonal regrowth is prevented by extrinsic factors, e.g., a nonpermissive environment or mechanical constraint. One example is provided by mammalian retinal ganglion cells that do not regenerate their axons into a crushed optic nerve but do regenerate their axons into a peripheral nerve graft (Vidal-Sanz et al., 1987; Doster et al., 1991). Mammalian sensory and motor neurons prevented from axonal regrowth by a ligation of the tibial nerve (Chong et al., 1994) are another example. In sum, expression of GAP-43 may be a necessary, but not a sufficient, prerequisite to allow for axonal regeneration.
Conversely, the lack of an upregulation of GAP-43 mRNA expression may indicate the absence of regenerative growth after axotomy. This appears to be the case for neurons in the nucleus ruber, the nucleus of the lateral lemniscus, and the tangential nucleus after a distal lesion. Interestingly, the failure to initiate a regenerative response is not absolute, however, in these three nuclei. The analysis of both GAP-43 expression and retrograde axonal tracing indicates that axonal regrowth can occur after a proximal lesion.
The expression pattern of GAP-43 mRNA as well as the retrograde tracing indicate that one can distinguish between two categories of cerebrospinal projection neurons, which we will refer to as good and poor regenerators. Good regenerators (the nucleus of the medial longitudinal fascicle, the intermediate reticular formation, the magnocellular octaval nucleus) initiated axonal regrowth, regardless of the site of lesion. In poor regenerators (the nucleus ruber, the nucleus of the lateral lemniscus, the tangential nucleus), a regenerative response was more difficult to elicit. These nuclei showed no evidence of a regenerative response after a distal lesion. After proximal lesion some axonal regrowth was observed, but less consistently than for the good regenerators. Similar differences in regenerative capacity have also been reported for different classes of cerebrospinal projection neurons in adult goldfish (Sharma et al., 1993) and larval lampreys (Davis and McClellan, 1994a,b; Jacobs et al., 1997).
The capacity to increase expression of L1.1 and L1.2 mRNAs correlates with the capacity to regrow an axon
The two categories of cerebrospinal projection neurons in zebrafish also differed in their expression of mRNAs for cell recognition molecules. Good regenerators upregulated L1.1 and L1.2 but not NCAM mRNA expression after distal lesion. Poor regenerators did not show any changes in mRNA expression. After proximal lesion, both classes of brain nuclei upregulated L1.1 mRNA expression (L1.2 and NCAM mRNAs were not tested). We conclude that the distance of the axotomy from the neuronal soma is an important factor in eliciting a regenerative response to axotomy in some brain nuclei. Moreover, because L1.1 mRNA expression was upregulated only in axotomized neuronal populations for which we could also demonstrate axonal regrowth, L1-related molecules may belong to a set of molecules the expression of which is specifically increased during axonal regrowth.
The Mauthner cell shows a unique reaction to axotomy
Regrowth of Mauthner axons was never observed after distal lesions but could be shown occasionally after proximal lesions. Similar results have been obtained in goldfish (Sharma et al., 1993; Zottoli et al., 1994). Surprisingly, the labeling intensity of the GAP-43 probe after proximal lesion was still much lower than that in other regenerating neurons. It is possible that the large volume of the Mauthner cell or transport of the mRNA into the axon (Weiner et al., 1996) could have resulted in a dilution effect that may have prevented the detection of most of the mRNA in the soma. Alternatively, weak GAP-43 mRNA expression might have been sufficient to support axonal sprouts. These sprouts may be relatively thin, as has been observed in goldfish (Zottoli et al., 1994).
The Mauthner cell did not show upregulation of any of the mRNAs for cell recognition molecules during axonal regrowth after proximal lesion. This does not reflect a fundamental inability of the Mauthner cell to express L1.1, because we were able to detect L1.1 mRNA during embryonic axonal growth. Whether it reflects a unique molecular program underlying axonal regeneration or alternatively is attributable to the anatomical peculiarities of this cell already discussed above remains unclear. The fact that we could not detect any upregulation of L1.1 mRNA, but a slight upregulation of GAP-43 mRNA expression, may indicate distinct molecular mechanisms for the regulation of these two molecules in the Mauthner cell. Alternatively, a slight increase in L1.1 mRNA expression might have been below the detection level of in situ hybridization.
Specific classes of neurons show specific molecular responses to axotomy
It has previously been reported that retinal ganglion cells regenerating their axons after an optic nerve crush in zebrafish upregulate not only L1.1 and L1.2 but also NCAM mRNA expression (Bernhardt et al., 1996). In the closely related goldfish, upregulation of an L1-like molecule and NCAM at the protein level has also been reported for retinal ganglion cells regenerating their axons (Bastmeyer et al., 1990; Vielmetter et al., 1991). In salamanders, protein expression of the 180 kDa isoform of NCAM is strong on normal and regenerating retinal ganglion cell axons; no information is available on L1 (Becker et al., 1993). These observations, together with the present findings, suggest that the upregulation of L1-related molecules is characteristic of a regenerative response for all classes of neurons in the zebrafish CNS (with the possible exception of the Mauthner cell), whereas increased expression of NCAM mRNA is not. Changes in the expression of L1 mRNA may serve as an indicator of the propensity of a neuron to regenerate a lesioned axon, as has recently been proposed for the expression of neurofilament mRNA in the regenerating lamprey CNS (Jacobs et al., 1997).
In contrast to adult mammalian CNS neurons (Chen et al., 1995; Li et al., 1995; Dusart et al., 1997), many cerebrospinal projection neurons in zebrafish have a capacity for axonal regrowth, as shown here and in a previous report (Becker et al., 1997). Nevertheless, the molecular responses to axotomy of cerebrospinal projection neurons in zebrafish show some interesting similarities to those of adult mammalian CNS neurons that can be induced to regrow their axons. For example, much like cerebrospinal projection neurons of zebrafish, the subpopulations of diencephalic neurons of adult rats that grow their axons into a peripheral nerve graft strongly upregulate L1 mRNA expression but fail to upregulate NCAM mRNA expression (Zhang et al., 1995b). The population of neurons that does not regrow into the peripheral nerve graft does not show increased expression of L1 mRNA. This shows that the upregulation of mRNA expression for L1-like molecules, similar to that of GAP-43 mRNA, might be a characteristic feature of regenerating vertebrate neurons.
Distance of axotomy from the neuronal soma influences gene expression and axonal growth across a lesion also in mammals. In rats, axonal regrowth (Richardson et al., 1984; Tetzlaff et al., 1994) and upregulation of GAP-43 mRNA expression in the nucleus ruber (Tetzlaff et al., 1994) occurs after proximal but not distal lesion of the rubrospinal tract followed by implantation of a peripheral nerve graft. Retinal ganglion cells of rats grow axons into a peripheral nerve transplant (Vidal-Sanz et al., 1987) and upregulate GAP-43 protein expression (Doster et al., 1991) only if the lesion is close to the neuronal soma. Thus, the mechanisms by which a regenerative response is triggered in zebrafish and mammalian CNS neurons may be similar (Skene, 1992).
Heterogeneity of the glial reaction to axotomy
Glial cells in the zebrafish spinal cord, most likely astrocytes or oligodendrocytes, that upregulate L1.2 mRNA expression after a spinal lesion differ from those in the optic nerve, because the latter show increased expression also of L1.1 and NCAM mRNA after injury (Bernhardt et al., 1996). This may be explained by regional heterogeneities in glial subtypes. Such heterogeneities have been described for astrocytes in goldfish (Maggs and Scholes, 1986; Levine, 1991; Nona and Stafford, 1995) or for the recognition molecule tenascin-C in astrocytes of the lesioned CNS in mammals (Bartsch et al., 1992; Ajemian et al., 1994; Zhang et al., 1995a). The upregulation of recognition molecules by glial cells of spontaneously regenerating systems may contribute to an environment that is conducive to axonal growth (Bastmeyer et al., 1991, 1994; Martini, 1994; Bernhardt et al., 1996). It will be interesting to see whether the different responses by glial cells in the optic pathway and in the spinal cord of fish lead to differences in the interactions with the regenerating axons.
Conclusion
Successful axonal regeneration depends on various neuron-intrinsic and neuron-extrinsic (glial) factors. We have demonstrated upregulation of the expression of mRNAs for cell recognition molecules to be correlated with both of these aspects of spontaneous regeneration in the adult zebrafish CNS. This points to a possible functional involvement of these molecules in axonal regeneration. The expression patterns of mRNAs for cell recognition molecules in both neurons and glia after injury are not stereotyped, but strongly depend on the brain region, and for the neurons they also depend on the cell type that is lesioned and the proximity of the lesion to the neuronal soma. Nevertheless, upregulation of L1-related molecules appears to be a consistent feature of axonal regrowth in vertebrates.
Footnotes
T. B. is the recipient of postdoctoral fellowships from the Deutsche Forschungsgemeinschaft (Be 1650/1-1) and the European Union. This work was supported by the Deutsche Forschungsgemeinschaft [Be 2013/1-1,2 (R.R.B., M.S.) and Wu 211/1-2 (M.F.W.)]. We thank Dr. C. G. Becker for sharing unpublished data and for helpful suggestions on this manuscript; D. Andjelovic, A. Kolar, M. Shirazi, and S. Wyss for excellent technical assistance; Dr. D. Grunwald for the NCAM-clone; Dr. J. Y. Kuwada for the CON1 antibody; and Dr. J. Scholes for the 4C4 antibody.
Correspondence should be addressed to Dr. Thomas Becker, Department of Cell and Developmental Biology, University of California Irvine, Irvine, CA92697-2275.
REFERENCES
- 1.Aigner L, Arber S, Kapfhammer JP, Laux T, Schneider C, Botteri F, Brenner HR, Caroni P. Overexpression of the neural growth-associated protein GAP-43 induces nerve sprouting in the adult nervous system of transgenic mice. Cell. 1995;83:269–278. doi: 10.1016/0092-8674(95)90168-x. [DOI] [PubMed] [Google Scholar]
- 2.Ajemian A, Ness R, David S. Tenascin in the injured rat optic nerve and in non-neuronal cells in vitro: potential role in neural repair. J Comp Neurol. 1994;340:233–242. doi: 10.1002/cne.903400208. [DOI] [PubMed] [Google Scholar]
- 3.Appel F, Holm J, Conscience JF, Schachner M. Several extracellular domains of the neural cell adhesion molecule L1 are involved in neurite outgrowth and cell body adhesion. J Neurosci. 1993;13:4764–4775. doi: 10.1523/JNEUROSCI.13-11-04764.1993. [DOI] [PMC free article] [PubMed] [Google Scholar]
- 4.Bartsch U, Bartsch S, Dorries U, Schachner M. Immunohistological localization of tenascin in the developing and lesioned adult mouse optic nerve. Eur J Neurosci. 1992;4:338–352. doi: 10.1111/j.1460-9568.1992.tb00881.x. [DOI] [PubMed] [Google Scholar]
- 5.Bastmeyer M, Schlosshauer B, Stürmer CAO. The spatio-temporal distribution of N-CAM in the retinotectal pathway of adult goldfish detected by the monoclonal antibody D3. Development. 1990;108:299–311. doi: 10.1242/dev.108.2.299. [DOI] [PubMed] [Google Scholar]
- 6.Bastmeyer M, Beckmann M, Schwab ME, Stuermer CAO. Growth of regenerating goldfish axons is inhibited by rat oligodendrocytes and CNS myelin but not by goldfish optic nerve tract oligodendrocyte-like cells and fish CNS myelin. J Neurosci. 1991;11:626–640. doi: 10.1523/JNEUROSCI.11-03-00626.1991. [DOI] [PMC free article] [PubMed] [Google Scholar]
- 7.Bastmeyer M, Jeserich G, Stürmer CAO. Similarities and differences between fish oligodendrocytes and Schwann cells in vitro. Glia. 1994;11:300–314. doi: 10.1002/glia.440110403. [DOI] [PubMed] [Google Scholar]
- 8.Becker T, Becker CG, Niemann U, Naujoks-Manteuffel C, Gerardy-Schahn R, Roth G. Amphibian-specific regulation of polysialic acid and the neural cell adhesion molecule in development and regeneration of the retinotectal system of the salamander Pleurodeles waltl. J Comp Neurol. 1993;336:532–544. doi: 10.1002/cne.903360406. [DOI] [PubMed] [Google Scholar]
- 9.Becker T, Wullimann MF, Becker CG, Bernhardt RR, Schachner M. Axonal regrowth after spinal cord transection in adult zebrafish. J Comp Neurol. 1997;377:577–595. doi: 10.1002/(sici)1096-9861(19970127)377:4<577::aid-cne8>3.0.co;2-#. [DOI] [PubMed] [Google Scholar]
- 10.Benowitz LI, Routtenberg A. GAP-43: an intrinsic determinant of neuronal development and plasticity. Trends Neurosci. 1997;20:84–91. doi: 10.1016/s0166-2236(96)10072-2. [DOI] [PubMed] [Google Scholar]
- 11.Bernhardt RR, Chitnis AB, Lindamer L, Kuwada JY. Identification of spinal neurons in the embryonic and larval zebrafish. J Comp Neurol. 1990;302:603–616. doi: 10.1002/cne.903020315. [DOI] [PubMed] [Google Scholar]
- 12.Bernhardt RR, Patel CK, Wilson SW, Kuwada JY. Axonal trajectories and distribution of GABAergic neurons in wildtype and mutant zebrafish lacking floor plate cells. J Comp Neurol. 1992;326:263–272. doi: 10.1002/cne.903260208. [DOI] [PubMed] [Google Scholar]
- 13.Bernhardt RR, Tongiorgi E, Anzini P, Schachner M. Increased expression of specific recognition molecules by retinal ganglion cells and by the optic pathway glia accompanies the successful regeneration of retinal axons in adult zebrafish. J Comp Neurol. 1996;376:253–264. doi: 10.1002/(SICI)1096-9861(19961209)376:2<253::AID-CNE7>3.0.CO;2-2. [DOI] [PubMed] [Google Scholar]
- 14.Bormann P, Zumsteg VM, Roth LWA, Reinhard E. Target contact regulates GAP-43 and α-tubulin mRNA levels in regenerating retinal ganglion cells. J Neurosci Res. 1998;52:405–419. doi: 10.1002/(SICI)1097-4547(19980515)52:4<405::AID-JNR4>3.0.CO;2-D. [DOI] [PubMed] [Google Scholar]
- 15.Chen DF, Jhaveri S, Schneider GE. Intrinsic changes in developing retinal neurons result in regenerative failure of their axons. Proc Natl Acad Sci USA. 1995;92:7287–7291. doi: 10.1073/pnas.92.16.7287. [DOI] [PMC free article] [PubMed] [Google Scholar]
- 16.Chong MS, Woolf CJ, Andrews P, Turmaine M, Schreyer DJ, Anderson PN. The downregulation of GAP-43 is not responsible for the failure of regeneration in freeze-killed nerve grafts in the rat. Exp Neurol. 1994;129:311–320. doi: 10.1006/exnr.1994.1173. [DOI] [PubMed] [Google Scholar]
- 17.Coggeshall RE, Lekan HA. Methods for determining numbers of cells and synapses: a case for more uniform standards of review. J Comp Neurol. 1996;364:6–15. doi: 10.1002/(SICI)1096-9861(19960101)364:1<6::AID-CNE2>3.0.CO;2-9. [DOI] [PubMed] [Google Scholar]
- 18.Daniloff JK, Levi G, Grumet M, Rieger F, Edelman GM. Altered expression of neural cell adhesion molecules induced by nerve injury and repair. J Cell Biol. 1986;103:929–945. doi: 10.1083/jcb.103.3.929. [DOI] [PMC free article] [PubMed] [Google Scholar]
- 19.Davis GR, McClellan AD. Extent and time course of restoration of descending brainstem projections in spinal cord-transected lamprey. J Comp Neurol. 1994a;344:65–82. doi: 10.1002/cne.903440106. [DOI] [PubMed] [Google Scholar]
- 20.Davis GR, McClellan AD. Long distance axonal regeneration of identified lamprey reticulospinal neurons. Exp Neurol. 1994b;127:94–105. doi: 10.1006/exnr.1994.1083. [DOI] [PubMed] [Google Scholar]
- 21.Doster SK, Lozano AM, Aguayo AJ, Willard MB. Expression of the growth-associated protein GAP-43 in adult rat retinal ganglion cells following axon injury. Neuron. 1991;6:635–647. doi: 10.1016/0896-6273(91)90066-9. [DOI] [PubMed] [Google Scholar]
- 22.Dusart I, Airaksinen MS, Sotelo C. Purkinje cell survival and axonal regeneration are age dependent: an in vitro study. J Neurosci. 1997;17:3710–3726. doi: 10.1523/JNEUROSCI.17-10-03710.1997. [DOI] [PMC free article] [PubMed] [Google Scholar]
- 23.Fawcett JW. Intrinsic neuronal determinants of regeneration. Trends Neurosci. 1992;15:5–8. doi: 10.1016/0166-2236(92)90338-9. [DOI] [PubMed] [Google Scholar]
- 24.Fetcho JR, Faber DS. Identification of motoneurons and interneurons in the spinal network for escapes initiated by the Mauthner cell in goldfish. J Neurosci. 1988;8:4192–4213. doi: 10.1523/JNEUROSCI.08-11-04192.1988. [DOI] [PMC free article] [PubMed] [Google Scholar]
- 25.Holtmaat AJ, Dijkhuizen PA, Oestereicher AB, Romijn HJ, Van der Lugt NM, Berns A, Margolis FL, Gispen WH, Verhaagen J. Directed expression of the growth-associated protein B-50/GAP-43 to olfactory neurons in transgenic mice results in changes in axon morphology and extraglomerular fiber growth. J Neurosci. 1995;15:7953–7965. doi: 10.1523/JNEUROSCI.15-12-07953.1995. [DOI] [PMC free article] [PubMed] [Google Scholar]
- 26.Jacobs AJ, Swain GP, Snedeker JA, Pijak DS, Gladstone LJ, Selzer ME. Recovery of neurofilament expression selectively in regenerating reticulospinal neurons. J Neurosci. 1997;17:5206–5220. doi: 10.1523/JNEUROSCI.17-13-05206.1997. [DOI] [PMC free article] [PubMed] [Google Scholar]
- 27.Levine RL. Gliosis during optic fiber regeneration in the goldfish: an immunohistochemical study. J Comp Neurol. 1991;312:549–560. doi: 10.1002/cne.903120406. [DOI] [PubMed] [Google Scholar]
- 28.Li D, Field PM, Raisman G. Failure of axon regeneration in postnatal rat entorhino-hippocampal slice coculture is due to maturation of the axon, not that of the pathway or target. Eur J Neurosci. 1995;7:1164–1171. doi: 10.1111/j.1460-9568.1995.tb01106.x. [DOI] [PubMed] [Google Scholar]
- 29.Maggs A, Scholes J. Glial domains and nerve fiber patterns in the fish retinotectal pathway. J Neurosci. 1986;6:424–438. doi: 10.1523/JNEUROSCI.06-02-00424.1986. [DOI] [PMC free article] [PubMed] [Google Scholar]
- 30.Martini R. Expression and functional roles of neural cell surface molecules and extracellular matrix components during development and regeneration of peripheral nerves. J Neurocytol. 1994;23:1–28. doi: 10.1007/BF01189813. [DOI] [PubMed] [Google Scholar]
- 31.Martini R, Schachner M. Immunoelectron microscopic localization of neural cell adhesion molecules (L1, N-CAM, and myelin-associated glycoprotein) in regenerating adult mouse sciatic nerve. J Cell Biol. 1988;106:1735–1746. doi: 10.1083/jcb.106.5.1735. [DOI] [PMC free article] [PubMed] [Google Scholar]
- 32.Nieke J, Schachner M. Expression of the neural cell adhesion molecules L1 and N-CAM and their common carbohydrate epitope L2/HNK-1 during development and after transection of the mouse sciatic nerve. Differentiation. 1985;30:141–151. doi: 10.1111/j.1432-0436.1985.tb00525.x. [DOI] [PubMed] [Google Scholar]
- 33.Nona SN, Stafford CA. Glial repair at the lesion site in regenerating goldfish spinal cord: an immunohistochemical study using species-specific antibodies. J Neurosci Res. 1995;42:350–356. doi: 10.1002/jnr.490420309. [DOI] [PubMed] [Google Scholar]
- 34.Rathjen FG, Nörenberg U, Volkmer H. Glycoproteins implicated in neural cell adhesion and axonal growth. Biochem Soc Trans. 1992;20:405–409. doi: 10.1042/bst0200405. [DOI] [PubMed] [Google Scholar]
- 35.Reichardt LF, Bossy B, Carbonetto S, Decurtis I, Emmett C, Hall DE, Ignatius MJ, Lefcort F, Napolitano E, Large T, Neugebauer KM, Tomaselli KJ. Neuronal receptors that regulate axon growth. Cold Spring Harbor Symp Quant Biol. 1990;55:341–350. doi: 10.1101/sqb.1990.055.01.035. [DOI] [PubMed] [Google Scholar]
- 36.Reinhard E, Nedivi E, Wegner J, Skene JHP, Westerfield M. Neural selective activation and temporal regulation of a mammalian GAP-43 promoter in zebrafish. Development. 1994;120:1767–1775. doi: 10.1242/dev.120.7.1767. [DOI] [PubMed] [Google Scholar]
- 37.Richardson PM, Issa VMK, Aguayo AJ. Regeneration of long spinal axons in the rat. J Neurocytol. 1984;13:165–182. doi: 10.1007/BF01148324. [DOI] [PubMed] [Google Scholar]
- 38.Sandig M, Rao Y, Siu CH. The homophilic binding site of the neural cell adhesion molecule NCAM is directly involved in promoting neurite outgrowth from cultured neural retinal cells. J Biol Chem. 1994;269:14841–14848. [PubMed] [Google Scholar]
- 39.Schachner M, Antonicek H, Fahrig T, Faissner A, Fischer G, Künemund V, Martini R, Meyer A, Persohn E, Pollerberg E, Probstmeyer R, Sadoul K, Sadoul R, Seilheimer B, Thor G. Families of neural recognition molecules. In: Edelman GM, Cunningham BA, Thiery JP, editors. Morphoregulatory molecules. Wiley; New York: 1990. pp. 443–468. [Google Scholar]
- 40.Schwab ME, Kapfhammer JP, Bandtlow CE. Inhibitors of neurite growth. Annu Rev Neurosci. 1993;16:565–595. doi: 10.1146/annurev.ne.16.030193.003025. [DOI] [PubMed] [Google Scholar]
- 41.Sharma SC, Jadhao AG, Prasada Rao PD. Regeneration of supraspinal projection neurons in the adult goldfish. Brain Res. 1993;620:221–228. doi: 10.1016/0006-8993(93)90159-k. [DOI] [PubMed] [Google Scholar]
- 42.Shea TB, Benowitz LI. Inhibition of neurite outgrowth following intracellular delivery of anti-GAP-43 antibodies depends upon culture conditions and method of neurite induction. J Neurosci Res. 1995;41:347–354. doi: 10.1002/jnr.490410307. [DOI] [PubMed] [Google Scholar]
- 43.Skene JHP. Axonal-growth associated proteins. Annu Rev Neurosci. 1989;12:127–156. doi: 10.1146/annurev.ne.12.030189.001015. [DOI] [PubMed] [Google Scholar]
- 44.Skene JHP. Retrograde pathways controlling expression of a major growth cone component in the adult CNS. In: Letourneau PC, Kater SB, Macagno ER, editors. The nerve growth cone. Raven; New York: 1992. pp. 463–475. [Google Scholar]
- 45.Strittmatter SM, Fankhauser C, Huang PL, Mashimo H, Fishman MC. Neuronal pathfinding is abnormal in mice lacking the neuronal growth cone protein GAP-43. Cell. 1995;80:445–452. doi: 10.1016/0092-8674(95)90495-6. [DOI] [PubMed] [Google Scholar]
- 46.Tetzlaff W, Kobayashi NR, Giehl KMG, Tsui BJ, Cassar SL, Bedard AM. Response of rubrospinal and corticospinal neurons to injury and neurotrophins. In: Seil FJ, editor. Neural regeneration. Elsevier; Amsterdam: 1994. pp. 271–286. [DOI] [PubMed] [Google Scholar]
- 47.Tongiorgi E, Bernhardt RR, Schachner M. Zebrafish neurons express two L1-related molecules during early axonogenesis. J Neurosci Res. 1995;42:547–561. doi: 10.1002/jnr.490420413. [DOI] [PubMed] [Google Scholar]
- 48.Van Raamsdonk W, Bosch TJ, Smitonel MJ, Maslam S. Organisation of the zebrafish spinal cord: distribution of motoneuron dendrites and 5-HT containing cells. Eur J Morphol. 1996;34:65–77. doi: 10.1076/ejom.34.2.65.13021. [DOI] [PubMed] [Google Scholar]
- 49.Vaudano E, Campbell G, Anderson PN, Davies AP, Woolhead C, Schreyer DJ, Lieberman AR. The effects of a lesion or a peripheral nerve graft on GAP-43 upregulation in the adult rat brain: an in situ hybridization and immunocytochemical study. J Neurosci. 1995;15:3594–3611. doi: 10.1523/JNEUROSCI.15-05-03594.1995. [DOI] [PMC free article] [PubMed] [Google Scholar]
- 50.Vidal-Sanz M, Bray GM, Villegas-Pérez MP, Thanos S, Aguayo AJ. Axonal regeneration and synapse formation in the superior colliculus by retinal ganglion cells in the rat. J Neurosci. 1987;7:2894–2909. doi: 10.1523/JNEUROSCI.07-09-02894.1987. [DOI] [PMC free article] [PubMed] [Google Scholar]
- 51.Vielmetter J, Lottspeich F, Stuermer CAO. The monoclonal antibody-E587 recognizes growing (new and regenerating) retinal axons in the goldfish retinotectal pathway. J Neurosci. 1991;11:3581–3593. doi: 10.1523/JNEUROSCI.11-11-03581.1991. [DOI] [PMC free article] [PubMed] [Google Scholar]
- 52.Weiner OD, Zorn AM, Krieg PA, Bittner GD. Medium weight neurofilament mRNA in goldfish Mauthner axoplasm. Neurosci Lett. 1996;213:83–86. doi: 10.1016/0304-3940(96)12860-3. [DOI] [PMC free article] [PubMed] [Google Scholar]
- 53.Wullimann MF, Rupp B, Reichert H. Neuroanatomy of the zebrafish brain: a topological atlas. Birkhäuser; Basel: 1996. [Google Scholar]
- 54.Zhang Y, Anderson PN, Campbell G, Mohajeri H, Schachner M, Lieberman AR. Tenascin-C expression by neurons and glial cells in the rat spinal cord: changes during postnatal development and after dorsal root or sciatic nerve injury. J Neurocytol. 1995a;24:585–601. doi: 10.1007/BF01257374. [DOI] [PubMed] [Google Scholar]
- 55.Zhang Y, Campbell G, Anderson PN, Martini R, Schachner M, Lieberman AR. Molecular basis of interactions between regenerating adult rat thalamic axons and Schwann cells in peripheral nerve grafts. 1. neural cell adhesion molecules. J Comp Neurol. 1995b;361:193–209. doi: 10.1002/cne.903610202. [DOI] [PubMed] [Google Scholar]
- 56.Zhao XO, Siu CH. Colocalization of the homophilic binding site and the neuritogenic activity of the cell adhesion molecule L1 to its second Ig-like domain. J Biol Chem. 1995;270:29413–29421. doi: 10.1074/jbc.270.49.29413. [DOI] [PubMed] [Google Scholar]
- 57.Zottoli SJ, Bentley AP, Feiner DG, Hering JR, Prendergast BJ, Rieff HI. Spinal cord regeneration in adult goldfish: implications for functional recovery in vertebrates. In: Seil FJ, editor. Neural regeneration. Elsevier; Amsterdam: 1994. pp. 219–228. [DOI] [PubMed] [Google Scholar]