

Abstract
Several lines of evidence indicate that cholinergic basalis neurons play an important role in cortical activation. The present study was undertaken to determine the effect of noradrenergic and serotonergic modulation of the cholinergic neurons on cortical EEG activity and sleep–wake states. The neurotransmitters were injected into the region of the basalis neurons by remote control in freely moving, naturally sleeping–waking rats during the day when the rats are normally asleep the majority of the time. Effects were observed on behavior and EEG activity, including high-frequency γ activity (30–60 Hz), which has been demonstrated to reflect behavioral and cortical arousal in the rat. Noradrenaline, which has been shown in previous in vitro studies to depolarize and excite the cholinergic cells, produced a dose-dependent increase in γ-EEG activity, a decrease in δ activity, and an increase in waking. Serotonin, which has been found in previous in vitro studies to hyperpolarize the cholinergic neurons, produced a dose-dependent decrease in γ-EEG activity with no significant change in amounts of wake or slow wave sleep. Both chemicals resulted in a dose-dependent decrease in paradoxical sleep.
These results demonstrate that noradrenaline and serotonin exert differential modulatory effects on EEG activity through the basal forebrain, the one facilitating γ activity and eliciting waking and the other diminishing γ activity and not significantly affecting slow wave sleep. The results also confirm that the cholinergic basalis neurons play an important role in cortical activation and particularly in the high-frequency γ activity that underlies cortical and behavioral arousal of the wake state.
Keywords: waking, slow wave sleep, paradoxical sleep, locus coeruleus, raphe, basal forebrain, acetylcholine
Early studies, which investigated the effects of pharmacological manipulation of cholinergic transmission or examined the release of acetylcholine (ACh) from the cerebral cortex across sleep–wake states, clearly indicated that cholinergic neurons play an important role in cortical activation that occurs during the states of wake and paradoxical sleep (Celesia and Jasper, 1966; Longo, 1966; Jasper and Tessier, 1971) (for review, see Jones, 1993). The neurons that provide the major cholinergic innervation to the cerebral cortex are located in the nucleus basalis of Meynert (Shute and Lewis, 1967; Lehmann et al., 1980; Rye et al., 1984). Lesions of the basal forebrain cholinergic cells are associated with a decrease in cortical ACh release and a parallel decrease in cortical activation (Lo Conte et al., 1982; Stewart et al., 1984; Buzsáki et al., 1988). Reciprocally, electrical or chemical stimulation of the cholinergic basalis neurons in anesthetized or brainstem-transected animals leads to a parallel increase in cortical ACh release and cortical activation (Casamenti et al., 1986; Rasmusson et al., 1994). In the present study we examined the effects of chemical stimulation in naturally sleeping–waking rats on sleep–wake state and EEG activity, focusing on high-frequency γ activity (30–60 Hz), which we have shown to be indicative of behavioral and cortical arousal in the rat (Maloney et al., 1997).
Cholinergic basal forebrain neurons lie in the path of the major ascending fiber system from the brainstem reticular activating system and thus serve as the ventral extrathalamic relay to the cerebral cortex (Moruzzi and Magoun, 1949; Starzl et al., 1951). The brainstem neurons projecting into the region of the cholinergic basalis neurons are composed of monoaminergic neurons in addition to putative glutamatergic neurons of the reticular formation (for review, seeJones, 1995). Thus, noradrenergic locus coeruleus and serotonergic raphe neurons project into the basal forebrain in addition to projecting directly to the cerebral cortex (Semba et al., 1988; Jones and Cuello, 1989; Jones, 1995). More recently, by intracellular recording and labeling in vitro, identified cholinergic basalis neurons were shown to be innervated by noradrenergic and serotonergic fibers and to be modulated in different ways by these two neurotransmitters (Khateb et al., 1992, 1993; Fort et al., 1995). Noradrenaline was found to depolarize and excite, whereas serotonin (5-hydroxytryptamine; 5-HT) was found to hyperpolarize and inhibit the cholinergic cells. The significance or role of this modulation in vivo, however, remains to be determined. The aim of the present study thus was to examine the effects of microinjections of noradrenaline and serotonin into the region of the cholinergic basalis neurons on cortical EEG activity and sleep–wake state in freely moving, naturally sleeping–waking animals. This was accomplished by developing a microinjection procedure that allowed remote control for the lowering of the filled cannulae and injection of the chemicals. The results show different effects of noradrenaline and serotonin on γ-EEG activity and sleep–wake states.
Preliminary results of this study were reported previously (Cape and Jones, 1994).
MATERIALS AND METHODS
Animals and surgery. A total of 24 male Wistar rats (Charles River Canada, Montréal, Canada), weighing between 200 and 250 gm at the time of surgery, were used in this study. Nine animals were used for pilot studies, and 15 were used for experimental studies. For implantation of electrodes and cannulae, animals were anesthetized with barbiturate anesthesia (Somnotol, 67 mg/kg, i.p.) and placed in the stereotaxic instrument with the tooth bar set at −0.33 mm. For EEG recording, jeweller’s screws (1 mm diameter at exposed tip and 3 mm in length) were threaded into burr holes in the skull to come into minimal contact with the dura. They were placed bilaterally by reference to Bregma over frontal (2.7–3.0 mm anterior, 0.6 mm lateral), retrosplenial (3.5 mm posterior, 0.6 mm lateral), parietal (0.5 mm posterior, 5.0 mm lateral), and occipital (7.5 mm posterior, 5.0 mm lateral) cortical regions. A reference electrode was cemented in bone rostral to the frontal cortex and caudal to the olfactory bulbs (5.5 mm anterior, 0.6 mm lateral). EMG was recorded by means of two stainless steel wires inserted in the neck musculature. A ground electrode was implanted over the cerebellum (∼1 mm posterior to lambda and 2 mm from the midline). The electrodes were joined to a small female connector.
For microinjections, stainless-steel cannulae (Plastics One, Roanoke, VA) were used and included guide cannulae (26 gauge, 0.46 mm outer diameter) with fitted dummy stylets and internal cannulae (33 gauge, 0.20 mm outer diameter). The guide cannulae were placed bilaterally such that when the internal cannulae were lowered 2.0 mm below the tip of the guides, they reached the target site in the basal forebrain [using anterior–posterior (AP), lateral (L), and vertical (V) coordinates with reference to ear bar zero: AP +7.7 mm, L 2.5 mm, and V +1.5 mm] (see Fig. 1). The guide cannulae were implanted and maintained with dummy stylets that extended beyond the guides by 0.5 mm. The guide cannulae and electrodes were fixed to the skull with dental cement.
Fig. 1.

A, Schematic drawing of the rat brain (in sagittal view) illustrating chemical microinjections into the region of cholinergic basalis neurons (open circles), which are known to project to the cerebral cortex (dashed lines) and to receive input from noradrenergic and serotonergic afferents (solid lines), respectively, arriving from the dorsal raphe (DR) and locus coeruleus (LC) nuclei in the brainstem [adapted with permission from Jones (1995)]. Bilateral microinjections of Ringer’s, noradrenaline, or serotonin were performed by insertion of inner injection cannulae into chronically indwelling guide cannulae. The cannulae are drawn according to the coordinates used for implantation and the histological verification of their position. At the time of the experiment, inner cannulae, which were filled with the chemical for injection, were inserted first within the guide cannulae (to within ∼2 mm of tip, marked byarrow), where they were held until the time of injection. Immediately before injection, the inner cannulae on both sides were lowered by a remote driving mechanism (∼4 mm) to pass out of the guide cannulae, through the globus pallidus (GP), into the substantia innominata (SI; to ∼2 mm below the guide cannulae, marked by lower arrow), and above the magnocellular preoptic nucleus (MCPO). The diffusion of the chemical solution is depicted according to estimates that are based on previous injections of the same volume (0.5 μl) of neuroanatomical tracers into the basal forebrain (Jones and Yang, 1985; Jones and Beaudet, 1987). B, Drawing of coronal section through the middle of the injection site showing approximate placement of cannulae, based on the location of tracks, in relationship to ChAT-immunostained cells (mapped with the aid of an image analysis system). ac, Anterior commissure; AV, anteroventral thalamic nucleus; CL, centrolateral thalamic nucleus; CPu, caudate putamen;DpMe, deep mesencephalic reticular field;FF, fields of Forel; Gi, gigantocellular reticular field; GiA, gigantocellular reticular field, α part; GiV, gigantocellular reticular field, ventral part; GP, globus pallidus; ic, internal capsule; LC, locus coeruleus;LD, laterodorsal thalamic nucleus; LH, lateral hypothalamic area; LP, lateral posterior thalamic nucleus; MCPO, magnocellular preoptic nucleus;oc, optic chiasm; opt, optic tract;OTuD, olfactory tubercle, deep layer; PC, paracentral thalamic nucleus; PF, parafascicular thalamic nucleus; PnC, pontine reticular field, caudal part; PnO, pontine reticular field, oral part;PnV, pontine reticular field, ventral part;PPTg, pedunculopontine tegmental nucleus;R, red nucleus; RRF, retrorubral field;Rt, reticular thalamic nucleus; SIa, substantia innominata, anterior part; SIp, substantia innominata, posterior part; SN, substantia nigra;st, stria terminalis; VL, ventrolateral thalamic nucleus; VM, ventromedial thalamic nucleus;VTA, ventral tegmental area; ZI, zona incerta.
After a minimum of 2 d recovery after surgery, each rat was housed individually in a Plexiglas box inside a large electrically shielded recording chamber in which they were maintained on a 12:12 light–dark cycle (lights on from 7:00 A.M. to 7:00 P.M.). They had free access to rat chow and water. For the duration of the experiment, the connector on the rat’s head was attached to a cable connected to a commutator that was suspended with a balanced boom to allow free movement of the animal in the chamber. Baseline recording was initiated after a minimum of 2 d habituation to the chamber and cable.
At the end of the experiments, the animals were killed under barbiturate anesthesia (Somnotol, ∼120 mg/kg). Most (20 of 24) were perfused through the heart with a fixative solution [3.0% paraformaldehyde, as published previously (Gritti et al., 1993)]. The brains were frozen and subsequently were processed for histology and choline acetyltransferase immunohistochemistry (Gritti et al., 1993) so that the placement of the cannulae could be examined.
EEG recording and behavioral observations. The EEG and EMG signals were recorded with a Grass model 78D polygraph. All signals were filtered between 1.0 and 100 Hz. The EEG signals were recorded with a gain that was adjusted to be the same on each channel and to remain the same for the duration of the study. The amplifier output was sent to an IBM compatible computer running Stellate Systems software (Montréal, Québec, Canada) for on-line analog-to-digital (A/D) conversion and off-line analysis of EEG. The signals were sampled at a rate of 512 Hz and filtered with a Finite Impulse Response (FIR) filter with a cut-off frequency at 128 Hz. The data were stored at a sampling rate of 256 Hz.
The rat’s behavior was observed with the aid of a video monitor and marked on-line by annotations on the computer record. Behavioral annotations included the following in the order in which they frequently occur during a normal sleep–wake cycle in association with a waking (W) or sleep (S) posture: Wattentive (when the animal was immobile and seemingly attending to a stimulus), Wmoving (including walking), Weating, Wgrooming, Wquiet (when the animal was lying down but with eyes open), Suncurled (outstretched with eyes closed), Scurled (curled up with eyes closed), Smoving (adjusting posture with eyes closed), and Stwitch (showing rapid movements of eyes, ears, or whiskers while asleep with eyes closed) (Maloney et al., 1997).
Recording was performed beginning in the late morning and usually ending by 3:00 P.M. in the afternoon. The EEG computer file consisted of a morning recording period (∼11:00 A.M.–11:30 A.M., taken before handling) and an afternoon recording period (∼12:30 P.M.–3:00 P.M., taken after handling and the placement of the inner cannulae for microinjections). The afternoon recording was not begun until the animal had recovered from the handling, as evidenced behaviorally by the resumption of sleep. For baseline recording that was performed before any injections, the animal was picked up and handled during the time that the injection cannulae would be inserted.
Injection procedure. Ringer’s and chemical injections proceeded in several stages (see Fig. 1A). After the 30 min morning recording (defined as the preinjection period), the animal was picked up for removal of the stylets and manual placement of the filled internal cannulae. The filled cannulae were inserted into the guide cannulae and held there in a position ∼2 mm above the tissue (i.e., ∼4 mm dorsal to their eventual target; Fig.1A) to avoid premature contact of the chemical solution with the brain. After the rat’s recovery from the handling procedure, evidenced behaviorally by the apparent resumption of sleep, the afternoon recording session was begun. After the appearance of a full sleep cycle, evidenced on the EEG by the passage through slow wave sleep into transition into paradoxical sleep (tPS) or PS (usually over a ∼30 min period), the filled inner cannulae were lowered into the brain. This was accomplished without disturbing the rat by use of a remotely controlled mechanism consisting of inner tubing connected to the inner cannula that slid within outer tubing connected to the cap of the outer cannula on the rat’s head. From outside the cage, the inner tubing was slid forward to a point determined by the fitting of the hub of the inner cannulae into the cap of the outer cannula, which corresponds to the point of full descent of the inner cannula into the brain. The left and right cannulae were lowered in sequence. The injections subsequently were begun ∼2 min after the cannulae came into contact with the brain tissue. They were made bilaterally with a syringe pump (Sage Instruments, Cambridge, MA) that simultaneously advanced both syringe plungers over a period of ∼5 min. The postinjection condition was defined for statistical analysis as the 30 min period immediately after the injection and was based on the period during which the chemicals would diffuse maximally within the restricted radius of the injection site (Martin, 1991). Recording nonetheless was continued for at least 60 min after the injection, after which the inner cannulae and tubes were removed from the brain and head of the animal.
Chemical microinjections. Chemicals were delivered via two 1 μl Hamilton syringes (Reno, NV) simultaneously driven by a syringe pump (model 341 A, Sage Instruments, Orion Research, Cambridge, MA). Connected to the syringes, polyethylene tubing (∼50 cm) was filled with paraffin oil up to the last ∼1 cm (or ∼1.5 μl) of each inner cannula, which was filled with the chemical solution. The chemicals were dissolved in buffered Ringer’s containing (in mm) 156.14 NaCl, 3.35 KCl, 2.70 CaCl2, and 2.38 NaHCO3.
All solutions were injected in volumes of 0.5 μl (at a rate of ∼0.1 μl/min) that, on the basis of previous injections of neuroanatomical tracers into the basal forebrain (Jones and Yang, 1985; Jones and Beaudet, 1987), was estimated to diffuse from the tip of the cannula in a radius of up to 1 mm around the tip and >1 mm along the shaft of the cannulae (see Fig. 1). Initial doses and/or concentrations of noradrenaline and serotonin were based on those used in published studies and aimed at reaching adequate concentrations at neurotransmitter receptors over a wide area (Myers, 1974; Wenk, 1984). In pilot studies, noradrenaline (l-arterenol bitartrate; Sigma, St. Louis, MO) was injected at doses of 600, 250, 75, 50, and 25 nmol, all of which produced an awakening and arousal of differing intensities and durations. A dose of 75 nmol of noradrenaline (15 μg in a 0.5 μl total dose per side, corresponding to a concentration of 150 mm) was selected for a consistent, robust effect and administered to eight rats. Serotonin (5-hydroxytryptamine creatine sulfate, 5-HT; Sigma) was injected at doses of 1000, 500, 250, 125, and 62.5 nmol, none of which produced an awakening; instead, all appeared to produce a change in EEG activity that was apparent during diurnal sleep at the higher doses. A dose of 250 nmol of serotonin (53.2 μg in a 0.5 μl total dose per side, corresponding to a concentration of 500 mm) was selected for a consistent, robust effect and administered to 11 animals. In eight animals receiving both 5-HT and noradrenaline, the two drugs were administered in random order, with at least 48 hr between drug administrations.
Subsequently, another series of experiments was conducted in five rats to establish if the effects observed were dose-dependent. In addition to Ringer’s, four doses of each drug were administered, with the dose used in the main study as the maximum dose. For noradrenaline, the low dose was established as that producing a lesser but apparent effect, and the range represented doses at 100, 67, 50, and 33% of the dose used in the main study. For serotonin, the drug was administered at doses representing 100, 50, 25, and 12.5% of the dose used in the main study to include doses overlapping with those of noradrenaline. In these animals the order in which noradrenaline and serotonin were administered was varied across rats, and the interval separating the two drug administrations was at least 48 hr.
Data analysis. The EEG was examined by off-line analysis on a computer screen and scored by visual assessment according to sleep–wake states in 20 sec epochs. State was classified as one of five states: (1) wake, (2) transition into slow wave sleep (tSWS), (3) slow wave sleep (SWS), (4) transition into paradoxical sleep (tPS), and (5) paradoxical sleep (PS) (Maloney et al., 1997). Particularly during the postinjection condition, the state of the rat also was assessed by consideration of the behavioral annotations in addition to the EEG and EMG activities. Consequently, the annotations were used to identify any dissociations between behavior and the normally associated EEG patterns of the different states (Maloney et al., 1997). Each state was reported for the postinjection recording period as a percentage of total recording time.
Spectra were computed by using Stellate Systems software by Fast Fourier Transform (FFT), which was based on 512 points corresponding to 2 sec epochs, with a resolution of 0.5 Hz. A seven-point smoothing window was applied by this program, thus allowing a minimum of 1.5 Hz and a maximum 63.5 Hz in the spectral computation. Frequency bands were set at the following ranges: for δ, 1.5–4.0 Hz; for θ, 4.5–8.5 Hz; for ς, 9.0–14.0 Hz; for β1, 14.5–18.5 Hz; for β2, 19.0–30.0 Hz; and for γ, 30.5–58.0 Hz (eliminating frequencies at ∼60 Hz to avoid any possible contamination from AC noise) (Maloney et al., 1997). Total activity within each band was calculated automatically for 20 sec recording epochs that were scored for sleep–wake state. Based on the scored records, sleep–wake hypnograms were displayed in association with EEG frequency band activities from the right retrosplenial lead for 20 sec epochs over the recording sessions with Eclipse software (Stellate Systems). Spectral analysis also was performed with Rhythm software (Stellate Systems) on 4 sec epoch samples (n = 5 per rat), which were selected for uniformity as well as representativeness of EEG activity, at 1 min intervals ∼2–8 min postinjection. Spectrum and frequency band activities were displayed and reported in A/D amplitude units for which the average gain was calibrated as ∼1500 A/D units per millivolt on the EEG channels. Relative amplitudes of each band also were reported and correspond to the percentage of total activity (1.5–58.0 Hz). The ratio of θ/δ (Th/De) was calculated and reported as a reflection of regular θ activity in the EEG (Maloney et al., 1997). EMG amplitude was computed for the total spectrum up to 58.0 Hz.
EEG records and hypnograms displaying sleep–wake state and frequency band activity were examined after recording to establish, first, a normal EEG and, second, an effective microinjection. Data were excluded from analysis if any signs of abnormal EEG activity were evident as indicative of seizure-like activity common to rodents (Vergnes et al., 1982). Of 15 rats, three had to be eliminated for this reason, and data points were eliminated in two other rats because of the presence of abnormal activity after noradrenaline. One rat was eliminated because of an apparent failure of the drugs to be delivered consistently, which was interpreted as attributable to clogging of the cannulae.
Statistical comparisons were performed for the average percentage sleep–wake state and for EEG and EMG activity. For EEG activity, statistics were presented from the right retrosplenial cortical lead for γ and δ activity and for Th/De ratio, which were shown previously to reflect maximally the behavioral and state changes in the rat (Maloney et al., 1997). Comparisons were made first between post-Ringer’s and baseline conditions (in eight rats, by pairedt tests) to determine whether the Ringer’s microinjections were associated with any significant changes in EEG, behavior, or sleep–wake states. Comparisons subsequently were made between post-noradrenaline (in five rats) or post-serotonin (in eight rats, of which five also received noradrenaline) and post-Ringer’s conditions by paired comparisons (using Student’s t tests) for individual animals, involving one trial per condition per animal. For analysis of the dose–response relationships, an analysis of covariance (ANCOVA) was used, with dose as the main factor (df = 4) and subject as a covariate (df = 1), involving four rats for noradrenaline and three overlapping rats for serotonin (with a total of 31 data points). All statistics were performed with Systat software (Evanston, IL).
RESULTS
In histology, tracks of the injection cannulae were evident passing through the caudate putamen and globus pallidus into the substantia innominata [at the border between the anterior (SIa) and posterior (SIp) sectors] and above the magnocellular preoptic nucleus, where the cholinergic cell bodies are located (Fig.1B). They were bilaterally symmetric in all animals.
Baseline
During baseline recording periods, rats manifested brief waking episodes with alternating more prolonged periods of sleep. During the 30 min recording period of the afternoon (generally occurring between ∼1:00 P.M. and 2:00 P.M.), they all passed through at least one complete sleep cycle, as marked by the appearance of tPS and PS after tSWS and SWS (n = 8; Fig.2). The alternation of waking and sleeping and the full cycle passing from wake throughtSWS–SWS into tPS–PS were associated with differential changes in EEG frequency bands (Fig. 2). As shown previously (Maloney et al., 1997), γ activity was high during attentive and active periods of wake, often marked by increases in EMG activity, and during PS periods, which were characterized by low EMG activity. δ increased in the transition into SWS (tSWS) and was high during SWS. The ratio of Th/De, which reflects EEG rhythmic slow activity in the θ range (Maloney et al., 1997), appeared to vary in parallel with γ.
Fig. 2.

Hypnogram (top) and EEG and EMG frequency band activities (bottom) per 20 sec epoch during morning (left) and afternoon (right) recording periods (rat B10). For EEG, γ (Ga, 30.5–58.0 Hz) and δ (De, 1.5–4 Hz) absolute activities and θ/δ ratio (Th, 4.5–8.5 Hz/De, 1.5–4 Hz) from right retrosplenial cortex are displayed. Recording was begun in the morning (∼11:00 A.M. = 0) and continued for ∼30 min before the animal was handled for mock insertion of injection cannulae (during the break marked bydividing line). After relaxation and resumption of sleep (usually in ∼30–45 min), recording was begun again for the afternoon. In this baseline record, 0 marks the approximate time at which an injection would have been performed and thus defines the 30 min baseline period with which the Ringer’s postinjection period was compared (see Fig. 4). In this undisturbed period during baseline recording, the rat is asleep the majority of the time. γ is highest in association with brief periods of active wake (with high EMG activity) and with PS (with low EMG activity) and lowest in association with SWS. δ varies in a reciprocal manner, high in association with SWS and low during both wake and PS. The Th/De ratio is high during brief periods of active wake and highest during PS.Ga, De, and EMG frequency band activities are displayed as amplitude units scaled to maximum activity. In this figure, the maximum amplitude for Gais 157, for De is 417, and for EMG is 630 (A/D units, in which 100 units ≈ 79 μV); the maximum ratio ofTh/De is 2.4. Time lines indicate the baseline periods corresponding to 30 min pre- and postinjection recording periods.PS, Paradoxical sleep; SWS, slow wave sleep; tPS, transition into paradoxical sleep;tSWS, transition into slow wave sleep.
During the 30 min afternoon recording period in the baseline condition, which would correspond approximately to the postinjection period in the experimental condition, the rats were asleep, on average, the majority of the time (>70%; Fig. 3). They spent ∼55% of the time in tSWS and SWS and >15% intPS and PS. γ varied significantly as a function of state and was higher during wake and tPS and PS than duringtSWS and SWS; δ varied significantly in a reciprocal manner to γ across these states (as examined by repeated measures ANOVA, df = 4, 24; p ≤ 0.05). Th/De also varied significantly as a function of state and, like γ, was highest in wake and PS, although much higher on average in PS than in wake.
Fig. 3.

Average percentage of state and EEG and EMG activities from baseline recording during the 30 min afternoon (equivalent postinjection) recording period (see Fig. 2), demonstrating the amounts of each state and the associated changes in EEG and EMG activities. The % State reflects the relative amounts of time spent in each state; Ga and Deare frequency band activities, Th/De is the ratio of band activities, and EMG is the total spectral activity across sleep–wake states (EEG activities are taken from the right retrosplenial lead and are reported together with EMG as amplitude in A/D units, in which 100 units ≈ 79 μV, or are reported as a ratio). Data are presented as mean ± SEM for eight rats.Ga, De, Th/De, andEMG all varied significantly as a function of state (repeated measures ANOVA with df = 4, 24; p ≤ 0.05).
Microinjections
Whereas microinjections of Ringer’s solution did not appear to alter the sleep–wake states or EEG activities of the rats (Fig.4), microinjections of noradrenaline (Fig. 5) and serotonin (Fig.6) appeared to alter these in different ways (Figs. 7-10).
Fig. 4.

Hypnogram and EEG and EMG activities (per 20 sec epoch) during Ringer’s pre- and postinjection recording periods (rat B10). After the preinjection recording period, the filled inner cannulae were inserted in the guide cannulae (see Fig. 1), and the animal was allowed to resume sleeping before recording was reinitiated. With the appearance of a normal sleep cycle, marked by SWS andtPS, leading to PS, the cannulae were lowered via remote control into the basal forebrain (see Fig. 1); the bilateral injection was started ∼2 min later and was performed over ∼5 min. The postinjection recording period was defined as the 30 min period after the injection was stopped (time, 0–30 min at right). Note the minimal disturbance to the sleep–wake cycle caused by the injection procedure and the injection of Ringer’s. EEG frequency band activity is from the right retrosplenial lead and, together with EMG, is displayed as amplitude units or as a ratio scaled to maximum activity. In this figure, the maximum amplitude for Gais 180, for De is 360, and for EMG is 475 (A/D units, in which 100 units ≈ 79 μV); the maximumTh/De ratio is 2.2.
Fig. 5.

Hypnogram and EEG and EMG activities (per 20 sec epoch) during noradrenaline pre- and postinjection recording periods (rat B10). Note the immediate occurrence of wake once the filled cannulae are inserted and the maintenance of a wake state in association with moderately high γ-EEG activity and low δ-EEG activity during the entire postinjection period. BothTh/De and EMG remain relatively high. EEG frequency band activity is from the right retrosplenial lead and, together with EMG, is displayed as amplitude units or as a ratio scaled to maximum activity. In this figure, the maximum amplitude forGa is 155, for De is 395, and forEMG is 550 (A/D units, in which 100 units ≈ 79 μV); the maximum Th/De ratio is 2.3.
Fig. 6.

Hypnogram and EEG and EMG activities (per 20 sec epoch) during serotonin pre- and postinjection recording periods (rat B20). Note the continuity of SWS during and after the injection in association with a decrease in γ activity and the persistence of δ activity. No PS occurs in the postinjection period, andTh/De ratio remains low. Moderate EMG activity is present. The EEG frequency band activity is from the right retrosplenial lead and, together with EMG, is displayed as amplitude units or as a ratio scaled to maximum activity. In this figure, the maximum amplitude for Ga is 156, for Deis 380, and for EMG is 800 (A/D units, in which 100 units ≈ 79 μV); the maximum Th/De ratio is 3.6.
Fig. 7.
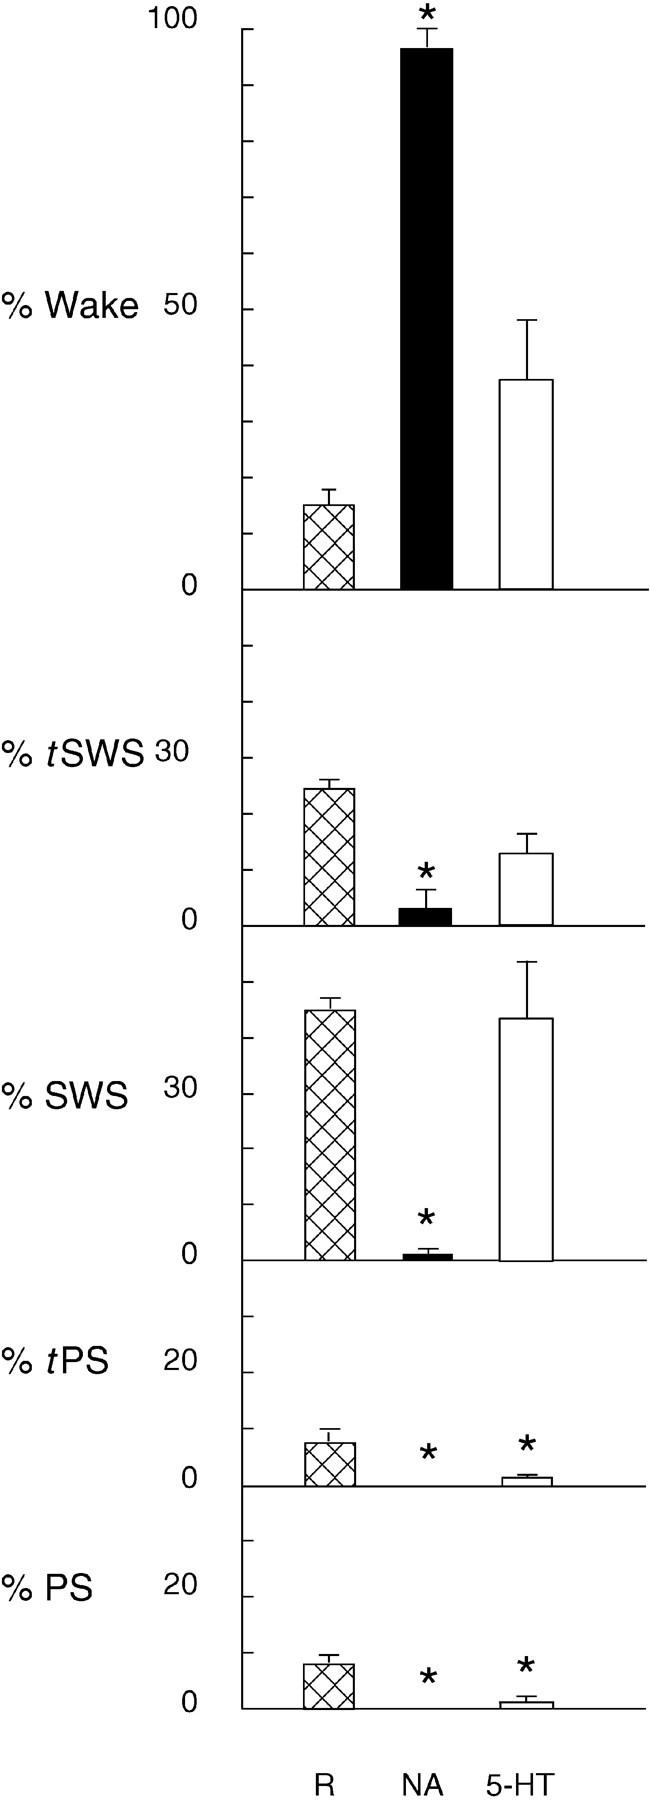
Percentage of time spent in sleep–wake states during Ringer’s (R), noradrenaline (NA), and serotonin (5-HT) postinjection periods. Values are mean ± SEM forR, n = 8; for NA,n = 5; and for 5-HT,n = 8. *Significantly different from Ringer’s, according to paired comparison t tests (p ≤ 0.05).
Fig. 8.
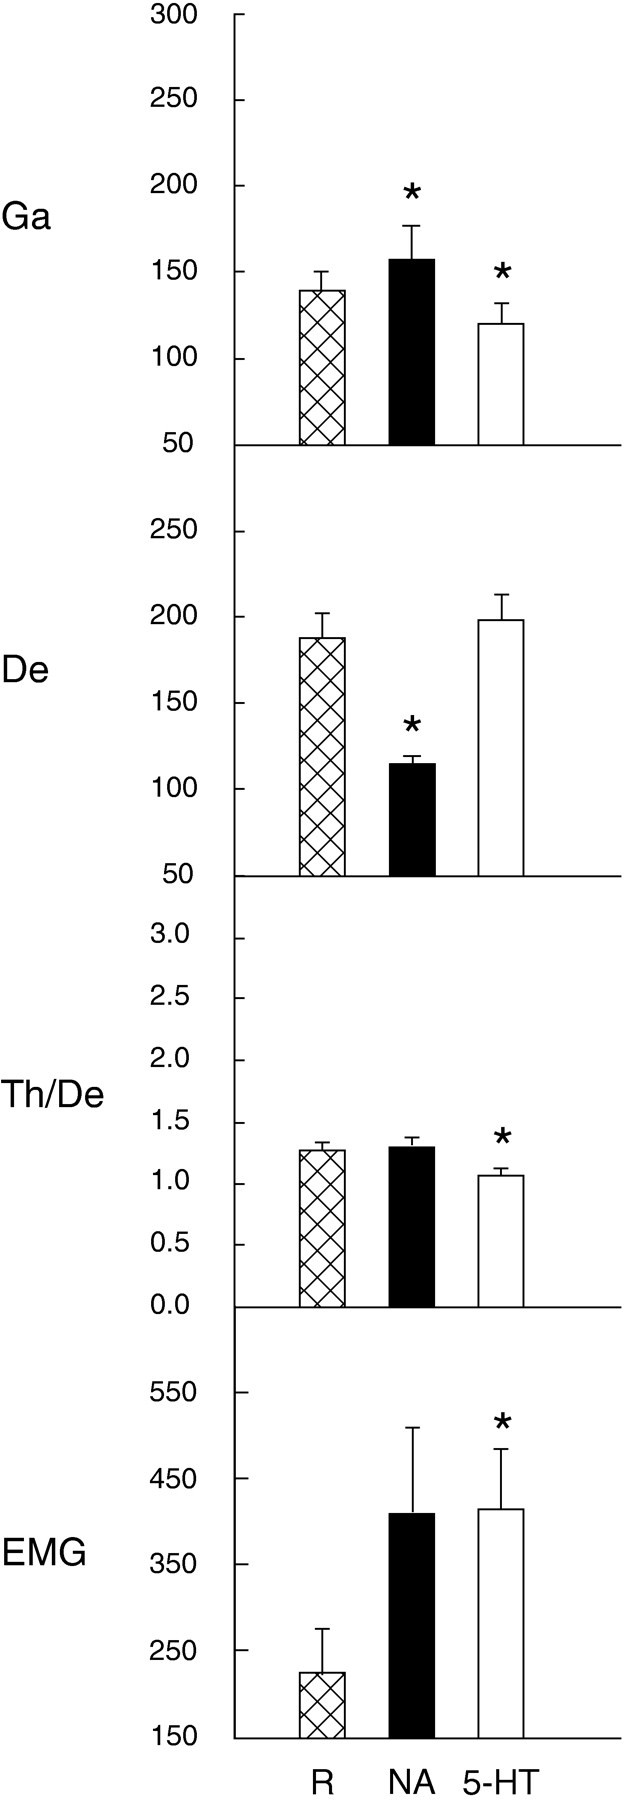
Average EEG and EMG activities during postinjection recording periods after Ringer’s (R), noradrenaline (NA), and serotonin (5-HT) microinjections. For EEG (from right retrosplenial lead), Ga and De are expressed as absolute activities in each frequency band (reported as amplitude in A/D units, in which 100 units ≈ 79 μV),Th/De as the ratio of absolute activities in each band, and EMG also as an absolute activity. Data are presented as mean ± SEM for R, n = 8; for NA, n = 5; for5-HT, n = 8. *Significantly different from Ringer’s, according to paired comparisont tests (p ≤ 0.05).
Fig. 9.
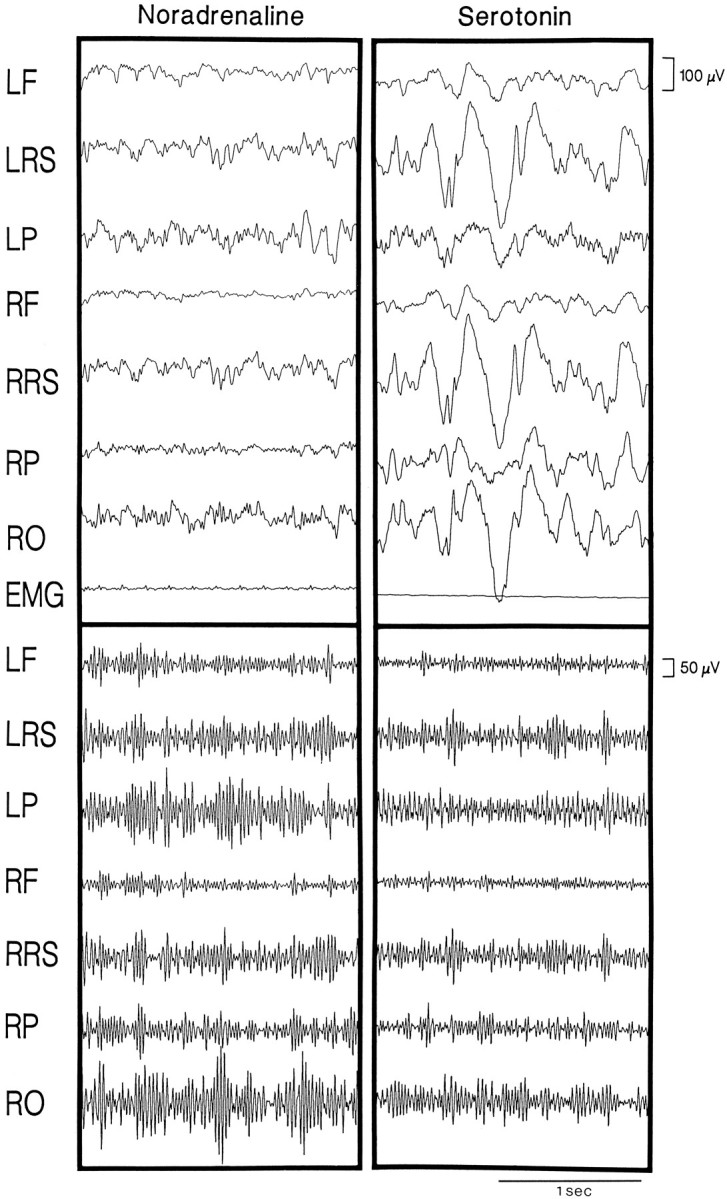
EEG samples from noradrenaline and serotonin postinjection recording periods. Shown are unfiltered (top) and high-frequency γ (30.5–58.0 Hz) filtered (bottom) EEG samples (2 sec each) illustrating EEG patterns that occurred during the respective postinjection recording periods. Noradrenaline produced a low-voltage fast EEG pattern (top) in association with relatively high γ activity (bottom), similar to normal wake (rat B10), whereas serotonin produced a high-voltage slow EEG pattern (top) in association with relatively low γ activity (bottom), similar to normal SWS (rat B20). The samples were taken ∼2–3 min after the injection was stopped. The EEG was recorded by reference to an electrode in the rostral frontal bone from the left and right frontal (LF andRF), retrosplenial (LRS andRRS), parietal (LP andRP), and occipital (RO) cortical regions. Voltage scales are the same for all cortical leads.
Fig. 10.

Average spectra from epochs after the injection of noradrenaline (rat B10) and serotonin (rat B20). After noradrenaline, a small low-frequency peak is in the θ range, and the overall amplitude in the γ range is relatively high. After serotonin, a prominent peak is evident in the δ band, and a relatively low overall amplitude is evident in the γ band. The spectra were computed from five 4 sec EEG segments from the right retrosplenial lead that were each 1 min apart and occurred within ∼2–8 min after the injection. Spectra are displayed in amplitude (A/D units, in which 100 ≈ 79 μV) per 0.5 Hz shown at different scales for the low-frequency range (1.5–18.5 Hz) and the high-frequency range (19.0–58.0 Hz) to maximize the appearance of potential peaks in each range. δ, θ, and γ frequency bands, which were used for calculating total activity per band (see Figs. 2-6, 8, 11), areshaded differentially.
Ringer’s solution
Most animals were awakened briefly when the injection cannulae were lowered into the basal forebrain, but all resumed sleeping before or during injections with Ringer’s solution (n = 8; see Fig. 4). After the injection was stopped, all rats experienced some epochs of SWS within the first 5 min. In the 30 min postinjection period, all animals showed an alternation of wake and SWS and a progression through SWS to tPS–PS ortPS. During these state changes, the EEG frequency band activities varied in association with state and behavior in a manner that was not distinguishable from that in the preinjection period or that in the baseline postinjection recording period.
As compared with the baseline afternoon recording period, there were no significant changes in the average relative amounts of sleep–wake states after Ringer’s injections (as examined in eight rats with paired comparison t tests). The rats were still asleep the majority of the time (>80%) and spent >65% of time intSWS and SWS and ∼15% in tPS and PS (Fig. 7), although the percentage of PS was insignificantly lower than that in baseline. Similarly, the average γ and δ activities were not different after Ringer’s (Fig. 8), as compared with baseline over the 30 min afternoon or postinjection period or in any of the sleep–wake states during that period. There was a significant change in Th/De ratio, being lower during the postinjection period after Ringer’s.
Noradrenaline
On the lowering of the filled cannulae, all rats woke up and remained awake before and during the injection of noradrenaline (75 nmol per side, n = 5; see Fig. 5). In the 30 min postinjection period, all rats remained awake except for some brief episodes of tSWS or SWS in some rats (2 of 5). EEG frequency band activities showed variable but generally moderately high γ activity during the postinjection period, which reached levels present during active waking or PS during the preinjection recording period in all rats. δ remained low during the postinjection recording period in all rats. The animals manifested normal waking behaviors, which included Wattentive (standing motionless with body and head erect) or Wmoving (moving or walking about the cage) but also occasionally Wquiet (recumbent with eyes open).
Across animals, the wake state was increased significantly (to an average of >95% of recording time), tSWS and SWS were decreased significantly, and PS and tPS were absent during the postinjection recording period after noradrenaline (Fig. 7). There was a significant increase in average γ activity and a significant decrease in average δ activity, as compared with those after Ringer’s during this period (Fig. 8). The average EMG activity was higher than that after Ringer’s, although not significantly so (p = 0.08).
The EEG during the postinjection period after noradrenaline was characterized by a low-voltage fast pattern (Fig.9), which is normally characteristic of the wake state. In the high-frequency filtered record, relatively high amplitude γ activity was apparent. In average spectra of epochs during the postinjection period, a small peak was evident in the θ band, which is normally the case during waking attentive or active behaviors in the rat (Maloney et al., 1997). Although no distinct peak was present in the high-frequency portion of the spectra, the amplitude in the γ band was relatively high, as also has been found to be the case during attentive or active waking behaviors (Maloney et al., 1997). The wake state after noradrenaline when compared with that after Ringer’s had significantly higher relative γ activity (Table1). The EMG was also higher during wake after noradrenaline, although not significantly so (Table 1;p = 0.07).
Table 1.
Relative γ and δ activity, ratio of Th/De activities, and EMG amplitude during the postinjection total period or wake and SWS states after noradrenaline and serotonin as compared with Ringer’sa
| Ringer’s | Noradrenaline | Serotonin | |
|---|---|---|---|
| Total | |||
| Ga | 15.51 ± 0.74 | 22.55 ± 1.59* | 14.81 ± 0.57 |
| De | 21.05 ± 1.06 | 17.44 ± 0.72* | 23.94 ± 1.18* |
| Th/De | 1.28 ± 0.06 | 1.29 ± 0.03 | 1.08 ± 0.05* |
| EMG | 222.78 ± 52.95 | 357.03 ± 100.25* | 335.42 ± 68.79* |
| Wake | |||
| Ga | 20.09 ± 0.85 | 23.07 ± 1.51* | 17.65 ± 0.60* |
| De | 16.80 ± 0.89 | 17.09 ± 0.68 | 20.93 ± 0.97* |
| Th/De | 1.44 ± 0.06 | 1.30 ± 0.03 | 1.21 ± 0.04* |
| EMG | 267.22 ± 53.21 | 360.65 ± 98.62 | 396.64 ± 68.28* |
| SWS | |||
| Ga | 13.44 ± 0.59 | − | 12.42 ± 0.29 |
| De | 24.07 ± 1.22 | − | 27.39 ± 0.73* |
| Th/De | 1.00 ± 0.06 | − | 0.88 ± 0.03 |
| EMG | 209.33 ± 51.4 | − | 313.15 ± 75.5* |
Ga and De activities are presented as relative amplitude. Data are presented as mean ± SEM for Ringer’s, n = 8; for Noradrenaline, n= 5; and for Serotonin, n = 8. *Significantly different from Ringer’s according to paired comparison t tests (p ≤ 0.05).
Serotonin
As was the case for Ringer’s, all animals resumed sleeping after the filled cannulae were lowered or the injection was started with serotonin (250 nmol per side, n = 8; see Fig. 6). SWS occurred in all rats in the 30 min postinjection period. PS occurred in only one rat (of eight) during this same time period. In EEG activity, serotonin microinjections were associated with an apparent decrease in γ activity (8 of 8 rats) through most of the postinjection period (see Fig. 6). δ activity could be relatively high during this period, reaching levels apparently equal to or higher than those present during SWS in the preinjection recording period. The Th/De ratio remained low. During these episodes of high δ, two behavioral states were observed: sleeping or quiet waking. During sleeping behavior (marked by eyes closed), high δ activity usually was associated with a normal sleep posture and behavior (Scurled or more often Suncurled), although in one rat it was associated with an abnormal outstretched posture. All of these epochs were scored as SWS or tSWS. During waking behavior (marked by eyes open) the δ activity, which appeared to be of lower amplitude than that during sleeping behavior, was associated with quiet behavior (usually recumbent, noted as Wquiet, although also occasionally moving during positional shifts, noted as Wmoving). This apparent dissociation between EEG δ activity and waking behavior was seen in one-half of the rats. These epochs were scored as the wake state, according to the behavioral notation and despite the presence of EEG δ activity. During both the SWS and wake episodes in many rats, the EMG activity appeared relatively high as compared with the preinjection levels.
During the postinjection recording period after serotonin, the average percentage of the wake state did not differ significantly from that after Ringer’s, although it did appear to be higher (see Fig. 7). Similarly, the average amount of slow wave sleep (tSWS and SWS) was not changed significantly (representing >55%). On the other hand, average tPS and PS were decreased significantly (to <3%). Across animals, the EEG was altered during the postinjection period by significantly lower average γ activity, as compared with Ringer’s (see Fig. 8). The ratio of Th/De was also significantly lower than that with Ringer’s (which in turn was significantly lower than that in baseline, above). EMG amplitude was significantly higher after serotonin than after Ringer’s.
The EEG during the postinjection period after serotonin often was characterized by high-voltage slow waves with relatively low amplitude γ activity (Fig. 9), thereby resembling that of SWS. The average spectra for epochs sampled during this period revealed a large peak in the δ band (Fig. 10), which is typical of natural SWS. The EEG of SWS epochs, as compared with those of Ringer’s, had significantly higher relative δ activity and lower Th/De ratio (see Table 1). The EMG activity was also higher than that in normal SWS epochs, although not significantly so. The postserotonin wake epochs, which include the anomalous wake episodes (above), also differed from those after Ringer’s by significantly lower relative γ, higher relative δ, lower Th/De, and higher EMG activities (see Table 1).
Dose–response relationships
The differential effects of noradrenaline and serotonin on γ-EEG activity were found to be dose-dependent (Fig.11). Whereas increasing doses of noradrenaline were associated with increases in average γ during the postinjection period, increasing doses of serotonin were associated with decreases in average γ, each reaching a plateau at the maximum dose used in the main study. Noradrenaline also was associated with a dose-dependent decrease in δ activity. With regard to state, the increase in wake and decrease in SWS produced by noradrenaline were significantly dependent on dose (with ANCOVA, df = 4, 1;p ≤ 0.05; data not shown). Serotonin had no significant dose-dependent effect on δ activity or on wake or SWS states. On the other hand, the decreases in PS after noradrenaline and serotonin were both significantly dose-dependent (with ANCOVA, df = 4, 1; p ≤ 0.05; data not shown).
Fig. 11.
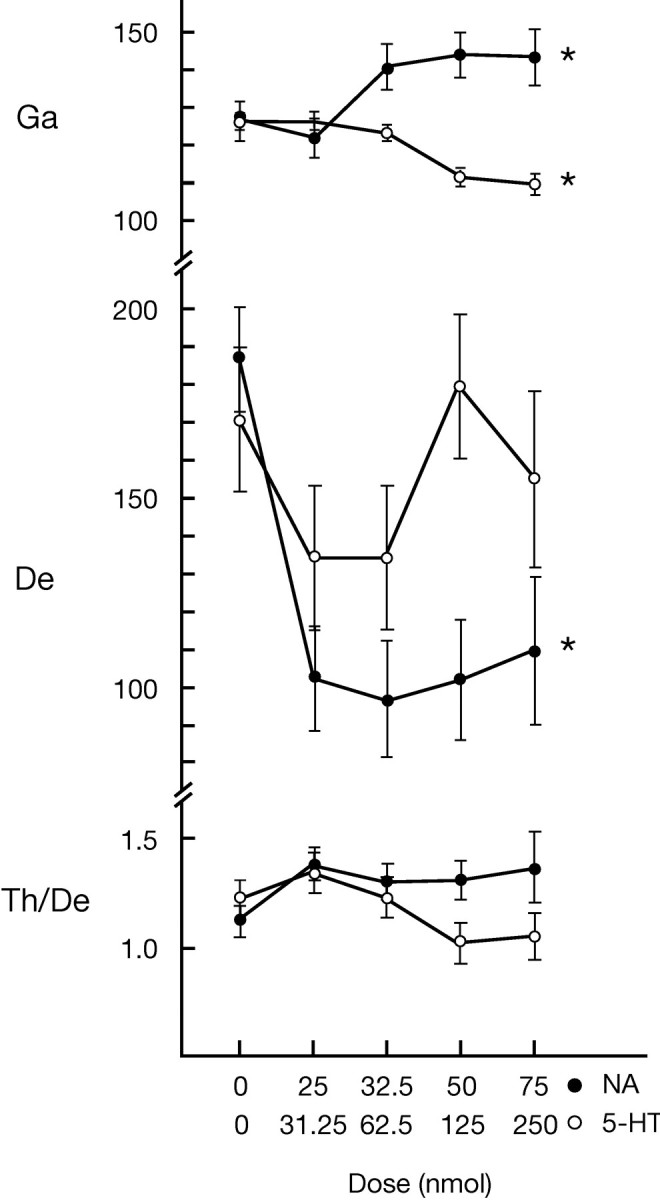
Dose–response relationships showing the effect of increasing doses of noradrenaline and serotonin on average EEG frequency band activity during the postinjection period (see Fig. 8). Least-squares means plots are presented from the output of ANCOVAs (with dose as the main factor and rat as the covariate). EEG activities are taken from the right retrosplenial lead and reported as amplitude in A/D units, in which 100 units ≈ 79 μV, or are reported as a ratio. Dose indicates total nanomoles of drug injected on each side, and 0 corresponds to Ringer’s. *Significant main effect of dose for NA(n = 4) or 5-HT(n = 3) (ANCOVA, df = 4, 1;p ≤ 0.05).
DISCUSSION
The results of the present study demonstrate that noradrenaline and serotonin, which have been shown in vitro to exert respective depolarizing versus hyperpolarizing influences on cholinergic basalis neurons (Khateb et al., 1993; Fort et al., 1995), produce differential effects on EEG activity and sleep–wake state when microinjected in vivo into the region of the cholinergic basalis neurons. Whereas noradrenaline facilitated γ activity and elicited waking, serotonin diminished high-frequency γ activity and did not affect slow wave sleep significantly in the naturally sleeping–waking rat during the day when the animals are normally asleep the majority of the time. On the other hand, both neurotransmitters eliminated paradoxical sleep.
Noradrenaline facilitates γ-EEG activity and elicits waking
Noradrenaline microinjections into the basal forebrain produced a significant and dose-dependent increase in γ activity and a reciprocal decrease in δ activity, associated with an increase in the wake state. This effect on EEG activity is interpreted as being attributable to the depolarization and excitation of the cholinergic basalis neurons by noradrenaline that have been demonstrated in vitro (Fort et al., 1995). Driven into a tonic mode of firing, the cholinergic basalis neurons could be expected to exert a tonic facilitatory influence on cortical neurons and activity that would be evident as a decrease in low-frequency burst firing and an increase in high-frequency tonic firing by the cortical neurons (Krnjevic, 1967;McCormick, 1992; Metherate et al., 1992). At the level of EEG activity, these changes would underlie a shift from δ to γ activity during the period of the day when the animals are normally asleep. It also must be considered that noradrenaline additionally exerts its effects through the basal forebrain via noncholinergic, putative cortically projecting cells, the vast majority of which also are depolarized and excited by noradrenaline (Fort et al., 1992, 1998). In the present study the EEG changes were associated with the intrusion of the wake state into diurnal sleep and, moreover, the stimulation of a relatively aroused state of waking, marked by a higher relative amount of γ activity, which is associated with attentive or active waking behaviors (Maloney et al., 1997).
An important role of noradrenergic locus coeruleus neurons in the facilitation of cortical activation and waking has been recognized for many years (see Jouvet, 1972; Jones et al., 1973). Although studies have shown that these neurons are not essential for the maintenance of these activities (see Jones et al., 1977; Jones, 1991), multiple pharmacological and physiological studies have demonstrated that the noradrenergic locus coeruleus neurons normally have the capacity to facilitate and prolong cortical activation and waking (see Jacobs and Jones, 1978). They discharge at the highest rate during active and attentive waking and decrease their rate of firing during quiet waking and slow wave sleep (Aston-Jones and Bloom, 1981a; Rasmussen et al., 1986). They also increase their rate of firing transiently in association with responses to sensory stimuli, including orientation (Aston-Jones and Bloom, 1981b; Rasmussen et al., 1986). Accordingly, they would be expected to exert a facilitatory influence on cholinergic basalis neurons in association with sensory stimulation and orientation that would, in turn, facilitate cortical activation (Metherate et al., 1992). It has been found that stimulation of the locus coeruleus generates cortical activation with a shift from low-frequency to higher frequency EEG activity (Berridge and Foote, 1991) and that lesions of noradrenergic fibers are associated with a loss of high-frequency EEG activity in response to sensory stimuli (Delagrange et al., 1989). The present results suggest that noradrenaline can facilitate high-frequency γ activity and waking by acting on cholinergic basalis neurons in addition to acting on thalamic and cortical systems (McCormick, 1992).
The noradrenaline microinjections into the basal forebrain also resulted in a suppression of PS, which can be interpreted simply as attributable to the facilitation of waking but possibly also to a general opposing role of noradrenaline in the generation of this state (Hobson et al., 1975; Aston-Jones and Bloom, 1981a).
Serotonin diminishes γ-EEG activity and allows SWS
Serotonin produced a significant and dose-dependent decrease in high-frequency γ and did not increase waking or decrease slow wave sleep significantly during the daytime recording period when rats are naturally asleep the majority of the time. This EEG effect could be interpreted as being attributable to the hyperpolarization and inhibition of cholinergic basalis neurons by serotonin (Khateb et al., 1993). It is additionally possible that the effect could be attributable to the action of serotonin on noncholinergic, putative cortically projecting basalis neurons, the majority of which also are hyperpolarized and inhibited by serotonin (Fort et al., 1992, 1998). It is presumed that by its action on cortically projecting cells, serotonin diminishes cortical activation, as evidenced by decreased γ activity, and accordingly is associated with a quiet waking state or slow wave sleep during the day when the animal is naturally asleep.
The role of serotonin in sleep–wake states has been debated greatly over the past 25 years. The demonstration that lesions of the serotonergic raphe neurons could result in complete insomnia originally led Jouvet to propose that serotonergic neurons play a determining role in the generation of slow wave sleep (for review, see Jouvet, 1972). In support of this theory, depletion of serotonin by the inhibition of tryptophan hydroxylase with para-chlorophenylalanine (PCPA) also was shown in the cat to produce insomnia, which could be reversed by subsequent peripheral or central administration of low doses of 5-hydroxytryptophan (5-HTP), the immediate precursor of serotonin (Denoyer et al., 1989) (for review, see Jouvet, 1972). However, subsequent studies, particularly in rats, indicated that serotonin was not necessary for the appearance of slow wave sleep, although it could facilitate the onset of sleep (for review, see Jacobs and Jones, 1978;Jacobs and Fornal, 1991; Jones, 1994). Moreover, dorsal raphe neurons were found to discharge at their highest rates during waking and decrease their firing rate (by ∼50%) during slow wave sleep, indicating that they likely did not generate slow wave sleep (McGinty and Harper, 1976; Trulson and Jacobs, 1979) (for review, seeJacobs and Fornal, 1991). On the other hand, their higher discharge rate during waking could be associated specifically with suppression of particular waking behaviors and responses to inputs that can interfere with sleep onset (McGinty and Harper, 1976; Trulson and Jacobs, 1979). In fact, it has been found that, on presentation of sensory stimuli (Aghajanian et al., 1978) and during orientation to stimuli (Jacobs and Fornal, 1991), many putative serotonergic raphe units cease firing (in contrast to the noradrenergic locus coeruleus neurons, which increase firing). According to the in vitroresults (Khateb et al., 1993), this cessation of serotonergic neuronal discharge could be associated with a disinhibition of the cholinergic basalis neurons during the cortical activation that occurs with sensory stimulation and orientation. Conversely, discharge by the serotonergic neurons under other circumstances would hyperpolarize the cholinergic cells and prevent their tonic discharge, which in turn could be associated with a decrease in cortical activation, like that which we have measured here as a decrease in γ-EEG activity after microinjections of serotonin. In accordance with this interpretation, the dorsal raphe neurons have been found to discharge at higher rates during grooming behavior (Fornal et al., 1996), when cortical γ activity is low (Maloney et al., 1997), than during attentive behavior, when cortical γ activity is high. A cortical “deactivation” produced by the action of serotonin on cholinergic basalis neurons thus could be associated with relaxed or quiet waking or with slow wave sleep during the diurnal, maximal sleep period of the day.
Despite the continuity of slow wave sleep after serotonin microinjections, the resulting sleep and sleep cycle were not completely normal but were marked by higher EMG activity and the absence of paradoxical sleep as well as diminished θ activity, which marks that state in cortical, as well hippocampal, EEG (Maloney et al., 1997). The results of the effects of serotonin in the basal forebrain concur with results showing a facilitatory role of serotonin through other areas of the CNS on muscle tonus and certain rhythmic motor behaviors and a suppressive role of serotonin in paradoxical sleep and θ activity (for review, see Steriade and Hobson, 1976; Jacobs and Fornal, 1991; Holmes and Jones, 1994; Vertes et al., 1994; Fornal et al., 1996). The partial dissociation between EEG activity and behavior seen in some rats after serotonin microinjections in the present study is also well known to occur after systemic injections of atropine, which, by blocking cholinergic muscarinic receptors, results in a pattern of slow wave EEG activity during a behaviorally awake state (Longo, 1966; Stewart et al., 1984). Our results show that serotonin microinjections into the basal forebrain similarly may result in slow waves in the cerebral cortex, thought to be attributable in this case to the inhibition of cholinergic basalis neurons, but not necessarily in a decrease in muscle tone that normally occurs during slow wave sleep and precedes paradoxical sleep. The results also suggest that serotonin may act on other noncholinergic neurons in the area that, via descending projections, may be involved in movement and maintenance of muscle tone (Swanson et al., 1984), which can persist during slow wave sleep, but not during paradoxical sleep.
Conclusions
When injected into the basal forebrain of a naturally sleeping–waking rat during the day, noradrenaline, which is known to depolarize cholinergic neurons, diminishes δ activity and slow wave sleep and stimulates high-frequency γ-EEG activity and waking. In contrast, serotonin, which is known to hyperpolarize cholinergic basalis neurons, diminishes high-frequency γ-EEG activity and has no decremental effect on δ activity or slow wave sleep. It is concluded that noradrenaline and serotonin may play differential roles in modulating cortical activity in part via their opposing actions on cholinergic basalis neurons, which in turn have been shown to play an important role in facilitating high-frequency γ-EEG activity and waking.
Footnotes
This research was supported by a grant to B.E.J. from the Canadian Medical Research Council. E.G.C. was supported as a graduate student by the Fonds de Recherche en Santé du Québec, Reseau de Santé Mentale, Axe Sommeil et Vigilance. We thank Lynda Mainville for her technical assistance and Jean Gotman, Angel Alonso, and Michel Muhlethaler for their helpful consultation.
Correspondence should be addressed to Dr. Barbara E. Jones, Montréal Neurological Institute, 3801 University Street, Montréal, Québec H3A 2B4, Canada.
REFERENCES
- 1.Aghajanian GK, Wang RY, Barban J. Serotonergic and non-serotonergic neurons of the dorsal raphe: reciprocal changes in firing induced by peripheral nerve stimulation. Brain Res. 1978;153:169–175. doi: 10.1016/0006-8993(78)91140-x. [DOI] [PubMed] [Google Scholar]
- 2.Aston-Jones G, Bloom FE. Activity of norepinephrine-containing locus coeruleus neurons in behaving rats anticipates fluctuations in the sleep–waking cycle. J Neurosci. 1981a;1:876–886. doi: 10.1523/JNEUROSCI.01-08-00876.1981. [DOI] [PMC free article] [PubMed] [Google Scholar]
- 3.Aston-Jones G, Bloom FE. Norepinephrine-containing locus coeruleus neurons in behaving rats exhibit pronounced responses to non-noxious environmental stimuli. J Neurosci. 1981b;1:887–900. doi: 10.1523/JNEUROSCI.01-08-00887.1981. [DOI] [PMC free article] [PubMed] [Google Scholar]
- 4.Berridge CW, Foote SL. Effects of locus coeruleus activation on electroencephalographic activity in neocortex and hippocampus. J Neurosci. 1991;11:3135–3145. doi: 10.1523/JNEUROSCI.11-10-03135.1991. [DOI] [PMC free article] [PubMed] [Google Scholar]
- 5.Buzsáki G, Bickford RG, Ponomareff G, Thal LJ, Mandel R, Gage FH. Nucleus basalis and thalamic control of neocortical activity in the freely moving rat. J Neurosci. 1988;8:4007–4026. doi: 10.1523/JNEUROSCI.08-11-04007.1988. [DOI] [PMC free article] [PubMed] [Google Scholar]
- 6.Cape E, Jones BE. Modulation of sleep–wake state and cortical activity following injection of agonists into the region of cholinergic basal forebrain neurons. Soc Neurosci Abstr. 1994;20:156. [Google Scholar]
- 7.Casamenti F, Deffenu G, Abbamondi AL, Pepeu G. Changes in cortical acetylcholine output induced by modulation of the nucleus basalis. Brain Res Bull. 1986;16:689–695. doi: 10.1016/0361-9230(86)90140-1. [DOI] [PubMed] [Google Scholar]
- 8.Celesia GG, Jasper HH. Acetylcholine released from cerebral cortex in relation to state of activation. Neurology. 1966;16:1053–1064. doi: 10.1212/wnl.16.11.1053. [DOI] [PubMed] [Google Scholar]
- 9.Delagrange P, Tadjer D, Bouyer J-J, Rougeul A, Conrath M. Effect of DSP4, a neurotoxic agent, on attentive behaviour and related electrocortical activity in cat. Behav Brain Res. 1989;33:33–43. doi: 10.1016/s0166-4328(89)80016-6. [DOI] [PubMed] [Google Scholar]
- 10.Denoyer M, Sallanon M, Kitahama K, Aubert C, Jouvet M. Reversibility of para-chlorophenylalanine-induced insomnia by intrahypothalamic microinjection of l-5-hydroxytryptophan. Neuroscience. 1989;28:83–94. doi: 10.1016/0306-4522(89)90234-0. [DOI] [PubMed] [Google Scholar]
- 11.Fornal CA, Metzler CW, Marrosu F, Ribiero-do-Valle LE, Jacobs BL. A subgroup of dorsal raphe serotonergic neurons in the cat is strongly activated during oral–buccal movements. Brain Res. 1996;716:123–133. doi: 10.1016/0006-8993(96)00006-6. [DOI] [PubMed] [Google Scholar]
- 12.Fort P, Khateb A, Alonso A, Jones BE, Muhlethaler M. Pharmacological heterogeneity of basal forebrain neurones. Soc Neurosci Abstr. 1992;18:881. [Google Scholar]
- 13.Fort P, Khateb A, Pegna A, Muhlethaler M, Jones BE. Noradrenergic modulation of cholinergic nucleus basalis neurons demonstrated by in vitro pharmacological and immunohistochemical evidence in the guinea pig brain. Eur J Neurosci. 1995;7:1502–1511. doi: 10.1111/j.1460-9568.1995.tb01145.x. [DOI] [PubMed] [Google Scholar]
- 14.Fort P, Khateb A, Serafin M, Muhlethaler M, Jones BE. Pharmacological characterization and differentiation of non-cholinergic nucleus basalis neurons in vitro. NeuroReport. 1998;9:61–65. doi: 10.1097/00001756-199801050-00013. [DOI] [PubMed] [Google Scholar]
- 15.Gritti I, Mainville L, Jones BE. Codistribution of GABA- with acetylcholine-synthesizing neurons in the basal forebrain of the rat. J Comp Neurol. 1993;329:438–457. doi: 10.1002/cne.903290403. [DOI] [PubMed] [Google Scholar]
- 16.Hobson JA, McCarley RW, Wyzinski PW. Sleep cycle oscillation: reciprocal discharge by two brainstem neuronal groups. Science. 1975;189:55–58. doi: 10.1126/science.1094539. [DOI] [PubMed] [Google Scholar]
- 17.Holmes CJ, Jones BE. Importance of cholinergic, GABAergic, serotonergic, and other neurons in the medullary reticular formation for sleep–wake states studied by cytotoxic lesions in the cat. Neuroscience. 1994;62:1179–1200. doi: 10.1016/0306-4522(94)90352-2. [DOI] [PubMed] [Google Scholar]
- 18.Jacobs BL, Fornal CA. Activity of brain serotonergic neurons in the behaving animal. Pharmacol Rev. 1991;43:563–578. [PubMed] [Google Scholar]
- 19.Jacobs BL, Jones BE. The role of central monoamine and acetylcholine systems in sleep–wakefulness states: mediation or modulation. In: Butcher LL, editor. Cholinergic–monoaminergic interactions in the brain. Academic; New York: 1978. pp. 271–290. [Google Scholar]
- 20.Jasper HH, Tessier J. Acetylcholine liberation from cerebral cortex during paradoxical (REM) sleep. Science. 1971;172:601–602. doi: 10.1126/science.172.3983.601. [DOI] [PubMed] [Google Scholar]
- 21.Jones BE. The role of noradrenergic locus coeruleus neurons and neighboring cholinergic neurons of the pontomesencephalic tegmentum in sleep–wake states. In: Barnes C, Pompeiano O, editors. Neurobiology of the locus coeruleus. Progress in brain research, Vol 85. Elsevier; Amsterdam: 1991. pp. 532–543. [DOI] [PubMed] [Google Scholar]
- 22.Jones BE. The organization of central cholinergic systems and their functional importance in sleep–waking states. In: Cuello AC, editor. Cholinergic function and dysfunction. Progress in brain research, Vol 98. Elsevier; Amsterdam: 1993. pp. 61–71. [DOI] [PubMed] [Google Scholar]
- 23.Jones BE. Basic mechanisms of sleep–wake states. In: Kryger MH, Roth T, Dement WC, editors. Principles and practice of sleep medicine, 2nd Ed. Saunders; Philadelphia: 1994. pp. 145–162. [Google Scholar]
- 24.Jones BE. Reticular formation. Cytoarchitecture, transmitters, and projections. In: Paxinos G, editor. The rat nervous system, 2nd Ed. Academic; New South Wales, Australia: 1995. pp. 155–171. [Google Scholar]
- 25.Jones BE, Beaudet A. Retrograde labeling of neurons in the brain stem following injections of [3H]choline into the forebrain of the rat. Exp Brain Res. 1987;65:437–448. doi: 10.1007/BF00236317. [DOI] [PubMed] [Google Scholar]
- 26.Jones BE, Cuello AC. Afferents to the basal forebrain cholinergic cell area from pontomesencephalic—catecholamine, serotonin, and acetylcholine—neurons. Neuroscience. 1989;31:37–61. doi: 10.1016/0306-4522(89)90029-8. [DOI] [PubMed] [Google Scholar]
- 27.Jones BE, Yang T-Z. The efferent projections from the reticular formation and the locus coeruleus studied by anterograde and retrograde axonal transport in the rat. J Comp Neurol. 1985;242:56–92. doi: 10.1002/cne.902420105. [DOI] [PubMed] [Google Scholar]
- 28.Jones BE, Bobillier P, Pin C, Jouvet M. The effect of lesions of catecholamine-containing neurons upon monoamine content of the brain and EEG and behavioral waking in the cat. Brain Res. 1973;58:157–177. doi: 10.1016/0006-8993(73)90830-5. [DOI] [PubMed] [Google Scholar]
- 29.Jones BE, Harper ST, Halaris AE. Effects of locus coeruleus lesions upon cerebral monoamine content, sleep–wakefulness states and the response to amphetamine. Brain Res. 1977;124:473–496. doi: 10.1016/0006-8993(77)90948-9. [DOI] [PubMed] [Google Scholar]
- 30.Jouvet M. The role of monoamines and acetylcholine-containing neurons in the regulation of the sleep–waking cycle. Ergeb Physiol. 1972;64:165–307. doi: 10.1007/3-540-05462-6_2. [DOI] [PubMed] [Google Scholar]
- 31.Khateb A, Muhlethaler M, Alonso A, Serafin M, Mainville L, Jones BE. Cholinergic nucleus basalis neurons display the capacity for rhythmic bursting activity mediated by low threshold calcium spikes. Neuroscience. 1992;51:489–494. doi: 10.1016/0306-4522(92)90289-e. [DOI] [PubMed] [Google Scholar]
- 32.Khateb A, Fort P, Alonso A, Jones BE, Muhlethaler M. Pharmacological and immunohistochemical evidence for a serotonergic input to cholinergic nucleus basalis neurons. Eur J Neurosci. 1993;5:541–547. doi: 10.1111/j.1460-9568.1993.tb00519.x. [DOI] [PubMed] [Google Scholar]
- 33.Krnjevic K. Chemical transmission and cortical arousal. Anesthesiology. 1967;28:100–104. [PubMed] [Google Scholar]
- 34.Lehmann J, Nagy JI, Atmadja S, Fibiger HC. The nucleus basalis magnocellularis: the origin of a cholinergic projection to the neocortex of the rat. Neuroscience. 1980;5:1161–1174. doi: 10.1016/0306-4522(80)90195-5. [DOI] [PubMed] [Google Scholar]
- 35.Lo Conte G, Casamenti F, Bigl V, Milaneschi E, Pepeu G. Effect of magnocellular forebrain nuclei lesions on acetylcholine output from the cerebral cortex, electrocorticogram, and behaviour. Arch Ital Biol. 1982;120:176–188. [PubMed] [Google Scholar]
- 36.Longo VG. Behavioral and electroencephalographic effects of atropine and related compounds. Pharmacol Rev. 1966;18:965–996. [PubMed] [Google Scholar]
- 37.Maloney KJ, Cape EG, Gotman J, Jones BE. High frequency gamma electroencephalogram activity in association with sleep–wake states and spontaneous behaviors in the rat. Neuroscience. 1997;76:541–555. doi: 10.1016/s0306-4522(96)00298-9. [DOI] [PubMed] [Google Scholar]
- 38.Martin JH. Autoradiographic estimation of the extent of reversible inactivation produced by microinjection of lidocaine and muscimol in the rat. Neurosci Lett. 1991;127:160–164. doi: 10.1016/0304-3940(91)90784-q. [DOI] [PubMed] [Google Scholar]
- 39.McCormick DA. Neurotransmitter actions in the thalamus and cerebral cortex and their role in neuromodulation of thalamocortical activity. Prog Neurobiol. 1992;39:337–388. doi: 10.1016/0301-0082(92)90012-4. [DOI] [PubMed] [Google Scholar]
- 40.McGinty D, Harper RM. Dorsal raphe neurons: depression of firing during sleep in cats. Brain Res. 1976;101:569–575. doi: 10.1016/0006-8993(76)90480-7. [DOI] [PubMed] [Google Scholar]
- 41.Metherate R, Cox CL, Ashe JH. Cellular bases of neocortical activation: modulation of neural oscillations by the nucleus basalis and endogenous acetylcholine. J Neurosci. 1992;12:4701–4711. doi: 10.1523/JNEUROSCI.12-12-04701.1992. [DOI] [PMC free article] [PubMed] [Google Scholar]
- 42.Moruzzi G, Magoun HW. Brainstem reticular formation and activation of the EEG. Electroencephalogr Clin Neurophysiol. 1949;1:455–473. [PubMed] [Google Scholar]
- 43.Myers RD. Handbook of drug and chemical stimulation of the brain. Van Nostrand Reinhold; New York: 1974. [Google Scholar]
- 44.Rasmusson DD, Clow K, Szerb JC. Modification of neocortical acetylcholine release and electroencephalogram desynchronization due to brainstem stimulation by drugs applied to the basal forebrain. Neuroscience. 1994;60:665–677. doi: 10.1016/0306-4522(94)90495-2. [DOI] [PubMed] [Google Scholar]
- 45.Rasmussen K, Morilak DA, Jacobs BL. Single unit activity of locus coeruleus neurons in the freely moving cat. I. During naturalistic behaviors and in response to simple and complex stimuli. Brain Res. 1986;371:324–334. doi: 10.1016/0006-8993(86)90370-7. [DOI] [PubMed] [Google Scholar]
- 46.Rye DB, Wainer BH, Mesulam M-M, Mufson EJ, Saper CB. Cortical projections arising from the basal forebrain: a study of cholinergic and noncholinergic components employing combined retrograde tracing and immunohistochemical localization of choline acetyltransferase. Neuroscience. 1984;13:627–643. doi: 10.1016/0306-4522(84)90083-6. [DOI] [PubMed] [Google Scholar]
- 47.Semba K, Reiner PB, McGeer EG, Fibiger HC. Brainstem afferents to the magnocellular basal forebrain studied by axonal transport, immunohistochemistry, and electrophysiology in the rat. J Comp Neurol. 1988;267:433–453. doi: 10.1002/cne.902670311. [DOI] [PubMed] [Google Scholar]
- 48.Shute CCD, Lewis PR. The ascending cholinergic reticular system: neocortical, olfactory, and subcortical projections. Brain. 1967;90:497–520. doi: 10.1093/brain/90.3.497. [DOI] [PubMed] [Google Scholar]
- 49.Starzl TE, Taylor CW, Magoun HW. Ascending conduction in reticular activating system, with special reference to the diencephalon. J Neurophysiol. 1951;14:461–477. doi: 10.1152/jn.1951.14.6.461. [DOI] [PMC free article] [PubMed] [Google Scholar]
- 50.Steriade M, Hobson JA. Neuronal activity during the sleep–waking cycle. Prog Neurobiol. 1976;6:155–376. [PubMed] [Google Scholar]
- 51.Stewart DJ, Macfabe DF, Vanderwolf CH. Cholinergic activation of the electrocorticogram: role of the substantia innominata and effects of atropine and quinuclidinyl benzilate. Brain Res. 1984;322:219–232. doi: 10.1016/0006-8993(84)90112-4. [DOI] [PubMed] [Google Scholar]
- 52.Swanson LW, Mogenson GJ, Gerfen CR, Robinson P. Evidence for a projection from the lateral preoptic area and substantia innominata to the “mesencephalic locomotor region” in the rat. Brain Res. 1984;295:161–178. doi: 10.1016/0006-8993(84)90827-8. [DOI] [PubMed] [Google Scholar]
- 53.Trulson ME, Jacobs BL. Raphe unit activity in freely moving cats: correlation with level of behavioral arousal. Brain Res. 1979;163:135–150. doi: 10.1016/0006-8993(79)90157-4. [DOI] [PubMed] [Google Scholar]
- 54.Vergnes M, Marescaux C, Micheletti G, Reis J, Depaulis A, Rumbach L, Warter JM. Spontaneous paroxysmal electroclinical patterns in rat: a model of generalized non-convulsive epilepsy. Neurosci Lett. 1982;33:97–101. doi: 10.1016/0304-3940(82)90136-7. [DOI] [PubMed] [Google Scholar]
- 55.Vertes RP, Kinney GG, Kocsis B, Fortin WJ. Pharmacological suppression of the median raphe nucleus with serotonin1A agonists, 8-OH-DPAT and buspirone, produces hippocampal theta rhythm in the rat. Neuroscience. 1994;60:441–451. doi: 10.1016/0306-4522(94)90255-0. [DOI] [PubMed] [Google Scholar]
- 56.Wenk GL. Pharmacological manipulations of the substantia innominata-cortical cholinergic pathway. Neurosci Lett. 1984;51:99–103. doi: 10.1016/0304-3940(84)90269-6. [DOI] [PubMed] [Google Scholar]