

Abstract
Neuronal and glial sodium-dependent transporters are crucial for the control of extracellular glutamate levels in the CNS. The regulation of these transporters is relatively unexplored, but the activity of other transporters is regulated by protein kinase C (PKC)- and phosphatidylinositol 3-kinase (PI3K)-mediated trafficking to and from the cell surface. In the present study the C6 glioma cell line was used as a model system that endogenously expresses the excitatory amino acid carrier 1 (EAAC1) subtype of neuronal glutamate transporter. As previously observed, phorbol 12-myristate 13-acetate (PMA) caused an 80% increase in transporter activity within minutes that cannot be attributed to the synthesis of new transporters. This increase in activity correlated with an increase in cell surface expression of EAAC1 as measured by using a membrane-impermeant biotinylation reagent. Both effects of PMA were blocked by the PKC inhibitor bisindolylmaleimide II (Bis II). The putative PI3K inhibitor, wortmannin, decreased l-[3H]-glutamate uptake activity by >50% within minutes. Wortmannin decreased theVmax ofl-[3H]-glutamate andd-[3H]-aspartate transport, but it did not affect Na+-dependent [3H]-glycine transport. Wortmannin also decreased cell surface expression of EAAC1. Although wortmannin did not block the effects of PMA on activity, it prevented the PMA-induced increase in cell surface expression. This trafficking of EAAC1 also was examined with immunofluorescent confocal microscopy, which supported the biotinylation studies and also revealed a clustering of EAAC1 at cell surface after treatment with PMA. These studies suggest that the trafficking of the neuronal glutamate transporter EAAC1 is regulated by two independent signaling pathways and also may suggest a novel endogenous protective mechanism to limit glutamate-induced excitotoxicity.
Keywords: glutamate transport, EAAC1, excitatory amino acid, protein kinase C, phosphatidylinositol 3-kinase, trafficking, C6 glioma
A major mechanism for the clearance of glutamate from the synapse involves a family of sodium-dependent high-affinity glutamate transporters, including the neuronal transporters excitatory amino acid carrier 1 (EAAC1) (Kanai and Hediger, 1992) and excitatory amino acid transporter 4 (EAAT4) (Fairman et al., 1995), the glial transporters Glu-Asp transporter (GLAST) (Storck et al., 1992) and Glu transporter-1 (GLT-1) (Pines et al., 1992), and the recently identified retinal transporter EAAT5 (Arriza et al., 1997). Several studies have suggested that these transporters play a critical role in the prevention of glutamate-mediated excitotoxic injury by tightly regulating the levels of extracellular glutamate under normal circumstances (Rosenberg et al., 1992; Rothstein et al., 1996) (for review, see Robinson and Dowd, 1997). The dysfunction or loss of these transporters may contribute to neurodegenerative diseases such as amyotrophic lateral sclerosis (ALS) or hypoxic/ischemic insults (Rothstein et al., 1995; Tanaka et al., 1997). Because these transporters may play a critical role in maintaining glutamate homeostasis in the CNS, the cellular regulation of these transporters is of considerable interest.
Phorbol esters such as phorbol 12-myristate 13-acetate (PMA) stimulate GLT-1-mediated transport activity. This stimulation has been attributed to an increase in direct phosphorylation and a corresponding increase in the catalytic rate of transporter activity by protein kinase C (PKC) (Casado et al., 1993). In a recent study we developed evidence that PMA rapidly upregulates EAAC1-mediated transport activity (Dowd and Robinson, 1996). The rapid increase in glutamate uptake caused by PMA suggests two possible mechanisms of regulation: an increase in the catalytic rate of transporter activity and/or an increase in the number of transporters available on the cell surface to transport glutamate.
Recent evidence indicates that the activity of several transporters is regulated by second messenger-mediated trafficking to and from the cell surface. Glucose transporters belong to an unrelated transporter family, the activity of which is regulated by insulin and phorbol esters. Treatment of adipocytes with PMA causes an approximately twofold increase in glucose uptake activity, which is blocked by a PKC inhibitor (Nishimura and Simpson, 1994) and by wortmannin, a fungal metabolite that has been reported to inhibit phosphatidylinositol 3-kinase (PI3K) (Clarke et al., 1994; Navé et al., 1996) (for review, see Nakanishi et al., 1995). Insulin and phorbol esters also cause a redistribution of glucose transporters from a subcellular compartment to the cell membrane, a phenomenon that is blocked by PKC and PI3K inhibitors (Clarke et al., 1994; Holman and Cushman, 1994;James and Piper, 1994; Nishimura and Simpson, 1994; Navé et al., 1996). Recent studies of the serotonin and GABA neurotransmitter transporters, which belong to a distinct gene family, indicate that these transporters also are translocated to and from the cell surface in response to treatment with phorbol esters and exhibit concomitant changes in uptake activity (Qian et al., 1997; Quick et al., 1997). The effects of phorbol esters on these transporters are blocked by the PKC inhibitors bisindolylmaleimide or staurosporine. Because PMA appears to regulate the activity and trafficking of serotonin, glucose, and GABA transporters in several different systems, it is possible that the mechanisms of these effects may be conserved between transporter families. The goal of the present study was to determine whether the regulation of EAAC1 activity in C6 glioma is mediated by the PKC and/or the PI3K pathways and whether this regulation involves changes in trafficking of the transporter to and from the cell surface.
MATERIALS AND METHODS
Materials. DMEM, l-glutamine, penicillin/streptomycin, and normal goat serum were purchased from Life Technologies (Grand Island, NY). Fetal bovine serum was purchased from HyClone (Logan, UT). Twelve-well tissue culture plates and 10 cm tissue culture plates were manufactured by Corning (Corning, NY). All radioisotopes were obtained from DuPont/New England Nuclear (Boston, MA), and the specific activity was diluted with nonradioactivel-Glu, d-Asp, or glycine from Sigma (St. Louis, MO). Wortmannin, bisindolylmaleimide II, phorbol 12,13-dibutyrate, and 4α-phorbol were purchased from Calbiochem (La Jolla, CA). PMA, diamidino-2-phenylindole dihydrochloride hydrate (DAPI), anti-actin antibody, and dimethylsulfoxide (DMSO) were purchased from Sigma. Sulfo–NHS–biotin and Immunopure Immobilized Monomeric Avidin were purchased from Pierce (Rockford, IL). Fluorescent antibodies were purchased from Jackson ImmunoResearch (West Grove, PA), and Vectashield mounting medium was obtained from Vector Laboratories (Burlingame, CA).
Measurement of Na+-dependent transport activity. The transport assays in C6 glioma were performed as described (Dowd and Robinson, 1996). C6 glioma cells were obtained from American Type Culture Collection (Rockville, MD). Cells were grown in a monolayer on 12-well plates in DMEM supplemented with 10% fetal bovine serum, 2 mm glutamine, and penicillin (100 U/ml)/streptomycin (100 μg/ml) and maintained at 37°C in a 5% CO2 incubator. After cells reached ∼80% confluency, drugs or vehicle was added to the medium, and the plates were returned to the incubator until the assay was performed.
Assays were conducted in a 37°C water bath with the wells partially submerged to maintain 37°C surrounding the cells. The wells were rinsed twice with 1 ml of either warm sodium- or choline-containing buffer and then incubated with radioisotopes for 5 min (0.5 μml-[3H]-Glu,d-[3H]-Asp, or [3H]-Gly). Radioactive uptake was stopped with three rinses in ice-cold choline buffer. Then cells were solubilized in 1 ml of 0.1N sodium hydroxide, and 500 μl of lysate was analyzed for radioactivity in a scintillation counter. Na+-dependent uptake was defined as the difference in radioactivity accumulated in Na+-containing buffer and in choline-containing buffer. Under these conditions the uptake is linear with time, >90% is Na+-dependent at 0.5 μm glutamate, and <10% of the substrate is accumulated. Protein content was measured to ensure that any treatments applied to the wells were not altering the protein content of the wells (Lowry et al., 1951).
Biotinylation. Biotinylation of cell surface proteins was performed as described in Qian et al. (1997) and Sargiacomo et al. (1989), with slight modifications. Briefly, C6 glioma cells were grown in a monolayer on 10 cm tissue culture plates until they were at least 80% confluent. Plates were rinsed twice with warm PBS with 0.1 mm calcium and 1.0 mm magnesium added (PBS–Ca/Mg). Then the plates were incubated with 2 ml of biotin solution (sulfo–NHS–biotin, 1 mg/ml in PBS–Ca/Mg) for 20 min at 4°C with gentle shaking. The biotin solution was removed, and the plates were washed twice with PBS–Ca/Mg containing 100 mmglycine. The plates were incubated in PBS–Ca/Mg plus glycine for 45 min at 4°C with gentle agitation to quench any unbound biotin. Then the cells were lysed by the addition of 1 ml of radioimmunoprecipitation assay (RIPA)/lysis buffer with protease inhibitors (100 mm Tris-HCl, pH 7.4, 150 mmNaCl, 1 mm EDTA, 1% Triton X-100, 1% sodium deoxycholate, 0.1% sodium dodecyl sulfate, 1 μg/ml leupeptin, 250 μmPMSF, 1 μg/ml aprotinin, 1 mg/ml trypsin inhibitor, and 1 mm iodoacetamide) for 1 hr at 4°C with vigorous shaking.
Lysates were transferred to centrifuge tubes and centrifuged at 20,000 × g to sediment nucleic acids and debris. Aliquots of the lysate were taken for Western analysis before the lysate was incubated with avidin-conjugated beads (the “total cell lysate” fraction). Equal volumes of avidin bead suspension were added to a volume of lysate (300 μl of bead suspension in 300 μl of lysate) and incubated for 1 hr at room temperature with occasional stirring. Then the avidin–lysate solution was centrifuged for 15 min at 16,500 × g; the supernatant was removed and discarded after samples were taken for Western analysis (the “intracellular” fraction). The pellet that contained the biotinylated cell surface proteins was washed four times with 1 ml of RIPA/lysis buffer with protease inhibitors. The supernatant from the fourth wash was analyzed by Western analysis and showed no EAAC1 immunoreactivity, so the remaining washes were not analyzed further. The pellet was resuspended in 300 μl of Laemmli buffer (62.5m Tris-HCl, pH 6.8, 2% SDS, 20% glycerol, and 5% 2-mercaptoethanol) for 30 min with occasional shaking to elute the biotinylated proteins. The solution was centrifuged for 10 min at 16,500 × g, and the supernatant was removed and saved for Western analysis as the “biotinylated” fraction. All samples for Western analysis were diluted in equal volumes of loading buffer (2% SDS, 10% 2-mercaptoethanol, 5% glycerol, 5% 1 mTris, pH 7.0, and 0.005% bromophenol blue) and frozen at −20°C until analysis.
In initial experiments the effects of varying the amount of avidin beads were examined. Equal volumes of cell lysate and bead suspension (as provided by the manufacturer) resulted in the maximal recovery of biotinylated protein. Similarly, we tested a higher concentration of biotin and found that this did not increase the extent of biotinylation of EAAC1.
Western analyses. Western analyses were performed as described previously (Rothstein et al., 1994). Briefly, biotinylation samples that previously had been diluted in solubilizing buffer were thawed and boiled for 5 min. Proteins then were electrophoresed on a 10% sodium dodecyl sulfate–polyacrylamide gel and transferred to polyvinylidene fluoride membranes (Immobilon P, Millipore, Bedford, MA). The membranes were immersed for 1 hr in blocking solution (0.5% nonfat dry milk, 0.1% Tween 20, and 50 mm Tris-buffered saline) and probed with affinity-purified anti-EAAC1 (0.6 μg/ml), GLT-1 (0.034 μg/ml), GLAST (0.4 μg/ml), or EAAT4 (0.02 μg/ml) and anti-actin (1:200) diluted in blocking solution for 1 hr. After washing, the blots were exposed to horseradish peroxidase-conjugated donkey anti-rabbit IgG diluted 1:1000 in blocking solution for 1 hr. Finally, the blots were washed and visualized with enhanced chemiluminescence (Amersham, Arlington Heights, IL).
Blots were quantitated by using films scanned by an Epson ES1200C scanner with Adobe Photoshop (San Jose, CA) software and then analyzed by National Institutes of Health Image Software. Actin was used to control for equal protein loading and to determine whether the biotinylation reagent labels proteins in the intracellular compartment. The immunoblots consistently demonstrated bands at 46 kDa (actin), at 66 kDa (EAAC1), and two bands above 220 kDa. These high molecular weight bands are consistent with homomultimers of EAAC1. Haugeto and colleagues (1996) previously reported that glutamate transporters form homomultimers, the formation of which can be prevented by treatment with 30 mm DTT (Haugeto et al., 1996). We used the same concentration of DTT in the lysis buffer of a biotinylation experiment, but we were unable to prevent the formation of these larger molecular weight bands and omitted DTT from further experiments.
EAAC1 immunoreactivity in each fraction (lysate, intracellular, and biotinylated) was normalized to the corresponding amount of lysate actin immunoreactivity. Data were expressed as a percentage of change in the amount of normalized EAAC1 immunoreactivity observed under control conditions for each fraction (i.e., lysate, intracellular, and biotinylated fractions). The data were analyzed both as the 66 kDa EAAC1 band alone and as the combination of the 66 kDa band with the higher molecular weight EAAC1 immunoreactive bands. There was no difference in the trends or statistical differences noted, so the data were presented as the combined 66 kDa and higher molecular weight bands for the sake of clarity.
Immunofluorescent confocal microscopy. C6 glioma were plated at equal density on sterile glass coverslips in 35 mm dishes. Plates were pretreated with either 100 nm wortmannin or vehicle for 5 min, and 100 nm PMA or vehicle was added for 30 min. Cells were washed twice in PBS and fixed in 4% paraformaldehyde for 10 min. Cells were rinsed three times in Tris-buffered saline and blocked in 5% normal goat serum and 0.1% Triton X-100 for 30 min. Anti-EAAC1 primary antibody diluted 1:10 in the blocking solution was added to the cells and incubated overnight at 4°C. Then the primary antibody was removed, and the cells were rinsed with blocking solution three times. The secondary antibody (lissamine–rhodamine goat anti-rabbit IgG) was warmed at 37°C for 30 min and centrifuged at 100 × g for 5 min to remove any crystal precipitate; then the cells were incubated with secondary antibody for 2 hr. Cells were washed twice with blocking solution and incubated with DAPI (2 μg/ml in PBS) for 10 min at room temperature. After incubation the cells were rinsed three times with PBS, dehydrated in 97% ethanol for 1 min, and dried. Coverslips were mounted on glass slides with Vectashield and sealed with clear nail polish.
Slides were examined by confocal microscopy with a Leica TCS confocal microscope (Exton, PA) and a krypton–argon Omnichrome laser (Chino, CA). Immunostained cultures were sectioned optically at 0.5 μm intervals with a 100× oil objective at the following settings for (1) EAAC1: krypton–argon laser power = 1, pinhole = 100, voltage = 677, and voltage offset = −3; (2) DAPI: argon laser power = 3, pinhole = 90, voltage = 585, and voltage offset = 0. We chose sections through the center of the cell by examining DAPI nuclear staining and selecting sections that corresponded to the largest cross-sectional area of the nucleus. Images were obtained on a Leica TCS software system and formatted in Adobe Photoshop.
Data analysis. Eadie–Hofstee transformations of the concentration dependence of uptake were fit by linear regression analysis and represent at least three independent experiments performed in triplicate. The concentration dependence of the effects of drugs was assessed by nonlinear regression fitting of one-site inhibition curves with Graph Pad Prism software. Statistical analyses were performed with Statview 512+. Data are presented as the mean ± SEM of at least three independent experiments.
RESULTS
Endogenous expression of EAAC1 by C6 glioma
We have reported previously that the C6 glioma cell line endogenously expresses EAAC1 immunoreactivity but lacks GLT-1 or GLAST immunoreactivity (Dowd et al., 1996), and others have used RT-PCR to provide additional evidence that C6 glioma express EAAC1, but not GLT-1 or GLAST (Palos et al., 1996). Since these studies were reported, an antibody to EAAT4 has been developed (Furuta et al., 1997), so we reexamined the expression of each of these four transporters in C6 glioma (Fig. 1). Extracts from brain tissues enriched in each of the transporters also were used as positive controls. Although GLT-1, EAAT4, and GLAST immunoreactivities were observed in the appropriate brain fractions, none of these transporters was detected in C6 glioma. EAAC1 immunoreactivity was observed in both C6 glioma and cortical membrane homogenates. As was observed previously, the apparent molecular weight of EAAC1 immunoreactivity was ∼6 kDa larger in C6 glioma than in cortical tissue (Dowd et al., 1996). We have shown previously (Dowd et al., 1996) that treatment of C6 glioma or cortical membrane protein with N-glycosidase F results in EAAC1 bands of equivalent apparent molecular weights of 57 kDa, consistent with that predicted from the cDNA sequence (Kanai and Hediger, 1992). The endogenous expression of only EAAC1 by an immortalized cell line of CNS origin provides an ideal model system for studying the cellular regulation of this transporter.
Fig. 1.

Western blot analysis of sodium-dependent glutamate transporters endogenously expressed in C6 glioma. C6 glioma were harvested, and 50 μg of protein was loaded in each lane (lanes 2, 4, 6, 8). Membrane homogenates from rat brain regions known to be enriched in a particular subtype of transporter were used as positive controls. Rat cortex (5 and 50 μg) was loaded in lanes 1 and 7, respectively; 50 μg of rat cerebellum was loaded in lanes 3 and 5. The blots were probed with anti-GLT1 (lanes 1 and 2), anti-EAAT4 (lanes 3 and 4), anti-GLAST (lanes 5 and 6), and anti-EAAC1 (lanes 7 and 8). Only the EAAC1 subtype of glutamate transporter is expressed in C6 glioma. The immunoblot is representative of at least two independent experiments.
Effects of PMA on EAAC1l-[3H]-glutamate uptake activity
In an earlier study we reported that PMA incubation caused a twofold increase in EAAC1 uptake activity in C6 glioma and that this effect was blocked completely by an inhibitor of PKC (Dowd and Robinson, 1996). As shown in Figure 2, PMA produced an 80% ± 4% (mean ± SEM; n = 3) increase in glutamate transport in C6 glioma. The inactive phorbol ester, 4α-phorbol, had no effect on uptake at similar concentrations, whereas the PMA analog phorbol-12,13-dibutyrate produced a similar increase in glutamate uptake. To provide further evidence that the effects of PMA are mediated by the PKC pathway, we examined the effects of the potent and selective competitive PKC inhibitor Bis II (Nixon et al., 1992). As shown in Figure 3, pretreatment with Bis II completely blocked the effects of PMA, but it had no effect on glutamate transport when it was used alone. Bis II inhibited the effects of PMA with an IC50 value of 804 nm. This compound, which competitively binds to the ATP binding site, inhibits PKC with an IC50 value of 13 nm in an in vitro assay (Toullec et al., 1991). Other studies have reported IC50 values for related bisindolylmaleimides in the range of 750–910 nm or have used 1 μm concentrations of related compounds, depending on the cell system used (Chew et al., 1997; Ubl and Reiser, 1997; Zhu et al., 1997).
Fig. 2.

Effects of PMA and its analogs on Na+-dependentl-[3H]-glutamate uptake in C6 glioma cells. Cells were treated with vehicle, 100 nm PMA, 1 μm phorbol-12,13-dibutyrate (PDBu), or 100 nm 4α-phorbol (4α) for 30 min before measurement of Na+-dependentl-[3H]-glutamate transport. PMA and PDBu increased glutamate uptake significantly over vehicle and 4α-treated cells. Data are the mean ± SEM of at least three independent observations and were compared by ANOVA with a Fisher’s Protected Least Significant Difference (PLSD) post hocanalysis (*p < 0.001).
Fig. 3.

Bisindolylmaleimide II-mediated inhibition of Na+-dependentl-[3H]-glutamate transport (0.5 μm) in vehicle-treated (○) and PMA-treated (•) C6 glioma. Cells were preincubated with Bis II for 5 min, and either vehicle (DMSO) or PMA (100 nm) was added for 30 min before the measurement of Na+-dependentl-[3H]-glutamate transport.l-[3H]-glutamate uptake was measured and expressed as the percentage of baseline (no Bis II or PMA) activity. Data points represent the mean ± SEM of at least three independent experiments, each performed in triplicate. Data for the component of activity that was sensitive to Bis II were fit to a single site with Prism software. The IC50 value was 804 nm.
Effects of PMA on the cellular localization of EAAC1
PMA may enhance glutamate transport either via an increase in the catalytic rate of the transporter or via an increase in cell surface availability. To examine changes in the cell surface levels of EAAC1, we used a cell membrane-impermeant biotinylation reagent to label cell surface proteins selectively. Biotinylated proteins were separated from nonbiotinylated “intracellular” proteins by using avidin-coated beads. The blots were probed with anti-actin antibody and with rabbit anti-EAAC1 antibody. Figure4A shows a Western analysis of a representative biotinylation experiment. The yield of transporter immunoreactivity, defined as the sum of the immunoreactivity in the intracellular and biotinylated fractions divided by the immunoreactivity in the lysate, was 100% ± 14% (n = 11). Under control conditions (vehicle), 51% ± 5% (n = 11) of the EAAC1 immunoreactivity appeared in the biotinylated fraction, whereas only 14% ± 3% (n= 11) of the actin immunoreactivity was biotinylated. The biotinylation of actin may be attributable to a low level of cell lysis during the procedure. None of the treatment conditions that were examined caused a change in the amount of biotinylated actin (data not shown).
Fig. 4.
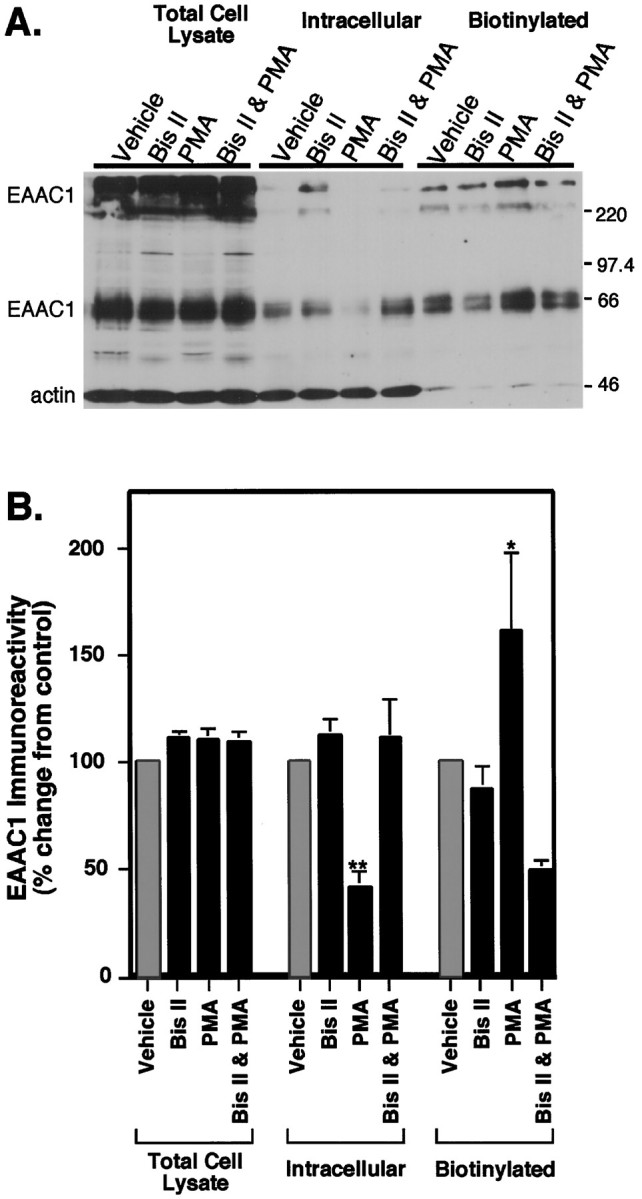
Analysis of distribution of EAAC1 immunoreactivity in C6 glioma after treatment with PMA. Cells were preincubated with either vehicle (DMSO) or Bis II (10 μm) for 5 min, followed by the addition of either vehicle or 100 nm PMA for an additional 30 min. Then the cells were biotinylated as described in Materials and Methods. A, Immunoblot of cell lysate, intracellular, and biotinylated fractions of C6 glioma. Loaded in all lanes was 50 μl of each sample, and blots were probed with anti-EAAC1 (66 kDa bands and bands above 220 kDa) and anti-actin (46 kDa band) to determine the extent of intracellular protein labeling by the biotin reagent. B, Quantitation of immunoblots demonstrating the effects of Bis II and PMA alone and in combination. Films were scanned and quantitated densitometrically, and EAAC1 immunoreactivity values were normalized for actin in the lysate fraction. Data represent the mean ± SEM from five individual experiments and are expressed as a percentage of the vehicle treatment for each fraction. There were no changes in EAAC1 levels between treatments in the total cell lysate fraction, but in the intracellular fraction PMA caused a significant decrease in EAAC1 levels, as compared with all other treatments by ANOVA (**p < 0.005; DMSO vs PMA; Fisher’s PLSD), which was blocked by Bis II (p < 0.001; PMA and Bis II vs PMA; Fisher’s PLSD). In the biotinylated fraction, PMA increased the cell surface expression of EAAC1 (*p< 0.05; DMSO vs PMA; Fisher’s PLSD), and Bis II alone had no effect on cell surface expression but blocked the effects of PMA on biotinylated EAAC1 (p < 0.001; Bis and PMA vs PMA; Fisher’s PLSD). The levels of biotinylated EAAC1 immunoreactivity in cells treated with both Bis II and PMA were not significantly different from control.
Although PMA had no effect on the total amount of EAAC1 (Fig.4B, total cell lysate), the nonbiotinylated (intracellular) transporter levels decreased with PMA treatment to 40% ± 9% (n = 5) of control levels. A corresponding increase in biotinylated (cell surface) EAAC1, with levels increasing to 161% ± 37% (n = 5) of control, indicates that a significant fraction of intracellular transporter moved to the cell surface as a result of PMA treatment. The PKC inhibitor Bis II had no effect on transporter distribution when it was used alone, but it blocked the changes in cellular localization of EAAC1 induced by PMA (Fig. 4B).
Effects of wortmannin on EAAC1-mediatedl-[3H]-glutamate transport
The effects of PMA and the PKC inhibitor bisindolylmaleimide II on EAAC1 activity and cellular localization observed thus far resembled those reported for glucose and GABA transporters (Nishimura and Simpson, 1994; Quick et al., 1997). Because studies of glucose transporters have implicated PI3K in the regulation of activity and trafficking, we examined the effects of the putative PI3K inhibitor wortmannin on l-[3H]-glutamate transport. Wortmannin maximally inhibited Na+-dependent glutamate transport to 35% of control levels (Fig.5). The IC50 value was 14.9 nm, similar to the reported IC50 values for PI3-kinase inhibition (for review, see Nakanishi et al., 1995). The decrease in transport activity occurred within minutes (significant atp < 0.005 within 5 min) and was maintained for a 90 min incubation period (data not shown).
Fig. 5.

Wortmannin-mediated inhibition of Na+-dependentl-[3H]-glutamate uptake (0.5 μm) in C6 glioma. Wortmannin was applied to cells for 30 min, and l-[3H]-glutamate uptake was assayed in triplicate. Values are expressed as the mean ± SEM for four independent experiments. Data for the component of activity that was sensitive to wortmannin were fit to a single site, using Prism software. The IC50 value for this sensitive component was 14.9 nm.
We also attempted to blockl-[3H]-glutamate uptake with the new PI3K inhibitor LY 294002, but inhibition was not observed consistently (at least seven independent observations). Although wortmannin also inhibits mitogen-activated protein (MAP) kinase and myosin light chain kinase, the IC50 values for inhibition of these kinases are at least 10-fold higher than the IC50 values for inhibition of PI3K (Nakanishi et al., 1995; Yano et al., 1995) and the IC50 value observed in the present study for inhibition of glutamate transport. Preliminary studies using the selective MAP kinase inhibitor PD 98059 showed no inhibition of transporter activity (data not shown), suggesting that MAP kinase is not a mediator of the effects of wortmannin on transport.
To analyze further how wortmannin might be influencing EAAC1 transport activity, we examined the effects on the concentration dependence of Na+-dependentl-[3H]-glutamate uptake. Wortmannin decreased the Vmax of glutamate transport to 43% of control, but it did not change the Km(Fig. 6A). To determine whether these effects could be attributed to altered metabolism of glutamate, we examined the effects of wortmannin on the transport ofd-aspartate, a nonmetabolizable analog of glutamate. Wortmannin decreased the Vmax for Na+-dependentd-[3H]-aspartate transport to 47% of control and also caused a slight but significant decrease in theKm (by 17%) (Fig. 6B). This suggests that the effects of wortmannin are not attributable to altered metabolism of l-glutamate. To determine whether wortmannin produces a nonspecific change in the electrochemical gradients required for Na+-dependent transport, we also examined the effects of wortmannin on Na+-dependent glycine transport activity. Wortmannin had no effect on glycine transport activity (Fig.6C), suggesting a selective effect of wortmannin on EAAC1 rather than a change in the electrochemical gradients of the cell.
Fig. 6.
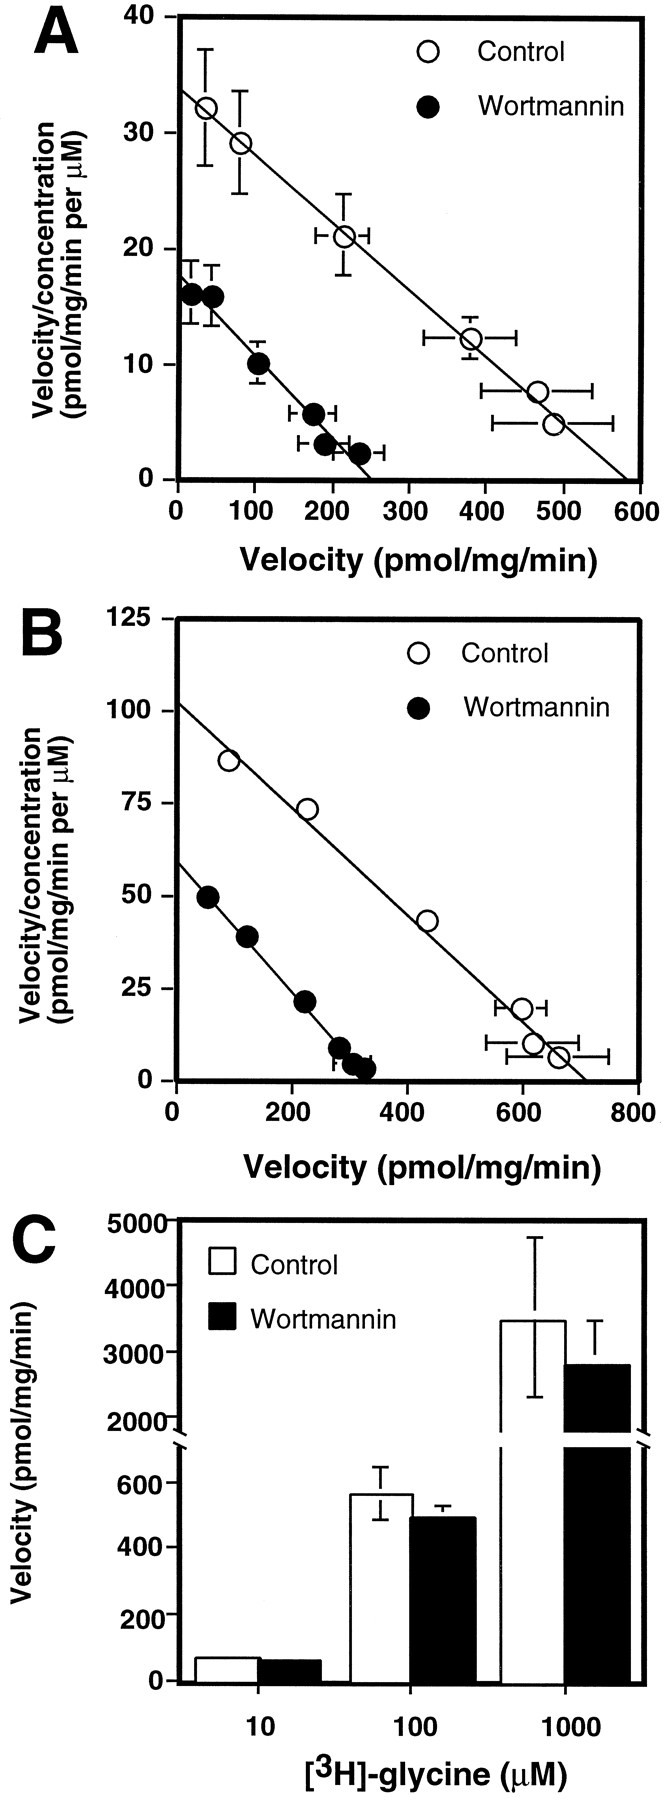
Effect of wortmannin on the concentration dependence of Na+-dependentl-[3H]-glutamate uptake in C6 glioma.A, Wortmannin (•; 100 nm) or vehicle (○) was added to cells for 30 min before uptake assay. Values are expressed as the mean ± SEM of six independent experiments performed in triplicate. TheKm was 17.6 ± 1.2 μm for controls and 15.0 ± 1.2 μm for wortmannin treatment (no significant difference; p > 0.05). TheVmax values were significantly different, with a Vmax of 589 ± 95 pmol · mg−1 · min−1 for controls and 256 ± 40 pmol · mg−1 · min−1 for wortmannin treatment (p < 0.01; unpaired Student’s t test). B, Effect of wortmannin on the concentration dependence of Na+-dependentd-[3H]-aspartate uptake in C6. Cells were incubated with 100 nm wortmannin (•) or vehicle (○) for 30 min before uptake assay. Values are expressed as the mean ± SEM of three independent experiments, each performed in triplicate. The Vmax for controls was 719 ± 72 pmol · mg−1 · min−1 and for wortmannin was 341 ± 19 pmol · mg−1 · min−1(p < 0.01; unpaired Student’st test). The Km for controls was 7.1 ± 0.3 μm and for wortmannin treatment was 5.9 ± 0.2 μm (p < 0.05; unpaired Student’s t test). C, Effect of wortmannin on Na+-dependentl-[3H]-glycine uptake at 10 or 100 μm or 0.1 mm concentrations of glycine. Wortmannin (▪; 100 nm) or vehicle (□) was added to cells 30 min before uptake assay. Values are the mean ± SEM of at least three independent experiments performed in triplicate (no significant effect by ANOVA).
Effect of wortmannin on the PMA-induced stimulation of EAAC1 transport
The effects of wortmannin on the PMA-induced increase inl-[3H]-glutamate uptake activity were examined (Fig. 7). As seen in previous experiments, wortmannin alone decreased the Vmaxof glutamate transport to 42% of control. PMA alone produced a 2.6-fold increase in the Vmax of glutamate transport activity. When cells were coincubated with wortmannin and PMA, the Vmax of glutamate uptake was stimulated by absolute amounts similar to those when PMA was used alone, but this stimulation originated from a reduced baseline level of transport (Fig.7). No change in Km values was observed with the treatments, suggesting that these treatments were not changing the affinity of the transporter for glutamate. It thus appears that the stimulatory effects of PMA were not blocked by wortmannin. This may imply that the mechanisms of PMA stimulation and wortmannin inhibition of uptake activity occur via independent intracellular cascades, because wortmannin does not block the effects of PMA fully.
Fig. 7.

Effect of coincubation of wortmannin and PMA on the concentration dependence of Na+-dependentl-[3H]-glutamate uptake in C6 glioma. Cells were preincubated for 5 min with either 100 nmwortmannin or vehicle, and 100 nm PMA or vehicle was added for 30 min before the measurement ofl-[3H]-glutamate uptake activity. Values represent the mean ± SEM of five independent experiments, each performed in triplicate. For control cells (○), theVmax value was 567 ± 94 pmol · mg−1 · min−1, and the Km value was 16.8 ± 2 μm. For PMA-treated cells (□), theVmax value was 1480 ± 330 pmol · mg−1 · min−1, and the Km value was 18.7 ± 2 μm. For wortmannin-treated cells (•), theVmax value was 239 ± 48 pmol · mg−1 · min−1, and the Km value was 19.1 ± 3 μm. For cells treated with both wortmannin and PMA (▪), the Vmax value was 910 ± 190 pmol · mg−1 · min−1, and the Km value was 21.2 ± 3 μm. The Vmax andKm values of all treatments were compared by ANOVA, and significant differences were found between theVmax values of control and PMA-treated cells (p < 0.005; Fisher’s PLSD) and between wortmannin- and wortmannin and PMA-treated cells (p < 0.05; Fisher’s PLSD). No significant differences were found among the Km values of any treatment conditions.
Effects of wortmannin on the cellular localization of EAAC1
To determine whether the effects of wortmannin were attributable to a change in catalytic efficiency, a change in the steady-state levels of EAAC1, or an alteration in cell surface availability of the transporter, we examined the time course for changes in cell surface expression by using biotinylation. The levels of EAAC1 did not change in the lysate, but within 5 min there was a significant decrease in cell surface expression of EAAC1 (Fig.8). This loss of surface EAAC1 increased with time. Therefore, the decrease in transport activity was associated with a loss in cell surface expression of EAAC1. Because the effects of PMA and wortmannin on activity appeared to be independent, biotinylation was used to examine the combined effects of these treatments on cell surface expression of EAAC1. None of these treatments changed the amount of EAAC1 in the lysate or intracellular fractions (Fig.9A,B). As was observed in earlier experiments, PMA increased EAAC1 levels at the cell surface by 42% ± 17% (n = 6), and wortmannin reduced the cell surface levels of EAAC1 to 45% ± 8% (n = 6) of control (Fig. 9B). However, unlike the effects of the combined treatments on transport activity, coincubation of wortmannin and PMA did not increase EAAC1 cell surface expression above that observed with wortmannin alone.
Fig. 8.
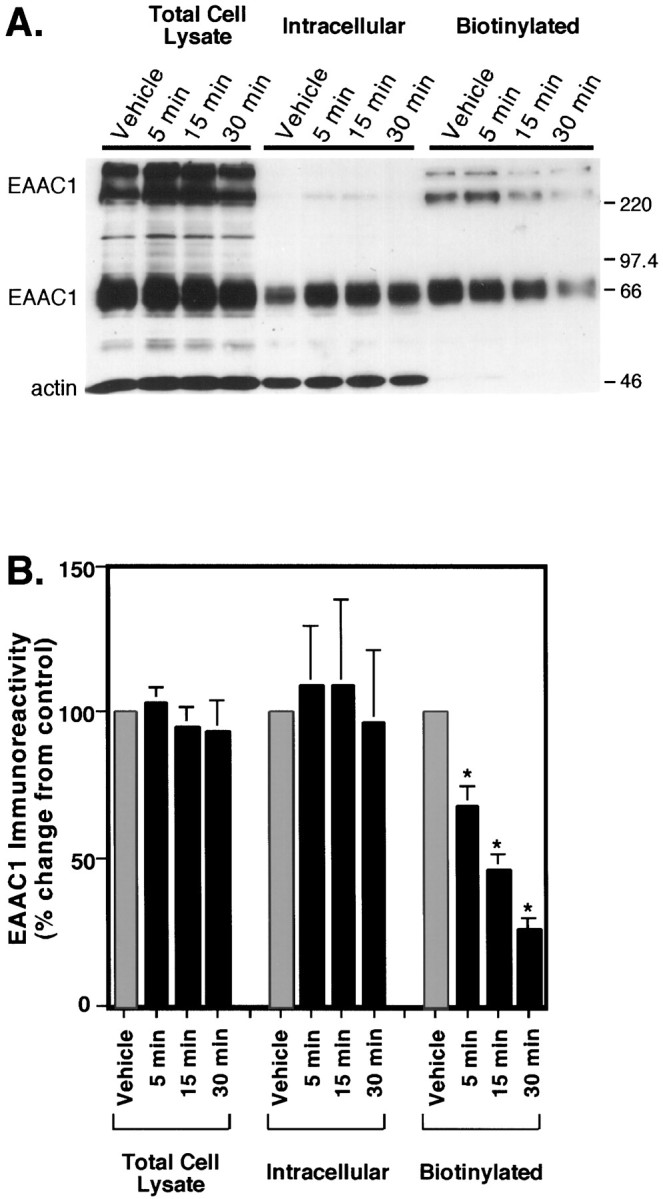
Time course of the effects of wortmannin on the cellular distribution of EAAC1. C6 glioma were preincubated with 100 nm wortmannin for 5, 15, or 30 min or with vehicle for 30 min before biotinylation. A, Immunoblot of EAAC1 (66 kDa and bands above 220 kDa) and actin (46 kDa band) immunoreactivity in cell lysate, intracellular, and biotinylated fractions. Actin was used to examine the extent of biotinylation of intracellular proteins.B, Quantitation of EAAC1 immunoreactivity, demonstrating a decrease in biotinylated EAAC1 with increasing wortmannin preincubation times. Films were scanned and quantitated densitometrically, and values are expressed as the mean ± SEM of four independent experiments. No significant differences between preincubation times occurred in the lysate or intracellular fractions, but in the biotinylated fraction, EAAC1 at each time point was significantly lower than control (ANOVA; *p < 0.001; Fisher’s PLSD), and differences between time points were significant (ANOVA; 5 vs 30 min, p < 0.001; 5 vs 15 min, p < 0.01; and 15 vs 30 min,p < 0.05; Fisher’s PLSD).
Fig. 9.
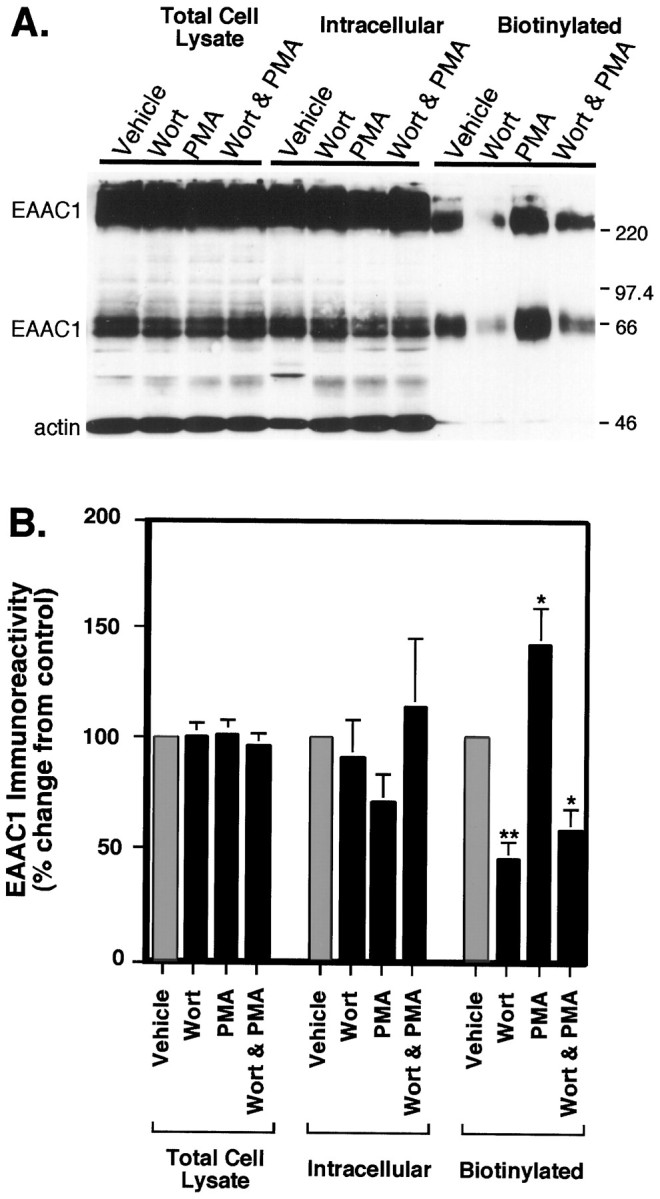
Analysis of the distribution of EAAC1 immunoreactivity in C6 glioma after treatment with PMA and wortmannin (Wort). Cells were preincubated with either vehicle or 100 nm wortmannin for 5 min, and either vehicle or PMA was added for 30 min before biotinylation. A, Immunoblot of cell lysate, intracellular, and biotinylated fractions of C6 glioma. Sample (50 μl) was loaded in all lanes, and blots were probed with anti-EAAC1 (66 kDa and bands above 220 kDa) and anti-actin (46 kDa band) as a control. B, Quantitation of immunoblots demonstrating the effects of wortmannin and PMA alone and in combination. Films were scanned and quantitated densitometrically, and all EAAC1 values were normalized for actin in the lysate fraction. Data represent the mean ± SEM from six individual experiments and are expressed as a percentage of the control treatment for each fraction. The treatments had no significant effects on EAAC1 levels in the total cell lysate or intracellular fractions. In the biotinylated fraction, wortmannin and wortmannin with PMA both caused significant decreases in cell surface expression of EAAC1 by ANOVA (**p < 0.005; *p < 0.05; Fisher’s PLSD). PMA increased cell surface expression of EAAC1 as compared with control (*p < 0.05; Fisher’s PLSD). There was no significant difference between Wort and Wort & PMA.
Visualization of changes in EAAC1 localization via confocal microscopy
To determine whether the changes in cellular distribution of EAAC1 could be visualized directly and correlated with the biotinylation studies, we used confocal microscopy to examine the changes in cell surface expression of EAAC1 in response to incubation with PMA and wortmannin. After the appropriate preincubation period, cells were stained with DAPI to visualize nuclei and with anti-EAAC1. Images taken through the midsection of the cell at the level of the largest nuclear area demonstrate that, under control situations (Fig.10A), the distribution of EAAC1 shows punctate immunostaining throughout the cytoplasm, with little transporter clustering at the cell surface. PMA increased EAAC1 immunoreactivity at the periphery of the cell (Fig.10B), causing significant transporter clustering while decreasing punctate cytoplasmic staining. PMA also changed the morphology of the cell, causing increased “ruffling” of the cell membrane. Wortmannin, in marked contrast, elicited a redistribution of the transporter into large vesicular compartments within the cell that resembled localization into late endosomal or lysosomal compartments (Fig. 10C). The combination of wortmannin and PMA caused a mixed distribution pattern of EAAC1 immunoreactivity as well as a morphological change in the cells (Fig. 10D). The transporter appeared intracellularly in a perinuclear distribution and also in some small clusters both in the cytoplasm and at the cell surface.
Fig. 10.

Effects of PMA and wortmannin on the cellular distribution of EAAC1 as examined by immunofluorescent confocal microscopy. Cells were treated with either DMSO (Vehicle) or wortmannin for 5 min, followed by either vehicle or PMA for 30 min. Cells were fixed and labeled with rhodamine-conjugated anti-EAAC1 (red) and DAPI (blue). Serial sections of 0.5 μm were obtained by confocal microscopy at 100× magnification, and sections through the center of the cell corresponding to the largest cross-sectional nuclear area were used for each treatment. These images were representative of multiple fields examined for each treatment from two independent immunofluorescence experiments. In control (vehicle-treated) cultures (A), the cells exhibited dispersed, punctate intracellular immunolabeling. In the presence of PMA (B) there was a marked decrease in intracellular labeling, with a redistribution of transporter to clusters on the cell surface (arrowheads) as well as a morphological change that resembled membrane ruffling. Wortmannin, in contrast to PMA, caused a redistribution of EAAC1 into dense vesicular-like perinuclear deposits (C, arrows). Combined treatment with both wortmannin and PMA caused some morphological changes as well as increased perinuclear immunostaining without the formation of large vesicle-like structures (D). Scale bar, 10 μm.
DISCUSSION
The regulation of EAAC1 is of considerable interest in light of the evidence that glutamate transporters may play a role in a variety of neurological diseases. The loss or dysfunction of glial transporters such as GLT-1 may contribute to the pathogenesis of some types of ALS (Rothstein et al., 1995, 1996), and knock-out studies suggest that both neuronal and glial transporters may play a role the prevention of excitotoxicity and resultant sequelae such as paralysis and seizures (Rothstein et al., 1996). The highest densities of the neuronal subtype EAAC1 are in the cortex and the hippocampus, areas that have high levels of glutamatergic synaptic transmission (Rothstein et al., 1994). Interestingly, these areas are also extremely sensitive to excitotoxic damage caused by stroke, ischemia, and head trauma (Palmer et al., 1993; Greene and Greenamyre, 1996; Nilsson et al., 1996). EAAC1 may play a role in the protection of neurons in these areas from excess glutamate release during normal synaptic activity and pathological conditions.
Thus far, the mechanisms of regulation of glutamate transporters by intracellular pathways are mainly unknown. Casado and colleagues demonstrated that the GLT-1 transporter transfected into HeLa cells undergoes direct phosphorylation when the cells are treated with phorbol ester, a known PKC activator (Casado et al., 1993). This increase in phosphorylation correlates with an increased rate of glutamate uptake, implying that increased phosphorylation may increase uptake activity. The precise mechanism of this increase in uptake activity is not known and could represent an increase in the catalytic rate of the transporter, an activation of silent transporters on the cell surface, and/or an increase in transporter translocation to the cell surface.
In the present study we demonstrated that the uptake activity and the cell surface localization of the glutamate transporter EAAC1 in C6 glioma is increased by PMA. Phorbol esters activate PKC by mimicking the effects of diacylglycerol (DAG), an endogenous activator of PKC. Previously, we have shown that the increase in uptake activity induced by PMA in C6 glioma cells is blocked by the noncompetitive PKC inhibitor chelerythrine (Dowd and Robinson, 1996). This suggested that the PKC pathway may mediate some of the effects of phorbol esters, possibly via phosphorylation at a PKC consensus site on the EAAC1 transporter. To provide additional evidence that the effects of PMA were mediated via activation of PKC, we used the competitive inhibitor Bis II, which did not produce the cell toxicity observed when chelerythrine was used at high concentrations. Bis II completely blocked the PMA-induced stimulation of glutamate uptake but had no effect on the basal level of glutamate uptake. Biotinylation with a membrane-impermeant reagent was used to determine whether PMA alters cell surface expression of EAAC1. Biotinylation has been used successfully in the study of apical–basolateral trafficking and in the identification of changes in cell surface expression of other transporters (Sargiacomo et al., 1989; Qian et al., 1997). PMA caused an increase in biotinylated EAAC1 and a concomitant decrease in nonbiotinylated transporter, suggesting that PMA translocates the transporter from an intracellular compartment to the cell surface. As was observed for PMA-stimulated transport activity, this effect was blocked completely by Bis II. Confocal microscopy provided further evidence that PMA causes a redistribution of EAAC1 in C6 glioma. After treatment with PMA, the cells showed a change in morphology that resembled membrane “ruffling” or the formation of filamentous microvilli (Von Zastrow and Kobilka, 1994). Rhodamine-labeled EAAC1 demonstrated a striking redistribution to the cell membrane and appeared to form discrete clusters on the cell surface. These clusters resemble those formed by PDZ domain-containing proteins such as Glu receptor interacting protein (GRIP), which appears to cluster AMPA receptors at excitatory synapses, or PSD-95, which appears to mediate the clustering of NMDA receptors (Kim et al., 1996; Dong et al., 1997). Interestingly, although EAAC1 appears to cluster after PKC activation, NMDA receptors disperse on the membrane (Ehlers et al., 1995). These images suggest that EAAC1 may interact with some cytoskeletal protein in response to PKC activation.
Because there were some similarities between the PMA-induced regulation of glutamate and glucose transporters (see the introductory remarks), the effects of wortmannin were examined to determine whether another signaling pathway might regulate EAAC1 activity and trafficking. A role for PI3K in protein trafficking and vesicle secretion has been suggested on the basis of homology with the yeast protein vps34, mutations of which cause vacuole sorting defects (Kapeller and Cantley, 1994). Wortmannin rapidly (within minutes) decreased glutamate uptake and EAAC1 cell surface expression when it was used alone, an effect not observed with the PKC inhibitor. This suggests that wortmannin reduces transport by blocking the activity of a constitutively active PI3K or a PI3K that is activated by a signaling molecule present in the medium. Because the IC50 value for wortmannin inhibition ofl-[3H]-glutamate transport is nearly identical to the IC50 value for PI3K inhibition and no other targets with similar sensitivity to wortmannin have been identified to date, we assume that wortmannin is blocking a subtype of PI3K, but we acknowledge the possibility of alternate targets of wortmannin inhibition. The lack of effectiveness of LY 294002 may be attributable to the nature of the competitive binding of LY 294002 to the ATP binding site of the p85 subunit, as compared with the irreversible interaction of wortmannin at the p110 catalytic subunit or the existence of differential PI3K isoform sensitivity to these two inhibitors. There are multiple isoforms of PI3K that are known, and there appears to be differential sensitivity of these isoforms to wortmannin, although the sensitivities of these isoforms to LY 294002 has not been analyzed specifically (for review, see Cheatham et al., 1994; Nakanishi et al., 1995).
Although wortmannin did not appear to increase transporter in the intracellular compartment in biotinylation experiments, confocal microscopy demonstrated an internalization of EAAC1 into large vesicular structures that were often perinuclear, a pattern characteristic of endosomal distribution (Sternini et al., 1996). We assume that the inability to detect an increase in intracellular EAAC1 with biotinylation is related to limitations of this technique or possibly to a loss of transporter to the viscous nuclear pellet that is obtained after lysis of the cells. The observation that Na+-dependent glycine transport is unaffected by wortmannin indicates that this effect is not a nonspecific endocytotic event. Future studies will be needed to identify the specific cellular compartment to which EAAC1 localizes.
The studies discussed to this point imply that the changes in transport activity are mediated by changes in cell surface expression. Because the effects of PMA and wortmannin on EAAC1 regulation were opposite, we examined the effects of both treatments together to determine whether they exert their effects via a common pathway. Although PMA stimulated transport activity in both vehicle-treated and wortmannin-treated cells by the same absolute amount, PMA increased cell surface expression only in vehicle-treated cells, but not in wortmannin-treated cells. This surprising result suggests at least two possible mechanisms to explain the effects of PMA and wortmannin on EAAC1. It is possible that PMA has effects on both the catalytic efficiency and cell surface expression of EAAC1 and that wortmannin selectively blocks the effect of PMA on cell surface expression. Alternatively, it is possible that wortmannin alters the mechanism of action of PMA by altering crosstalk between the PI3K and PKC pathways such that, in the absence of wortmannin, PMA increases activity by increasing cell surface expression and, in the presence of wortmannin, PMA increases the catalytic efficiency of transport.
Although PI3K is a rather newly identified signaling molecule, there is evidence for crosstalk between the PKC and PI3K pathways. It is known that receptor tyrosine kinase activation leads to the increased production of the metabolites DAG and IP3 by stimulating the activity of phospholipase C as well as the activation of PI3K (for review, see Kapeller and Cantley, 1994). DAG and phorbol esters activate PKC isoforms α, β, γ, δ, ε, η, μ, and θ, whereas the atypical PKC isoforms λ and ξ are insensitive to phorbol esters but are activated by the unique phospholipid products of PI3K (Mizukami et al., 1997). PI3K may interact directly with the PKC δ, λ, and ζ isoforms, providing a physical link between the PKC and PI3-kinase pathways (Ettinger et al., 1996; Gomez et al., 1996;Mizukami et al., 1997). C6 glioma cells express PKC α, δ, ζ, θ, and low levels of ε (Chen, 1993; Chen and Wu, 1995). It is possible that the regulation of EAAC1 activity in C6 glioma may be regulated by a combination of these isoforms, such that phorbol ester (DAG)-sensitive isoforms may regulate catalytic activity and some degree of trafficking to the cell surface, whereas PI3K-responsive isoforms may mediate transporter internalization.
In summary, we have developed evidence that both PKC and PI3K regulate cell surface expression and activity of the neuronal glutamate transporter EAAC1. At present, the physiological significance of this regulation is unclear, but preliminary studies from our laboratory suggest that this regulation may occur in neuronal cultures, indicating that this is not an artifact of the cell system used (Munir et al., 1997). Trafficking of neurotransmitter transporters could have a variety of physiological as well as pathophysiological consequences. Parallel mechanisms appear to regulate both transporter trafficking and neurotransmitter release. PKC increases cell surface expression of both GABA and glutamate transporters and also increases depolarization-evoked release of GABA and glutamate (Dekker et al., 1991; Capogna et al., 1995). There is now evidence that at least some proteins, such as SNAP-25, synaptobrevin, and syntaxin, are involved in both vesicular release of neurotransmitter and transporter trafficking (Quick et al., 1997). The finding that the EAAC1 subtype of glutamate transporter is trafficked to and from the cell surface raises interesting questions about the direction these transporters travel in different physiological situations, such as during long-term potentiation (LTP) or excitotoxic injury. For example, decreasing glutamate transporters at the cell surface during LTP could enhance synaptic efficacy. The ability to traffick transporters rapidly also may represent an endogenous protective mechanism to limit excitotoxic damage by increasing cell surface expression of transporters and hence to promote the clearance of extracellular glutamate. Alternatively, removal of transporters from the cell surface might reduce the reversal of transport, which is thought to contribute to the rise in extracellular glutamate that is observed during an excitotoxic insult (for review, see Attwell et al., 1993; Levi and Raiteri, 1993). The current studies suggest that there is a tightly regulated control mechanism that moves transporters appropriately in response to changes in the cellular environment.
Footnotes
This study was supported by National Institutes of Health (NIH) Grants NS29868 and NS36465 to M.B.R., an NIH predoctoral fellowship MH11977 to K.E.D., NIH Grant NS33958 to J.D.R., and Mental Retardation Research Center Grant HD26979. We thank Drs. M. Munir, D. Lynch, and O. Zelenaia for their helpful comments and review of this manuscript and Dr. J. Golden for his advice regarding the immunohistochemistry.
Correspondence should be addressed to Dr. Michael B. Robinson, Neuroscience Research, Abramson Pediatric Research Center, Room 502, 34th and Civic Center Boulevard, Philadelphia, PA 19104.
REFERENCES
- 1.Arriza JL, Eliasof S, Kavanaugh MP, Amara SG. Excitatory amino acid transporter 5, a retinal glutamate transporter coupled to a chloride conductance. Proc Natl Acad Sci USA. 1997;94:4155–4160. doi: 10.1073/pnas.94.8.4155. [DOI] [PMC free article] [PubMed] [Google Scholar]
- 2.Attwell D, Barbour B, Szatkowski M. Nonvesicular release of neurotransmitter. Neuron. 1993;11:401–407. doi: 10.1016/0896-6273(93)90145-h. [DOI] [PubMed] [Google Scholar]
- 3.Capogna M, Gahwiler BH, Thompson SM. Presynaptic enhancement of inhibitory synaptic transmission by protein kinase A and C in rat hippocampus in vitro. J Neurosci. 1995;15:1249–1260. doi: 10.1523/JNEUROSCI.15-02-01249.1995. [DOI] [PMC free article] [PubMed] [Google Scholar]
- 4.Casado M, Bendahan A, Zafra F, Danbolt NC, Gimenez C, Kanner BI. Phosphorylation and modulation of brain glutamate transporters by protein kinase C. J Biol Chem. 1993;268:27313–27317. [PubMed] [Google Scholar]
- 5.Cheatham B, Vlahos CJ, Cheatham L, Wang L, Blenis J, Kahn CR. Phosphatidylinositol 3-kinase activation is required for insulin stimulation of pp70 S6 kinase, DNA synthesis, and glucose transporter translocation. Mol Cell Biol. 1994;14:4902–4911. doi: 10.1128/mcb.14.7.4902. [DOI] [PMC free article] [PubMed] [Google Scholar]
- 6.Chen C-C. Protein kinase C α, δ, ε, and ζ in C6 glioma cells: TPA induces translocation and down-regulation of conventional and new PKC isoforms but not atypical PKCζ. FEBS Lett. 1993;332:169–173. doi: 10.1016/0014-5793(93)80506-p. [DOI] [PubMed] [Google Scholar]
- 7.Chen C-C, Wu M-L. Protein kinase C isoform δ is involved in the stimulation of the Na+–H+ exchanger in C6 glioma cells. Mol Pharmacol. 1995;48:995–1003. [PubMed] [Google Scholar]
- 8.Chew CS, Zhou CJ, Parente JA., Jr Ca2+-independent protein kinase C isoforms may modulate parietal cell HCl secretion. Am J Physiol. 1997;272:G246–G256. doi: 10.1152/ajpgi.1997.272.2.G246. [DOI] [PubMed] [Google Scholar]
- 9.Clarke JF, Young PW, Yonezawa K, Kasuga M, Holman GD. Inhibition of the translocation of GLUT1 and GLUT4 in 3T3–L1 cells by the phosphatidylinositol 3-kinase inhibitor, wortmannin. Biochem J. 1994;300:631–635. doi: 10.1042/bj3000631. [DOI] [PMC free article] [PubMed] [Google Scholar]
- 10.Dekker LV, De Graan PNE, Gispen WH. Transmitter release: target of regulation by protein kinase C? In: Gispen WH, Routtenberg A, editors. Progress in brain research. Elsevier Science; New York: 1991. pp. 209–233. [DOI] [PubMed] [Google Scholar]
- 11.Dong H, O’Brien RJ, Fung ET, Lanahan AA, Worley PF, Huganir RL. GRIP: a synaptic PDZ domain-containing protein that interacts with AMPA receptors. Nature. 1997;386:279–284. doi: 10.1038/386279a0. [DOI] [PubMed] [Google Scholar]
- 12.Dowd LA, Robinson MB. Rapid stimulation of EAAC1-mediated Na+-dependent l-glutamate transport activity in C6 glioma by phorbol ester. J Neurochem. 1996;67:508–516. doi: 10.1046/j.1471-4159.1996.67020508.x. [DOI] [PubMed] [Google Scholar]
- 13.Dowd LA, Coyle AJ, Rothstein JD, Pritchett DB, Robinson MB. Comparison of Na+-dependent glutamate transport activity in synaptosomes, C6 glioma, and Xenopus oocytes expressing excitatory amino acid carrier 1 (EAAC1). Mol Pharmacol. 1996;49:465–473. [PubMed] [Google Scholar]
- 14.Ehlers MD, Tingley WG, Huganir RL. Regulated subcellular distribution of the NR1 subunit of the NMDA receptor. Science. 1995;269:1734–1737. doi: 10.1126/science.7569904. [DOI] [PubMed] [Google Scholar]
- 15.Ettinger SL, Lauener RW, Duronio V. Protein kinase C δ specifically associates with phosphatidylinositol 3-kinase following cytokine stimulation. J Biol Chem. 1996;271:14514–14518. doi: 10.1074/jbc.271.24.14514. [DOI] [PubMed] [Google Scholar]
- 16.Fairman WA, Vandenberg RJ, Arriza JL, Kavanaugh MP, Amara SG. An excitatory amino acid transporter with properties of a ligand-gated chloride channel. Nature. 1995;375:599–603. doi: 10.1038/375599a0. [DOI] [PubMed] [Google Scholar]
- 17.Furuta A, Martin LJ, Lin C-LG, Dykes-Hoberg M, Rothstein JD. Cellular and synaptic localization of the neuronal glutamate transporters EAAT3 and EAAT4. Neuroscience. 1997;81:1031–1042. doi: 10.1016/s0306-4522(97)00252-2. [DOI] [PubMed] [Google Scholar]
- 18.Gomez J, Martinez A-C, Garcia A, Rebollo A. Association of phosphatidylinositol 3-kinase to protein kinase Cζ during interleukin-2 stimulation. Eur J Immunol. 1996;26:1781–1787. doi: 10.1002/eji.1830260818. [DOI] [PubMed] [Google Scholar]
- 19.Greene JG, Greenamyre JT. Bioenergetics and glutamate excitotoxicity. Prog Neurobiol. 1996;48:613–634. doi: 10.1016/0301-0082(96)00006-8. [DOI] [PubMed] [Google Scholar]
- 20.Haugeto O, Ullensvang K, Levy LM, Chaudhry FA, Honore T, Nielsen M, Lehre KP, Danbolt NC. Brain glutamate transporter proteins form homomultimers. J Biol Chem. 1996;271:27715–27722. doi: 10.1074/jbc.271.44.27715. [DOI] [PubMed] [Google Scholar]
- 21.Holman GD, Cushman SW. Subcellular localization and trafficking of the GLUT4 glucose transporter isoform in insulin-responsive cells. BioEssays. 1994;16:753–759. doi: 10.1002/bies.950161010. [DOI] [PubMed] [Google Scholar]
- 22.James DE, Piper RC. Insulin resistance, diabetes, and the insulin-related trafficking of GLUT4. J Cell Biol. 1994;126:1123–1126. doi: 10.1083/jcb.126.5.1123. [DOI] [PMC free article] [PubMed] [Google Scholar]
- 23.Kanai Y, Hediger MA. Primary structure and functional characterization of a high-affinity glutamate transporter. Nature. 1992;360:467–471. doi: 10.1038/360467a0. [DOI] [PubMed] [Google Scholar]
- 24.Kapeller R, Cantley LC. Phosphatidylinositol 3-kinase. BioEssays. 1994;16:565–576. doi: 10.1002/bies.950160810. [DOI] [PubMed] [Google Scholar]
- 25.Kim E, Cho KO, Rothschild A, Sheng M. Heteromultimerization and NMDA receptor-clustering activity of chapsyn-110, a member of the PSD-95 family of proteins. Neuron. 1996;17:103–113. doi: 10.1016/s0896-6273(00)80284-6. [DOI] [PubMed] [Google Scholar]
- 26.Levi G, Raiteri M. Carrier-mediated release of neurotransmitters. Trends Neurosci. 1993;16:415–419. doi: 10.1016/0166-2236(93)90010-j. [DOI] [PubMed] [Google Scholar]
- 27.Lowry OH, Rosenberg NJ, Farr AL, Randall RJ. Protein measurement with the folin phenol reagent. J Biol Chem. 1951;193:265–275. [PubMed] [Google Scholar]
- 28.Mizukami Y, Hirata T, Yoshida K. Nuclear translocation of PKCζ during ischemia and its inhibition by wortmannin, an inhibitor of phosphatidylinositol 3-kinase. FEBS Lett. 1997;401:247–251. doi: 10.1016/s0014-5793(96)01481-0. [DOI] [PubMed] [Google Scholar]
- 29.Munir M, Rothstein JR, Robinson MB. MGluR-mediated increase in cell surface expression of the neuronal glutamate transporter, EAAC1, a possible endogenous mechanism to limit excitotoxicity. Soc Neurosci Abstr. 1997;23:585.9. [Google Scholar]
- 30.Nakanishi S, Yano H, Matsuda Y. Novel functions of phosphatidylinositol 3-kinase in terminally differentiated cells. Cell Signal. 1995;7:545–557. doi: 10.1016/0898-6568(95)00033-l. [DOI] [PubMed] [Google Scholar]
- 31.Navé BT, Siddle K, Shepherd PR. Phorbol esters stimulate phosphatidylinositol 3,4,5-triphosphate production on 3T3–L1 adipocytes: implications for stimulation of glucose transport. Biochem J. 1996;318:203–205. doi: 10.1042/bj3180203. [DOI] [PMC free article] [PubMed] [Google Scholar]
- 32.Nilsson P, Laursen H, Hillered L, Hansen AJ. Calcium movements in traumatic brain injury: the role of glutamate receptor-operated ion channels. J Cereb Blood Flow Metab. 1996;16:262–270. doi: 10.1097/00004647-199603000-00011. [DOI] [PubMed] [Google Scholar]
- 33.Nishimura H, Simpson IA. Staurosporine inhibits phorbol 12-myristate 13-acetate- and insulin-stimulated translocation of GLUT1 and GLUT4 glucose transporters in rat adipose cells. Biochem J. 1994;302:271–277. doi: 10.1042/bj3020271. [DOI] [PMC free article] [PubMed] [Google Scholar]
- 34.Nixon JS, Bishop J, Bradshaw D, Davis PD, Hill CH, Elliott LH, Kumar H, Lawton G, Lewis EJ, Mulqueen M, Westmacott D, Wadsworth J, Wilkinson SE. The design and biological properties of potent and selective inhibitors of protein kinase C. Biochem Soc Trans. 1992;20:419–425. doi: 10.1042/bst0200419. [DOI] [PubMed] [Google Scholar]
- 35.Palmer AM, Marion DW, Botscheller ML, Swedlow PE, Styren SD, DeKosky ST. Traumatic brain injury-induced excitotoxicity assessed in a controlled cortical impact model. J Neurochem. 1993;61:2015–2024. doi: 10.1111/j.1471-4159.1993.tb07437.x. [DOI] [PubMed] [Google Scholar]
- 36.Palos TP, Ramachandran B, Boado R, Howard BD. Rat C6 and human astrocytic tumor cells express a neuronal type of glutamate transporter. Mol Brain Res. 1996;37:297–303. doi: 10.1016/0169-328x(95)00331-l. [DOI] [PubMed] [Google Scholar]
- 37.Pines G, Danbolt NC, Bjørås M, Zhang Y, Bendahan A, Eide L, Koepsell H, Storm-Mathisen J, Seeberg E, Kanner BI. Cloning and expression of a rat brain l-glutamate transporter. Nature. 1992;360:464–467. doi: 10.1038/360464a0. [DOI] [PubMed] [Google Scholar]
- 38.Qian Y, Galli A, Ramamoorthy S, Risso S, DeFelice LJ, Blakely RD. Protein kinase C activation regulates human serotonin transporters in HEK-293 cells via altered cell surface expression. J Neurosci. 1997;17:45–57. doi: 10.1523/JNEUROSCI.17-01-00045.1997. [DOI] [PMC free article] [PubMed] [Google Scholar]
- 39.Quick MW, Corey JL, Davidson N, Lester HA. Second messengers, trafficking-related proteins, and amino acid residues that contribute to the functional regulation of the rat brain GABA transporter GAT1. J Neurosci. 1997;17:2967–2979. doi: 10.1523/JNEUROSCI.17-09-02967.1997. [DOI] [PMC free article] [PubMed] [Google Scholar]
- 40.Robinson MB, Dowd LA. Heterogeneity and functional properties of subtypes of sodium-dependent glutamate transporters in the mammalian central nervous system [review]. Adv Pharmacol. 1997;37:69–115. doi: 10.1016/s1054-3589(08)60948-5. [DOI] [PubMed] [Google Scholar]
- 41.Rosenberg PA, Amin S, Leitner M. Glutamate uptake disguises neurotoxic potency of glutamate agonists in cerebral cortex in dissociated cell culture. J Neurosci. 1992;12:56–61. doi: 10.1523/JNEUROSCI.12-01-00056.1992. [DOI] [PMC free article] [PubMed] [Google Scholar]
- 42.Rothstein JD, Martin L, Levey AI, Dykes-Hoberg M, Jin L, Wu D, Nash N, Kuncl RW. Localization of neuronal and glial glutamate transporters. Neuron. 1994;13:713–725. doi: 10.1016/0896-6273(94)90038-8. [DOI] [PubMed] [Google Scholar]
- 43.Rothstein JD, VanKammen M, Levey AI, Martin LJ, Kuncl RW. Selective loss of glial glutamate transporter GLT-1 in amyotrophic lateral sclerosis. Ann Neurol. 1995;38:73–84. doi: 10.1002/ana.410380114. [DOI] [PubMed] [Google Scholar]
- 44.Rothstein JD, Dykes-Hoberg M, Pardo CA, Bristol LA, Jin L, Kuncl RW, Kanai Y, Hediger M, Wang Y, Schielke JP, Welty DF. Knockout of glutamate transporters reveals a major role for astroglial transport in excitotoxicity and clearance of glutamate. Neuron. 1996;16:675–686. doi: 10.1016/s0896-6273(00)80086-0. [DOI] [PubMed] [Google Scholar]
- 45.Sargiacomo M, Lisanti M, Graeve L, Le Bivic A, Rodriguez-Boulan E. Integral and peripheral protein composition of the apical and basolateral membrane domains in cells. J Membr Biol. 1989;107:277–286. doi: 10.1007/BF01871942. [DOI] [PubMed] [Google Scholar]
- 46.Sternini C, Spann M, Anton B, Keith DE, Jr, Bunnett NW, Von Zastrow M, Evans C, Brecha NC. Agonist-selective endocytosis of μ-opioid receptor by neurons in vivo. Proc Natl Acad Sci USA. 1996;93:9241–9246. doi: 10.1073/pnas.93.17.9241. [DOI] [PMC free article] [PubMed] [Google Scholar]
- 47.Storck T, Schulte S, Hofmann K, Stoffel W. Structure, expression, and functional analysis of a Na+-dependent glutamate/aspartate transporter from rat brain. Proc Natl Acad Sci USA. 1992;89:10955–10959. doi: 10.1073/pnas.89.22.10955. [DOI] [PMC free article] [PubMed] [Google Scholar]
- 48.Tanaka K, Watase K, Manabe T, Yamada K, Watanabe M, Takahashi K, Iwama H, Nishikawa T, Ichihara N, Kikuchi T, Okuyama S, Kawashima N, Hori S, Takimoto M. Epilepsy and exacerbation of brain injury in mice lacking the glutamate transporter GLT-1. Science. 1997;276:1699–1702. doi: 10.1126/science.276.5319.1699. [DOI] [PubMed] [Google Scholar]
- 49.Toullec D, Pianetti P, Coste H, Bellevergue P, Grand-Perret T, Ajakane M, Baudet V, Boissin P, Boursier E, Loriolle F, Duhamel L, Charon D, Kirilovsky J. The bisindolylmaleimide GF 109203X is a potent and selective inhibitor of protein kinase C. J Biol Chem. 1991;266:15771–15781. [PubMed] [Google Scholar]
- 50.Ubl JJ, Reiser G. Activity of protein kinase C is necessary for sustained thrombin-induced [Ca2+]i oscillations in rat glioma cells. Pflügers Arch. 1997;433:312–320. doi: 10.1007/s004240050282. [DOI] [PubMed] [Google Scholar]
- 51.Von Zastrow M, Kobilka BK. Antagonist-dependent and -independent steps in the mechanism of adrenergic receptor internalization. J Biol Chem. 1994;269:18448–18452. [PubMed] [Google Scholar]
- 52.Yano H, Agatsuma T, Nakanishi S, Saitoh Y, Fukui Y, Nonomura Y, Matsuda Y. Biochemical and pharmacological studies with KT7692 and LY294002 on the role of phosphatidylinositol 3-kinase in FcεRI-mediated signal transduction. Biochem J. 1995;312:145–150. doi: 10.1042/bj3120145. [DOI] [PMC free article] [PubMed] [Google Scholar]
- 53.Zhu SJ, Kavanaugh MP, Sonders MS, Amara SG, Zahniser NR. Activation of protein kinase C inhibits uptake, currents, and binding associated with the human dopamine transporter expressed in Xenopus oocytes. J Pharmacol Exp Ther. 1997;282:1358–1365. [PubMed] [Google Scholar]