

Abstract
The perception of complex sounds, such as speech and animal vocalizations, requires the central auditory system to analyze rapid, ongoing fluctuations in sound frequency and intensity. A decline in temporal acuity has been identified as one component of age-related hearing loss. The detection of short, silent gaps is thought to reflect an important fundamental dimension of temporal resolution. In this study we compared the neural response elicited by silent gaps imbedded in noise of single neurons in the inferior colliculus (IC) of young and old CBA mice. IC neurons were classified by their temporal discharge patterns. Phasic units, which accounted for the majority of response types encountered, tended to have the shortest minimal gap thresholds (MGTs), regardless of age. We report three age-related changes in neural processing of silent gaps. First, although the shortest MGTs (1–2 msec) were observed in phasic units from both young and old animals, the number of neurons exhibiting the shortest MGTs was much lower in old mice, regardless of the presentation level. Second, in the majority of phasic units, recovery of response to the stimulus after the silent gap was of a lower magnitude and much slower in units from old mice. Finally, the neuronal map representing response latency versus best frequency was found to be altered in the old IC. These results demonstrate a central auditory system correlate for age-related decline in temporal processing at the level of the auditory midbrain.
Keywords: temporal resolution, gap detection, inferior colliculus, neural recovery, hearing, presbycusis, forward masking
Decline in sensorimotor function is a common complaint among the elderly (Corso, 1981). In fact, age-related hearing loss is the most prevalent form of hearing impairment in our society (Gates et al., 1990). Recent epidemiological estimates indicate that approximately one of three individuals over the age of 75 years suffers from some degree of hearing impairment that diminishes the ability to communicate effectively (White, 1985). Although age-related hearing loss, or presbycusis, classically was thought to be primarily a deficit in the function of the ear (Schuknecht, 1964; Willott, 1991), contemporary studies suggest there may be a CNS component as well (Duquesnoy, 1983; Dubno et al., 1984;Cranford and Romereim, 1992; Jerger et al., 1994; Snell et al., 1994;Fitzgibbons and Gordon-Salant, 1996). In these studies, elderly listeners generally show a greater impairment, compared with young subjects, when the speech signal is degraded either by masking or by temporal alteration (Gelfand et al., 1988; Cobb et al., 1993;Gordon-Salant and Fitzgibbons, 1993; Frisina and Frisina, 1997). Although the underlying mechanisms responsible for age-related deficits in speech recognition are poorly understood, in many cases a concomitant decline in temporal processing exists (Glasberg and Moore, 1988; Moore et al., 1992; Snell, 1997). Consistent with deficits in auditory temporal processing are reports of generalized age-related slowing in information processing. This decrease in the speed of cognitive processing has been hypothesized to be a global dysfunction of the aged brain (Salthouse, 1985; Cronin-Golomb et al., 1991; Rapp and Amaral, 1992; Kim and Mayer, 1994).
The inferior colliculus (IC) mediates the integration of auditory information from many brainstem nuclei (Adams, 1979; Aitkin 1986;Oliver and Heurta, 1992). IC neurons demonstrate a sophisticated level of processing for complex signals, including species-specific vocalizations (Aitkin et al., 1994), amplitude modulation (Rees and Møller, 1987; Langner and Schreiner, 1988; Langner, 1992), spatial localization cues (Semple et al., 1983; Irvine, 1986; McFadden and Willott, 1994), duration tuning (Casseday et al., 1994), envelope detection (Barsz et al., 1998), and gap detection (Walton et al., 1997). The present report comprises one component of a series of experiments focused on the examination of the neural mechanisms that may play a role in the sensory deficits evident in the aged auditory system (Kazee et al., 1995; Frisina et al., 1997; Walton et al., 1997;Zettel et al., 1997).
The detection of brief silent intervals, or temporal gaps, in an ongoing sound is a simple, yet extremely efficient method used to assess auditory temporal resolution (Plomp, 1964; Green and Forrest, 1989). Moreover, elevated gap detection thresholds have been linked to poor speech recognition in aged human listeners (Glasberg and Moore, 1988; Fitzgibbons and Gordon-Salant, 1996). Here we systematically compare fundamental response properties and neural gap detection ability in IC neurons of young and old CBA mice. Two questions concerning age-related changes in temporal acuity were posed: (1) is the neural circuitry of the auditory midbrain that encodes temporal features of sound (e.g., gaps) affected by age, and (2) are there concomitant age-related changes in other single-neuron response properties that underlie behavioral gap detection? This is the first study, to our knowledge, that demonstrates age-related deficits in temporal processing at the single-unit level of the mammalian brain.
MATERIALS AND METHODS
Animals. Young adult (2–3.5 months old) and old (24–28 months old) CBA/CaJ mice were obtained from the National Institute of Aging and The Jackson Laboratory (Bar Harbor, ME) and kept in an isolated, noise-controlled vivarium on a 12 hr light/dark cycle. Food and water were provided ad libitum. Before each experiment, animals were lightly anesthetized with Metofane (methoxyflurane; Pittman-Moore, Inc.), and the external auditory meatus was examined down to the tympanic membrane for blockage. Only animals found to have clear external canals were used.
Surgical preparation. Animals were prepared under aseptic conditions according to the guidelines for recovery surgery approved by the Committee on Animal Resources of the University of Rochester. Before surgery, mice were deeply anesthetized with Metofane, the skull was shaved, and the cranium was exposed by reflecting the scalp musculature. Next, a 2% solution of lidocaine was applied topically. The area was cleaned and dried, and a small, threaded metal tube was attached to the skull surface using cyanoacrylate glue (Superglue) and dental acrylic. A sharpened tungsten wire was implanted in the skull just in contact with the dura mater and served as the indifferent electrode. The IC was exposed by making a small craniotomy (0.5 × 0.5 mm). After covering the opening with Gelfoam, the animal was allowed to recover at least 1 d before the experiment.
Mice were mildly tranquilized (Taractan, 5–12 μg/gm) and placed in a plastic restraint attached to a custom-built stereotaxic frame (Schuller et al., 1986; O’Neill et al., 1989). Typically, old mice were administered one-third to one-half of the dose required for young animals. The frame was located in the middle of a heated (27–30°C), double-walled, sound-attenuated room (IAC) lined with sound-absorbing foam (Sonex). The animal’s head was fixed to the frame by bolting the threaded tube to a rigid bar attached to the stereotaxic frame. Care was taken to ensure that the animal was as comfortable as possible to avoid unnecessary distress and body movement.
Stimulus presentation. Stimulus generation was controlled via a Digital Equipment Corporation (Maynard, MA) Micro-PDP 11/23+ computer, interfaced to a programmable stimulus generation and spike acquisition system. The search stimulus consisted of 100 msec wide-band (0.20–500 kHz) Gaussian noise bursts, with a rise–fall time of 1 msec gated by a cosine envelope (Wilsonics BSIT programmable electronic switch) produced by a General Radio 1390-B random noise generator. Tone bursts were generated similarly from a function generator (Wavetek 111). After a neuron was isolated, the following experimental protocol was followed: (1) audiovisual determination of best frequency (BF) and threshold, (2) measurement of rate intensity functions using 100 msec noise and tone burst stimuli, with 1 msec linear rise–fall times, presented at a rate of four/sec, (3) measurement of spontaneous activity over 22 sec, and (4) presentation of gap series at two carrier intensities, 65 dB sound pressure level (SPL) (re: 20 μPa) and 10–20 dB above the noise minimum threshold (MT). Minimum threshold was defined as the lowest intensity at which an increase in activity above the spontaneous rate was just noticeable. The intensity of the noise carriers never exceeded 80 dB SPL. This protocol was followed until the unit was lost or the signal-to-noise ratio of the spike waveform fell to <3:1.
Gap stimuli consisted of silent gaps embedded between two noise bursts. The initial noise burst (NB1) was 100 msec, and the second burst (NB2) was 50 msec in duration, both with 1 msec linear rise–fall times. A gap series began with a control stimulus without a gap (150 msec duration), followed by a series of gap widths ranging from 1 to 150 msec. These stimuli were presented 75 times and iteratively selected using a bank of digital pulse generators (AMPI Master-8). All stimuli were attenuated by a programmable attenuator (Wilsonics PATT), amplified (Kenwood 620), and broadcast from a Panasonic model 203 leaf tweeter. The speaker was placed 15 cm away from the head and 30° contralateral to the recording location on the horizontal axis. Sound calibration was performed by an automated program that stepped through frequencies between 1 and 60 kHz (36 points/octave) and measured the output of the speaker with a calibrated ¼ inch condenser microphone (Bruel and Kjaer, model 4135) placed at the location of the pinna and connected to a measuring amplifier (Bruel and Kjaer, model 2610). The sound pressure level varied less than ±3 dB between 2 and 30 kHz and decreased at 18 dB/octave at >30 kHz.
Recording and data acquisition. Recording sessions typically lasted between 6 and 8 hr, throughout which time the animal was monitored continuously. If at any time the animal showed signs of discomfort, such as struggling or frequent movement, it was removed from the apparatus. No more than three sessions were completed on any one animal, and the final recording sessions were always completed within 14 d of surgery. The responses of single units in the IC were recorded using borosilicate glass micropipettes (A-M Systems) pulled on a programmable pipette puller (Sachs and Flaming) and filled with either 3 m KCl (tip impedances of 12–14 MΩ) or a 10% solution of horseradish peroxidase (HRP). Electrodes were positioned over the IC using x- and y-axis manipulators that were controlled by 1 μm resolution stepping motors. The z-axis was manually controlled for coarse positioning of the electrode over the surface of the IC, and single units were isolated in the IC using a remote-controlled piezoelectric micropositioner (Burleigh Inchworm, model PZ-575). This stereotaxic coordinate system allowed for session-to-session electrode reposition accuracy of ∼150 μm. In each animal, x, y, and z coordinates were referenced to a fixed point on the stereotaxic frame. Recordings were made over the complete dorsoventral extent of the IC.
Neural activity was amplified (Dagan 2400), filtered from 0.3 to 5 kHz (Krohn-Hite 3202), and led to a window discriminator (BAK DIS-1) for spike isolation. The spike waveforms of all the units included in the present study were continuously monitored with an analog delay (BAK AD-3) and appeared triphasic in shape. The output of the window discriminator was displayed in a dot raster format on a storage oscilloscope and also served as the input to two linked computer-controlled, real-time clocks used for time stamping of stimulus and spike times. Custom software allowed for spike times to be processed with a precision of 10 μsec and peristimulus time histograms (PSTHs) to be computed on-line.
Data analysis. To quantify the minimal gap threshold (MGT), PSTHs were analyzed by an automated procedure that compared spike counts in multiple time windows for the control (no gap) and gap response histograms. The ability of a neuron to encode the gap is observed qualitatively as a decrease in spikes occurring during the silent interval or as an increase in spikes in response to the onset of NB2. In some units both types of responses to the gap were observed. After sorting spikes into PSTHs (1 msec bin width), spikes were counted using several different time windows, referred to as a quiescent window or driven windows. The start of the quiescent window was set at the end of the response to NB1. For each gap series the start of the driven window was determined using the first gap duration of the series, in which an unambiguous response was present to NB2. The durations of the quiescent and driven windows were set to 5, 10, and 50 msec. In each case, the comparison windows in the control (no gap) histograms had identical durations and start times. The rationale for this analysis assumes that the central targets of these neurons are also looking at these windows to determine changes in the gap stimulus. The MGT was quantified by a program that automatically compared the spike counts in control and gap PSTHs. The analysis program incrementally cycled through each gap histogram and reported the histograms in which the count windows differed by >50% from the control histogram. The MGT was obtained from the time window that reported the lowest gap threshold based on two criteria: (1) the gap duration that produced an increase or decrease of 50% in spike count when compared with the control response, and (2) the requirement that the next two longest gap durations in the series also met the above criterion. Mean data were subsequently statistically analyzed using independent and dependent Student’s t tests and ANOVAs. Sample distributions were analyzed using linear regression analysis, and the Kolmogorov–Smirnov (KS) nonparametric test was used (Systat, Evanston, IL) to test for differences in the distributions.
To quantify response latencies, mean first spike latencies and SDs were computed from spike arrival times in response to 75 repetitions of the control gap stimulus. The response to NB1 was windowed so that only driven spikes were included in the analysis. The duration of the analysis was 25 msec after the onset of the driven response for phasic units and 50 msec after the onset of the response in tonic type units. The raw spike times were collected in 10 μsec bins, which limited latency measures to 10 μsec.
Histological verification. In any neurophysiological study of the central auditory system it is important to distinguish the location of units within the nucleus under study. In addition to close inspection of specific response types according to area, HRP microinjections were used to calibrate locations of recordings within the IC. HRP (10% Sigma type XII in 0.5 m KCl and 0.05m Tris buffer, pH = 7.3) was iontophoretically injected (electrode-positive), using 1.5 μA constant direct current for 15–20 min, into the area of the IC in which recordings were made (Willard and Ryugo, 1983; Meininger et al., 1986). Animals were returned to their cage and perfused transcardially 24 hr later with heparinized saline, and fixed with glutaraldehyde and paraformaldehyde. Three serial sets of coronal sections were cut at 60 μm. Two sets were processed with tetramethylbenzidine, and one was counterstained with safranin-O. The third set was reacted with diaminobenzidine and counterstained with cresyl violet (Mesulam, 1982). The centers of the injection sites were 500–990 μm in diameter and were confined to the central nucleus of the IC. These procedures were similar to our previous reports of structure–function HRP mapping studies in the IC of unanesthetized mammals (Frisina et al., 1989, 1997; O’Neill et al., 1989).
RESULTS
A total of 131 and 165 single neurons were recorded in the IC from nine young and 13 old CBA mice. These animals participated in 56 experimental sessions, which averaged 2.5 and 2.2 sessions for young and old mice, respectively. Only neurons located in the dorsal cortex and central nucleus of the IC were included in this study. BFs and thresholds of these single units are plotted in Figure1. In young mice (open circles) thresholds ranged from −1 to 65 dB SPL, and BF ranged from 2.5 to 65 kHz. Single-unit thresholds for the old animals (filled circles) ranged from 10 to 72 dB SPL and BF ranged from 5.4 to 51 kHz. The lowest unit thresholds from young animals (dashed line) agree well with previously reported behavioral and neurophysiological measures of sensitivity for the CBA mouse (Willott, 1978; Stiebler and Ehret, 1985; Li and Borg, 1992). Comparison between the best young and best old thresholds reveals an age-related threshold shift of ∼20–30 dB across frequency, a finding that has been reported previously in both evoked potential and single-unit studies of the rodent IC (Willott, 1986; Li and Borg, 1992;Finlayson and Caspary, 1993). The spontaneous activity was measured for 13 sec in this group of units and ranged from 0 to 42 spikes/sec in young neurons and 0 to 45 spikes/sec in old neurons (Fig.2A). There was no significant age-related difference in the frequency distribution or means of spontaneous activity (Student’s independent ttest, t = 0.73; p = 0.465), and the largest difference in spontaneous rate was 10% >0–2 spikes/sec bin. The majority of neurons in both age groups had SRs less than six spikes/sec.
Fig. 1.

Distribution of BFs and thresholds for IC units in young (n = 127, open circles) and old (n = 147, filled circles) CBA mice. The dashed line represents the best fit (by eye) to the best thresholds of the young units. Although the range of BFs is similar for the two age groups, there is a clear difference of ∼20–30 dB between the best thresholds of the two ages.
Fig. 2.
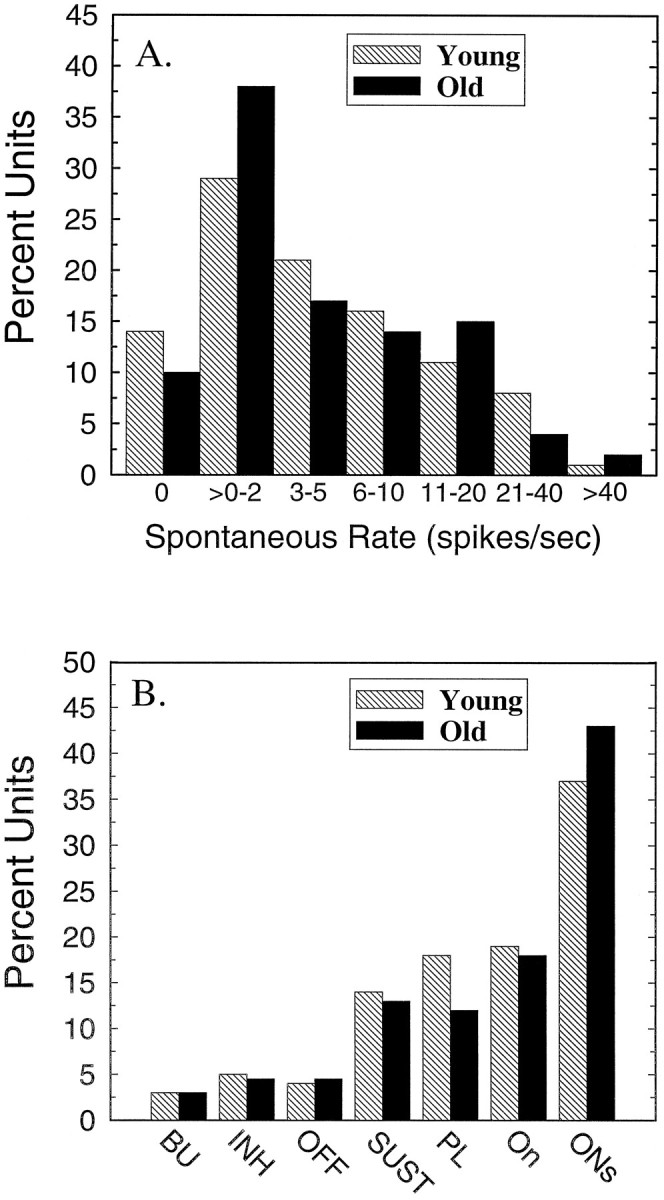
Spontaneous rates and the proportion of different temporal response patterns remains stable with age. A, Distribution of units with spontaneous rates from 0 to >40 spikes/sec from old animals (n = 147, filled bars) and young animals (n = 127,hatched bars). B, Distribution of units encountered in young (hatched bars) and old (filled bars) animals having temporal discharge patterns that corresponded to unit classifications of the present study.
Temporal response patterns
In the central auditory system (CAS) temporal response patterns are typically classified into two general categories, phasic and tonic, based on their PSTHs (Willott and Urban, 1978; Rhode et al., 1983;Willott et al., 1988; Rhode and Greenberg, 1994; Palombi and Caspary, 1996). Phasic units discharge either at stimulus onset or offset and then rapidly cease discharging, whereas tonic units tend to discharge continuously or (in the case of inhibitory neurons) cease to discharge during the duration of the acoustic signal. From this general classification scheme, eight different response types were subsequently identified and classified by their PSTH when stimulated with the control stimulus (150 msec noise bursts). The temporal response patterns included four phasic types: (1) onset (ON), which displayed only a transient response to the signal onset; (2) onset-sustained (ONs), similar to the ON type, but displaying a low-level response throughout the duration of the stimulus; (3) phasic-off (OFF), analogous to the ON, but discharging in a phasic manner only to the offset of the signal; and (4) ON–OFF, discharging phasically to both the onset and offset of the signal.
Four additional categories of tonic response types were encountered: (1) primary-like (PL), displaying a fast-adapting response at stimulus onset, followed by a strong (>20% of transient response) sustained component; (2) sustained (SUST), similar to the PL but not showing a prominent initial phasic response; (3) buildup (BU), exhibiting a long response latency after which the response strength slowly increased during the duration of the stimulus; and (4) inhibitory (INH), inverse of the SUST type, showing considerable background activity that declined during the duration of the stimulus. Figure2B shows that the frequency of occurrence of each unit type in the young and old IC was remarkably similar. Phasic neurons, primarily ON and ONs, accounted for the majority of response types encountered in the IC of both the young and old mouse. The ON and ONs categories accounted for ∼60% of the population versus only 30% for PL and SUST response types. There were very few OFF, INH, and BU units encountered in either the young or aged IC.
Temporal responses to gaps
Minimal gap thresholds were obtained for 78 units from young animals and 108 units from old animals. Complete gap series were obtained for both carrier intensities (65 dB SPL, 10 or 20 dB above MT) in 30 young units and 20 old units. In young animals, 7 of the 131 neurons recorded were unresponsive to noise bursts but responded to tones, whereas 14 of the 165 units recorded from aged mice were unresponsive to noise. Figure 3 displays examples of phasic (left column) and tonic (right column) response types tested with the gap stimulus in seven units from aged mice and one unit from a young mouse. In each PSTH the gap duration was well above the gap threshold for that particular unit. The gap response of the neuron is indicated (arrow). The ON (Fig. 3A) and ONs (Fig. 3B) units had very low background activity and discharged synchronously to both NB1 and NB2. ON–OFF (Fig. 3C) units also had low spontaneous activity but discharged to both the onset and offset of both noise bursts. When the gap width was small (Fig. 3C), the offset response to NB1 and onset response to NB2 merged. OFF units (Fig. 3D) discharged synchronously to the end of the stimulus. PL neurons (Fig.3E) discharged in a pattern similar to auditory nerve fibers (Zhang et al., 1990) responding to the silent gap with a cessation of activity (arrowhead) and then a transient increase in spike discharge (arrow). The SUST response pattern (Fig.3F) is very similar to the primary-like pattern in that response strength decreases during the gap, but it lacks the phasic increase in spikes at the beginning of the response. The temporal responses for BU units (Fig. 3G) had very long latencies, and spike counts slowly increased throughout the duration of the signal. In contrast to the above three categories, INH neurons (Fig. 3H) displayed a high level of spontaneous activity and ceased to discharge during the noise bursts. However, when gap durations exceeded the gap threshold, INH units discharged during the gap (arrow).
Fig. 3.

Neural encoding of silent gaps varied depending on the temporal response pattern of a unit. Examples of PSTHs to the gap stimulus from the eight response types encountered in the young and old CBA inferior colliculus. All examples were taken from old animals ranging in age from 24 to 28 months [except for the inhibitory unit (H) taken from a 3-month-old CBA mouse]. Additional examples of PSTHs to gaps from young animals can be found in an article by Walton et al. (1997). Phasic units include the on (A), on-sustained (B), ON–OFF (C), and OFF (D), and tonic units include primary-like (E), sustained (F), buildup (G), and inhibitory (H). The intensity of the gap stimulus was 65 dB SPL, and the silent gap was preceded by NB1 of 100 msec and followed by NB2 of 50 msec. The neural response to the gap (large arrows) varied for the different temporal response patterns. Above MGT all phasic neurons responded synchronously to both the onset of NB1 and NB2. Most tonic units fell into the PL and SUST classes, and the gap was encoded by sustained activity throughout the duration of NB1 and NB2, with complete cessation of activity at long gap durations (arrowheads). BFs for the eight units ranged from 8.5 to 33 kHz, and the noise threshold ranged from 32 to 45 dB.
The magnitude of the neural response to gap stimuli varied systematically as the gap duration increased. Figure4 displays three examples of phasic ON-type units, one from a young CBA mouse (Fig. 4A) and two from a 24-month-old CBA mouse (Fig.4B,C). Phasic units encode the silent gap by responding to the onset of NB2, and therefore the MGT is measured by an increase in firing probability time-locked to NB2. In the unit from the young mouse, driven activity in response to NB2 (arrowhead) grew rapidly for gap durations >1 msec and spike counts to NB2 approached the magnitude of the NB1 response as gap duration increased from 2 to 10 msec. Typically, phasic units from young animals had very short MGTs, and response strength approached the magnitude of the NB1 response when gap durations increased to 10 msec. These results are in agreement with previous reports describing the neural encoding of gaps in auditory cortex of bird and cat (Buchfellner et al., 1989; Eggermont, 1995).
Fig. 4.

PSTHs showing the typical age effect on neural responses to gaps for three different ON units. The top row in each column shows control (0 msec gap) responses.A, PSTHs from a gap series recorded from an ON unit in a young animal (BF, 19.1 kHz; threshold, 28 dB SPL). The unit inB is representative of those units encountered in old CBA mice (BF, 13.5 kHz; threshold, 22 dB SPL). The unit responded poorly to gaps, had an elevated gap threshold (MGT, 10 msec), and prolonged recovery to NB2. Note that the NB2 response to the 16 msec gap is substantially <50% of the response to NB1. In contrast,C shows a unit from an old animal that responds very much like the unit from the young animal (A), having an MGT (arrowhead) of 1 msec and a relatively strong gap response at all gap durations (BF, 14.5 kHz; threshold, 36 dB SPL).
Although some phasic units from old animals had similar gap-encoding characteristics as those observed in units from young animals, only 22% of phasic neurons in old mice had MGTs of <2 msec versus 57% in young animals. In addition, increases in gap duration beyond the MGT resulted in slower recovery of response magnitude in units from old mice. This is illustrated in Figure 4B, which shows a unit from an old mouse that does not respond to NB2 until the gap width reached 10 msec (arrowhead), and even at gap durations of 16 msec (6 msec above the MGT) the magnitude of the response was <50% of the NB1 response. In contrast, Figure 4C illustrates good gap-encoding capability of another unit from an aged mouse, which is similar to the unit from the young mouse, having an MGT of 1 msec (arrowhead) and displaying a rapid increase in response strength as the gap width lengthened.
An additional three phasic units from old mice displaying poor gap-encoding abilities are shown in Figure5. For two of the three neurons the MGTs exceeded 10 msec (Fig. 5A,C), and all three showed slower recovery of response strength to NB2 when compared with the NB1 response. In all three units, response strength to the gap had recovered to only 6% (Fig. 5A), 17% (Fig. 5B) and 11% (Fig. 5C) of the NB1 response for gaps of ∼10 msec.
Fig. 5.

Additional examples of gap series from three ONs units recorded from a 24-month-old CBA mouse, all displaying very poor gap-encoding ability. Gap thresholds, denoted by thearrowheads, ranged from 6 to 11 msec. Note that all three units displayed very long recovery times, when the NB2 response is compared with the NB1 response at each gap width. Recovery strength was only 22% for the 31 msec gap for the unit in A (BF, 9.8 kHz; threshold, 30 dB SPL), 43% for the 17 msec gap width for the unit in B (BF, 31.3 kHz; threshold, 38 dB SPL), and 53% for the 51 msec gap duration for the unit in C (BF, 23.8 kHz; threshold, 34 dB SPL).
Gap functions were used to characterize the response of a neuron to gap durations above and below the MGT. Gap functions were computed by plotting the number of spikes elicited by NB2 as a function of the gap duration. The shape of these functions also revealed differences among unit classifications. This is illustrated in Figure6 for two ON units (Fig.6A) and two PL units from a young mouse (Fig.6B). The driven window was adjusted to include all of the discharges evoked by NB2 for the ON units but was limited to 50 msec for the PL units (solid symbols). One can consider the response to NB1 as the unadapted or control response. The spike counts to NB1 are displayed to the right of the gap functions in each panel. ON units were characterized by very low driven activity after the initial phasic response for gap durations below the MGT. As gap duration exceeds the MGT, spike count rapidly increases. In contrast, PL units (Fig. 3E) are characterized by steady-state driven activity throughout the duration of both noise bursts. Near the MGT, one observes a small increase in spike count in response to NB2. The functions then tend to flatten out as gap duration increases. The lack of a clear change in spike count with increases in gap duration is attributable to the fact that the spike count in the driven window of the control histogram is relatively large and sets a baseline from which the neuron can signal a stimulus-related change with an increase in discharge rate. Because PL units discharge throughout the duration of the stimulus, one observes a cessation of driven activity during the quiet window between the end of NB1 and the start of NB2. The analysis of spike counts in the quiet window typically results in the lowest MGT in the majority of tonic units (Fig. 6B, open symbols). Note that in these two units the decrement in the spike counts during the quiet window approaches zero spikes by 10 msec gaps. These units demonstrate MGTs that are in the range of those obtained for PL units from young animals.
Fig. 6.

Magnitude of the neural response varies with increases in gap duration for different unit types. A, Two different ON units in which the number of spikes elicited by the onset of NB2 in the driven window is plotted against gap duration. The driven window was adjusted to include all of the discharges evoked by NB2. The spike count elicited by NB1 (control response) is shown to theright (A) and (B) denoted by the letter C. The 0 msec spike count represents the driven activity measured when a gap would have been present in the control (150 msec) stimulus. Note that the spike count rapidly increases in ON units for gap durations >1 msec and then saturates. B, Gap functions from two PL units in which spike counts were measured in both a driven window of 50 msec (filled symbols, left axis) and a quiet window set to equal the duration of the gap (open symbols, right axis). A normalized spike count of 1.0 would occur when the spike count in the control PSTH equaled the count during the gap. The nonselective profile of the driven window gap function is caused by the relatively large number of spikes in the control histogram (filled symbols), which sets the baseline from which the neuron can signal a stimulus-related change by a change in discharge rate. Spikes measured in the quiet window of PL units are shown to change rapidly as the gap duration increases.
Minimal gap thresholds
The distribution of mean MGTs as a function of age for the subcategories of phasic and tonic units is shown in Figure7. With the exception of the OFF units, the mean MGTs are longer in aged CBAs, regardless of response type. In young mice ON, ONs, ON–OFF, PL, and BU units generally had shorter MGTs than INH, SUST, and OFF units. In old mice the longest mean gap thresholds were found for INH, SUST, and BU units in increasing order. Mean gap thresholds for the remaining unit types were within 1–2 msec of the young mean. The large difference between the mean MGTs in the OFF category may be related to the relatively low sample size (n = 3, young; n = 7, old).
Fig. 7.

Frequency distribution of mean MGTs plotted as a function of response type for the 108 gap series of units from young animals and 131 series from old animals. Note that the mean MGTs are generally longer for units from the old animals compared with young, regardless of response type (except for the OFF class). The total numbers of units in which gap series were obtained in both young and old mice were ONs, n = 107; ON,n = 31; ON–OFF, n = 15; OFF,n = 17; PL, n = 20; SUST,n = 31; INH, n = 13; and BU,n = 5.
The main age-related finding with respect to changes in neural gap detection is illustrated in Figure 8, which compares the frequency distribution of MGTs for all units as a function of age. It is clear from this distribution that although the smallest MGTs (1 msec) were observed in units from both young and old animals, the frequency of occurrence of 1 msec MGTs was much lower in old CBAs. That is, 50% fewer neurons that had MGTs <2 msec were encountered in the IC of old CBA mice. This was true regardless of the presentation level of the gap carrier. Furthermore, the proportion of IC units with longer MGTs is greater in the aged mouse (Student’st test, t = 2.65; p = 0.008).
Fig. 8.

Proportion of units having MGTs ranging from 1 to >11 msec for the young (hatched bars,n = 78) and old (filled bars,n = 108) mice. Note that the distribution favors considerably higher gap thresholds for the units from old animals.
Gap recovery functions
To characterize the neural response to gaps varying in duration, gap recovery functions were computed. This was accomplished by using the NB1 response as the control for each gap width and then computing the change in response strength to NB2, for which 100% indicates that the number of discharges to NB1 was equal to NB2. Because phasic units accounted for the majority of response types encountered in the IC in both age groups, and these units also tended to have the shortest MGTs, gap functions were computed for a sample of ON and ONs units in each age group (Fig. 9). The majority of units from young mice displayed very rapid recovery, with nearly every unit reaching 75% recovery (dashed line) for gaps of <10 msec. In contrast, few neurons in aged mice reached 75% recovery even at gap durations of 50 msec. In addition, the slopes of the recovery functions formed two nearly nonoverlapping distributions. The mean slope of neurons from young animals was 6.63 (SEM = 0.26), compared with 2.19 (SEM = 0.61) of units from old mice, and the distributions were significantly different (p < 0.0001, KS two-sample test). Also note that in several units from young mice the magnitude of response to NB2 far exceeds that to NB1, as represented by data points >100%. The maximum facilitation for several units exceeded 150% in young mice, but very few neurons in old mice showed any facilitation whatsoever.
Fig. 9.

Neural recovery functions plotted for 30 phasic units (ON and ONs types only) in young (top panel) and old (bottom panel) animals. Neural recovery was quantified by computing the number of spikes elicited by NB2 divided by the spike count to NB1 × 100. This was done for every histogram in the gap series. A recovery value of 100% would represent equal discharges to both NB1 and NB2.Dashed horizontal lines represent 75% recovery. Recovery to the 75% criterion is complete by ≤10–15 msec in nearly every neuron from the young animals, whereas most neurons from old animals do not reach this criterion for any of the gap durations tested. Note also that many neurons from young animals show facilitation; e.g., the response to NB2 is greater than NB1 for certain gap durations.
Response latency
Another metric of neural temporal resolution is the mean latency to the first elicited spike for each stimulus presentation. This was computed for the control gap stimulus and is plotted as a function of BF in Figure 10. Response latency for units from young animals (top) declines with increases in BF. In contrast, in units from aged mice (bottom) the dependence of mean first spike latency on BF is much less apparent, although the distributions of first spike latencies are similar (KS two-sample test, p > 0.05). Furthermore, note that the gradient of shortest response latencies across BF is readily apparent in units from young animals (Fig. 10, top, dotted line). The shortest latencies are associated with the highest BFs. This gradient is absent in the unit distribution for the old mice; short first spike latencies occur for both low (<10 kHz) and high BF units. One other metric of response latency was analyzed and remained stable with age. Previous reports indicate that variance in first spike latency from IC units should increase with the mean first spike latency (Langner and Schreiner, 1988). Our data indicates that this relationship holds true for units from both young (r2 = 0.35;p < 0.001) and old (r2 = 0.52; p < 0.001) neurons.
Fig. 10.
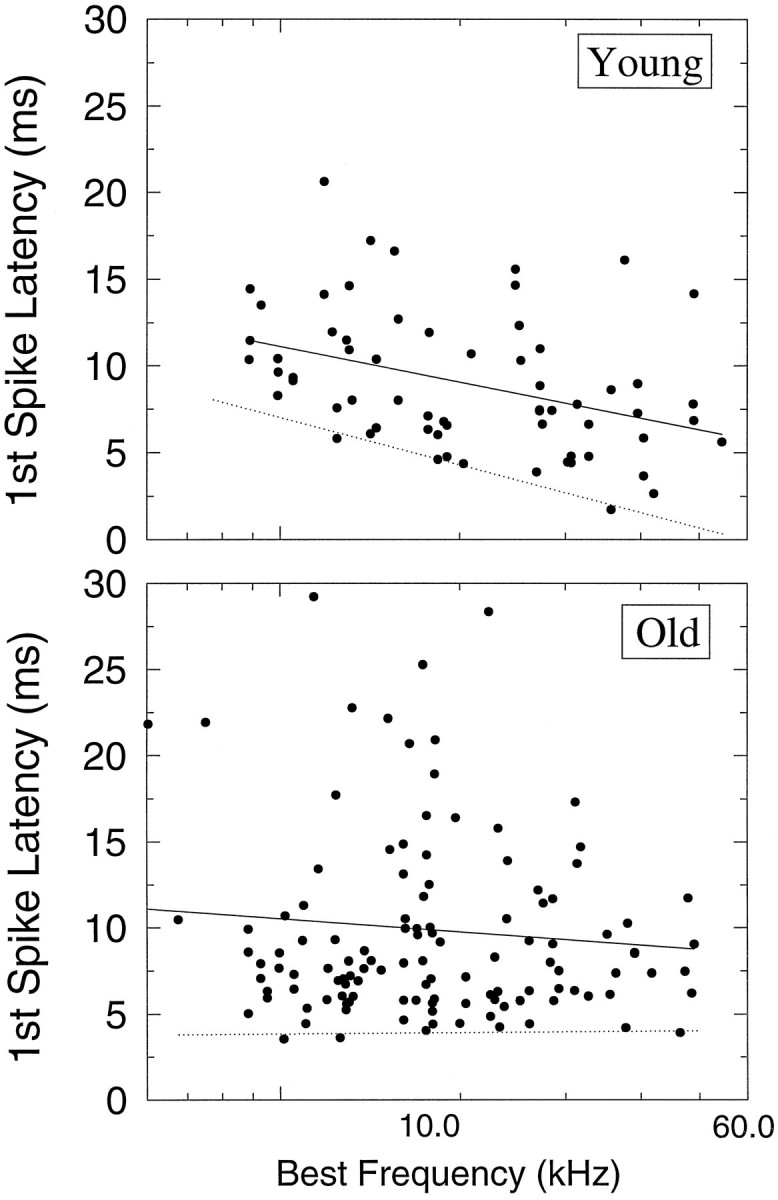
Mean first spike latency distributions and regression analyses plotted as a function of BF for young (top) and old (bottom) units. All response latency measures were derived from noise bursts presented at 65 dB SPL. To measure only spikes evoked by the signal, the analysis period was restricted to the first 25 msec after response onset, as measured from the PSTHs of a unit, for phasic units (ON, ONs, and ON–OFF) and 50 msec for tonic units (PL and SUST). Response latencies ranged from 3 to 22 msec in the young distribution and from 3.3 to 28 msec in the old distribution. Acoustic delays were subtracted from the raw latency values using a linear regression used to fit the data (solid line). The dotted line (fit by eye) highlights the gradient of shortest first spike latencies in both young and old distributions.
DISCUSSION
Effects of age on basic response properties
This study was motivated by the desire to discover, in the mouse auditory midbrain, neurophysiological correlates of age-related temporal processing deficits described in elderly human listeners (Schneider et al., 1994; Snell, 1997). With regard to basic single-unit response properties, we found that only minimum thresholds showed a significant elevation in sensitivity, with a mean difference of 32 dB. This finding is likely to reflect the magnitude of the peripheral deficit previously reported (Willott et al., 1988; Schmiedt et al., 1990, 1996; Li and Borg, 1994; Palombi and Caspary, 1996). However, other single-unit response features appeared to remain stable with age in the current study. Spontaneous rates and the distribution of temporal discharge patterns did not differ in units from young and old animals. These results are consistent with previous studies in the CBA mouse (Willott et al., 1988) and Fischer 344 rats (Finlayson and Caspary, 1993; Palombi and Caspary, 1996).
Age-related changes in gap encoding
Two principal findings of the present study demonstrate age-related changes in the neural processing of silent gaps. First, the number of IC neurons capable of encoding the shortest gap durations was reduced by ∼50% in old versus young mice. Whether this magnitude of neuronal decline produces parallel behavioral deficits in old mice is not yet known. However, previous studies correlating neuroanatomy with behavioral performance have shown that an age-related decrease in the number of neurons in other neural systems can be correlated to declines in behavioral performance. Stroessner-Johnson et al. (1992) found an age-related reduction of nearly 40% in the number of cholinergic neurons in the medial septal nucleus of old monkeys. A key function of these neurons is to act as regulatory gatekeepers for hippocampal input. Monkeys showing a decline in cholinergic neuron numbers were found to have deficits in a memory retrieval task measured behaviorally.
A second and more striking age-related difference was that most neurons from old mice displayed a slowing in the neural recovery from previous stimulation. Gap functions (Fig. 6A) indicate that ON units from young mice display rapid recovery and can encode gaps of varying durations by changes in response strength. In contrast, in many old neurons the gap response elicited by NB2 failed to recover to within 75% of the NB1 response even after 10 msec, whereas nearly all young phasic neurons recovered with gaps of ≤10 msec. Moreover, we found that the auditory system of young mice is not only better at detecting brief gaps compared with aged mice, but many units in young mice possess nonlinear, time-dependent facilitation that may enhance detectability of sound following gaps. The vast majority of units in old mice showed no facilitation at all. Delay-dependent facilitation has been demonstrated in studies of temporal processing in echolocating bats (Suga and O’Neill, 1979; O’Neill and Suga, 1982). At the level of the mouse IC, units showing delay-dependent facilitation are a significant minority of the sampled population, but their prevalence is comparable to that in the mustached bat IC, in which (depending on the criteria used) they make up anywhere from 14 to 31% of the population (Mittman and Wenstrup, 1995). As demonstrated in the present study, facilitation is maximal between 5 and 10 msec after NB1 offset in the mouse, comparable to the bat data (Mittman and Wenstrup, 1995). In echolocating bats, delay-dependent neurons are associated with both target ranging and feature detection of particular vocal structures in communication calls (Ohlemiller et al., 1996). It is intriguing to find that delay-dependent facilitation also occurs in a nonecholocating species like the mouse, but we are unsure at this time what role such a process plays in mouse auditory behavior.
Age-related changes in response latencies
In addition to the age-related changes in neural processing of gaps, we also found changes in the timing of the first spike in the aged mouse. In the young CBA mouse IC, the distribution of response latencies is rather broad, and a latency gradient exists along the cochleotopic (tonotopic) axis. Because the tonotopic axis runs in a dorsolateral to ventromedial direction (Stiebler and Ehret, 1985;Willott, 1986), and because first spike latency declines with best frequency, minimum latency would also be expected to decline with depth in the IC. Our results (Fig. 10A) in the mouse are in agreement with earlier reports showing an expanded latency representation in the IC of other mammals, including the rat (Horikawa and Murata, 1988), cat (Langner and Schreiner, 1988), and bat (Park and Pollak, 1993b; Haplea et al., 1994). The 20–40 msec difference in latency between the fastest and slowest neurons in the young mouse IC is much too great to be attributed to axonal path length delays in the incoming afferents. Instead, local circuitry has been implicated in prolonging the onset of the excitatory response (see below).
Interestingly, the latency gradient across frequency that was evident in young mice collapsed in old mice (Fig. 10B). This was not attributable to the lengthening of latencies in high-frequency units as one might expect but rather to the shortening of latencies in low-frequency units. The spread of latencies among neurons with similar BFs either remained unchanged or slightly expanded with age. That aging differentially affects the representation of first spike latencies (presumably) along the tonotopic axis, but not the spread of latencies within isofrequency slabs, suggests that there are at least two mechanisms influencing latency in the IC. One mechanism establishes a latency gradient for determining the shortest latencies along the tonotopic axis, and it is this factor that is affected by age. The second factor establishes a latency spread within isofrequency slabs, and this representation of response latency appears to be preserved with age.
Possible mechanisms underlying age-related changes
At least two possible age-related changes in neuronal function could account for the present findings. The interplay between excitation and inhibition is known to shape many response properties of IC neurons. Specifically, the inhibitory neurotransmitter GABA is involved in many aspects of sound processing, including intensity and latency coding (Park and Pollak, 1993b), shaping receptive fields (Park and Pollak, 1993a), binaural interactions (Gooler and Feng, 1992; Yang et al., 1994), and duration selectivity (Casseday et al., 1994).Caspary et al. (1990, 1995), Milbrandt et al. (1994), and Milbrandt and Caspary (1995) have demonstrated complex age-related declines in GABA at the receptor and cellular levels in the auditory midbrain. For example, in Fischer 344 rats there is an age-related decrease of >30% in both GABAA and GABAB immunoreactive neurons. Age-related changes in glutamic acid decarboxylase (GAD), a GABA synthesis enzyme, have also been seen in the nucleus of the lateral lemniscus and the IC but have not been observed in the cochlear nucleus of Fischer 344 rats (Gutierrez et al., 1994; Raza et al., 1994). Interestingly, an age-related decline in GAD has also been reported in human hypothalamus, hippocampus, and cerebellum (McGeer and McGeer, 1976).
If aging simply mimics the effects of blocking GABA, as one might predict from studies showing that GABA declines with age in the IC, then one might expect old neurons to speed up, resulting in shorter response latencies in the overall distribution of old mice. Instead our data suggest that minimum latencies in the low-frequency part of the IC were shorter in old mice, whereas those in the high-frequency area remained unchanged. This differential effect might reflect more subtle changes in the function of GABAergic inhibition. In bats, in which GABA distribution has been studied in detail, GABA immunoreactivity is greater in the dorsal IC than in the ventral IC, complementary to the distribution of glycine (Winer et al., 1995; Fubara et al., 1996). Furthermore, Park and Pollak (1993b) demonstrated that blocking GABAergic circuits had a greater effect on long-latency IC neurons located more dorsally than on short-latency units found ventrally. Therefore an age-related decline in GABA might explain shorter latencies in dorsally located, low-frequency neurons.
Age-related changes in calcium homeostasis have also been hypothesized to lead to cellular dysfunction in the aged brain (Khatchaturian, 1982). Intracellular Ca2+ levels are highly regulated by proteins that display high-affinity for Ca2+. Ca2+-binding proteins have been implicated as protective agents against excitotoxicity, a common neurodegenerative factor in both normal aging and many age-related neurological diseases (Iacopino and Christakos, 1990; Baimbridge et al., 1992). Abnormal Ca2+ buffering can result in high levels of intracellular Ca2+, which could result in cell injury or death (Hugon et al., 1996).
We have recently discovered age-related changes in the levels of two closely related calcium-binding proteins in the mouse IC (Zettel et al., 1997). In dorsomedial regions of the IC of the aged CBA mouse, the number of cells expressing calretinin increased with age (by >60% in the commissural nucleus), whereas those expressing calbindin declined by 22%. Any factor that alters intracellular Ca2+kinetics could affect the encoding of rapid acoustic events. In fact, several studies have reported age-related alteration in the time course of voltage-gated Ca2+ influx in aged hippocampus neurons relative to neurons from young animals (Landfield and Pitler, 1984; Landfield, 1987; Campbell et al., 1996). Moreover, nimodipine, an L-type Ca2+ channel blocker, has been shown to reverse the increased duration of afterhyperpolarizations and to promote spike discharge in aged hippocampus neurons (Disterhoft et al., 1989; Moyer et al., 1992). Perhaps prolongation of recovery times and decreased strength of response to NB2 are related to altered Ca2+ regulation in the aged IC.
In conclusion, our findings highlight age-related changes in three measures of temporal processing in the CAS and suggest that behavioral MGTs may depend on both the total number of available neurons capable of detecting short-duration gaps and on the speed at which these neurons recover excitability. It should be stressed that these age-related changes are not uniform; i.e., the temporal coding properties of a substantial portion of neurons are affected, whereas others are spared. Whatever mechanisms generate these aging effects are apparently not globally manifested across the entire IC but instead seem to act focally. Further experiments are required to examine specific age-related cellular and neural dysfunction responsible for declines in temporal resolution found in the aged IC.
Footnotes
This research was funded by Grant P01 AG09524 from the National Institutes of Health-National Institute on Aging and the International Center for Hearing and Speech Research (Rochester, NY). We acknowledge Martha Armour for graphic art support and histological analysis, Larry Moss for the data analysis software, and Dr. Kathy Barsz for many helpful discussions. We also acknowledge Alice Mees and Jonathan Byrd for their contributions in data reduction. The comments of two anonymous reviewers greatly improved this manuscript.
Correspondence should be addressed to Dr. Joseph P. Walton, Otolaryngology Division, University of Rochester Medical Center, Rochester, NY 14642-8629.
REFERENCES
- 1.Adams JC. Ascending connections to the inferior colliculus. J Comp Neurol. 1979;183:519–538. doi: 10.1002/cne.901830305. [DOI] [PubMed] [Google Scholar]
- 2.Aitkin L. The auditory brainstem. Integration and conclusions (Ottoson D, ed), pp 128–209. Springer; Berlin: 1986. [Google Scholar]
- 3.Aitkin L, Tran L, Syka J. The responses of neurons in subdivisions of the inferior colliculus of cats to tonal, noise and vocal stimuli. Exp Brain Res. 1994;98:53–64. doi: 10.1007/BF00229109. [DOI] [PubMed] [Google Scholar]
- 4.Baimbridge KG, Celio MR, Roger JH. Calcium-binding proteins in the nervous system. Trends Neurosci. 1992;15:303–307. doi: 10.1016/0166-2236(92)90081-i. [DOI] [PubMed] [Google Scholar]
- 5.Barsz K, Benson PK, Walton JP. Gap encoding by inferior collicular neurons is altered by minimal changes in signal envelope. Hear Res. 1998;115:13–26. doi: 10.1016/s0378-5955(97)00173-1. [DOI] [PubMed] [Google Scholar]
- 6.Buchfellner E, Leppelsack JJ, Klump GM, Gausler U. Gap detection in the starling (Sturnus vulgaris): II. Coding of gaps by forebrain neurons. J Comp Physiol [A] 1989;164:539–549. [Google Scholar]
- 7.Campbell LW, Hao SY, Thibault O, Blalock EM, Landfield PW. Aging changes in voltage-gated calcium currents in hippocampal CA1 neurons. J Neurosci. 1996;16:6286–6295. doi: 10.1523/JNEUROSCI.16-19-06286.1996. [DOI] [PMC free article] [PubMed] [Google Scholar]
- 8.Caspary DM, Raza A, Lawhorn Armour BA, Pippin J, Arneric SP. Immunocytochemical and neurochemical evidence for age-related loss of GABA in the inferior colliculus: implications for neural presbycusis. J Neurosci. 1990;10:2363–2372. doi: 10.1523/JNEUROSCI.10-07-02363.1990. [DOI] [PMC free article] [PubMed] [Google Scholar]
- 9.Caspary DM, Milbrandt JC, Helfert RH. Central auditory aging: GABA changes in the inferior colliculus. Exp Gerontol. 1995;30:349–360. doi: 10.1016/0531-5565(94)00052-5. [DOI] [PubMed] [Google Scholar]
- 10.Casseday JH, Ehrlich D, Covey E. Neural tuning for sound duration: role of inhibitory mechanisms in the inferior colliculus. Science. 1994;264:847–850. doi: 10.1126/science.8171341. [DOI] [PubMed] [Google Scholar]
- 11.Cobb FE, Jacobson GP, Newman CW, Kretschmer LW, Donnelly KA. Age-associated degeneration of backward masking task performance: evidence of declining temporal resolution abilities in normal listeners. Audiology. 1993;32:260–271. doi: 10.3109/00206099309072941. [DOI] [PubMed] [Google Scholar]
- 12.Corso JF. Aging sensory systems and perception. Praeger; New York: 1981. [Google Scholar]
- 13.Cranford JL, Romereim B. Precedence effect and speech understanding in elderly listeners. J Am Acad Audiol. 1992;3:405–409. [PubMed] [Google Scholar]
- 14.Cronin-Golumb A, Corkin S, Rizzo JF, Cohen J, Growdon JH, Banks KS. Visual dysfunction in Alzheimer’s disease: relation to normal aging. Ann Neurol. 1991;29:41–52. doi: 10.1002/ana.410290110. [DOI] [PubMed] [Google Scholar]
- 15.Disterhoft JF, Deyo RA, Moyer JR, Straube KT, Thompson LT. Calcium blockers and memory in the aging brain. Cardiovasc Rep Rev. 1989;10:22–28. [Google Scholar]
- 16.Dubno JR, Dirks DD, Morgan DE. Effects of age and mild hearing loss on speech recognition in noise. J Acoust Soc Am. 1984;76:87–96. doi: 10.1121/1.391011. [DOI] [PubMed] [Google Scholar]
- 17.Duquesnoy AJ. Effect of a single interfering noise or speech source upon the binaural sentence intelligibility of aged persons. J Acoust Soc Am. 1983;74:739–749. doi: 10.1121/1.389859. [DOI] [PubMed] [Google Scholar]
- 18.Eggermont JJ. Neural correlates of gap detection and auditory fusion in cat auditory cortex. NeuroReport. 1995;6:1645–1648. doi: 10.1097/00001756-199508000-00014. [DOI] [PubMed] [Google Scholar]
- 19.Finlayson PG, Caspary DM. Response properties in young and old Fischer-344 rat lateral superior olive neurons: a quantitative approach. Neurobiol Aging. 1993;14:127–139. doi: 10.1016/0197-4580(93)90088-s. [DOI] [PubMed] [Google Scholar]
- 20.Fitzgibbons PJ, Gordon-Salant S. Auditory temporal processing in elderly listeners. J Am Acad Audiol. 1996;7:183–189. [PubMed] [Google Scholar]
- 21.Frisina DR, Frisina RD. Speech recognition in noise and presbycusis: neural bases. Hear Res. 1997;22:1822–1833. doi: 10.1016/s0378-5955(97)00006-3. [DOI] [PubMed] [Google Scholar]
- 22.Frisina RD, O’Neill WE, Zettel ML. Functional organization of mustached bat inferior colliculus: II. Connections of the FM2 region. J Comp Neurol. 1989;284:85–107. doi: 10.1002/cne.902840107. [DOI] [PubMed] [Google Scholar]
- 23.Frisina RD, Walton JP, Lynch-Armour MA, Klotz D. Outputs of a functionally-characterized region of the inferior colliculus of the young adult CBA mouse model of presbycusis. J Acoust Soc Am. 1997;101:2741–2753. doi: 10.1121/1.418562. [DOI] [PubMed] [Google Scholar]
- 24.Fubara BM, Casseday JH, Covey E, Schwartz-Bloom RD. Distribution of GABAA, GABAB and glycine receptors in the central auditory system of the big brown bat, Eptesicus fuscus. J Comp Neurol. 1996;369:86–92. doi: 10.1002/(SICI)1096-9861(19960520)369:1<83::AID-CNE6>3.0.CO;2-G. [DOI] [PubMed] [Google Scholar]
- 25.Gates GA, Cooper JC, Kannel WB, Miller N. Hearing in the elderly: the Framington cohort, 1983–1985. Ear Hear. 1990;11:247–256. [PubMed] [Google Scholar]
- 26.Gelfand SA, Ross L, Miller S. Sentence reception in noise from 1 vs 2 sources: effects of aging and hearing loss. J Acoust Soc Am. 1988;83:248–256. doi: 10.1121/1.396426. [DOI] [PubMed] [Google Scholar]
- 27.Glasberg B, Moore BCJ. Psychoacoustics abilities of subjects with unilateral and bilateral cochlear hearing impairments and their relationship to the ability to understand speech. Scand Audiol Suppl. 1988;32:1–32. [PubMed] [Google Scholar]
- 28.Gooler DM, Feng AS. Temporal coding in the frog midbrain: The influence of duration and rise-fall time on the processing of complex amplitude modulated stimuli. J Neurophysiol. 1992;67:1–22. doi: 10.1152/jn.1992.67.1.1. [DOI] [PubMed] [Google Scholar]
- 29.Gordon-Salant S, Fitzgibbons PJ. Temporal factors and speech recognition performance in young and elderly listeners. J Sp Hear Res. 1993;36:1276–1285. doi: 10.1044/jshr.3606.1276. [DOI] [PubMed] [Google Scholar]
- 30.Green DM, Forrest TG. Temporal gaps in noise and sinusoids. J Acoust Soc Am. 1989;86:961–970. doi: 10.1121/1.398731. [DOI] [PubMed] [Google Scholar]
- 31.Gutierrez A, Khan ZU, Morris SJ, DeBlas AL. Age-related decrease in GABAA receptor subunits and glutamic acid decarboxylase in the rat inferior colliculus. J Neurosci. 1994;14:7469–7477. doi: 10.1523/JNEUROSCI.14-12-07469.1994. [DOI] [PMC free article] [PubMed] [Google Scholar]
- 32.Haplea S, Covey E, Casseday JH. Frequency tuning and response latencies at three levels in the brainstem of the echolocating bat, Eptesicus fuscus. J Comp Physiol [A] 1994;174:671–683. doi: 10.1007/BF00192716. [DOI] [PubMed] [Google Scholar]
- 33.Horikawa J, Murata K. Spatial distribution of response latency in the rat IC. Proc Jpn Acad. 1988;64B:181–184. [Google Scholar]
- 34.Hugon J, Hugon F, Esclaire F, Lesort M, Diop AG. The presence of calbindin in rat cortical neurons protects in vitro from oxidative stress. Brain Res. 1996;707:288–292. doi: 10.1016/0006-8993(95)01393-8. [DOI] [PubMed] [Google Scholar]
- 35.Iacopino AM, Christakos S. Specific reduction in calcium binding protein (28K calbindin-D) gene expression in aging and neurodegenerative diseases. Proc Natl Acad Sci USA. 1990;87:4078–4082. doi: 10.1073/pnas.87.11.4078. [DOI] [PMC free article] [PubMed] [Google Scholar]
- 36.Irvine DRF. The auditory brainstem: a review of the structure and function of auditory processing mechanisms. Springer; Berlin: 1986. [Google Scholar]
- 37.Jerger J, Chmiel R, Allen J. Effects of age and gender on dichotic sentence identification. Ear Hear. 1994;15:274–286. doi: 10.1097/00003446-199408000-00002. [DOI] [PubMed] [Google Scholar]
- 38.Kazee AM, Han LY, Spongr VP, Walton JP, Salvi RJ, Flood DG. Synaptic loss in the central nucleus of the inferior colliculus correlates with sensorineural hearing loss in the C57BL/6 mouse model of presbycusis. Hear Res. 1995;89:109–120. doi: 10.1016/0378-5955(95)00128-6. [DOI] [PubMed] [Google Scholar]
- 39.Khatchaturian Z. Towards theories of brain aging. In: Burrows K, editor. Handbook of studies on psychiatry and old age. Elsevier; Amsterdam: 1982. pp. 139–165. [Google Scholar]
- 40.Kim CB, Mayer MJ. Foveal flicker sensitivity in healthy aging eyes II. Cross-sectional aging trends from 18 through 77 years of age. J Opt Soc Am A. 1994;11:1958–1969. doi: 10.1364/josaa.11.001958. [DOI] [PubMed] [Google Scholar]
- 41.Landfield PW. “Increased calcium current” hypothesis of brain aging. Neurobiol Aging. 1987;8:346–347. doi: 10.1016/0197-4580(87)90074-1. [DOI] [PubMed] [Google Scholar]
- 42.Landfield PW, Pitler TA. Prolonged Ca+2-dependent afterhyperpolarizations in hippocampal neurons of aged rats. Science. 1984;226:1089–1092. doi: 10.1126/science.6494926. [DOI] [PubMed] [Google Scholar]
- 43.Langner G. Periodicity coding in the auditory system. Hear Res. 1992;60:115–142. doi: 10.1016/0378-5955(92)90015-f. [DOI] [PubMed] [Google Scholar]
- 44.Langner G, Schreiner CE. Periodicity coding in the inferior colliculus of the cat. I. Neuronal mechanisms. J Neurophysiol. 1988;60:1799–1822. doi: 10.1152/jn.1988.60.6.1799. [DOI] [PubMed] [Google Scholar]
- 45.Li H, Borg E. Influence of genotype and age on acute acoustic trauma and recovery in CBA/Ca and C57BL/6J mice. Acta Otolaryngol (Stockh) 1992;112:956–967. doi: 10.3109/00016489209137496. [DOI] [PubMed] [Google Scholar]
- 46.McFadden SL, Willott JF. Responses of inferior colliculus neurons in C57BL/6J mice with and without sensorineural hearing loss: effects of changing the azimuthal location of a continuous noise masker on responses to contralateral tones. Hear Res. 1994;78:132–148. doi: 10.1016/0378-5955(94)90019-1. [DOI] [PubMed] [Google Scholar]
- 47.McGeer PL, McGeer EG. Enzymes associated with the metabolism of catecholamines, acetylcholine and GABA in human controls and patients with Parkinson’s disease and Huntington’s chorea. J Neurochem. 1976;26:65–73. [PubMed] [Google Scholar]
- 48.Meininger V, Pol D, Derer P. The inferior colliculus of the mouse. A nissl and golgi study. Neuroscience. 1986;17:1159–1179. doi: 10.1016/0306-4522(86)90085-0. [DOI] [PubMed] [Google Scholar]
- 49.Mesulam MM. Tracing neural connections with horseradish peroxidase. Wiley; New York: 1982. [Google Scholar]
- 50.Milbrandt JC, Caspary DM. GABAA receptor modulation in the aging Fischer 344 rat inferior colliculus. Assoc Res Otolaryngol Abstr. 1995;18:33. [Google Scholar]
- 51.Milbrandt JC, Albin RL, Caspary DM. Age-related decrease in GABAB receptor binding in the Fischer 344 rat inferior colliculus. Neurobiol Aging. 1994;15:699–703. doi: 10.1016/0197-4580(94)90051-5. [DOI] [PubMed] [Google Scholar]
- 52.Mittman DH, Wenstrup JJ. Combination-sensitive neurons in the inferior colliculus. Hear Res. 1995;90:185–191. doi: 10.1016/0378-5955(95)00164-x. [DOI] [PubMed] [Google Scholar]
- 53.Moore BCJ, Peters RW, Glasberg BR. Detection of temporal gaps in sinusoids by elderly subjects with and without hearing loss. J Acoust Soc Am. 1992;92:1923–1932. doi: 10.1121/1.405240. [DOI] [PubMed] [Google Scholar]
- 54.Moyer JR, Thompson LT, Black JP, Disterhoft JF. Nimodipine increases excitability of rabbit CA1 pyramidal neurons in an age- and concentration-dependent manner. J Neurophysiol. 1992;68:2100–2108. doi: 10.1152/jn.1992.68.6.2100. [DOI] [PubMed] [Google Scholar]
- 55.Ohlemiller KK, Kanwal JS, Suga N. Facilitative responses to species-specific calls in cortical FM-FM neurons of the mustache bat. NeuroReport. 1996;7:1749–1755. doi: 10.1097/00001756-199607290-00011. [DOI] [PubMed] [Google Scholar]
- 56.Oliver DL, Huerta MF. Inferior and superior colliculi. In: Webster DB, Popper AN, Fay RR, editors. The mammalian auditory pathway. Springer; New York: 1992. pp. 168–221. [Google Scholar]
- 57.O’Neill WE, Suga N. Encoding of target range information and its representation in the auditory cortex of the mustached bat. J Neurosci. 1982;47:225–255. doi: 10.1523/JNEUROSCI.02-01-00017.1982. [DOI] [PMC free article] [PubMed] [Google Scholar]
- 58.O’Neill WE, Frisina RD, Gooler DM. Functional organization of mustached bat inferior colliculus: I. Representation of FM frequency band important for target ranging revealed by 14C-2-deoxyglucose autoradiography and single unit mapping. J Comp Neurol. 1989;284:60–84. doi: 10.1002/cne.902840106. [DOI] [PubMed] [Google Scholar]
- 59.Palombi PS, Caspary DM. Physiology of the aged Fischer 344 rat inferior colliculus: responses to contralateral monaural stimuli. J Neurophysiol. 1996;5:3114–3121. doi: 10.1152/jn.1996.76.5.3114. [DOI] [PubMed] [Google Scholar]
- 60.Park TJ, Pollak GD. GABA shapes sensitivity to interaural intensity disparities in the mustache bat’s inferior colliculus: implications for encoding sound location. J Neurosci. 1993a;13:2050–2067. doi: 10.1523/JNEUROSCI.13-05-02050.1993. [DOI] [PMC free article] [PubMed] [Google Scholar]
- 61.Park TJ, Pollak GD. GABA shapes a topographic organization of response latency in the mustache bat’s inferior colliculus. J Neurosci. 1993b;13:5172–5187. doi: 10.1523/JNEUROSCI.13-12-05172.1993. [DOI] [PMC free article] [PubMed] [Google Scholar]
- 62.Plomp R. Rate of decay of auditory sensation. J Acoust Soc Am. 1964;36:277–282. [Google Scholar]
- 63.Rapp PR, Amaral DG. Individual differences in the cognitive and neurobiological consequences of normal aging. Trends Neurosci. 1992;15:340–344. doi: 10.1016/0166-2236(92)90051-9. [DOI] [PubMed] [Google Scholar]
- 64.Raza A, Milbrandt JC, Arneric SP, Caspary DM. Age-related changes in brainstem auditory neurotransmitters: measures of GABA and acetylcholine function. Hear Res. 1994;77:61–70. doi: 10.1016/0378-5955(94)90270-4. [DOI] [PubMed] [Google Scholar]
- 65.Rees A, Møller AR. Stimulus properties influencing the responses of inferior colliculus neurons to amplitude-modulated sounds. Hear Res. 1987;27:129–143. doi: 10.1016/0378-5955(87)90014-1. [DOI] [PubMed] [Google Scholar]
- 66.Rhode WS, Greenberg S. Encoding of amplitude modulation in the cochlear nucleus of the cat. J Neurophysiol. 1994;71:1797–1825. doi: 10.1152/jn.1994.71.5.1797. [DOI] [PubMed] [Google Scholar]
- 67.Rhode WS, Oertel D, Smith PH. Physiological response properties of cells labeled intracellularly with horseradish peroxidase in cat ventral cochlear nucleus. J Comp Neurol. 1983;213:448–463. doi: 10.1002/cne.902130408. [DOI] [PubMed] [Google Scholar]
- 68.Salthouse TA. Speed of behavior and its implications for cognition. In: Birren JE, Schaie KW, editors. Handbook of the psychology of aging, Ed 2. Van Nostrand Reinhold; New York: 1985. pp. 400–426. [Google Scholar]
- 69.Schmiedt RA, Mills JH, Adams JC. Tuning and suppression in auditory nerve fibers of aged gerbils raised in quiet or noise. Hear Res. 1990;45:221–236. doi: 10.1016/0378-5955(90)90122-6. [DOI] [PubMed] [Google Scholar]
- 70.Schmiedt RA, Mills JH, Boettcher FA. Age-related loss of activity of auditory-nerve fibers. J Neurophysiol. 1996;76:2799–2803. doi: 10.1152/jn.1996.76.4.2799. [DOI] [PubMed] [Google Scholar]
- 71.Schneider BA, Pichora-Fuller MK, Kowalchuk D, Lamb M. Gap detection and the precedence effect in young and old subjects. J Acoust Soc Am. 1994;95:980–991. doi: 10.1121/1.408403. [DOI] [PubMed] [Google Scholar]
- 72.Schuknecht HF. Further observation on the pathology of presbycusis. Arch Otolaryngol. 1964;80:369–382. doi: 10.1001/archotol.1964.00750040381003. [DOI] [PubMed] [Google Scholar]
- 73.Schuller G, Radtke-Schuller S, Betz M. A stereotaxic method for small animals using experimentally determined reference profiles. J Neurosci Methods. 1986;18:339–350. doi: 10.1016/0165-0270(86)90022-1. [DOI] [PubMed] [Google Scholar]
- 74.Semple MN, Aitkin LM, Calford MB, Pettigrew JD, Phillips DP. Spatial receptive fields in the cat inferior colliculus. Hear Res. 1983;10:203–215. doi: 10.1016/0378-5955(83)90054-0. [DOI] [PubMed] [Google Scholar]
- 75.Snell KB. Age related changes in temporal gap detection. J Acoust Soc Am. 1997;101:2214–2220. doi: 10.1121/1.418205. [DOI] [PubMed] [Google Scholar]
- 76.Snell KB, Ison JR, Frisina DR. The effects of signal frequency and absolute bandwidth on gap detection in noise. J Acoust Soc Am. 1994;96:1458–1464. doi: 10.1121/1.410288. [DOI] [PubMed] [Google Scholar]
- 77.Stiebler I, Ehret G. Inferior colliculus of the house mouse. I. A quantitative study of tonotopic organization, frequency representation and tone-threshold distribution. J Comp Neurol. 1985;238:65–76. doi: 10.1002/cne.902380106. [DOI] [PubMed] [Google Scholar]
- 78.Stroessner-Johnson HM, Rapp PR, Amaral DG. Cholinergic cell loss and hypertrophy in the medial septal nucleus of the behaviorally characterized aged rhesus monkey. J Neurosci. 1992;12:1936–1944. doi: 10.1523/JNEUROSCI.12-05-01936.1992. [DOI] [PMC free article] [PubMed] [Google Scholar]
- 79.Suga N, O’Neill WE. Neural axis representing target range in the auditory cortex of the mustached bat. Science. 1979;206:351–353. doi: 10.1126/science.482944. [DOI] [PubMed] [Google Scholar]
- 80.Walton JP, Frisina RD, Ison JR, O’Neill WE. Neural correlates of behavioral gap detection in the inferior colliculus of the young CBA mouse. J Comp Physiol [A] 1997;181:161–176. doi: 10.1007/s003590050103. [DOI] [PubMed] [Google Scholar]
- 81.White L, Kohout F, Evans D, Cornoni-Huntley J, Ostfeld A (1985) Established populations for epidemiologic studies of the elderly. Physical functioning. (Cornoni-Huntley J, ed), pp 129–165. Bethesda, MD: National Institute on Aging. [DOI] [PubMed]
- 82.Willard FJ, Ryugo DK. Anatomy of the central auditory system. In: Willott JF, editor. The auditory psychobiology of the mouse. Thomas; Springfield, IL: 1983. pp. 201–304. [Google Scholar]
- 83.Willott JF. Effects of aging, hearing loss and anatomical location on thresholds of inferior colliculus neurons in C57BL/6 and CBA mice. J Neurophysiol. 1986;56:391–408. doi: 10.1152/jn.1986.56.2.391. [DOI] [PubMed] [Google Scholar]
- 84.Willott JF, Urban GP. Response properties of neurons in the nuclei of the mouse inferior colliculus. J Comp Physiol. 1978;127:175–184. [Google Scholar]
- 85.Willott JF, Parham K, Hunter KP. Response properties of inferior colliculus neurons in young and old CBA/J mice. Hear Res. 1988;37:1–14. doi: 10.1016/0378-5955(88)90073-1. [DOI] [PubMed] [Google Scholar]
- 86.Willott JR. Aging and the auditory system: anatomy, physiology, and psychophysics. Singular; San Diego: 1991. [Google Scholar]
- 87.Winer JA, LaRue DT, Pollak GD. GABA and glycine in the central auditory system of the mustache bat: structural substrates for inhibitory neuronal organization. J Comp Neurol. 1995;355:317–353. doi: 10.1002/cne.903550302. [DOI] [PubMed] [Google Scholar]
- 88.Yang L, Pollak GD, Resler C. GABAergic circuits sharpen tuning curves and modify response properties in the mustached bat inferior colliculus. J Neurophysiol. 1994;68:1760–1774. doi: 10.1152/jn.1992.68.5.1760. [DOI] [PubMed] [Google Scholar]
- 89.Zettel ML, Frisina RD, Haider S, O’Neill WE. Age-related changes in calbindin D28k and calretinin immunoreactivity in the inferior colliculus of the CBA/CaJ and C57Bl/6 mouse. J Comp Neurol. 1997;386:92–110. doi: 10.1002/(sici)1096-9861(19970915)386:1<92::aid-cne9>3.0.co;2-8. [DOI] [PubMed] [Google Scholar]
- 90.Zhang W, Salvi RJ, Saunders SS. Neural correlates of gap detection in auditory nerve fibers of the chinchilla. Hear Res. 1990;46:181–200. doi: 10.1016/0378-5955(90)90001-6. [DOI] [PubMed] [Google Scholar]