

Abstract
The honeybee (Apis mellifera) visual system contains three classes of retinal photoreceptor cells that are maximally sensitive to light at 440 nm (blue), 350 nm (ultraviolet), and 540 nm (green). We performed a PCR-based screen to identify the genes encoding the Apis blue- and ultraviolet (UV)-sensitive opsins. We obtained cDNAs that encode proteins having a high degree of sequence and structural similarity to other invertebrate and vertebrate visual pigments. The Apis blue opsin cDNA encodes a protein of 377 amino acids that is most closely related to other invertebrate visual pigments that are thought to be blue-sensitive. The UV opsin cDNA encodes a protein of 371 amino acids that is most closely related to the UV-sensitive Drosophila Rh3 and Rh4 opsins. To test whether these novel Apis opsin genes encode functional visual pigments and to determine their spectral properties, we expressed them in the R1–6 photoreceptor cells of blindninaE mutant Drosophila, which lack the major opsin of the fly compound eye. We found that the expression of either the Apis blue- or UV-sensitive opsin in transgenic flies rescued the visual defect of ninaEmutants, indicating that both genes encode functional visual pigments. Spectral sensitivity measurements of these flies demonstrated that the blue and UV visual pigments are maximally sensitive to light at 439 and 353 nm, respectively. These maxima are in excellent agreement with those determined previously by single-cell recordings fromApis photoreceptor cells and provide definitive evidence that the genes described here encode visual pigments having blue and UV sensitivity.
Keywords: Apis mellifera, honeybee, visual pigment, spectral tuning, ultraviolet-sensitive opsin, blue-sensitive opsin, electroretinogram, protein expression, Drosophila melanogaster
Color vision is one of the most familiar forms of stimulus discrimination. The ability of an organism to discriminate differences in wavelength distribution within the environment and to use this information to direct its behavior enables it to select food sources, avoid unsafe environments and predators, and identify conspecifics and potential mating partners. With the exception of the use of oil droplets or screening pigments in some photoreceptor cells, color vision is dependent on the expression of spectrally distinct visual pigments in different classes of photoreceptor cells (Jacobs, 1981; Hardie, 1985; Nathans et al., 1986a,b; Nathans, 1992).
Rhodopsin is the light-sensitive visual pigment of the eye. It is composed of an opsin apoprotein and a Vitamin A-derived chromophore, usually 11-cis-retinal. The chromophore is covalently attached to a Lys residue in the seventh transmembrane domain of the opsin apoprotein by way of a Schiff’s base linkage (Bownds, 1967; Wang et al., 1980). The spectral sensitivity of rhodopsin is thought to result from specific interactions between the amino acid side chains of the transmembrane α-helices and the chromophore (Sakmar et al., 1989,1991; Zhukovsky and Oprian, 1989; Nathans, 1990a,b; Neitz et al., 1991;Chan et al., 1992; Merbs and Nathans, 1992a,b). Light absorption induces the isomerization of the 11–12 double bond of the retinal chromophore from the cis to the transconfiguration. This leads to the formation of the active form metarhodopsin that directly couples to and activates the heterotrimeric G-protein transducin in vertebrates, or a Gqin invertebrates, that ultimately generates a neural signal (for review, see Yarfitz and Hurley, 1994; Zuker, 1996).
The honeybee (Apis mellifera) has a highly developed trichromatic visual system and has been shown to use color discrimination while foraging on flowers and homing to the hive (for review, see Menzel and Muller, 1996). The compound eye of the honeybee worker is composed of 5000–6000 ommatidia or unit eyes, each of which contains nine photoreceptor cells (Skrzipek and Skrzipek, 1974;Waterman, 1981). Intracellular recordings have demonstrated that theApis retina contains three major classes of photoreceptor cells having maximal sensitivities at ∼350, 440, and 540 nm (Menzel and Blakers, 1976; Menzel et al., 1986). Recently the cDNA encoding the honeybee putative green-sensitive visual pigment was cloned and characterized (Chang et al., 1996). The spectral sensitivity of the gene product was inferred from its sequence similarity to other long-wavelength rhodopsins. Similarly, a putative bee UV opsin gene was recently identified (Bellingham et al., 1997), although, as we will demonstrate below, this gene actually encodes the blue-sensitive bee opsin. Because honeybees have been extensively studied as a model system for insect color vision and are known to express visual pigments with unique spectral and photochemical properties (Bertrand et al., 1979; Muri and Jones, 1983; Menzel, 1989), the cloning and characterization of the remaining opsin genes from this organism would contribute to our understanding of the relationship between visual pigment structure and spectral sensitivity, in an animal the behavior of which is well known.
MATERIALS AND METHODS
Cloning of the honeybee blue- and UV-sensitive opsin genes. Total RNA was isolated from Apis melliferaheads, using a Trizol preparation (Life Technologies, Gaithersburg, MD), and then converted to first strand cDNA (Superscript reverse transcriptase; Life Technologies). Opsin-like sequences were amplified by PCR using degenerate primers directed against conserved regions of invertebrate visual pigments, as described previously (Chang et al., 1996). PCR products were directly cloned into the PCR II vector (Invitrogen, San Diego, CA), and inserts of the appropriate size were sequenced (Chang et al., 1996). Inserts from clones that showed a high similarity at the amino acid level to previously cloned invertebrate opsins were used as probes to perform an initial screen of 500,000 clones of a bee eye cDNA library in the λgt22A vector (Stratagene, La Jolla, CA). Hybridization with a random-primed probe (Amersham, Arlington Heights, IL) was performed at 55 or 60°C overnight in hybridization buffer (Church and Gilbert, 1984). The filters were washed twice rapidly at room temperature in 6× SSC and 0.1% SDS, followed by two 10 min washes at 55 or 60°C with the same buffer. To purify positive plaques, we performed additional screens using the same probe and conditions. The sizes of the cDNA inserts were determined by PCR with the λgt11 forward and reverse primers using phage eluted from single plugs in suspension media (50 mm Tris-HCl, pH 7.5, 100 mm NaCl, 20 mmMgCl2, and 0.01% gelatin) as the template. Phage DNA was purified from 50 ml of culture (Qiagen, Hilden, Germany), and the cDNAs were subcloned into pBluescript II KS(−) (Stratagene). cDNAs were fully sequenced twice on both strands using the dideoxy chain-termination technique (Sequenase-Amersham).
Northern analysis. For each sample, 5 μg of poly(A+) RNA was fractionated in an agarose formaldehyde gel. The gel was transferred to a nylon membrane and treated as described previously (Chou et al., 1996). The full-length blue and UV opsin cDNAs were used as probes, and the filters were also probed with a 460 bp BclI mitochondrial DNA (mtDNA) fragment of the cytochrome oxidase subunit I gene as a loading control (Crozier et al., 1989). The membranes were exposed to film or analyzed with a Molecular Dynamics 425S PhosphorImager (Sunnyvale, CA).
Ectopic expression of the honeybee blue and UV opsins. For the ectopic expression of the honeybee visual pigments in the R1–6 photoreceptor cells of the Drosophila retina, theApis cDNAs were cloned into an expression cassette containing the Drosophila ninaE promoter and 3′-untranslated sequences. Specifically, the expression cassette contained 2.5 kb of promoter sequences, 33 bp of the 5′-untranslated region, a short polylinker, and 650 bp from the 3′-end that includes the ninaE polyadenylation signal (Zuker et al., 1985). For the expression of the honeybee blue opsin, a 1.3 kb SspI toEcoR V fragment containing the complete open reading frame was inserted into the expression cassette. For the honeybee UV opsin, a 1.1 kb EcoR V to NotI (introduced by PCR) fragment containing the complete open reading frame and 46 bp 3′ to the stop codon was inserted into the expression cassette. In both cases the endogenous Apis polyadenylation signals were deleted. The structures of the constructs were confirmed by restriction endonuclease analysis, and the nucleotide sequence of the fragment junctions and any regions derived from PCR were also confirmed.
The blue and UV opsin gene expression constructs were subcloned into the SacI and XhoI sites of the y+-marked P-element vector “C4” and were injected into y w; sr ninaE17 mutant embryos, as described previously (Chou et al., 1996). Multiple independent P-element-mediated germline transformants were obtained using standard techniques (Karess and Rubin, 1984). Five homozygous lines containing P[Rh1 + bee blue] on the X (line 74), second (lines 175 and 192), and third (lines 86 and 166) chromosomes were retained. Six lines of flies that contained P[Rh1 + bee UV] on the X (line 16), second (lines 130 and 162), and third (lines 16, 89, and 90) chromosomes were also retained. All fly strains were maintained in humidified incubators on 12 hr light/dark cycles on standard cornmeal, molasses, yeast extract, and agar media. Genetic nomenclature used in the text is as indicated (Lindsley and Zimm, 1992;FlyBase, 1997).
Electrophysiology. Electroretinogram recordings were performed on immobilized white-eyed (w) flies, using electrodes filled with normal saline (0.9% NaCl, w/v) as described previously (Chou et al., 1996). Interference bandpass filters were used to select specific wavelength ranges for light stimulation [Oriel Corporation, Stratford, CT; filter 53400 (350 nm), 53815 (430 nm), and 53845 (470 nm)]. Light intensity was measured for different combinations of bandpass and neutral density filters using a calibrated silicon photodiode (EG&G Gamma Scientific, San Diego, CA; model 550).
Spectral sensitivity measurements were performed using the voltage-clamp method of Franceschini (Franceschini, 1979, 1984). We used a modification of a spectral scanning instrument developed by Kirschfeld and Feiler (described in Kirschfeld et al., 1988) in which the area of the ERG signal was “clamped” to a criterion response by adjusting the light intensity, while the wavelength of stimulating light was varied. The fly was completely immobilized in a humidified chamber that was optically and electrically isolated. The electroretinogram in response to a flickering stimulus (10 Hz) was recorded with electrodes placed at the surface of both eyes. The fly was positioned so that only one eye received the light stimulus. The placement of the ground electrode on the opposing (unstimulated) eye served to round the electrical response, producing a signal that lacked on and off transients. The light source was a 75 W xenon arc lamp with a stabilized DC power supply (Leitz/Leica, Wetzlar/Nussloch, Germany). The intensity of the stimulating light was varied by positioning (incrementally rotating) a quartz neutral density (radial) wedge filter [optical density (OD), 0–3] in the stimulating-beam path. The optical density of the filter (at the multiple wavelengths tested) was linear with respect to position, and these calibration data were used to determine the attenuation factor.
During an experiment, as the monochromator (an Oriel 1/4 meter VIS-NIR; model 77202 with 77233 grating having 1200 lines/mm) was stepped through a scan, a computer program integrated the area of the ERG response to three pulses of light (during 0.3 sec), compared this with a setpoint, and adjusted the position of the neutral density filter to compensate for the error. A set point was selected that would allow a scan to be performed within the linear range of the neutral density wheel and that was at sufficiently low light intensity that the response of the fly was ∼5 mV. This allowed the usage of light levels that were well above threshold but below the level of adaptation. Measurements were started by scanning from 300 to 600 nm, pausing briefly to allow the computer to reestablish the setpoint, and then returning to 300 nm, using a scan rate of 0.5–1 nm/sec.
During operation, the setpoint was maintained using a proportional-integral-derivative (PID) algorithm (Corripio, 1990). The value of the setpoint, proportional, integral, and derivative bands were determined empirically and adjusted to produce reproducible forward and reverse scans, with a minimum of hysteresis. The area of the ERG response, the wavelength of light, and the position of the neutral density filter were captured on-line. The instrument was controlled, and data were acquired, by a Power Macintosh computer (Apple Computer, Inc., Cupertino, CA) equipped with a National Instruments (Austin, TX) PCI-MIO-16XE-50 multi-function input/output board running LabView software.
Spectral sensitivity (SS) was defined as the reciprocal of the photon flux required to produce a criterion response (maintain the setpoint), taking into account the intensity and wavelength of simulating light [i.e., SS ∝ 1/(light intensity × wavelength)]. Sensitivity data were normalized to a relative sensitivity of 1.0 at the wavelength of maximal sensitivity. The intensity of the stimulating light at each wavelength was calculated based on a reference scan of the lamp, using a calibrated silicon photodiode (EG&G Gamma Scientific; model 550) attenuated by the optical density of the neutral density wheel at the specific position used during an individual scan. The monochromator was calibrated using an Oriel 6025 Hg (Ar) calibration lamp with spectral lines at 312.6, 365.0, 404.7, 435.8, 546.7, 577.0, and 579.1 nm. Monochromator error was within the level of resolution of the instrument, over the wavelength range from 300 to 600 nm (± 1.0 nm at a slit width of 280 μm).
RESULTS
Isolation of two novel Apis opsin genes
To isolate novel opsin genes from the honeybee Apis mellifera, we performed a reverse transcription-PCR (RT-PCR) screen of Apis head first-strand cDNA using degenerate oligonucleotide primers recognizing conserved regions of the known invertebrate opsins. Sequencing of these amplified transcripts led to the identification of two products that had a high degree of sequence similarity to other invertebrate opsins. One of the products, a 606 bp fragment, was designated the bee blue opsin fragment, and the other, a 310 bp fragment, was designated the bee UV opsin fragment. These fragments were used to screen an Apis mellifera eye cDNA library at moderate stringency to obtain full-length cDNA clones. Nine positive plaques that strongly hybridized to the bee blue probe and thirty-one positive plaques that hybridized to the bee UV probe were identified and purified. The three longest clones for each opsin were subcloned, and their 3′- and 5′-ends were sequenced. One blue opsin cDNA (blue 1–1a) and one UV opsin cDNA (UV 7–1) were completely characterized.
The nucleotide and deduced amino acid sequences of the Apis mellifera blue- and UV-sensitive opsins are shown in Figure1, left and right, respectively. The cloned cDNAs for the bee blue and UV opsins are 1757 and 1448 bp in length, respectively. Both cDNAs contain a single major open reading frame that encodes a protein of 377 amino acids [molecular weight (MW) = 43 kDa] or 371 amino acids (M = 41 kDa) for the blue and UV opsins, respectively. The putative translation initiation sequence at the first Met for each gene differs from the CC(A/G)CCAUGG consensus but maintains a CG at −4 and −3 nucleotides from the AUG for the UV opsin and maintains a CCG from −5 to −3 nucleotides for the blue opsin gene (Kozak, 1991). The blue opsin cDNA contained 377 bp of 5′-untranslated region with an in-frame stop codon 48 bp 5′ to the first AUG and 236 bp of 3′-untranslated sequence. The 5′- and 3′-untranslated regions of the UV cDNA were 36 and 280 bp long, respectively. There were no in- or out-of-frame stop codons in the 5′-untranslated region of the UV cDNA, and no additional 5′-sequence was obtained for this gene using 5′-RACE (data not shown). The bee blue and UV opsin genes are transcribed as 2.2 and 1.7 kb mRNAs, respectively (Fig. 2). These transcripts are present in the heads but not in the bodies ofApis adults, as would be expected for the expression pattern of a visual pigment.
Fig. 1.
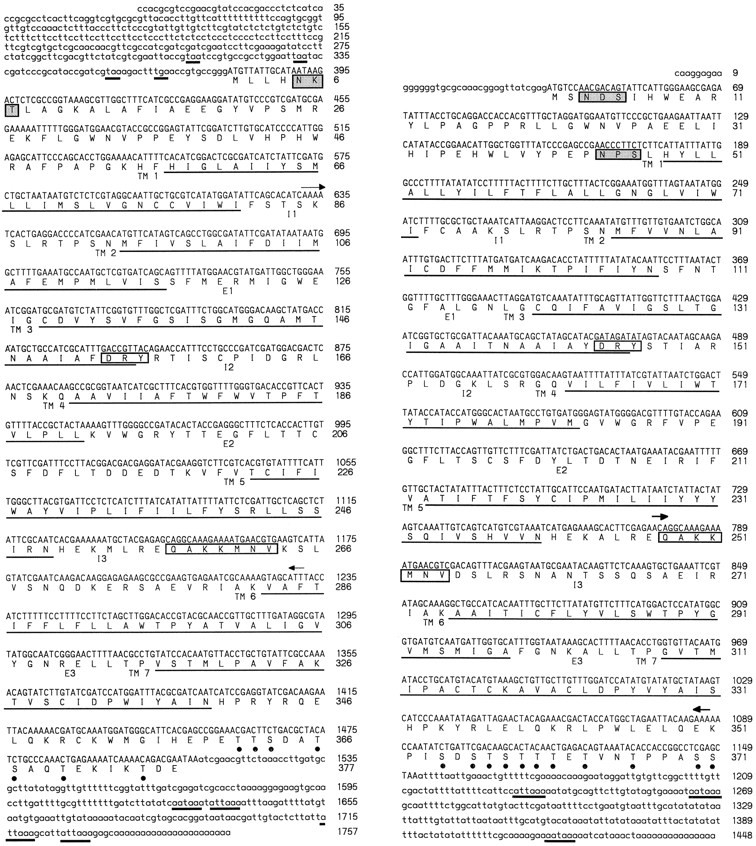
Nucleotide sequences and deduced amino acid sequences of the Apis blue-sensitive (left) and UV-sensitive (right) opsins. Nucleotides are numbered in the 5′- to 3′-direction. The deduced amino acid sequences are shown below the nucleotide sequences in single letter code. A single major open reading frame of 1131 bp is present in the blue opsin cDNA encoding a protein of 377 amino acids. The UV opsin major open reading frame is 1113 bp long and encodes a protein of 371 amino acids. Seven potential transmembrane (TM) domains areunderlined (Kyte and Doolittle, 1982). The stop codons in the 5′-untranslated region and the putative polyadenylation signals upstream of the polymeric dA tract in the 3′-untranslated region are also underlined (thick lines). The blue opsin cDNA contains four putative polyadenylation signals beginning at nucleotides 1627, 1634, 1714, and 1726. The AUUAAA polyadenylation signal is the most common variant of the AAUAAA polyadenylation signal (Swimmer and Shenk, 1985). The 3′-untranslated region of the UV cDNA has polyadenylation signals beginning at nucleotides 1231, 1264, and 1417. There are three additional out-of-frame stop codons in the 5′-untranslated region of the blue opsin cDNA. Potential sequences for G-protein binding sites, DRY and QAKKMNV, as mentioned in the Results, are indicated by open boxes. Potential glycosylation sites in the N terminals are indicated by shaded boxes. Possible Ser and Thr phosphorylation sites are indicated bysolid circles. The intracellular (I) and extracellular (E) loops are indicated below the amino acid sequence. The original 606 bp blue opsin fragment identified by PCR from nucleotides 627 to 1232 is indicated between thearrows. The 310 bp fragment identified by PCR from nucleotide 777 to 1086 for the UV gene is indicated similarly.
Fig. 2.

Expression of the Apis blue- and UV-sensitive opsin genes. Northern analysis using theApis blue 1–1A and UV 7–1 cDNAs as probes revealed that the genes are transcribed as 2.2 and 1.7 kb mRNAs, respectively. These transcripts were present in the heads (H) but not in the bodies (B) of adult bees. The lower boxshows the same filter probed with a 460 bp fragment of the honeybee cytochrome C oxidase subunit 1 gene and demonstrates that mRNA is present in the samples prepared from both bee heads and bodies. The size of the polycistronic transcript that contains the control probe sequence is 1.9 kb. Size markers in kb are shown on theleft.
Similarity between the blue- and UV-sensitive honeybee opsins and other invertebrate visual pigments
Comparison of the deduced amino acid sequences of these clones demonstrated that they have a high degree of sequence similarity to previously identified invertebrate opsins. In addition, a search of the databases revealed that the gene that we have designated as the bee blue opsin was recently identified independently by another group as the UV-sensitive visual pigment (Bellingham et al., 1997; GenBank accession number U70841). The gene that we have cloned contains an additional 137 bp of 5′-untranslated region and is ∼99% identical to the previously cloned gene at the nucleotide level. The nucleotide differences (based on our numbering scheme) between our sequence and the recently reported one are 218 C/T, 398 T/C, 505 A/G, 722 C/A, 1052 C/T, 1070 T/A, 1226 A/G, 1298 T/C, and 1598 T/C. These sequence differences may result from PCR errors, sequencing errors, or polymorphisms between the honeybee populations of the United Kingdom and the United States. Only one of these differences (505 A/G) results in an amino acid substitution (43 His/Arg). In addition, four bases (nucleotides 1623–1626) are absent from the 3′-untranslated region of the previously cloned gene.
Amino acid sequence comparison (Higgins and Sharp, 1989) and alignment of the bee blue and UV opsins revealed that they are closely related to other known arthropod opsins and are most similar to those pigments thought to have similar spectral sensitivities. The bee blue opsin is 59% similar to the locust 2 opsin (Towner et al., 1997), 48% similar to D. melanogaster Rh5 (Chou et al., 1996; Papatsenko et al., 1997), and only 32% similar to either the bee long-wavelength opsin (Chang et al., 1996) or the recently cloned D. melanogaster Rh6 opsin (Huber et al., 1997). As shown in the phylogenetic tree in Figure 3 (see figure legend for methods), the members of this group of “blue”-sensitive pigments are more closely related to each other than they are to the next most closely related group of pigments, the UV-sensitive opsins. Although there is some evidence based on the expression pattern of theDrosophila Rh5 opsin and physiological analyses of larger flies (Calliphora and Musca) that Rh5 encodes a visual pigment having a maximal sensitivity near 440 nm (Smola and Meffert, 1979; Hardie and Kirschfeld, 1983; Chou et al., 1996;Papatsenko et al., 1997), none of the cloned blue-sensitive visual pigments have been expressed and directly characterized.
Fig. 3.

Phylogenetic relationships between theApis blue- and UV-sensitive opsins and other known visual pigments. The Apis blue- and UV-sensitive opsins fall into two different groups that are thought to be sensitive to blue and UV light, respectively. The blue-sensitive group includes the recently identified Locust 2 and Drosophila Rh5, whereas the UV-sensitive group includes the known UV-sensitive Drosophila Rh3 and Rh4pigments. The relative position of the putative Apisgreen-sensitive opsin is indicated with an arrow. This tree highlights that, although these pigments have been identified in highly divergent species, they are nonetheless most closely related to visual pigments from other organisms believed to have similar spectral properties. Amino acid sequences were aligned using the program ClustalW (Thompson et al., 1994). The regions of the alignment corresponding to amino acids 27–361 of the bee blue and amino acids 18–353 of the bee UV opsin were used for the analysis. Thirty-four residues of the alignment at the N terminal and 141 residues at the C terminal (including the Pro-rich repeats in the cephalopod opsins) were excluded from the analysis because of possible alignment ambiguities arising from substantial differences in sequence length (although including the terminals in the phylogenetic analysis did not significantly alter tree topology). Two types of phylogenetic analysis were used: maximum parsimony (Swofford, 1991) and neighbor-joining (Saitou and Nei, 1987). Both were performed using PAUP* 4.0 running on a Power personal computer (test versions kindly provided by D. L. Swofford). Robustness of the results was assessed using bootstrap analysis (Felsenstein, 1985). One hundred bootstrap replications, with five random additions each, were done using unweighted parsimony. One hundred bootstrap replications were done using neighbor-joining, with tree-bisection reconnection branch swapping to ensure finding the shortest tree. The results of these two analyses were in agreement, although levels of support for particular nodes differed. The tree was rooted using vertebrate opsin sequences (data not shown). Nodes with bootstrap values below 65 for both analyses were collapsed. Bootstrap values are shown above each node (parsimony/neighbor-joining). Abbreviations and GenBank accession numbers for the sequences used in the construction of the tree are as follows: Apis mellifera (Bee blue, AF004168; Bee UV, AF004169; Bee green, U26026); Camponotus abdominalis(Ant 1, U32502); Cataglyphis bombycina(Ant 2, U32501); Drosophila melanogaster(Dm Rh1, P06002; Dm Rh2, P08099;Dm Rh3, P04950; Dm Rh4, P29404; Dm Rh5, U67905; Dm Rh6, Z86118); Hemigrapsus sanguineus (Crab 1, D50583; Crab 2, D50584); Limulus polyphemus (lateral eye opsin Horse-shoe crab 1, L03781; ocellar opsinHorseshoe crab 2, L03782); Loligo forbesi (Squid 1, X56788); Octopus dofleini(Octopus, X07797); Procambarus clarkii(Crayfish, S53494); Schistocerca gregaria(Locust 1, X80071; Locust 2, X80072);Sphodromantis sps (Mantis, X71665); andTodarodes pacificus (Squid 2,X70498).
The bee UV opsin falls into a second group of visual pigments in the phylogenetic tree (Fig. 3). It is most closely related to theDrosophila UV-sensitive opsins and is 64 and 55% similar toD. melanogaster Rh3 (Fryxell and Meyerowitz, 1987; Zuker et al., 1987) and Rh4 (Montell et al., 1987), respectively, but only 35% similar to the bee putative long-wavelength opsin (Chang et al., 1996). Thus, as a close relative to the Drosophila pigments that have been physiologically characterized and shown to encode UV-sensitive pigments (Feiler et al., 1992), the bee UV opsin is also likely to encode a UV-sensitive visual pigment. It must be noted, however, that single amino acid changes between various opsins have been shown to have dramatic effects on both their spectral sensitivity and function (Sakmar et al., 1989; Zhukovsky and Oprian, 1989; Nathans, 1990b; Imai et al., 1997).
In addition to the global similarities between the Apis blue and UV opsins and other invertebrate visual pigments, these two proteins have distinct structural features and conserved amino acids that are characteristic of invertebrate visual pigments and opsins in general. Hydropathy analysis of the two opsins indicated the presence of seven hydrophobic regions (data not shown) that are capable of forming α-helical transmembrane domains with an extracellular N terminal and cytoplasmic C terminal (noted in Figs. 1,4) (Kyte and Doolittle, 1982; Baldwin, 1993; Schertler et al., 1993). Both opsins contain a Lys in the seventh transmembrane domain (Lys326 for the blue rhodopsin and Lys318 for the UV rhodopsin) that is strictly conserved in all opsins. Studies in bovine rhodopsin have shown that this Lys is the site of attachment of the retinal chromophore to the apoprotein via a Schiff’s base linkage (Bownds, 1967; Wang et al., 1980). Vertebrate opsins (site 113 in bovine rhodopsin) have a conserved Glu found in helix III that serves as a counterion to the protonated Schiff’s base (Sakmar et al., 1989; Zhukovsky and Oprian, 1989; Nathans, 1990b). The corresponding position in theApis blue opsin is occupied by a Tyr residue (Tyr132) and in the UV opsin by a Phe (Phe124). Interestingly, both of the UV pigments that have been functionally expressed and characterized (Drosophila Rh3 and Rh4; see Fig. 4 for site) have a Phe at this position (as does the Apis UV), whereas the visible-sensitive opsins that have been similarly characterized (Drosophila Rh1 and Rh2, amino acids 133 and 126, respectively) have a Tyr at this position (as does the Apisblue and green, locust 2, and Drosophila Rh5; see Fig. 4 for site) (Feiler et al., 1988, 1992). By analogy with the vertebrate visual pigments, this suggests that the Tyr at this position in the invertebrate visible-sensitive pigments may function as a “counter-ion-like” residue.
Fig. 4.
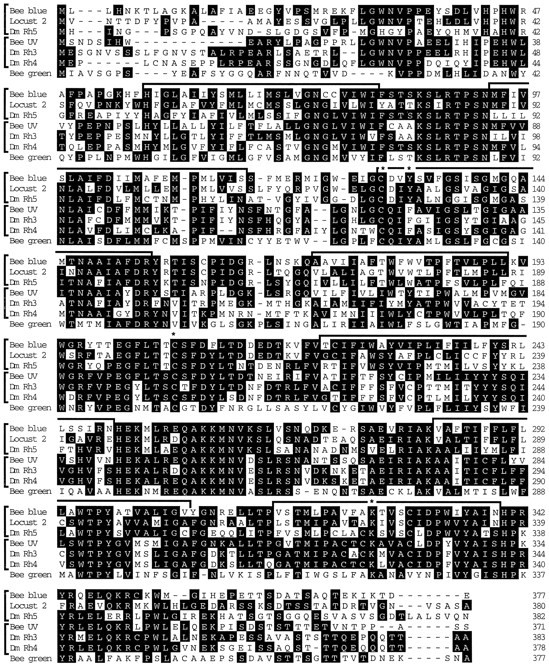
Amino acid sequence alignment between theApis blue- and UV-sensitive opsins and other related pigments. The sequences are grouped as indicated in Figure 3. The pigments thought to be blue-sensitive include Drosophila Rh5 and Locust 2, whereas the UV-sensitive opsins include Drosophila Rh3 and Rh4. The putative Apis green opsin is indicated on thelower line for comparison. Consensus amino acids areblackened. The potential transmembrane segments are indicated with brackets over thesequences. Highly conserved amino acids are indicated with an asterisk and are discussed in the Results. These include the Lys in TM 7 and a pair of Cys at the beginning of TM 3 and between TM 4 and TM 5. The residue corresponding to the vertebrate counterion (Tyr in the blue and green pigments vs Phe in the UV pigments) in TM 3 is also indicated.
The Apis blue and UV opsins also contain two conserved Cys (Cys129 and Cys206 for the blue and Cys120 and Cys197 for the UV opsin) that have been shown to form an essential disulfide bond in bovine rhodopsin (Karnik et al., 1988; Karnik and Khorana, 1990). The C terminals of the blue and UV opsins contain a cluster of Thr and Ser residues that are likely to serve as sites for phosphorylation by rhodopsin kinase (Ohguro et al., 1996). The Apis blue and UV opsins also contain potential glycosylation sites at Asn5 and Asn3 for the blue and UV pigments, respectively. The related fly visual pigmentsCalliphora Rh1 and Drosophila Rh1 are both transiently N-glycosylated during processing and transport to the rhabdomere (Huber et al., 1990; Colley et al., 1991). A mutation in the consensus site for glycosylation (N-X-S/T) at Asn20 in the Drosophila Rh1 opsin interferes with visual pigment maturation (O’Tousa, 1992). In addition, the first cytoplasmic loop of both the Apis blue- and UV-sensitive opsins contains a stretch of highly conserved amino acids (KSLRTPSN), two of which (Leu and Asn, within this sequence) have been shown to be crucial for the maturation of the Rh1 rhodopsin inDrosophila (Bentrop et al., 1997).
Heterologous expression of the Apis opsin genes in the R1–6 photoreceptor cells of Drosophila
To demonstrate that the Apis blue and UV opsin genes encode functional visual pigments, we expressed these opsins in the R1–6 photoreceptor cells of Drosophila under the control of the ninaE opsin gene promoter. The R1–6 photoreceptor cells are a suitable environment for the expression of novel opsins because they dominate the physiological and photochemical properties of the compound eye and mediate most behavioral responses that are dependent on visual input (Heisenberg and Wolf, 1984). The expression of opsin genes in these cells has proven to be a powerful experimental system for studying the spectral and physiological properties of novel or modified opsin genes in vivo (Feiler et al., 1988, 1992;Britt et al., 1993). In recent experiments, we have also found this system to be useful in the heterologous expression and characterization of other invertebrate opsins (E. Salcedo and S. G. Britt, unpublished observations). We expressed the honeybee opsins in the R1–6 photoreceptor cells of a mutant strain of flies (ninaE) in which the gene encoding the opsin normally expressed in these cells has been deleted. Thus, in the transgenic animals, the only opsin expressed in the R1–6 photoreceptor cells is the one encoded by the transgene. In the absence of suitable in vitro expression systems for the expression of invertebrate visual pigments, the construction and characterization of transgenic flies represent the only available method to examine directly the biological activity of the newly cloned genes.
To test whether the honeybee opsins are functional when expressed in the fly retina, we examined the electroretinogram of control and transgenic flies. The electroretinogram is an extracellular recording technique used to measure the summed light-induced electrical response of the eye. White-eyed flies were used in these experiments, because removal of the red pigments of the eye dramatically increases their light sensitivity. As shown in Figure 5(top row of traces), white-eyed flies (w) respond to a flash of light at each of the tested wavelengths with hyperpolarizing “on” and depolarizing “off” transients, at the onset and cessation of the stimulus, respectively. The on transients of the electroretinogram have been shown to be of laminar origin and are induced only after activation of the R1–6 photoreceptor cells (Heisenberg, 1971; Heisenberg and Wolf, 1984). The white-eyed control flies also have a large depolarizing potential derived from these photoreceptors that is maintained for the duration of the stimulus. The w; ninaE host strain (Fig. 5,second row of traces) has no rhodopsin in the R1–6 photoreceptor cells and therefore does not display on transients in response to light. These flies also display significantly reduced signal amplitudes, the small remaining signal being derived from the R7 and R8 cells that are unaffected by the ninaEmutation (Johnson and Pak, 1986). Transgenic flies expressing the honeybee blue opsin in the R1–6 photoreceptor cells (w; ninaE; P[Rh1 + Bee Blue]) display a robust response to light at each of the tested wavelengths, with normal on and off transients and a maintained depolarization with a large amplitude (Fig. 5, third row of traces). Transgenic flies expressing the honeybee UV opsin in the R1–6 photoreceptor cells (w; ninaE; P[Rh1 + Bee UV]) display a normal response to UV light at 350 nm, with on and off transients and a maintained depolarization with a large amplitude (Fig. 5, fourth row of traces); however these animals are insensitive to light at the other two wavelengths. The ability of both honeybee opsin genes to restore the light response of the ninaE host strain at appropriate wavelengths indicates that they encode functional opsins that are fully active biologically and capable of coupling to the downstream components of the phototransduction cascade within theDrosophila R1–6 photoreceptor cells.
Fig. 5.

Electroretinogram recordings of transgenic flies expressing the Apis blue- and UV-sensitive opsins. Eachcolumn shows the light response to a 1 sec flash at different wavelengths of light, 350 nm (left), 430 nm (middle), and 470 nm (right). Eachrow shows the ERG recording from a different genetic background. w1118 flies (top) respond to light at all three wavelengths with a robust depolarization and on and off transients (see Results).w1118; ninaE17 flies (second from the top), which lack the ninaE (Rh1) opsin of the R1–6 photoreceptor cells, lack the on and off transients and have a severely reduced receptor potential at all three wavelengths. Transgenic flies expressing the Apis blue opsin (third from the top;w1118; ninaE17 P[Rh1 + Bee Blue]) show a robust response to light at all wavelengths, with a complete recovery of the depolarization and transients. Transgenic flies expressing the Apis UV opsin (fourth fromtop; w1118; ninaE17 P[Rh1 + Bee UV]) show a normal depolarization and transients in response to UV stimulation. The amplitudes of the ERG response are not comparable between different strains because of differences in expression levels of the transgenes, nor are they comparable at different wavelengths because of differences in stimulus intensity. For most recordings, light intensity was attenuated 3 OD, resulting in intensities of ∼0.22, 1.3, and 2.7 μW/cm2 at 350, 430, and 470 nm, respectively. With the exception of the response fromw flies (which was recorded at 3 OD as indicated above), all of the responses at 350 nm were recorded with a light intensity attenuated 1 OD, corresponding to a light intensity of 21 μW/cm2.
Sequences within the second and third intracellular domains of bovine rhodopsin have been shown to be required for G-protein activation (Franke et al., 1988, 1990, 1992). The Apis blue and UV opsins contain a DRY sequence at the junction of helix III and the second intracellular loop that is very similar to the ERY sequence found in bovine rhodopsin. This sequence contains a charged pair that is required for transducin activation (Franke et al., 1990, 1992). Although dissimilar from the vertebrate opsins, the sequence QAKKMNV found in the N-terminal half of cytoplasmic loop 3 is very highly conserved among the invertebrate opsins and is located within a region of the protein that in bovine rhodopsin is also required for transducin activation (Franke et al., 1988, 1990, 1992). Given that bovine rhodopsin activates transducin, a G-protein family member that activates cGMP phosphodiesterase, whereas flies and honeybees are both thought to use a Gq family member that activates phospholipase C, it seems likely that vertebrate and invertebrate sequence differences in these regions may mediate the specificity of G-protein activation (Yarfitz and Hurley, 1994; Zuker, 1996).
Spectral sensitivity analyses of transgenic Drosophilaexpressing the Apis blue and UV opsin genes
To examine in detail the spectral sensitivity of theApis opsins expressed in the Drosophila retina, we measured the relative sensitivity of these animals to light from 300 to 600 nm using the voltage-clamp technique of Franceschini (Franceschini, 1979, 1984). As shown in the upper panel of Figure 6, white-eyedDrosophila have a spectral sensitivity that is characterized by a dual peak of sensitivity. The peak of sensitivity in the visible region with a maximum at 479 nm is attributable to the activation of the Rh1 rhodopsin in the R1–6 photoreceptor cells (Feiler et al., 1988; Britt et al., 1993). The peak of sensitivity in the UV region with a maximum at 352 nm reflects the activation of a sensitizing pigment that absorbs light in the UV and is thought to transfer this energy to and activate the Rh1 rhodopsin (Burkhardt, 1962; Kirschfeld and Franceschini, 1977; Stark et al., 1977; Minke and Kirschfeld, 1979). Examination of the ninaE mutant host strain by this method does not yield a reproducible sensitivity profile, because the light response of the mutant strain is too low to consistently meet the criterion of the recording paradigm (see Materials and Methods).
Fig. 6.
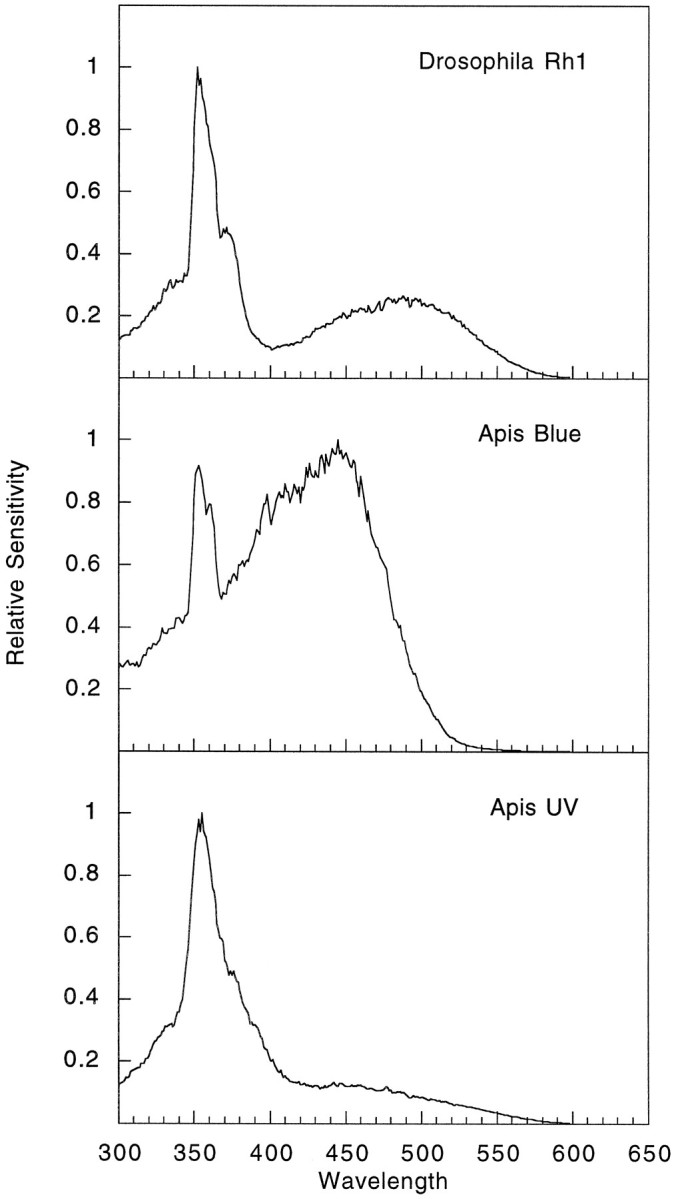
Spectral sensitivity recordings of flies expressing the Apis blue- and UV-sensitive opsins.Top, The spectral sensitivity profile of a white-eyed fly (w1118) that expressesDrosophila Rh1 in the R1–6 photoreceptor cells. These animals display a dual peak of sensitivity. The peak in the UV is attributable to the effect of a sensitizing pigment that absorbs in the UV and transfers the energy of the photon to the Rh1 rhodopsin to activate it. There is also a prominent peak of sensitivity in the blue region with a maximum at 479 nm. Middle, The spectral sensitivity profile of flies expressing the Apisblue-sensitive opsin in a genetic background in which the endogenous opsin expressed in the R1–6 photoreceptor cells has been deleted (w1118; ninaE17 P[Rh1 + Bee Blue]). Much like the white-eyed control animals, flies expressing theApis blue-sensitive opsin have a dual peak of sensitivity, which we believe results from the coupling of theApis blue opsin to the UV-sensitizing pigment in a manner similar to that of Rh1. The principal peak of sensitivity is in the blue region with a maximum at 439 nm. Lower, The spectral sensitivity profile of flies expressing theApis UV-sensitive opsin (w1118; ninaE17 P[Rh1 + Bee UV]). These flies have a single peak of sensitivity in the UV region with a maximum at 353 nm. The spectral sensitivity of the ninaEhost strain is not detectable by these methods, because the response levels (as shown in Fig. 5) are not large enough to meet the criterion of the recording paradigm. These results are in excellent agreement with published intracellular recordings of the Apisblue- and UV-sensitive photoreceptors (Menzel et al., 1986) and provide conclusive evidence that the cloned genes encode biologically active visual pigments having the indicated spectral properties.
Examination of the flies expressing the Apis blue opsin in the Drosophila R1–6 cells revealed that these animals have a pronounced peak of sensitivity in the blue region with a maximum at 439 nm (Fig. 6, middle panel). In addition, these animals show an additional peak of sensitivity in the UV region with a maximum sensitivity at 351 nm. This second peak of sensitivity could potentially arise from the coupling of the sensitizing pigment found in the Drosophila R1–6 photoreceptor cells to theApis blue-sensitive opsin. These results are consistent with the single flash data shown in Figure 5, in which the transgenic flies expressing the Apis blue opsin gene are sensitive to both visible and UV light in much the same way as white-eyed control flies that express the Rh1 opsin. The lower panel of Figure6 shows the spectral sensitivity profile of transgenic flies expressing the Apis UV opsin. These animals show a very dramatic single peak of spectral sensitivity in the UV region with a maximum sensitivity at 353 nm. In the absence of any appreciable sensitivity in any other region of the spectrum, these results seem to indicate that this gene encodes the UV-sensitive pigment of the honeybee. However, because the sensitivity peak is in the same region of the spectrum as the sensitivity attributable to the sensitizing pigment, it is possible that some component of this peak may be caused by the coupling of the opsin to the sensitizing pigment, in a manner similar to that observed for Drosophila Rh1 and the honeybee Blue opsins. Future analysis of these transgenic animals by microspectrophotometry could potentially resolve this issue by examining the absorption of the pigment directly.
DISCUSSION
In this paper, we have described the isolation and characterization of two novel opsin genes from the honeybee Apis mellifera. We have shown that the genes encode functional opsins that are closely related to the visual pigments ofDrosophila and other invertebrates. Both genes fall into structurally related groups of visual pigments that we and others have shown encode either blue- or UV-sensitive opsins. We have also shown that the Apis blue- and UV-sensitive opsins are biologically active when expressed in the R1–6 photoreceptor cells of blindninaE flies and are capable of restoring the light response of these mutant animals. Detailed physiological analysis has revealed that flies expressing the Apis Blue or UV opsins are indeed most sensitive to light at 439 and 353 nm, respectively.
The analysis of color vision in insects has had a long and rich history (Frisch, 1967; Seeley, 1985). Detailed morphological studies of the insect retina have been performed in many different species, which have been complemented by comparative physiological analyses (Menzel, 1979;White, 1985; Menzel et al., 1986; Peitsch et al., 1992). Because honeybees have been shown to use color vision in behavioral assays, the visual system of this organism has been studied extensively and serves as a useful model system (Frisch, 1967; Seeley, 1985). Work on this organism in many ways complements the elegant molecular and genetic studies that have been performed in Drosophila (Zuker, 1996).
As mentioned in the introductory remarks, the compound eye of the honeybee worker is composed of ∼5000–6000 ommatidia, each of which contains nine photoreceptor cells (Skrzipek and Skrzipek, 1974;Waterman, 1981). Over much of the eye, it is generally agreed that the R1, R5, and R9 photoreceptor cells are maximally sensitive to ultraviolet light (near 350 nm). The R3 and R7 cells seem to be sensitive to green light (near 540 nm), whereas the sensitivities of the R2, R6, R4, and R8 cells have not been identified unequivocally; they may be blue- and green-sensitive cells (some blue and some green) or only blue- or only green-sensitive cells depending on their location within the eye (Gribakin, 1969, 1972; Menzel and Blakers, 1976;Waterman, 1981). The rhabdomeres, the light-sensitive organelles, of the nine photoreceptor cells are fused together. The photoreceptors within an ommatidium twist around each other in either a clockwise or counterclockwise direction (Wehner et al., 1975; Meyer, 1984). As mentioned above, there may be some regional specialization within the eye, but only the polarization-sensitive photoreceptors along the dorsal region of the eye have been identified conclusively (Labhart, 1980). In addition, the bee eye is highly sexually dimorphic. The eye of Apis drones (male) are approximately twice as large (10,000 ommatidia) and have further organizational differences (Perrelet, 1970; Bertrand et al., 1979; Muri and Jones, 1983; Menzel et al., 1991). In future studies, the expression patterns of the three known Apis opsin genes can be examined to determine their spatial organization and variability. Such analyses may provide some insight into the basis for complex visually directed behavior patterns in this and other species (e.g., Bernard and Remington, 1991).
An additional motivation for undertaking the experiments described in this paper was to enlarge our knowledge of both the number and diversity of visual pigments that have been characterized functionally as well as at the molecular level. The lack of a suitable expression system for the characterization of invertebrate opsin genes has dramatically diminished the impact of the available sequence data. Beyond the novelty of making a “fly see like a bee,” our intention was to determine the spectral sensitivity of the new opsins by rigorous physiological methods to improve our understanding of the relationship between opsin structure and the regulation of spectral sensitivity. Indeed, the honeybee blue opsin that we describe here was recently isolated independently by another group who described it as a UV-sensitive pigment based on sequence similarity with theDrosophila Rh3 and Rh4 UV-sensitive opsins (Bellingham et al., 1997). This paper demonstrates the feasibility of characterizing the spectral sensitivity of invertebrate opsins in vivo, after their expression in Drosophila, and highlights the importance of directly measuring the spectral properties of novel pigments rather than inferring them from sequence similarity alone.
Our observation that the Apis visual pigments are completely functional and biologically active within the fly retina is somewhat surprising, given that the orders Diptera and Hymenoptera are thought to have diverged between 200 and 300 million years ago (Carpenter, 1992). Nonetheless, by virtue of their physiological activity in fly photoreceptor cells, there must be sufficient primary sequence and structural conservation that these pigments are properly translated and processed and retain the sites necessary for their interaction with the fly G-protein (Gαq) (Zuker, 1996). In addition, because the kinetics of the ERG waveform seem normal in the flies expressing the Apis opsin genes, it seems likely that the molecules involved in the inactivation of the light response inDrosophila photoreceptor cells, such as arrestin, are also able to interact with the Apis visual pigments.
Although these studies have clearly demonstrated the similarities between the Apis and Drosophila visual systems, one distinct difference is the chromophore used in each species. Honeybees use 11-cis-retinal as a chromophore, whereas 3-hydroxy-11-cis-retinal is the chromophore inDrosophila (Tanimura et al., 1986; Smith and Goldsmith, 1990). Presumably, 3-hydroxy-11-cis-retinal is incorporated into and functional within the bee opsins. There have been limited studies examining the effect of hydroxyl substitution on the chromophore ring; however, when bovine opsin was reconstituted with 3-hydroxy-retinal, a blue shift of 12 nm (from 500 to 488 nm) was noted by comparison with the native pigment (Gärtner et al., 1991). Thus it seems likely that expression of the bee opsin genes inDrosophila yields a visual pigment that has spectral properties similar to the native Apis pigments.
Two major questions regarding the spectral tuning of visual pigments concern (1) the basis of the bathochromic or “red” shift that occurs after the binding of the chromophore to the opsin apoprotein and (2) the molecular basis for wavelength modulation. For the vertebrate pigments, the first question has primarily been answered by the identification of the counterion as Glu 113 in bovine rhodopsin (Sakmar et al., 1989; Zhukovsky and Oprian, 1989; Nathans, 1990b). As discussed in the Results, the presence of a Tyr or Phe at this position in the visible- or UV-sensitive invertebrate pigments, respectively, suggests that a similar mechanism may be the basis for UV sensitivity. The functional characterization of a third cloned UV-sensitive pigment (the bee UV) serves to strengthen this argument. Regarding the issue of wavelength modulation of the visible-sensitive pigments, studies of the vertebrate visual pigments have also provided a framework for understanding and approaching this problem. The human red and green cone opsins are extremely closely related at a structural level and differ by only 15 amino acids but differ in maximal sensitivity by 35 nm. Interestingly, both genetic and site-directed mutagenesis experiments have shown that as many as seven amino acids are required to account for the full difference of spectral properties between these pigments (Neitz et al., 1991; Chan et al., 1992; Merbs and Nathans, 1992b; Asenjo et al., 1994). Although some amino acids seem to be individually responsible for a large part of the spectral difference, others seem to play a more minor role. In addition, other sites have been identified that are thought to be responsible for differences between the red/green-sensitive and blue-sensitive pigments and rhodopsin (Wang et al., 1993; Sun et al., 1997). By contrast, analysis of more divergent invertebrate visual pigments, such as the Rh1 and Rh2 opsins of Drosophila, which differ at 117 amino acid positions and have over a 60 nm difference in spectral sensitivity, has yielded more complex results that suggest that some aspects of visual pigment sensitivity are regulated by multiple regions of the opsin protein that may interact together (Britt et al., 1993).
The cloning, ectopic expression, and characterization of the honeybee visual pigments contribute significantly to our understanding of the visual pigments of invertebrates. Flies and bees use a group of visual pigments having spectral sensitivities clustered near the UV, blue, and green regions of the spectrum. Comparative analysis of opsin sequences can be used to identify residues associated with spectral sensitivity shifts (Chang et al., 1995). These amino acid substitutions can now be tested for their ability to modulate the spectral properties of invertebrate visual pigments, after in vivo expression. Because the selection of food sources and mating partners and the defense of territory are dependent on color vision in most species (e.g., Bernard and Remington, 1991; Chittka et al., 1994), this work provides a means to examine the functional and adaptive significance of visual pigments in invertebrates in the context of evolutionary history.
Footnotes
This work was supported by National Eye Institute Grant R01EY10759 to S.G.B. S.M.T. was supported by a Postdoctoral Fellowship from the Johannsen Research Fund of the Fight for Sight Research Division of Prevent Blindness America. We thank Richard Lewontin for his advice and support of this work and Paul D. Gardner, Patrick M. W. Sung, and an anonymous reviewer for their critical evaluation of this manuscript. We also thank W. Clay Smith (J. Hillis Miller Health Center, University of Florida) for the honeybee eye cDNA library, Ross H. Crozier (Latrobe University, Bundoora, Australia) for supplying the honeybee mitochondrial DNA clone, and André Mignault and Karen Nutt for help with the sequencing. We are especially grateful to Kuno Kirschfeld and Reinhard Feiler (Max-Planck-Institut für Biologische Kybernetik, Tübingen, Germany) for helping us assemble and modify the scanning spectral sensitivity instrument that they developed.
The GenBank accession numbers for the honeybee blue- and UV-sensitive visual pigments are AF004168 and AF004169, respectively.
Correspondence should be addressed to Dr. Steven G. Britt, Institute of Biotechnology and Department of Molecular Medicine, The University of Texas Health Science Center at San Antonio, 15355 Lambda Drive, San Antonio, TX 78245-3207.
REFERENCES
- 1.Asenjo AB, Rim J, Oprian DD. Molecular determinants of human red/green color discrimination. Neuron. 1994;12:1131–1138. doi: 10.1016/0896-6273(94)90320-4. [DOI] [PubMed] [Google Scholar]
- 2.Baldwin JM. The probable arrangement of the helices in G protein-coupled receptors. EMBO J. 1993;12:1693–1703. doi: 10.1002/j.1460-2075.1993.tb05814.x. [DOI] [PMC free article] [PubMed] [Google Scholar]
- 3.Bellingham J, Wilkie SE, Morris AG, Bowmaker JK, Hunt DM. Characterisation of the ultraviolet-sensitive opsin gene in the honey bee, Apis mellifera. Eur J Biochem. 1997;243:775–781. doi: 10.1111/j.1432-1033.1997.00775.x. [DOI] [PubMed] [Google Scholar]
- 4.Bentrop J, Schwab K, Pak WL, Paulsen R. Site-directed mutagenesis of highly conserved amino acids in the first cytoplasmic loop of Drosophila Rh1 opsin blocks rhodopsin synthesis in the nascent state. EMBO J. 1997;16:1600–1609. doi: 10.1093/emboj/16.7.1600. [DOI] [PMC free article] [PubMed] [Google Scholar]
- 5.Bernard GD, Remington CL. Color vision in Lycaena butterflies: spectral tuning of receptor arrays in relation to behavioral ecology. Proc Natl Acad Sci USA. 1991;88:2783–2787. doi: 10.1073/pnas.88.7.2783. [DOI] [PMC free article] [PubMed] [Google Scholar]
- 6.Bertrand D, Fuortes G, Muri R. Pigment transformation and electrical responses in retinula cells of drone, Apis mellifera male. J Physiol (Lond) 1979;296:431–441. doi: 10.1113/jphysiol.1979.sp013014. [DOI] [PMC free article] [PubMed] [Google Scholar]
- 7.Bownds D. Site of attachment of retinal in rhodopsin. Nature. 1967;216:1178–1181. doi: 10.1038/2161178a0. [DOI] [PubMed] [Google Scholar]
- 8.Britt SG, Feiler R, Kirschfeld K, Zuker CS. Spectral tuning of rhodopsin and metarhodopsin in vivo. Neuron. 1993;11:29–39. doi: 10.1016/0896-6273(93)90268-v. [DOI] [PubMed] [Google Scholar]
- 9.Burkhardt D. Spectral sensitivity and other response characteristics of single visual cells in the arthropod eye. Symp Soc Exp Biol. 1962;16:86–109. [Google Scholar]
- 10.Carpenter FM. Treatise on invertebrate paleontology, Pt R, Arthropoda 4, Vol 4, Superclass hexapoda. The Geological Society of America and The University of Kansas; Boulder, CO: 1992. [Google Scholar]
- 11.Chan T, Lee M, Sakmar TP. Introduction of hydroxyl-bearing amino acids causes bathochromic spectral shifts in rhodopsin. Amino acid substitutions responsible for red–green color pigment spectral tuning. J Biol Chem. 1992;267:9478–9480. [PubMed] [Google Scholar]
- 12.Chang BS, Crandall KA, Carulli JP, Hartl DL. Opsin phylogeny and evolution: a model for blue shifts in wavelength regulation. Mol Phylogenet Evol. 1995;4:31–43. doi: 10.1006/mpev.1995.1004. [DOI] [PubMed] [Google Scholar]
- 13.Chang BS, Ayers D, Smith WC, Pierce NE. Cloning of the gene encoding honeybee long-wavelength rhodopsin: a new class of insect visual pigments. Gene. 1996;173:215–219. doi: 10.1016/0378-1119(96)00165-5. [DOI] [PubMed] [Google Scholar]
- 14.Chittka L, Shmida A, Troje N, Menzel R. Ultraviolet as a component of flower reflections, and the colour perception of Hymenoptera. Vision Res. 1994;34:1489–1508. doi: 10.1016/0042-6989(94)90151-1. [DOI] [PubMed] [Google Scholar]
- 15.Chou WH, Hall KJ, Wilson DB, Wideman CL, Townson SM, Chadwell LV, Britt SG. Identification of a novel Drosophila opsin reveals specific patterning of the R7 and R8 photoreceptor cells. Neuron. 1996;17:1101–1115. doi: 10.1016/s0896-6273(00)80243-3. [DOI] [PubMed] [Google Scholar]
- 16.Church GM, Gilbert W. Genomic sequencing. Proc Natl Acad Sci USA. 1984;81:1991–1995. doi: 10.1073/pnas.81.7.1991. [DOI] [PMC free article] [PubMed] [Google Scholar]
- 17.Colley NJ, Baker EK, Stamnes MA, Zuker CS. The cyclophilin homolog ninaA is required in the secretory pathway. Cell. 1991;67:255–263. doi: 10.1016/0092-8674(91)90177-z. [DOI] [PubMed] [Google Scholar]
- 18.Corripio AB. Tuning of industrial control systems. Instrument Society of America; Research Triangle Park, NC: 1990. [Google Scholar]
- 19.Crozier RH, Crozier YC, Mackinlay AG. The CO-I and CO-II region of honeybee mitochondrial DNA: evidence for variation in insect mitochondrial evolutionary rates. Mol Biol Evol. 1989;6:399–411. doi: 10.1093/oxfordjournals.molbev.a040553. [DOI] [PubMed] [Google Scholar]
- 20.Feiler R, Harris WA, Kirschfeld K, Wehrhahn C, Zuker CS. Targeted misexpression of a Drosophila opsin gene leads to altered visual function. Nature. 1988;333:737–741. doi: 10.1038/333737a0. [DOI] [PubMed] [Google Scholar]
- 21.Feiler R, Bjornson R, Kirschfeld K, Mismer D, Rubin GM, Smith DP, Socolich M, Zuker CS. Ectopic expression of ultraviolet-rhodopsins in the blue photoreceptor cells of Drosophila: visual physiology and photochemistry of transgenic animals. J Neurosci. 1992;12:3862–3868. doi: 10.1523/JNEUROSCI.12-10-03862.1992. [DOI] [PMC free article] [PubMed] [Google Scholar]
- 22.Felsenstein J. Confidence limits on phylogenies: an approach using the bootstrap. Evolution. 1985;39:783–791. doi: 10.1111/j.1558-5646.1985.tb00420.x. [DOI] [PubMed] [Google Scholar]
- 23.FlyBase. FlyBase–The Drosophila database. Available from http://flybase.bio.indiana.edu/. Nucleic Acids Res. 1997;25:63–66. doi: 10.1093/nar/25.1.63. [DOI] [PMC free article] [PubMed] [Google Scholar]
- 24.Franceschini N (1979) Voltage clamp by light. Invest Opthalmol [Suppl 5].
- 25.Franceschini N. Chromatic organization and sexual dimorphism of the fly retinal mosaic. In: Borsellino A, Cervetto L, editors. Photoreceptors. Plenum; New York: 1984. pp. 319–350. [Google Scholar]
- 26.Franke RR, Sakmar TP, Oprian DD, Khorana HG. A single amino acid substitution in rhodopsin (lysine 248–leucine) prevents activation of transducin. J Biol Chem. 1988;263:2119–2122. [PubMed] [Google Scholar]
- 27.Franke RR, Konig B, Sakmar TP, Khorana HG, Hofmann KP. Rhodopsin mutants that bind but fail to activate transducin. Science. 1990;250:123–125. doi: 10.1126/science.2218504. [DOI] [PubMed] [Google Scholar]
- 28.Franke RR, Sakmar TP, Graham RM, Khorana HG. Structure and function in rhodopsin. Studies of the interaction between the rhodopsin cytoplasmic domain and transducin. J Biol Chem. 1992;267:14767–14774. [PubMed] [Google Scholar]
- 29.Frisch Kv. The dance language and orientation of bees. Harvard University; Cambridge, MA: 1967. [Google Scholar]
- 30.Fryxell KJ, Meyerowitz EM. An opsin gene that is expressed only in the R7 photoreceptor cell of Drosophila. EMBO J. 1987;6:443–451. doi: 10.1002/j.1460-2075.1987.tb04774.x. [DOI] [PMC free article] [PubMed] [Google Scholar]
- 31.Gärtner W, Ullrich D, Vogt K. Quantum yield of CHAPSO-solubilized rhodopsin and 3-hydroxy retinal containing bovine opsin. Photochem Photobiol. 1991;54:1047–1055. doi: 10.1111/j.1751-1097.1991.tb02128.x. [DOI] [PubMed] [Google Scholar]
- 32.Gribakin FG. Cellular basis of colour vision in the honey bee. Nature. 1969;223:639–641. doi: 10.1038/223639b0. [DOI] [PubMed] [Google Scholar]
- 33.Gribakin FG. The distribution of the long wave photoreceptors in the compound eye of the honey bee as revealed by selective osmic staining. Vision Res. 1972;12:1225–1230. doi: 10.1016/0042-6989(72)90193-9. [DOI] [PubMed] [Google Scholar]
- 34.Hardie RC. Functional organization of the fly retina. In: Autrum H, Ottoson D, Perl ER, Schmidt RF, Shimazu H, Willis WD, editors. Progress in sensory physiology. Springer; Berlin: 1985. pp. 1–79. [Google Scholar]
- 35.Hardie RC, Kirschfeld K. Ultraviolet sensitivity of fly photoreceptors R7 and R8: evidence for a sensitising function. Biophys Struct Mech. 1983;9:171–180. [Google Scholar]
- 36.Heisenberg M. Separation of receptor and lamina potentials in the electroretinogram of normal and mutant Drosophila. J Exp Biol. 1971;55:85–100. doi: 10.1242/jeb.55.1.85. [DOI] [PubMed] [Google Scholar]
- 37.Heisenberg M, Wolf R. Vision in Drosophila. Springer; New York: 1984. [Google Scholar]
- 38.Higgins DG, Sharp PM. Fast and sensitive multiple sequence alignments on a microcomputer. Comput Appl Biosci. 1989;5:151–153. doi: 10.1093/bioinformatics/5.2.151. [DOI] [PubMed] [Google Scholar]
- 39.Huber A, Smith DP, Zuker CS, Paulsen R. Opsin of Calliphora peripheral photoreceptors R1–6. Homology with Drosophila Rh1 and posttranslational processing. J Biol Chem. 1990;265:17906–17910. [PubMed] [Google Scholar]
- 40.Huber A, Schulz S, Bentrop J, Groell C, Wolfrum U, Paulsen R. Molecular cloning of Drosophila Rh6 rhodopsin: the visual pigment of a subset of R8 photoreceptor cells. FEBS Lett. 1997;406:6–10. doi: 10.1016/s0014-5793(97)00210-x. [DOI] [PubMed] [Google Scholar]
- 41.Imai H, Kojima D, Oura T, Tachibanaki S, Terakita A, Shichida Y. Single amino acid residue as a functional determinant of rod and cone visual pigments. Proc Natl Acad Sci USA. 1997;94:2322–2326. doi: 10.1073/pnas.94.6.2322. [DOI] [PMC free article] [PubMed] [Google Scholar]
- 42.Jacobs GH. Comparative color vision (Carterette EC, Friedman MP, eds). Academic; New York: 1981. [Google Scholar]
- 43.Johnson EC, Pak WL. Electrophysiological study of Drosophila rhodopsin mutants. J Gen Physiol. 1986;88:651–673. doi: 10.1085/jgp.88.5.651. [DOI] [PMC free article] [PubMed] [Google Scholar]
- 44.Karess R, Rubin G. Analysis of P transposable element functions in Drosophila. Cell. 1984;38:135–146. doi: 10.1016/0092-8674(84)90534-8. [DOI] [PubMed] [Google Scholar]
- 45.Karnik SS, Khorana HG. Assembly of functional rhodopsin requires a disulfide bond between cysteine residues 110 and 187. J Biol Chem. 1990;265:17520–17524. [PubMed] [Google Scholar]
- 46.Karnik SS, Sakmar TP, Chen HB, Khorana HG. Cysteine residues 110 and 187 are essential for the formation of correct structure in bovine rhodopsin. Proc Natl Acad Sci USA. 1988;85:8459–8463. doi: 10.1073/pnas.85.22.8459. [DOI] [PMC free article] [PubMed] [Google Scholar]
- 47.Kirschfeld K, Franceschini N. Evidence for a sensitising pigment in fly photoreceptors. Nature. 1977;269:386–390. doi: 10.1038/269386a0. [DOI] [PubMed] [Google Scholar]
- 48.Kirschfeld K, Feiler R, Vogt K. Evidence for a sensitizing pigment in the ocellar photoreceptors of the fly (Musca, Calliphora). J Comp Physiol [A] 1988;163:421–423. [Google Scholar]
- 49.Kozak M. Structural features in eukaryotic mRNAs that modulate the initiation of translation. J Biol Chem. 1991;266:19867–19870. [PubMed] [Google Scholar]
- 50.Kyte J, Doolittle RF. A simple method for displaying the hydropathic character of a protein. J Mol Biol. 1982;157:105–132. doi: 10.1016/0022-2836(82)90515-0. [DOI] [PubMed] [Google Scholar]
- 51.Labhart T. Specialized photoreceptors at the dorsal rim of the honeybee’s compound eye: polarizational and angular sensitivity. J Comp Physiol [A] 1980;141:19–30. [Google Scholar]
- 52.Lindsley DL, Zimm GG. Genome of Drosophila melanogaster. Academic; San Diego: 1992. [Google Scholar]
- 53.Menzel JG, Wunderer H, Stavenga DG. Functional morphology of the divided compound eye of the honeybee drone (Apis mellifera). Tissue Cell. 1991;23:525–535. doi: 10.1016/0040-8166(91)90010-q. [DOI] [PubMed] [Google Scholar]
- 54.Menzel R. Spectral sensitivity and color vision in invertebrates. In: Autrum H, editor. Comparative physiology and evolution of vision in invertebrates, A, Invertebrate photoreceptors. Springer; Berlin: 1979. pp. 503–580. [Google Scholar]
- 55.Menzel R. Color vision honey bees: phenomena and physiological mechanisms. In: Stavenga DG, Hardie RC, editors. Facets of vision. Springer; Berlin: 1989. pp. 281–297. [Google Scholar]
- 56.Menzel R, Blakers M. Colour receptors in the bee eye – morphology and spectral sensitivity. J Comp Physiol [A] 1976;108:11–33. [Google Scholar]
- 57.Menzel R, Muller U. Learning and memory in honeybees: from behavior to neural substrates. Annu Rev Neurosci. 1996;19:379–404. doi: 10.1146/annurev.ne.19.030196.002115. [DOI] [PubMed] [Google Scholar]
- 58.Menzel R, Ventura DF, Hertel H, de Souza JM, Greggers U. Spectral sensitivity of photoreceptors in insect compound eyes: comparison of species and methods. J Comp Physiol [A] 1986;158:165–177. [Google Scholar]
- 59.Merbs SL, Nathans J. Absorption spectra of human cone pigments. Nature. 1992a;356:433–435. doi: 10.1038/356433a0. [DOI] [PubMed] [Google Scholar]
- 60.Merbs SL, Nathans J. Absorption spectra of the hybrid pigments responsible for anomalous color vision. Science. 1992b;258:464–466. doi: 10.1126/science.1411542. [DOI] [PubMed] [Google Scholar]
- 61.Meyer EP. Retrograde labelling of photoreceptors in different regions of the compound eyes of bees and ants. J Neurocytol. 1984;13:825–836. doi: 10.1007/BF01148496. [DOI] [PubMed] [Google Scholar]
- 62.Minke B, Kirschfeld K. The contribution of a sensitizing pigment to the photosensitivity spectra of fly rhodopsin and metarhodopsin. J Gen Physiol. 1979;73:517–540. doi: 10.1085/jgp.73.5.517. [DOI] [PMC free article] [PubMed] [Google Scholar]
- 63.Montell C, Jones K, Zuker C, Rubin G. A second opsin gene expressed in the ultraviolet sensitive R7 photoreceptor cells of Drosophila melanogaster. J Neurosci. 1987;7:1558–1566. doi: 10.1523/JNEUROSCI.07-05-01558.1987. [DOI] [PMC free article] [PubMed] [Google Scholar]
- 64.Muri RB, Jones GJ. Microspectrophotometry of single rhabdoms in the retina of the honeybee drone (Apis mellifera male). J Gen Physiol. 1983;82:469–496. doi: 10.1085/jgp.82.4.469. [DOI] [PMC free article] [PubMed] [Google Scholar]
- 65.Nathans J. Determinants of visual pigment absorbance: role of charged amino acids in the putative transmembrane segments. Biochemistry. 1990a;29:937–942. doi: 10.1021/bi00456a013. [DOI] [PubMed] [Google Scholar]
- 66.Nathans J. Determinants of visual pigment absorbance: identification of the retinylidene Schiff’s base counterion in bovine rhodopsin. Biochemistry. 1990b;29:9746–9752. doi: 10.1021/bi00493a034. [DOI] [PubMed] [Google Scholar]
- 67.Nathans J. Rhodopsin: structure, function, and genetics. Biochemistry. 1992;31:4923–4931. doi: 10.1021/bi00136a001. [DOI] [PubMed] [Google Scholar]
- 68.Nathans J, Thomas D, Hogness DS. Molecular genetics of human color vision: the genes encoding blue, green, and red pigments. Science. 1986a;232:193–202. doi: 10.1126/science.2937147. [DOI] [PubMed] [Google Scholar]
- 69.Nathans J, Piantanida TP, Eddy RL, Shows TB, Hogness DS. Molecular genetics of inherited variation in human color vision. Science. 1986b;232:203–210. doi: 10.1126/science.3485310. [DOI] [PubMed] [Google Scholar]
- 70.Neitz M, Neitz J, Jacobs GH. Spectral tuning of pigments underlying red-green color vision. Science. 1991;252:971–974. doi: 10.1126/science.1903559. [DOI] [PubMed] [Google Scholar]
- 71.O’Tousa JE. Requirement of N-linked glycosylation site in Drosophila rhodopsin. Vis Neurosci. 1992;8:385–390. doi: 10.1017/s0952523800004910. [DOI] [PubMed] [Google Scholar]
- 72.Ohguro H, Rudnicka-Nawrot M, Buczylko J, Zhao X, Taylor JA, Walsh KA, Palczewski K. Structural and enzymatic aspects of rhodopsin phosphorylation. J Biol Chem. 1996;271:5215–5224. doi: 10.1074/jbc.271.9.5215. [DOI] [PubMed] [Google Scholar]
- 73.Papatsenko D, Sheng G, Desplan C. A new rhodopsin in R8 photoreceptors of Drosophila: evidence for coordinate expression with Rh3 in R7 cells. Development. 1997;124:1665–1673. doi: 10.1242/dev.124.9.1665. [DOI] [PubMed] [Google Scholar]
- 74.Peitsch D, Fietz A, Hertel H, de Souza J, Ventura DF, Menzel R. The spectral input systems of hymenopteran insects and their receptor-based colour vision. J Comp Physiol [A] 1992;170:23–40. doi: 10.1007/BF00190398. [DOI] [PubMed] [Google Scholar]
- 75.Perrelet A. The fine structure of the retina of the honey bee drone. An electron microscopical study. Z Zellforsch Mikrosk Anat. 1970;108:530–562. doi: 10.1007/BF00339658. [DOI] [PubMed] [Google Scholar]
- 76.Saitou N, Nei M. The neighbor-joining method: a new method for reconstructing phylogenetic trees. Mol Biol Evol. 1987;4:406–425. doi: 10.1093/oxfordjournals.molbev.a040454. [DOI] [PubMed] [Google Scholar]
- 77.Sakmar TP, Franke RR, Khorana HG. Glutamic acid-113 serves as the retinylidene Schiff base counterion in bovine rhodopsin. Proc Natl Acad Sci USA. 1989;86:8309–8313. doi: 10.1073/pnas.86.21.8309. [DOI] [PMC free article] [PubMed] [Google Scholar]
- 78.Sakmar TP, Franke RR, Khorana HG. The role of the retinylidene Schiff base counterion in rhodopsin in determining wavelength absorbance and Schiff base pKa. Proc Natl Acad Sci USA. 1991;88:3079–3083. doi: 10.1073/pnas.88.8.3079. [DOI] [PMC free article] [PubMed] [Google Scholar]
- 79.Schertler GF, Villa C, Henderson R. Projection structure of rhodopsin. Nature. 1993;362:770–772. doi: 10.1038/362770a0. [DOI] [PubMed] [Google Scholar]
- 80.Seeley TD. Honeybee ecology. Princeton University; Princeton, NJ: 1985. [Google Scholar]
- 81.Skrzipek KH, Skrzipek H. The ninth retinula cell in the ommatidium of the worker honey bee (Apis mellifica L.). Z Zellforsch Mikrosk Anat. 1974;147:589–593. doi: 10.1007/BF00307257. [DOI] [PubMed] [Google Scholar]
- 82.Smith WC, Goldsmith TH. Phyletic aspects of the distribution of 3-hydroxyretinal in the class insecta. J Mol Evol. 1990;30:72–84. doi: 10.1007/BF02102454. [DOI] [PubMed] [Google Scholar]
- 83.Smola U, Meffert P. The spectral sensitivity of the visual cells R7 and R8 in the eye of the blowfly Calliphora erythrocephala. J Comp Physiol [A] 1979;133:41–52. [Google Scholar]
- 84.Stark WS, Ivanyshyn AM, Greenberg RM. Sensitivity and photopigments of R1–6; a two-peaked photoreceptor in Drosophila, Calliphora and Musca. J Comp Physiol [A] 1977;121:289–305. [Google Scholar]
- 85.Sun H, Macke JP, Nathans J. Mechanisms of spectral tuning in the mouse green cone pigment. Proc Natl Acad Sci USA. 1997;94:8860–8865. doi: 10.1073/pnas.94.16.8860. [DOI] [PMC free article] [PubMed] [Google Scholar]
- 86.Swimmer C, Shenk T. Selection of sequence elements that substitute for the standard AATAAA motif which signals 3′ processing and polyadenylation of late simian virus 40 mRNAs. Nucleic Acids Res. 1985;13:8053–8063. doi: 10.1093/nar/13.22.8053. [DOI] [PMC free article] [PubMed] [Google Scholar]
- 87.Swofford DL. PAUP: phylogenetic analysis using parsimony. Illinois Natural History Survey; Champaign, IL: 1991. [Google Scholar]
- 88.Tanimura T, Isono K, Tsukahara Y. 3-Hydroxy-retinal as a chromophore of Drosophila melanogaster visual pigment analyzed by high-pressure liquid chromatography. Photochem Photobiol. 1986;43:225–228. [Google Scholar]
- 89.Thompson JD, Higgins DG, Gibson TJ. CLUSTAL W: improving the sensitivity of progressive multiple sequence alignment through sequence weighting, position-specific gap penalties and weight matrix choice. Nucleic Acids Res. 1994;22:4673–4680. doi: 10.1093/nar/22.22.4673. [DOI] [PMC free article] [PubMed] [Google Scholar]
- 90.Towner P, Harris P, Wolstenholme AJ, Hill C, Worm K, Gartner W. Primary structure of locust opsins: a speculative model which may account for ultraviolet wavelength light detection. Vision Res. 1997;37:495–503. doi: 10.1016/s0042-6989(96)00198-8. [DOI] [PubMed] [Google Scholar]
- 91.Wang JK, McDowell JH, Hargrave PA. Site of attachment of 11-cis-retinal in bovine rhodopsin. Biochemistry. 1980;19:5111–5117. doi: 10.1021/bi00563a027. [DOI] [PubMed] [Google Scholar]
- 92.Wang Z, Asenjo AB, Oprian DD. Identification of the Cl(−)-binding site in the human red and green color vision pigments. Biochemistry. 1993;32:2125–2130. doi: 10.1021/bi00060a001. [DOI] [PubMed] [Google Scholar]
- 93.Waterman TH. Polarization sensitivity. In: Autrum H, editor. Comparative physiology and evolution of vision in invertebrates, B, Invertebrate visual centers and behavior I. Springer; Berlin: 1981. pp. 281–470. [Google Scholar]
- 94.Wehner R, Bernard GD, Geiger E. Twisted and non-twisted rhabdoms and their significance for polarization detection in the bee. J Comp Physiol [A] 1975;104:225–245. [Google Scholar]
- 95.White RH. Insect visual pigments and color vision. In: Kerkut GA, Gilbert LI, editors. Comprehensive insect physiology, biochemistry and pharmacology. Pergamon; Oxford: 1985. pp. 431–493. [Google Scholar]
- 96.Yarfitz S, Hurley J. Transduction mechanisms of vertebrate and invertebrate photoreceptors. J Biol Chem. 1994;269:14329–14332. [PubMed] [Google Scholar]
- 97.Zhukovsky EA, Oprian DD. Effect of carboxylic acid side chains on the absorption maximum of visual pigments. Science. 1989;246:928–930. doi: 10.1126/science.2573154. [DOI] [PubMed] [Google Scholar]
- 98.Zuker C, Montell C, Jones K, Laverty T, Rubin G. A rhodopsin gene expressed in photoreceptor cell R7 of the Drosophila eye: homologies with other signal-transducing molecules. J Neurosci. 1987;7:1550–1557. doi: 10.1523/JNEUROSCI.07-05-01550.1987. [DOI] [PMC free article] [PubMed] [Google Scholar]
- 99.Zuker CS. The biology of vision of Drosophila. Proc Natl Acad Sci USA. 1996;93:571–576. doi: 10.1073/pnas.93.2.571. [DOI] [PMC free article] [PubMed] [Google Scholar]
- 100.Zuker CS, Cowman AF, Rubin GM. Isolation and structure of a rhodopsin gene from D. melanogaster. Cell. 1985;40:851–858. doi: 10.1016/0092-8674(85)90344-7. [DOI] [PubMed] [Google Scholar]