Abstract
Repetitive stimulation of the dorsal thalamus at 7–14 Hz produces an increasing number of spikes at an increasing frequency in neocortical neurons during the first few stimuli. Possible mechanisms underlying these cortical augmenting responses were analyzed with a computer model that included populations of thalamocortical cells, thalamic reticular neurons, up to two layers of cortical pyramidal cells, and cortical inhibitory interneurons. Repetitive thalamic stimulation produced a low-threshold intrathalamic augmentation in the model based on the deinactivation of the low-threshold Ca2+ current in thalamocortical cells, which in turn induced cortical augmenting responses. In the cortical model, augmenting responses were more powerful in the “input” layer compared with those in the “output” layer. Cortical stimulation of the network model produced augmenting responses in cortical neurons in distant cortical areas through corticothalamocortical loops and low-threshold intrathalamic augmentation. Thalamic stimulation was more effective in eliciting augmenting responses than cortical stimulation. Intracortical inhibition had an important influence on the genesis of augmenting responses in cortical neurons: A shift in the balance between intracortical excitation and inhibition toward excitation transformed an augmenting responses to long-lasting paroxysmal discharge. The predictions of the model were compared with in vivo recordings from neurons in cortical area 4 and thalamic ventrolateral nucleus of anesthetized cats. The known intrinsic properties of thalamic cells and thalamocortical interconnections can account for the basic properties of cortical augmenting responses.
Keywords: augmenting responses, repetitive stimulation, thalamocortical network, low-threshold current, intracortical inhibition, lateral excitation
Repetitive 7–14 Hz stimulation of the dorsal thalamic nuclei leads to the progressive enhancement of thalamic and cortical responses (Morison and Dempsey, 1943). Augmenting cortical responses can also be obtained in animals with thalamic lesion by stimulating white matter or callosal afferents (Morin and Steriade, 1981; Ferster and Lindström, 1985; Steriade et al., 1993b), and it has been assumed that intrinsic cortical mechanisms are sufficient for generating cortical augmenting responses. Recently, augmenting responses were described in slice preparations of neocortical layer V, further strengthening the case for intrinsic mechanisms within the cortex (Castro-Alamancos and Connors, 1996b).
Despite the converging experimental evidence for the cortical origin of augmenting responses (Morin and Steriade, 1981; Ferster and Lindström, 1985; Metherate and Ashe, 1994; Castro-Alamancos and Connors, 1996b), it is still possible that intrathalamic and intracortical mechanisms may contribute separately to the development of cortical augmenting responses during repetitive thalamic or cortical stimulation. Intracellular recording in vivo have revealed that augmenting responses can be generated in the thalamus after decortication (Steriade and Timofeev, 1997; Timofeev and Steriade, 1998). Two types of the augmenting responses were described. The first, low-threshold type of augmenting response depended on the progressive growth of the low-threshold spikes (LTSs) in thalamocortical (TC) cells. The hyperpolarization of TC cells produced by the previous shock, through activation of the thalamic reticular (RE) neurons and RE-evoked GABAA–GABAB IPSPs (Hirsch and Burnod, 1987; Crunelli et al., 1988; Paré et al., 1991), led to the deinactivation of the low-threshold Ca2+ current in TC cells (Jahnsen and Llinás, 1984a,b), and the next stimulus in the train was followed by an LTS. A second, high-threshold type of augmenting response was associated with decreases in the IPSPs and depolarization of TC cells (Steriade and Timofeev, 1997) leading to the activation of the high-threshold Ca2+ current (Hernández-Cruz and Pape, 1989; Kammermeier and Jones, 1997;Pedroarena and Llinás, 1997; Zhou et al., 1997). The type of augmenting response elicited may depend on the balance between synaptic excitation and RE-evoked inhibition (Timofeev and Steriade, 1998).
In a recent computer model of the low-threshold augmenting responses in networks of RE and TC cells (Bazhenov et al., 1998), the development of simulated intrathalamic augmenting responses depended on the direct stimulation of RE cells leading to the activation of GABABreceptors in TC cells. The purpose of the present study is to analyze the low-threshold mechanisms underlying cortical augmenting responses in thalamocortical networks including thalamic RE and TC cells as well as excitatory cortical (CX) neurons and inhibitory (IN) interneurons. We found that repetitive thalamic stimulation leads to cortical EPSPs with an increasing secondary depolarizing component that was preceded by low-threshold spike bursts in TC cells, similar to data obtainedin vivo (Steriade et al., 1998). Cortical sites remote from the stimulation site are involved in the augmenting response through corticothalamocortical loops. We also analyzed the role of synaptic interconnections in the model and found that a critical balance was needed between intracortical inhibition and excitation for cortical augmenting responses to occur. We confirmed that similar augmenting responses could be obtained in thalamocortical networks that included two layers of cortical pyramidal cells and two-dimensional sheets of cells.
MATERIALS AND METHODS
Intrinsic currents (RE and TC cells). Each TC and RE cell was modeled by a single compartment that included voltage- and Ca2+-dependent currents described by Hodgkin–Huxley kinetics (Hodgkin and Huxley, 1952):
| Equation 1 |
where Cm is the membrane capacitance, gL is the leakage conductance, EL is the reversal potential, Iint is a sum of active intrinsic currents (Ijint), and Isyn is a sum of synaptic currents (Ijsyn).
The set of intrinsic currents used to model a TC cell included a fast sodium current, INa (for review, see Traub and Miles, 1991), a fast potassium current, IK(Traub and Miles, 1991), a low-threshold Ca2+current, IT (Huguenard and McCormick, 1992), a hyperpolarization-activated cation current, Ih(McCormick and Pape, 1990; Destexhe et al., 1996a), a potassium A current, IA (Huguenard et al., 1991), and a potassium leak current, IKL (McCormick and Huguenard, 1992). To model an RE cell, we included a fast sodium current, INa (Traub and Miles, 1991), a fast potassium current, IK (Traub and Miles, 1991), a low-threshold Ca2+ current, IT (Huguenard and Prince, 1992), and a potassium leak current, IKL.
All the voltage-dependent ionic currents, Ijint(t), had the same general form:
| Equation 2 |
where gj is the maximal conductance, m(t) is the activation variable, h(t) is the inactivation variable, and (V − Ej) is the difference between membrane potential and reversal potential.
The model for Ih took into account both voltage and Ca2+ dependencies (Bal and McCormick, 1996;Lüthi and McCormick, 1997). The voltage dependence was described by the first-order kinetics of transitions between closed C and open O states of the channels without inactivation:
| Equation 3 |
where α(V) and β(V) are the voltage-dependent transition rates.
The Ca2+ dependence was based on higher-order kinetics involving a regulation factor P (Destexhe et al., 1996a). The binding of the Ca2+ molecules with unbound form of the regulation factor P0 leads to the bound form P1. In the next step, P1 binds to the open state of the channel O that produces the locked form OL:
| Equation 4 |
Both the open and locked states of the channels contribute to Ih:
| Equation 5 |
The expressions for voltage- and Ca2+-dependent transition rates for all currents are given by Bazhenov et al. (1998). The maximal conductances and passive properties were Cm = 1 μF/cm2, gL = 0.05 mS/cm2, EL = −77 mV, SRE = 1.43 × 10⁻⁴cm2, gT = 2.0 mS/cm2, gNa = 100 mS/cm2, gK = 10 mS/cm2 and gKL = 0.003 mS/cm2 for RE cells, and Cm = 1 μF/cm2, gL = 0.01 mS/cm2, EL = −70 mV, STC = 2.9 × 10⁻⁴ cm2, gT = 2.2 mS/cm2, gNa = 90 mS/cm2, gK = 10 mS/cm2, gKL = 0.01 mS/cm2, gh = 0.02 mS/cm2, and gA = 1 mS/cm2 for TC cells.
We should note that a typical feature of bursts in RE in vivo is the accelerando–decelerando patterns of the sodium spikes (Steriade et al., 1986; Contreras et al., 1993; Huguenard and Prince, 1994) as a result of the high density of ITcurrent in the distal dendrites (Destexhe et al., 1996b). A multicompartment model of an RE cell is required to model this effect. The simplified one-compartment model of an RE cell used in the present study displayed only the decelerating frequency at the end of the burst.
Intrinsic currents (CX and IN cells). The cortical CX and IN cells were two-compartment models with channels that were also modeled by Hodgkin–Huxley kinetics (Mainen and Sejnowski, 1994):
| Equation 6 |
where Cm and gLare the membrane capacitance and the leakage conductance of the dendritic compartment, respectively, EL is the reversal potential, VD and VS are the membrane potentials of dendritic and axosomatic compartments, respectively, IDintand ISint are the sums of active intrinsic currents in axosomatic and dendritic compartments, respectively, Isyn is a sum of synaptic currents, and g is the conductance between axosomatic and dendritic compartments.
The model included a high density of the fast Na+channels (INa) in axosomatic compartment and a low density in the dendritic compartment. A fast potassium K+ current (IK) was present in the axosomatic compartment. A slow voltage-dependent nonactivated K+ current (IKm), slow Ca2+-dependent K+ current (IKCa), and a high-threshold Ca2+ current (IHVA) were included in dendritic compartment.
The currents were modeled by Equation 2. The expressions for the voltage- and Ca2+-dependent transition rates for all currents are given by Mainen and Sejnowski (1994). The maximal conductances and passive properties were Ssoma = 1.0 × 10⁻⁶ cm2, gNa = 3000 mS/cm2, gK = 150 mS/cm2 for axosomatic compartment and Cm = 0.75 μF/cm2, gL = 0.033 mS/cm2, EL = −70 mV, Sdend = Ssomar, gHVA = 0.03 mS/cm2, gNa = 1.5 mS/cm2, gKCa = 0.3 mS/cm2, and gKm = 0.01 mS/cm2 for dendritic compartment. The resistance between compartments was R = 10 MΩ.
The firing properties of the model in Equation 1 depend on the coupling conductance between compartments (g = 1/R) and the ratio of axosomatic area to dendritic area r (Mainen and Sejnowski, 1994). We used a model of a regular-spiking neuron for CX cells (r = 165) and a model of a fast-spiking neuron for IN cells (r = 50).
Synaptic currents. All synaptic currents were calculated according to
| Equation 7 |
where gsyn is the maximal conductivity, Esyn is the reversal potential, and [O](t) is the fraction of open channels.
GABAA and AMPA synaptic currents were modeled by first-order activation schemes (for review, see Destexhe et al., 1994b). The transmitter T binds to the closed form of receptors C and yields the open form O:
| Equation 8 |
The release of transmitter [T] was modeled by a square pulse [T](t) = Aθ(t0 + tmax −t)θ(t − t0), with duration tmax= 0.3 msec and amplitude A = 0.5 triggered when the presynaptic voltage crosses 0 mV.
GABAB receptors were modeled by a higher-order reaction scheme that took into account activation of K+channels by G-proteins (Dutar and Nicoll, 1988; Destexhe et al., 1994b,1996a):
| Equation 9 |
In this reaction scheme, the binding of transmitter T to the receptors R0 leads to its activated form R1. The inactive form of the G-protein, G0, which is assumed to be in excess, can transform to the active form catalyzed by R1. Finally when the active form of the G-protein binds to the closed form of the channel at four binding sites, the channel opens, O. The assumption of quasistationarity for the last reaction leads to the expression [O] = [ G]4/([G]4 + K).
This model of a GABAB synapse yields a strong response for a prolonged burst of spikes in the presynaptic cell. In contrast, a burst with only a few spikes evokes a weak GABAB IPSP in the postsynaptic cell.
The rate constants for all synaptic kinetic equations are given byBazhenov et al. (1998). The reversal potentials were EAMPA = 0 mV for AMPA receptors, EGABAA = −70 mV for GABAA receptors in RE cells, and EGABAA = −80 mV for GABAA receptors in TC cells (Ulrich and Huguenard, 1997); EK = −95 mV is the potassium reversal potential for GABAB receptors.
We should emphasize that NMDA receptors were not included in our model, because the related experimental data were obtained under ketamine anesthesia, which blocks NMDA receptors.
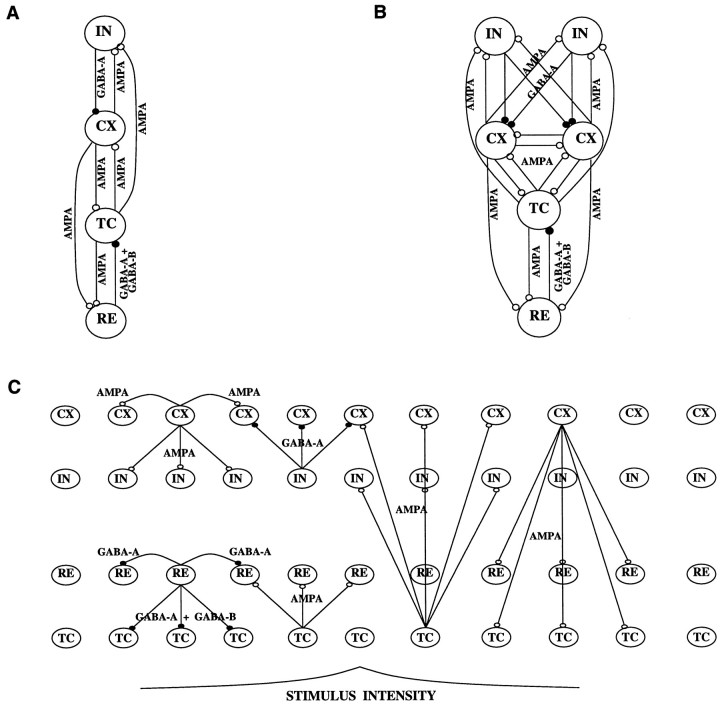
Network geometry. The models discussed in the paper included two layers of thalamic cells (RE-TC) and two or three layers of cortical cells (IN-CX or IN-CX1-CX2). We simulated five network models: (1) a circuit with 1 × 4 reciprocally connected RE-TC-CX-IN cells (Fig. 1A); (2) a circuit with 1 × 2 RE-TC and 2 × 2 CX-IN cells (Fig. 1B); (3) a one-dimensional four-layer chain of 27 × 4 RE-TC-CX-IN cells (Fig. 1C); (4) a one-dimensional five-layer chain of 27 × 5 RE-TC-CX1-CX2-IN cells; and (5) a two-dimensional network of 729 × 4 RE-TC-CX-IN cells. In the latter three networks, “dense proximal connections” (Destexhe et al., 1994a) were used where each cell made connections with all other cells within a fixed radius. The diameters of the connection fan out were 9 cells for RE→RE (GABAA), RE→TC (GABAA + GABAB), TC→RE (AMPA), CX→CX (AMPA), CX→IN (AMPA), and IN→CX (GABAA) connections and 17 cells for TC→CX (AMPA), TC→IN (AMPA), CX→TC (AMPA), and CX→RE (AMPA) connections. The maximal conductance for each synapse was scaled to keep the total maximal conductance from all synapses onto a cell fixed (Destexhe et al., 1994a). The connections were identical and were described by Equations 7-9. Reflective boundary conditions were used. Thalamic cells were stimulated by AMPA synapses, which had a maximal conductance gext = 0.75 μS at the center of stimulation and decayed exponentially (ratio k = 0.1) with distance from the center (Fig. 1C). Cortical cells were also stimulated by AMPA synapses with a maximal conductance of gext = 0.5 μS at the center of stimulation and the same exponential dropoff as for the thalamic cells.
Fig. 1.
The structure of synaptic interconnections in the thalamocortical network. A, Minimal model of 1 × 4 RE-TC-CX-IN cells. The open circles denote the excitatory (AMPA) synapses, and the filled circles denote the inhibitory (GABAA and GABAB) synapses. B, Model of 1 × 2 RE-TC and 2 × 2 CX-IN cells with lateral intracortical connections. C, Structure of the four-layer chain of RE, TC, CX, and IN cells. Diameter of connections is nine cells for intrathalamic RE→TC, RE→RE, TC→RE and intracortical CX→IN, CX→CX, IN→CX projections and 17 cells for thalamocortical CX→TC, CX→RE, TC→CX, TC→IN projections. The intensity of stimulation is maximal in the center of the chain and decays exponentially with distance from the center.
Some of the intrinsic parameters of the neurons in the network (gKL and gh for TC cells and gKL for RE cells) were initialized with some random variability (variance ς ∼ 20% for gKL and ς ∼ 10% for gh) to diminish the effect of lateral inhibition between reticular neurons and to ensure the robustness of the results.
Average depolarization of the neuron. To characterize the augmenting responses in the two-dimensional network of RE-TC-CX-IN cells, the average depolarization i,j was calculated for each neuron in the network:
| Equation 10 |
where Vi,j(t) is the membrane potential of the cell (i, j) ∈ Ω at the time instant t; Vmin(t) = min(i,j)∈Ω Vi,j(t); Ω is an N × N two-dimensional network; and tk, k = 1, 2, … are the stimulation times. Thus, i,j(k) gives the average depolarization of the membrane potential for neuron (i, j) during the time interval between two stimuli k and k + 1 relative to the minimum membrane potential of all cells at time tk.
Computational methods. All simulations described in the paper were performed using a fourth-order Runge–Kutta [RK(4)] integration method and in some cases an embedded Runge–Kutta [RK6(5)] method (Enright et al., 1995). The time step was 0.04 msec. Source C++ code was compiled on an Alpha Server 2100A (5/300) using a GNU compiler (version 2.7.2.2). A simulation of 1 sec of real time for the circuit of 4 RE-TC-CX-IN cells took 9 sec and for a network with 108 RE-TC-CX-IN cells took 13.8 minutes. A two-dimensional network (2916 cells) took ∼72 hr of computer time to simulate 1 sec of real time.
In vivo recordings. In vivo experiments were performed on cats anesthetized with ketamine–xylazine or with barbiturate anesthesia. Field potentials and intracellular recordings were obtained from the precruciate gyrus (area 4), the suprasylvian gyrus (areas 5, 7, and 21) as well as the ventrolateral (VL) thalamic nucleus. Simultaneous double intracellular recordings were obtained from cortical area 4 neurons and thalamic VL neurons. Augmenting responses were elicited by thalamic pulse trains at 10 Hz applied to the VL, centrolateral or lateroposterior nuclei of the thalamus. The details of experimental methods are described in a companion paper (Steriade et al., 1998). Additionally, to investigate the possibility of eliciting augmenting responses by stimulation of cerebellothalamic pathways, we stimulated the brachium conjunctivum rhythmically (10 Hz) while recording in VL and in motor cortex (area 4). The details of experimental methods are the same as those of Timofeev et al. (1996).
RESULTS
Thalamocortical augmenting responses in vivo
Intracellular recordings were obtained from 189 TC cells and 320 cortical cells, including 37 double intracellular impalements.
Cerebellothalamic stimulation
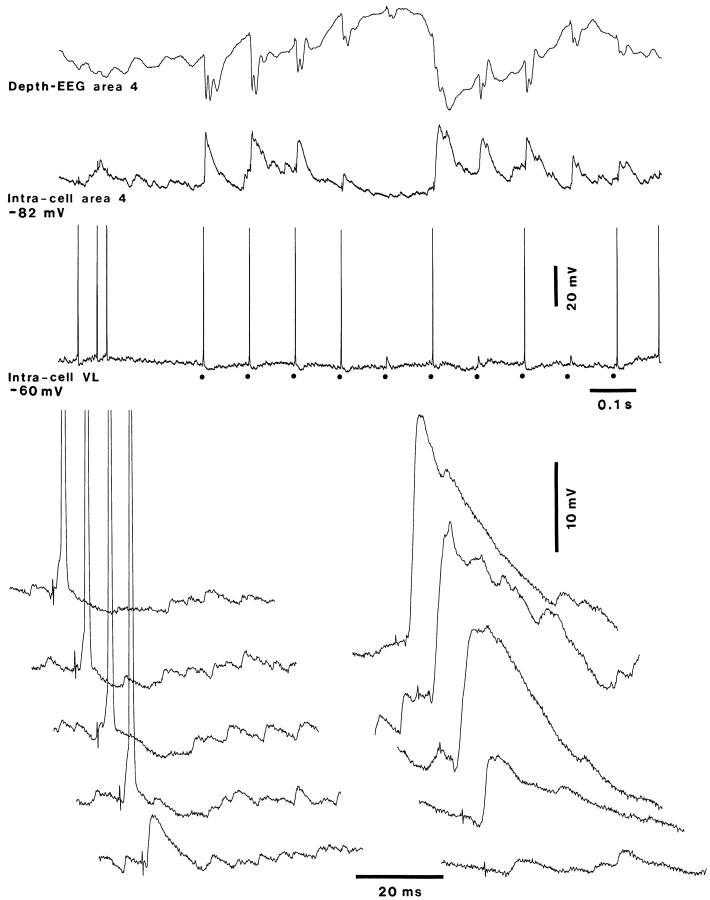
To investigate whether the site of stimulation affects the augmenting responses, we recorded intracellular activities in the VL nucleus of thalamus simultaneously with neurons from motor cortical area 4, while stimulating cerebellothalamic projection pathways (brachium conjunctivum) at 10 Hz. Under these conditions, no augmenting response were observed either in the cortex or in the thalamus. Examples of recordings are shown in Fig.2 (also see Timofeev et al., 1996, their Fig. 3). Stimulation of the brachium conjunctivum at a frequency of 10 Hz evoked EPSP–spike sequences in the VL neuron. A high-amplitude EPSP occurred in the cortical neuron 1.2 msec after a spike in the VL neuron. The responsiveness of both TC and cortical cells was correlated with slow oscillations in the cortex, but no augmentation was detected. Thus, the stimulation of the cerebellothalamic afferents does not produce an augmenting response either in thalamus or in the cortex. The differences between stimulation of the thalamus directly and stimulation of prethalamic (e.g., retinal, lemniscal, and cerebellothalamic) pathways are discussed elsewhere (Steriade and Timofeev, 1997; Bazhenov et al., 1998).
Fig. 2.
Stimulation of cerebellothalamic projection pathways (brachium conjunctivum) does not elicit an augmenting response. Simultaneous recording of depth EEG and a cortical cell from area 4 and a TC cell from the VL nucleus. Stimulus pulse train at 10 Hz indicated by dots. Expansion of the early parts of responses to the first 5 stimuli of VL cell (bottom left) and cortical cell (bottom right) is shown. Stimulation of brachium conjunctivum reveals a monosynaptic EPSPs in the TC cell leading to spikes. When hyperpolarization during depth positivity in the EEG prevents the TC cell from firing, the cortical cell has a smaller-amplitude EPSP. The responsiveness of thalamic and cortical cells is affected by the slow oscillation but does not increment during the train of stimuli.
Intrathalamic stimulation
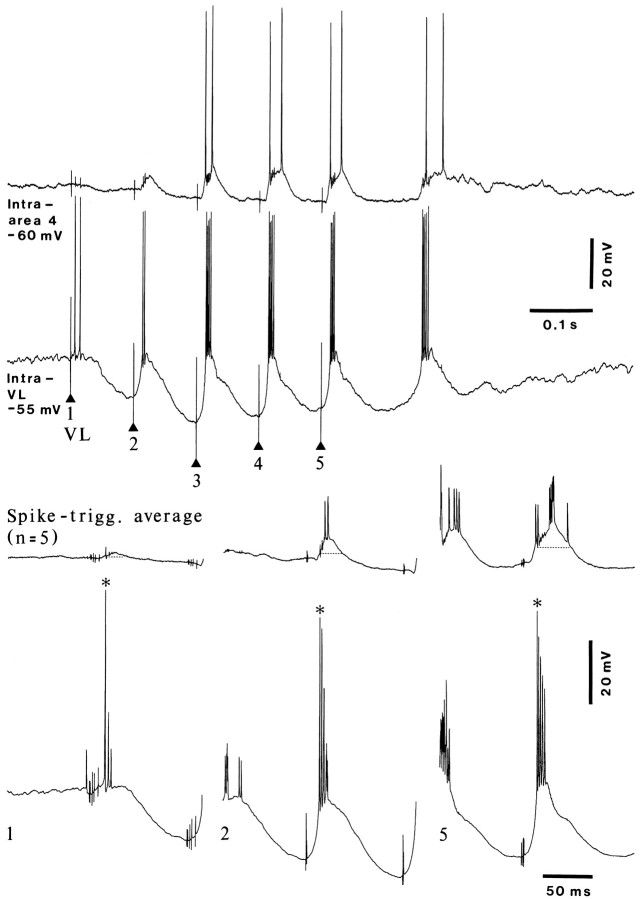
Local thalamic stimulation with trains of stimuli at 10 Hz consistently produced augmenting responses in thalamic and cortical neurons. The first thalamic stimulus evoked an EPSP followed by an IPSP in thalamic cells. The second stimulus, 100 msec later, arrived during the course of GABAB IPSPs in the TC cells. Under these conditions, the EPSP invariably triggered an LTS. Progressive hyperpolarization of TC cells during the first three to five stimuli resulted in progressive growth in the size of the LTS and the number of action potentials generated by TC cells. The main feature of augmenting responses in cortex recorded intracellularly was the appearance and growth in size of secondary excitation in response to the second and subsequent stimuli. This secondary excitation was time-locked with thalamic spike bursts. Figure 3,top panel, shows the augmenting responses in simultaneously recorded cortical and TC cells. After the second stimulus, a spike burst appeared in the TC cell, and a secondary EPSP appeared in the cortical cells. The TC cell reached its maximum hyperpolarization before the third and fourth stimuli, which evoked a strong LTS with five spikes in the burst. These spike bursts in the TC cells led to strong secondary excitation in the cortical cell. The depression of the IPSP and the activation of the Ih current slightly repolarized the TC cell, and the response to fifth stimulus was a burst of only four spikes, which did not affect the shape of secondary depolarization in the cortical cell. The relationship of spike bursts in the TC cell and secondary excitation in the cortical cell is clearly seen in spike-triggered averages (Fig. 3, bottom panel).
Fig. 3.
Thalamic rebound spike bursts deinactivated by hyperpolarization during augmenting responses precede the depolarizing augmented responses in cortical neuron. Ketamine–xylazine anesthesia. Dual intracellular recording from VL and area 4 neurons. VL stimulated at 10 Hz. Averages ( n = 5) triggered by the first action potentials (asterisks) of the first, second, and fifth responses of VL neuron show that they precede the late, augmented depolarization (dotted line) in area 4.
Augmenting responses in the basic RE-TC-CX-IN network
The simplest thalamic network model that can generate a low-threshold augmenting response during repetitive stimulation is a reciprocal pair of RE-TC cells (Bazhenov et al., 1998). Here we show that an RE-TC-CX-IN model (Fig. 1A) displays the main features of augmenting responses observed in the cortex in vivo. Thalamic stimulation was modeled by AMPA EPSPs delivered to both RE and TC cells. Thalamic stimulation also produced monosynaptic excitation in cortical (CX and IN) neurons. This was modeled by cortical responses to stimuli that were only 10% of the intensity of RE-TC stimulation.
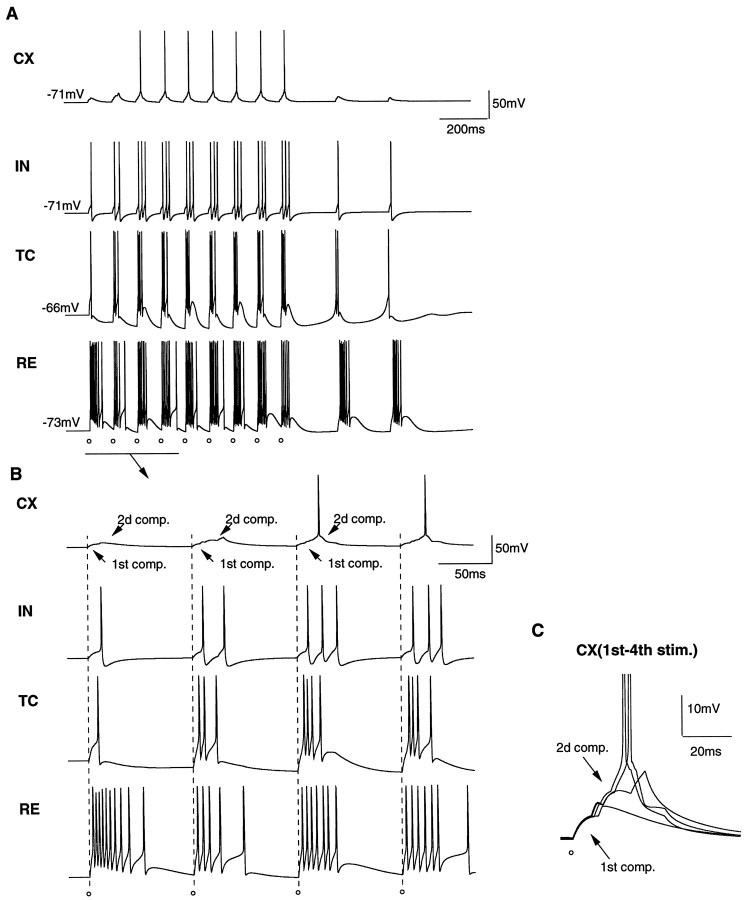
The external stimulus evoked EPSPs in RE, TC, CX, and IN cells. The response of the TC cell in turn produced secondary EPSPs in CX and IN cells with a disynaptic latency (Fig. 4). Feedback RE-evoked GABAA–GABAB IPSP partially deinactivated the low-threshold Ca2+ current in the TC cell, and the next stimulus evoked an LTS leading to the augmented burst of spikes in the TC cell, which enhanced the secondary EPSP in the CX cell. Continued stimulation augmented the TC responses and, consequently, the secondary EPSPs in CX and IN cells. Thus, a simple network of four RE-TC-CX-IN cells could reproduce the main features of the augmenting responses—a two-component response with an augmenting second component—observed in cortical pyramidal cells during repetitive thalamic stimulation in vivo (Steriade et al., 1998).
Fig. 4.
Augmenting responses in the minimal model of RE-TC-CX-IN cells during repetitive 10 Hz stimulation. Both the RE and TC cells were stimulated with 100% of maximal intensity, and the CX and IN cells were stimulated with 10% of maximal intensity. A, Monosynaptic stimulation of the CX cell elicited a nonaugmenting component in the cortical EPSPs that occurred simultaneously with EPSPs in the RE and TC cells. Augmenting spike bursts in TC cells lead to a growing secondary EPSPs in the CX cell. B, Same response shown on a shorter time scale. C, Superimposed traces of the first four EPSPs in a CX cell.Open circles indicate the time of thalamic stimulation (gAMPA = 0.1 μS from CX to IN, gAMPA = 0.1 μS from CX to TC, gAMPA = 0.2 μS from CX to RE, gGABAA = 0.03 μS from IN to CX, gAMPA = 0.035 μS from TC to CX, and gAMPA = 0.02 μS from TC to IN).
Cortical augmentation occurred in the model because of the growth of TC-evoked EPSPs in CX and IN cells. Strengthening the afferent TC→CX synaptic connections should result in even stronger cortical augmenting responses during repetitive thalamic stimulation. This was confirmed in simulations in which the maximal conductance of the TC→CX connection was increased to almost twice its standard value (Fig.5A). In this case, stimulation elicited action potentials in the CX cell starting with the second stimulus in the train, and the spike latency was much shorter compared with the experiment shown in Figure 4.
Fig. 5.
Influence of afferent (TC→CX) and lateral (CX→CX) connections on cortical augmenting responses. A, The same circuit of RE-TC-CX-IN cells as shown in Figure 1A during repetitive RE-TC (100% maximal intensity) and CX-IN (10% maximal intensity) stimulation for gAMPA = 0.06 μS from TC to CX cells. The other parameters are the same as for Figure 4. Increasing the maximal conductance of TC→CX synaptic connections produced a stronger augmentation of CX responses (compare A, Fig. 4A). B, Augmenting responses in a chain of six RE-TC-CX-IN cells shown in Figure 1B. The lateral AMPA excitation between CX cells (gAMPA = 0.1 μS) increases the number of spikes in the augmenting responses. Note that both CX and IN cells have stronger augmenting responses.Open circles indicate the time of thalamic stimulation.
Additional mechanisms affecting the strength of the cortical augmenting response were uncovered in a more complex RE-TC-CX-IN network as shown in Figure 1B. Figure 5B shows the responses of CX-IN cells during trains of stimuli. The lateral CX→CX excitation led to the summation of TC and CX-evoked EPSPs in CX cells, which also gave stronger augmenting responses (two spikes after the second stimulus). This strengthening of CX augmenting responses was observed despite the increased IN-evoked IPSPs in CX cells. This simulation shows that although the strength of the afferent TC→CX synaptic connections is important, it is not the only parameter controlling the properties of augmenting responses in CX cells. Further evidence for the critical role of intracortical connections for controlling the cortical augmenting responses is presented below.
Augmenting responses in a chain of RE-TC-CX-IN cells in response to thalamic stimulation
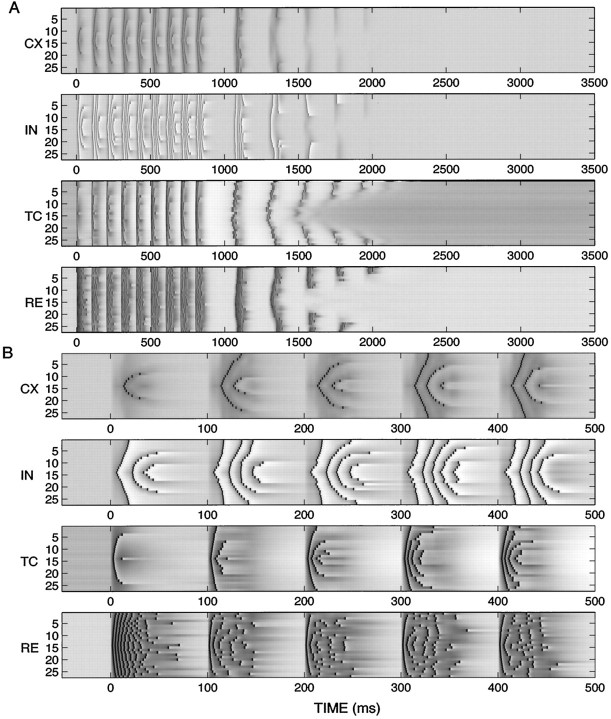
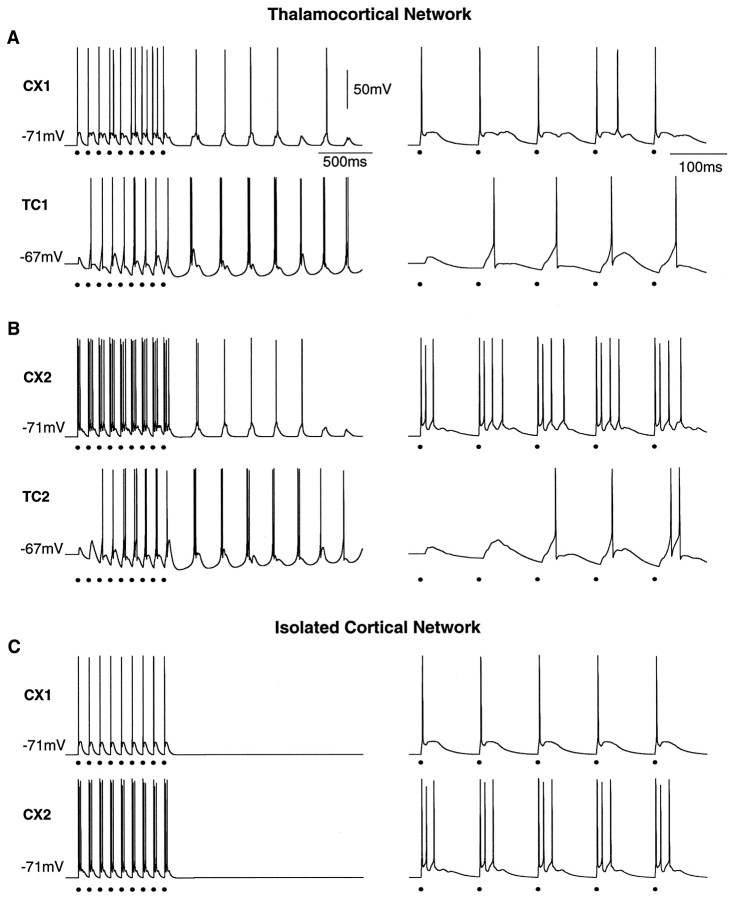
A network with four one-dimensional chains of RE, TC, CX, and IN cells (Fig. 1C) was analyzed to determine the influence of geometry on the augmenting responses in the cortical CX and IN cells. Repetitive 10 Hz stimulation of RE-TC cells at 100% intensity and CX-IN cells at 10% intensity led to the augmentation of the responses in the TC, CX, and IN layers during the first three or four stimuli (Fig. 6). The number of spikes per burst and the number of cells firing action potentials increased. Nearly all of the cells fired after the second stimulus. In a larger network, the size of the active region increased gradually during a long train of stimuli, leading to more gradual growth of the secondary EPSPs in CX cells.
Fig. 6.
Thalamocortical augmenting responses in a chain with 27 × 4 RE-TC-CX-IN cells in response to thalamic stimulation. A, 10 Hz train of stimuli for 1 sec. Both RE and TC cells were stimulated at 100% maximal intensity, and CX-IN cells were stimulated with 10% of maximal intensity. The intensity of stimulation was maximal at the center of the network and decayed exponentially with distance from the center. B, Expanded traces from A between t = −50 msec and t = 500 msec. The first four shocks in the train of nine shocks evoked a low-threshold augmenting response in the TC cells and an increasing number of spikes in CX cells (from 0 or 1 spike to 1–3 spikes) and IN cells (from 1–3 spikes to 3 or 4 spikes). Slow (∼3 Hz) post-stimulus oscillations in the RE-TC network are echoed in the CX-IN cells. These oscillations terminated after four or five cycles as the spiking of the neurons in the network desynchronized (gAMPA = 0.1 μS between CX cells, gAMPA = 0.1 μS from CX to IN, gAMPA = 0.1 μS from CX to TC, gAMPA = 0.2 μS from CX to RE, gGABAA = 0.03 μS from IN to CX, gAMPA = 0.08 μS from TC to CX, and gAMPA = 0.03 μS from TC to IN).
It is worth noting that three layers of the network (TC, CX, and IN) displayed a similar augmentation during the train of stimuli, although with quite different patterns of spiking. However, the spikes in TC cells preceded the action potentials in CX-IN cells. In contrast, RE cells displayed a powerful response to the first stimulus that decremented in response to the second stimulus. The partial inactivation of the low-threshold Ca2+ current in RE cells reduced LTSs (for details, see Bazhenov et al., 1998). Starting from the second stimulus, the RE cells responded with a slowly augmenting response evoked by increasing TC-evoked EPSPs.
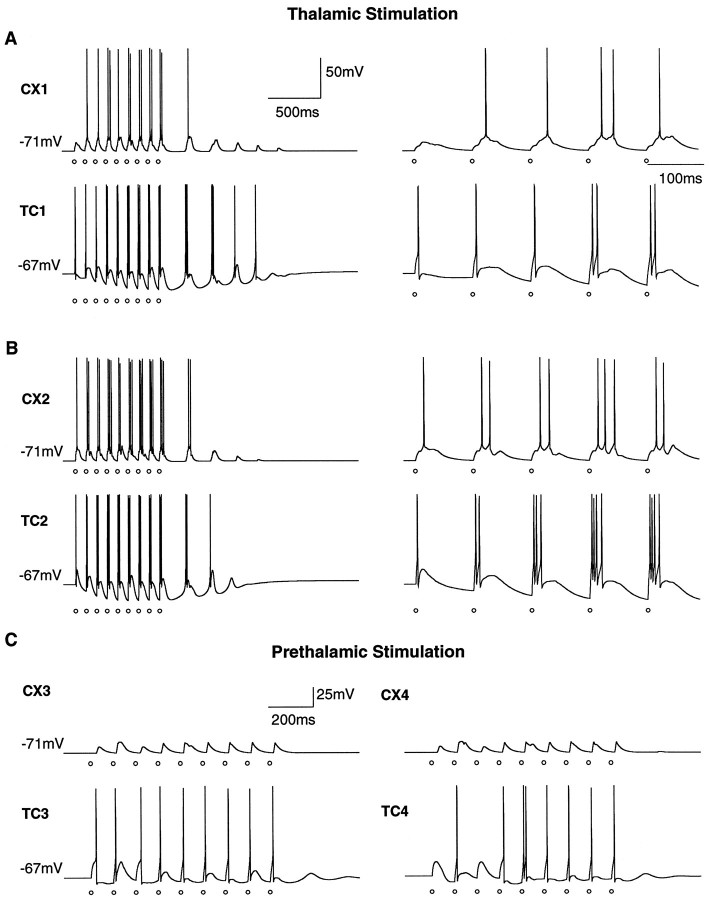
Figure 7, A and B, shows expanded traces of two TC-CX pairs with different locations in the network. The first pair was located near the boundary of thalamocortical network. The intensity of stimulation was low for these cells, and the TC cells displayed almost stereotyped single spike responses for the first three stimuli in the train. However, the fourth EPSP was followed by an LTS leading to additional Na+ spike. The CX cells displayed a two-component EPSP for the first shock, in which the second component was a result of the spike bursts in the TC cells. During a train of stimuli, the growth of the secondary EPSPs in the CX cells led to a progressively increasing number of spikes per burst (up to two spikes).
Fig. 7.
Comparison of augmenting responses in the thalamocortical (RE-TC-CX-IN) network evoked by intrathalamic (RE-TC) and prethalamic (TC only) stimulation. The responses to the first five stimuli are shown on the right on an expanded time scale. A, B, Two CX and two TC cells from an intact thalamocortical network during 10 Hz intrathalamic stimulation. CX cell responses have two components: the first EPSP is stereotyped, and the augmentation of the second EPSP depends on the position of the cell in the network. A, Far from the center of the network, the TC cell receives low-intensity stimulation and displays a weak augmenting response. The secondary EPSPs in the corresponding cortical cells were smaller, and the augmenting response was delayed. B, TC cells near the center of stimulation had strong augmenting responses that induced fast augmentation of CX responses during a train of stimuli. C, Two TC and two CX cells during weak prethalamic stimulation (gext = 0.145 μS). The stereotyped single-spike responses of TC cells elicited nonaugmenting EPSPs in CX cells. Open circles indicate the time of thalamic stimulation.
The second pair of TC-CX cells was located closer to the center of the network. More powerful stimulation led to action potentials starting from the first stimulus. Both CX and TC cells from this pair displayed stronger augmenting responses (up to four spikes in TC and up to three spikes in CX cells) compared with the cells from the first pair (up to three spikes in TC and up to two spikes in CX cells).
The train of stimuli was followed by a few cycles of slow oscillations at ∼3 Hz. These oscillations were of thalamic origin (for details, see Bazhenov et al., 1998) and terminated as a result of desynchronization in the network.
Comparison of the low-threshold augmenting responses displayed by TC cells in an intact thalamocortical (RE-TC-CX-IN) network and after removal of the cortical (CX-IN) population revealed that the augmenting responses were weaker after “decortication” (Bazhenov et al., 1998). During intrathalamic stimulation the activation of the thalamocorticothalamic loop reinforced burst discharges in RE cells and could shift the balance between synaptic excitation and RE-evoked inhibition in TC cells toward inhibition. This could favor the low-threshold type of augmenting response over the high-threshold type. Therefore, in some circumstances the cortical network may contribute to developing augmenting responses during repetitive stimulation.
Stereotyped responses in a chain of RE-TC-CX-IN cells in response to prethalamic stimulation of the projection pathways
The responses of the RE-TC-CX-IN network to intrathalamic stimulation are shown in Figures 6 and 7, A, and B. To model a stimulus, AMPA receptors were activated simultaneously on RE and TC cells at 100% intensity and CX-IN cells at 10% intensity. A train of stimuli produced augmenting responses in TC and CX cells in good agreement with the in vivo data (Fig.3).
In contrast, after 10 Hz prethalamic brachium conjunctivum stimulationin vivo, VL cells displayed monosynaptic responses and only an occasional fast spikes (Fig. 2). Simultaneous recording from CX cells in area 4 revealed EPSPs with variable amplitude and no augmentation during the entire train of stimuli.
The effects of prethalamic stimulation on a chain of RE-TC-CX-IN cells were modeled by low-intensity stimulation of TC cells alone. Figure7C shows the responses of two TC-CX pairs from the chain. The TC cells displayed stereotyped single-spike responses during the entire train of stimuli. The lack of augmentation can be explained by weak one- or two-spike responses in the RE cells, which were unable to elicit the GABAB IPSPs in TC cells. The nonaugmented responses of TC cells evoked almost stereotyped EPSPs in the CX. In comparison, AMPA stimuli delivered simultaneously to TC and RE cells with the same low amplitude led to weak but augmenting responses in TC and CX cells (data not shown). Thus, the absence of RE stimulation at low intensities could explain the absence of augmenting responses both in TC and CX cells (Bazhenov et al., 1998).
Augmenting responses in a chain of RE-TC-CX-IN cells in response to cortical stimulation
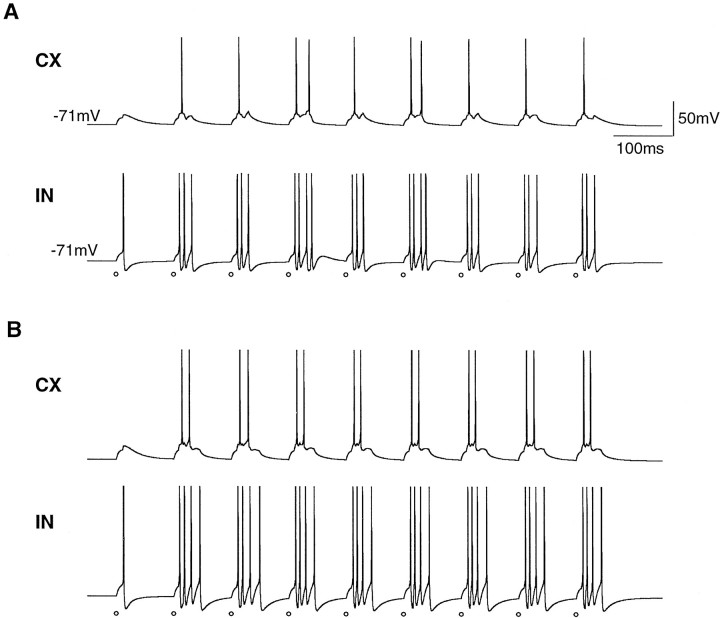
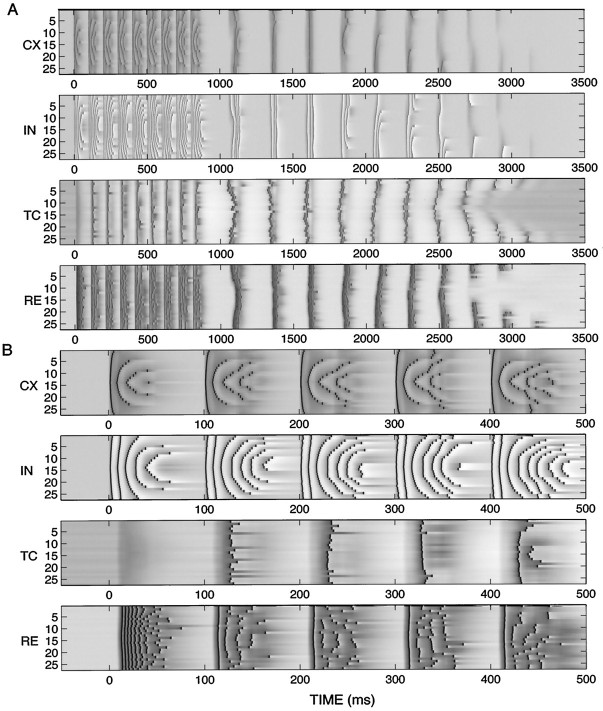
Repetitive thalamic stimulation results in augmenting responses of CX and IN cells because of the enhancement of TC-evoked EPSPs in these cells. Based on these results, repetitive cortical stimulation in the presence of a CX→TC→CX loop should lead to augmenting responses in CX cells. The simulations in Figure8 confirm this suggestion. The stimuli were delivered simultaneously to the CX and IN cells. The first four shocks in the train led to growing responses in the CX (from one to three to one to four spikes), IN (from three to five to four to eight spikes) and TC cells (from zero to one or two spikes). Figure9, A and B, shows expanded traces of two TC-CX pairs from the network presented in Figure8. The same CX cells after removing of RE-TC network are shown in Figure 9C.
Fig. 8.
Thalamocortical augmenting responses in a chain of 24 × 4 RE-TC-CX-IN cells in response to cortical stimulation of both the CX and IN cells. A, 10 Hz train of stimuli for 1 sec. The intensity of stimulation was maximal at the center of the network and decayed exponentially with distance from the center. B, Expanded traces from A between t = −50 msec and t = 500 msec. The RE-TC network elicited low-threshold augmenting responses (up to two spikes in TC cells). Action potentials of TC cells produced increasing secondary EPSPs in CX cells. The train of stimuli was followed by prolonged (up to 9 cycles) oscillations at ∼3 Hz (gAMPA = 0.1 μS between CX cells, gAMPA = 0.1 μS from CX to IN, gAMPA = 0.1 μS from CX to TC, gAMPA = 0.2 μS from CX to RE, gGABAA = 0.03 μS from IN to CX, gAMPA = 0.08 μS from TC to CX, and gAMPA = 0.03 μS from TC to IN).
Fig. 9.
Comparison of augmenting responses in the thalamocortical network (RE-TC-CX-IN) in response to cortical stimulation and comparison with an isolated cortical network (CX-IN). The responses to the first five stimuli are shown on theright on an expanded time scale. Two CX and two TC cells from intact an thalamocortical network during 10 Hz stimulation are shown. A, Direct cortical stimulation evoked single-spike responses in the CX cells far from the center of the network. B, Responses of a CX cell near the center of the network. Augmentation of the TC responses produced a growing secondary EPSP in the cortical cell and additional fast spike. C, Stereotyped responses of the same CX cells after removing the thalamic (RE-TC) network. Filled circles indicate the time of cortical stimulation.
The stimulation of cortical AMPA responses in CX and IN cells resulted first in one to three spike responses in the CX cells. Activation of CX→RE and CX→TC synapses evoked monosynaptic EPSPs followed by disynaptic IPSPs in TC cells. After the first shock, the CX-evoked EPSPs did not lead to action potentials in the TC network (Fig. 8). However, RE-evoked hyperpolarization of TC cells deinactivated the low-threshold Ca2+ current in TC cells, and after a second stimulus, the CX-evoked EPSPs were followed by LTSs and single-spike responses in some of TC cells. These responses evoked secondary EPSPs in CX cells that grew during the train of stimuli. The secondary EPSPs in the CX cells arrived when the CX cells still were depolarized after stimulus-evoked monosynaptic EPSPs (Fig.9A,B, expanded traces). This explains the robust effects of these relatively weak TC-evoked EPSPs. The same CX cells displayed only stereotyped responses when “thalamic-lesioned” networks were stimulated (Fig. 9C).
The strength of the cortical augmenting responses depends on the position of the cells relative to the center of stimulation. The CX cells near the center (Fig. 9B) displayed powerful (three-spike) responses to the stimulus-evoked EPSPs and augmentation up to four spikes during the train of stimuli. Another CX cell located near the boundary (Fig. 9A) obtained weaker stimulation from both the external electrode and TC cells and displayed weak augmenting responses (one or two spikes).
Mechanisms underlying augmenting responses in cortical neurons distant from the site of stimulation
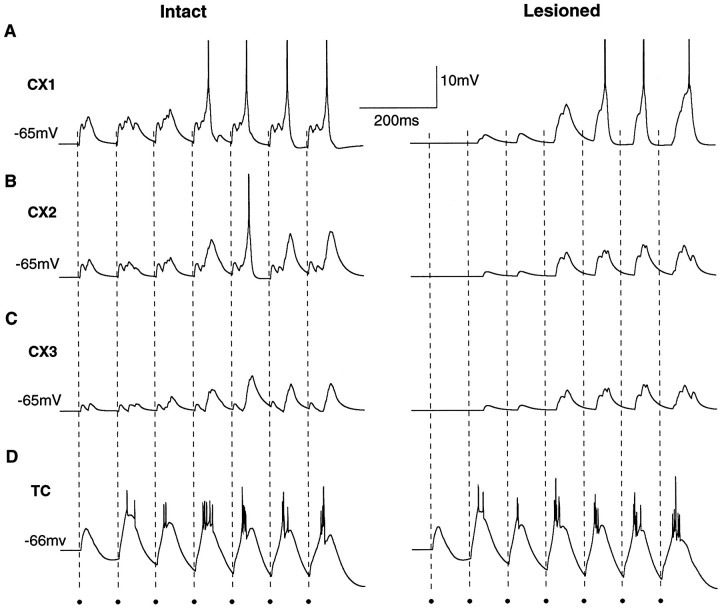
Repetitive 10 Hz stimulation of the cortical cells (CX, IN) induced augmenting responses in these cells through corticothalamocortical (CX→TC→CX) feedback. In the intact brain the intralaminar thalamic nuclei send widespread projections to cerebral cortex (Jones, 1985). This suggests that the corticothalamocortical loop could also induce augmenting responses in cortical areas remote from the site of stimulation. To test this hypothesis, we stimulated only half of a cortical network. Figure10, A–C, shows the responses of the three cortical cells from the nonstimulated half of a cortical network. Figure 10D shows the average response of the TC cells contributing to the secondary EPSPs in these CX cells. Two models were examined: one with intact lateral connections between the two halves of the cortical network and the same model with the lateral connections lesioned (Fig. 10). In the former case, the CX cells displayed strong monosynaptic EPSPs starting with the first stimulus in the train. The fast response arose from lateral AMPA connections from the CX cells in the directly stimulated half of the cortical network. These EPSPs disappeared after the lateral interconnections were lesioned between CX cells in the two halves of the network.
Fig. 10.
The influence of the CX-TC-CX loop on the augmenting responses in cortical neurons distant from the site of stimulation. Repetitive 10 Hz stimulation of half of the cortical network (CX-IN cells from 1–13) produced augmenting responses of the CX cells from the second half of the cortical network: A, CX cell 15; B, CX cell 16; C, CX cell 17. Responses from an intact thalamocortical model shown on the left.Secondary EPSPs in CX cells were from activation of the lateral (CX→CX) and corticothalamocortical (CX→TC→CX) connections. Lesion of the lateral connections between the two halves of the cortical network eliminated the initial EPSPs in CX cells as shown on theright. D, The averaged responses of the TC cells contributing to the EPSPs in the CX cells shown in A–C (TC cells 7–25). Filled circles indicate the time of cortical stimulation (gAMPA = 0.1 μS between CX cells, gAMPA = 0.1 μS from CX to IN, gAMPA = 0.1 μS from CX to TC, gAMPA = 0.2 μS from CX to RE, gGABAA = 0.03 μS from IN to CX, gAMPA = 0.1 μS from TC to CX, and gAMPA = 0.03 μS from TC to IN).
In both networks, the CX cells displayed secondary EPSPs starting from the second stimulus in the train. These EPSPs arose from the CX→TC→CX loop that was activated when some of TC cells responded with action potentials for CX-evoked stimulation (Fig. 10D). The growth of the secondary EPSPs in the nonstimulated half of the cortical network occurred because there were more spikes per burst in the TC cells and more TC cells were recruited to fire action potentials. The second effect was more prominent in this experiment because the weak CX-evoked EPSPs in TC cells limited the number of spikes in TC responses to only one or two.
These results show how the thalamic network, through the activation of TC cells, could produce augmenting responses in spatially distant cortical areas.
The impact of progressive disfacilitation on cortical augmenting responses
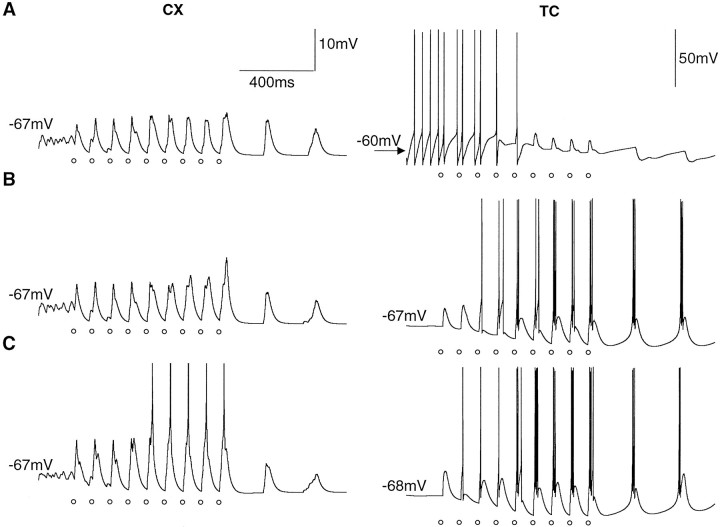
TC cells recorded in vivo in anesthetized animals are hyperpolarized in comparison with the awake state, which reduces their tonic firing, but they nonetheless fire action potentials (Contreras and Steriade, 1995; Timofeev and Steriade, 1996, 1997). The summation of excitatory inputs from spontaneously firing TC cells depolarizes cortical neurons. To model this effect, a constant current was applied to depolarize 50% of the TC cells chosen randomly, enough to evoke spontaneous firing. This depolarized the CX cells on average ∼4 mV. Because of the limited size of the thalamic network in our model, a relatively high frequency of spontaneous firing was required to produce the depolarizing input to the cortex. During in vivoexperiments, the same level of cortical depolarization could be achieved by lower-frequency firing in a larger population of TC cells.
Figure 11 shows the responses of three CX and three related TC cells drawn from a thalamocortical network. The first TC cell (Fig. 11A) was depolarized and fired spontaneously before the stimulation began. The membrane potential of the CX cells before stimulation was approximately −67 mV, and the fluctuations evoked by the nonsynchronous TC-evoked EPSPs is apparent. The first stimulus in the train evoked a small EPSP in some TC cells and action potentials in others. Synchronous TC-evoked EPSPs also elicited spike bursts in RE cells and GABAA–GABAB feedback inhibition, which hyperpolarized the TC cells. The inhibition spread to TC cells that were firing spontaneously, which reduced their contribution to the depolarizing input to the cortex, a form of disfacilitation (Fig.11A, right panel). As a result, CX cells displayed a hyperpolarization immediately after the first shock attributable both to disfacilitation and to GABAA IPSPs (Fig. 11, left column). The disfacilitation mechanism is corroborated by experimental data in vivo (Contreras et al., 1996; Timofeev et al., 1996).
Fig. 11.
Thalamocortical augmenting responses during a train of 10 Hz stimuli in the presence of spontaneous TC-evoked depolarization of the cortical network. Both RE and TC cells were stimulated. A, CX and TC cells far from the center of stimulation. B, CX and TC cells at an intermediate distance. C, CX and TC cells close to the center of stimulation. The EPSPs is the CX cells augmented despite hyperpolarization from disfacilitation of the spontaneous TC-evoked depolarization that began before the train of stimuli. Open circles indicate the time of thalamic stimulation (gAMPA = 0.1 μS between CX cells, gAMPA = 0.1 μS from CX to IN, gAMPA = 0.1 μS from CX to TC, gAMPA = 0.2 μS from CX to RE, gGABAA = 0.03 μS from IN to CX, gAMPA = 0.05 μS from TC to CX, and gAMPA = 0.03 μS from TC to IN).
The second thalamic stimulus evoked an even larger RE-evoked hyperpolarization in the TC cells, which produced low-threshold augmenting responses in some cells (Fig. 11C). The growth of TC-evoked EPSPs was sufficiently rapid to elicit an augmenting response in CX cells despite the tonic hyperpolarization. This effect was larger in CX cells near the center of the network (Fig. 11C) than in cells near the boundary (Fig. 11A). As a consequence of the progressive hyperpolarization of all of the TC cells during the train of stimuli, spontaneous firing ceased after the train, and the membrane potentials of the CX cells were lower than before the stimulation.
Influence of intracortical synaptic conductances on augmenting responses
The previous results from the simple circuit of four RE-TC-CX-IN cells demonstrated that the cortical network affects the development of cortical augmenting responses through intrinsic mechanisms. These results need to be confirmed in the chain of coupled RE-TC-CX-IN cells, and the influence of intracortical and thalamocortical synaptic conductances needs to be more closely examined.
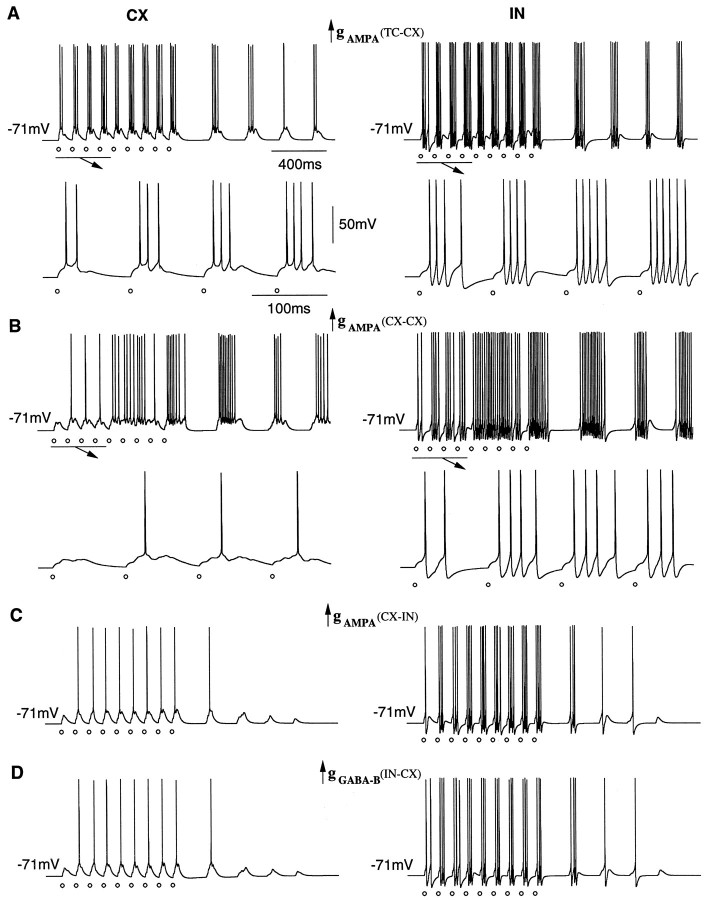
Figure 12 shows the response of one arbitrarily selected pair of CX-IN cells during repetitive 10 Hz stimulation of RE-TC cells at 100% intensity and CX-IN cells at 10% intensity. The augmenting responses of the CX cell with “standard” values of synaptic conductances are shown in Figure 7A. In the four-cell RE-TC-CX-IN network, increase of the maximal conductance for the afferent TC→CX connections reinforced the augmenting responses (Fig. 5A). In the four-layer chain (Fig.12A), increase of the TC-evoked secondary EPSPs in CX and IN cells produced exaltation of the augmenting responses of up to four additional spikes in CX cells and six spikes in IN cells. The duration of poststimulus oscillations accompanied by Na+spikes in CX and IN cells was also prolonged (compare Figs.12A, 7 A).
Fig. 12.
Effect of the intracortical synaptic connections on the augmenting responses in cortical cells. One CX-IN pair from a network of 27 × 4 cells is shown during repetitive 10 Hz stimulation. Parameters are the same as in Figure 7A except as noted below. A, Increase of TC-evoked EPSPs in CX and IN cells produced enhancement of the cortical augmenting responses (compare A, Fig. 7A) (gAMPA = 0.15 μS from TC to CX cells). B, Enhancement of the lateral excitation evoked strong depolarization in the CX cell after the fifth stimulus and transformed the CX responses to tonic firing (gAMPA = 0.15 between CX cells). C, Increase of CX evoked EPSPs in IN cells enhanced responses in these cells and reduce augmenting responses in CX cells (gAMPA = 0.15 μS from CX to IN cells). D, Weak GABAB inhibition progressively hyperpolarized the CX cells after four or five shocks. This weakened the augmenting responses in CX cells (compare D, Fig.7A) (gGABAB = 0.01 μS from IN to CX cells). Open circles indicate the time of thalamic stimulation.
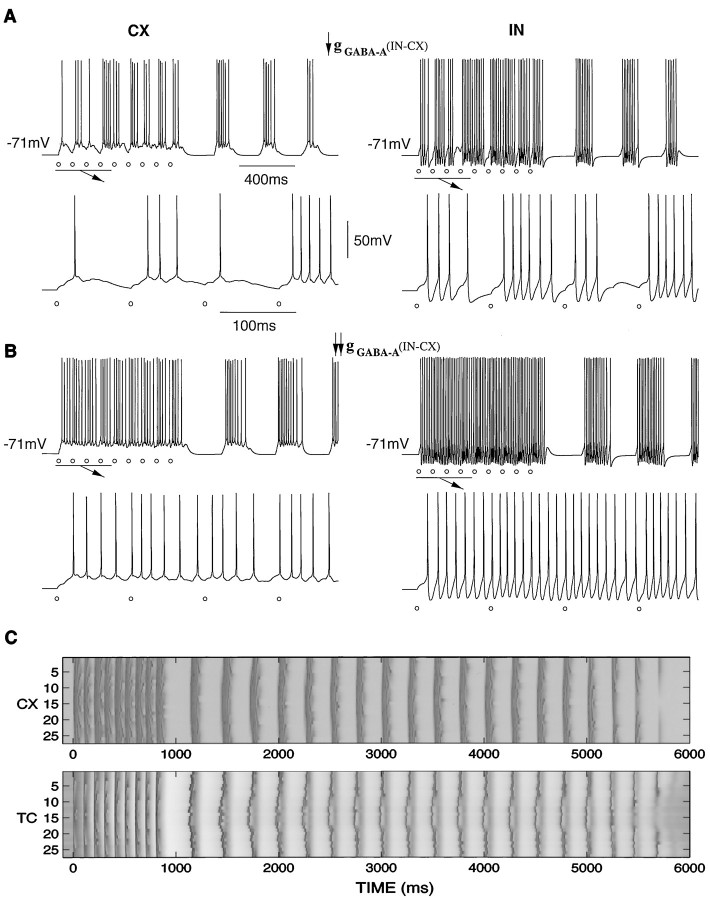
The influence of lateral AMPA excitation between CX cells is shown in Figure 12B. Increasing the maximal conductance of AMPA CX→CX synapses had only a small effect on the augmenting responses during the first four stimuli but had a major effect during second half of the train. Starting with the fifth stimulus, the CX cells became strongly depolarized and produced tonic firing. The strong excitatory input from CX cells to IN cells also evoked tonic firing in IN cells during last five stimuli in the train. The frequency of sodium spikes in CX and IN responses was, however, much less than when the TC→CX conductances were increased (Fig. 12, compare A, B) .
The influence of synaptic interconnections between CX and IN cells on augmenting responses is shown in Figs. 12, C and D, and 13. The strong increase in the CX→IN AMPA conductance (Fig. 12C) intensified IN-evoked IPSPs in CX cells and reduced the augmenting responses in CX cells by at most one less spike (compare Figs.12C, 7A). An increase of IN responses might be expected to reduce CX activity even more, but because of the delay in the arrival of the IN-evoked GABAA IPSPs on CX cells, the inhibition was not fast enough to reduce the single-spike responses of CX cells (data not shown).
Fig. 13.
Influence of intracortical IN→CX inhibition on thalamocortical augmenting responses. A, B, CX-IN pair responding to a repetitive 10 Hz stimulation (Fig. 7A). Parameters are the same as in Fig. 7A, except as noted below. A, Decreasing the IN-evoked inhibition produced strong augmentation of CX responses (from 1 to 3–5 spikes) accompanied by progressive depolarization of the membrane potential (gGABAA = 0.01 μS from IN to CX cells). B, Weak inhibition produced strong depolarization during a train of stimuli and elicited tonic firing in CX cells that terminated after the train (gGABAA = 0.005 μS from IN to CX cells). C, Shift in the balance between excitation and inhibition in CX cells toward excitation accompanied by strengthening of the afferent TC→CX synaptic connections prolonged the slow poststimulus oscillations (compare C, Fig. 7A) (gGABAA = 0.01 μS from IN to CX cells, and gAMPA = 0.014 μS from TC to CX cells). Open circles indicate the time of thalamic stimulation.
Although GABAB IPSPs are prominent in neocortical slice preparations (Avoli, 1986; Connors et al., 1988), GABAB is only a minor component in vivo (Contreras et al., 1996) and was not included in the “standard” model of the CX-IN network. Here we examine the influence of weak IN-evoked GABAB inhibition on augmenting responses in CX cells. Figure 12D shows the responses of a pair of CX-IN cells during repetitive stimulation in the presence of a weak IN→CX GABAB conductance. Relatively weak burst discharges in IN cells produced slow activation of the GABAB responses whose influence became apparent only after the fourth or fifth stimulus. After several shocks the GABAB hyperpolarization of the CX cell was strong enough to eliminate one spike per burst in comparison with the “control” model (compare Figs. 12D, 7A). The decrease in the number of spikes per response was accompanied by growth of the secondary (TC-evoked) EPSPs in CX cells.
Altering the synaptic conductances of most cortical synapses affected the augmenting responses in the cortical cells by adding or removing a few spikes from CX-IN responses. The only exception so far has been the depolarization and tonic firing of CX cells caused by an increase in the excitatory lateral CX→CX connections. Figure 13 shows a strong enhancement of CX responses of up to four or five spikes during a train of stimuli when the IN→CX GABAA inhibition was decreased. This enhancement was accompanied by the progressive depolarization of the membrane potential in CX cells (Fig. 13A). Further reduction of IN→CX GABAA conductances transformed the well separated spike bursts in the CX cells to almost continuous prolonged burst discharges (Fig. 13B).
The strong enhancement of the augmenting response of CX neurons in this simulation was a consequence of the lateral CX→CX AMPA excitation unrestrained by GABAA inhibition from IN cells. This explains why the response patterns after reducing IN→CX inhibition (Fig. 13) and after increasing CX→CX excitation were so similar (Fig.12B). This enhancement is a network effect that was not observed in the model having only a single CX cell. Note that these paroxysmal responses in CX cells occurred despite strong augmentation of the high-frequency spike bursts in IN cells.
The shift of the balance between IN-evoked inhibition and CX-evoked excitation toward excitation changed the character of the poststimulus slow oscillations. The duration of the oscillations doubled from <1 sec in the original model (Fig. 7A) to nearly 2 sec (Figs.12A, 13), whereas the TC-evoked EPSPs in CX cells became crowned with Na+ spikes. When the afferent TC→CX connection strengths were increased and the intracortical IN→CX were decreased simultaneously, a train of stimuli evoked fast augmentation of CX responses that were quickly transformed to tonic firing, and the duration of poststimulus oscillations was increased up to 5 sec (Fig.13C). Thus, for some combinations of these parameters, augmenting responses may be transformed to long-lasting paroxysmal responses involving both CX-IN and RE-TC networks.
Augmenting responses in a thalamocortical model with three types of cortical cells
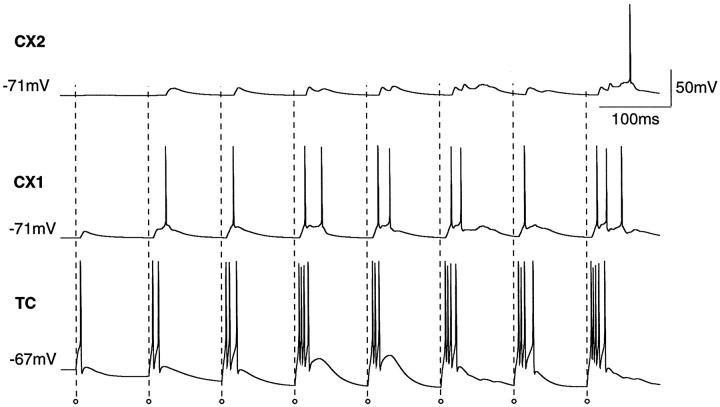
In the standard cortical model there are only two layers of cortical cells: excitatory regular-spiking cells and inhibitory fast-spiking cells in which the cortical CX cells receive inputs from TC cells and project back to both the RE and TC cells. Repetitive thalamic stimulation resulted in a gradual increase in the number of spikes per burst in the CX and IN cells. Consider now a cortical network with two layers of cortical excitatory cells and one layer of inhibitory cells. The cortical cells in the first excitatory layer (CX1), which corresponded with layer 4 of cortex, received inputs from TC cells and had AMPA synapses on IN cells and on the excitatory cells of the second layer (CX2), which projected back to RE and TC cells and corresponded to corticofugal cells in layer 6. The IN cells provide GABAA feedback inhibition to the CX1 (“input”) cells and feedforward inhibition for the CX2 (“output”) cells.
Figure 14 shows the responses of two cortical cells from different excitatory layers of a chain of coupled RE-TC-CX1-CX2-IN cells during repetitive 10 Hz thalamic stimulation. Both CX1 and CX2 cells displayed gradual augmenting responses. However, augmentation was much stronger for the CX1 cell in the input layer (from zero to three spikes) than for the CX2 cell of the output layer (from zero to one spike) because the feedforward IN-evoked inhibition reduced the CX1-evoked EPSPs in output layer. The burst discharges in TC cells evoked simultaneous AMPA EPSPs in CX1 and IN cells. IN-evoked GABAA IPSPs arrived at the CX1 cells with one synaptic delay and reduced the length of the spike bursts in these cells (see previous section). However, the same IPSPs arrived at the deep layer simultaneously with CX1-evoked EPSPs and had a much stronger inhibitory effect on CX2 cells than on CX1 cells. This model predicts a rapid buildup of powerful augmenting responses in deep layers of the cortex compared with superficial layers (Castro-Alamancos and Connors, 1996a;Kandel and Buzsáki, 1997).
Fig. 14.
Augmenting responses in a thalamocortical network model that included two layers of cortical cells. One pair of cortical cells from the two layers and one TC cell are shown during 10 Hz cortical stimulations. CX1 is an input cell receiving direct TC connections, and CX2 is an output cell sending connections to the thalamus. The CX2 cell had a reduced augmenting response compared with the CX1 cells because of the feedforward IN-evoked inhibition. Open circles indicate the time of thalamic stimulation (gAMPA = 0.1 μS between CX1 cells and CX2 cells, gAMPA = 0.1 μS from CX1 to CX2 and from CX2 to CX1, gAMPA = 0.03 μS from CX1 to IN and from CX2 to IN, gGABAA = 0.06 μS from IN to CX1 and IN to CX2, gAMPA = 0.1 μS from CX2 to TC, gAMPA = 0.2 μS from CX2 to RE, gAMPA = 0.11 μS from TC to CX1, and gAMPA = 0.03 μS from TC to IN).
Augmenting responses in a two-dimensional thalamocortical network
The one-dimensional chain of RE-TC-CX-IN cells used in previous simulations may not capture the dynamics of neurons arranged in two-dimensional sheets, as found in the cortex. Here we study a two-dimensional four-layer network consisting of 27 × 27 arrays of RE, TC, CX, and IN cells.
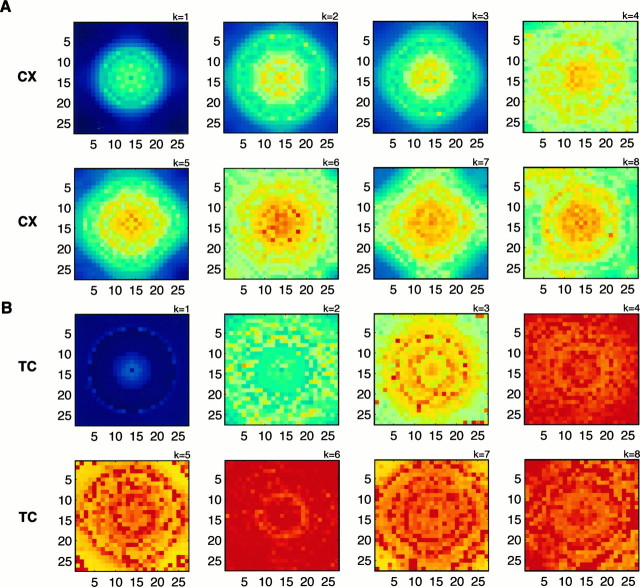
Repetitive 10 Hz intrathalamic stimulation produced augmenting responses in the two-dimensional model. The average membrane potential between two consequent stimuli ( i,j, see Materials and Methods) is shown for the CX cells in Figure15A and for the TC cells in Figure 15B. Repetitive thalamic stimulation produced progressive augmentation of both the TC and CX responses during first four stimuli in the train. The number of spikes was increased from zero or one spike to one to three spikes for CX cells and to three or four spikes for TC cells; by the fourth stimulus almost the entire network was generating spikes.
Fig. 15.
Thalamocortical augmenting responses in a two-dimensional thalamocortical network with 27 × 27 × 4 RE-TC-CX-IN cells in response to thalamic stimulation. Both RE and TC cells were stimulated at 100% of maximal intensity, and the CX-IN cells were stimulated with 10% of maximal intensity by the train of eight shocks (gAMPA = 0.1 μS between CX cells). The intensity of stimulation was maximal at the center of the network and decayed exponentially with distance from the center. Each panel displays the average depolarization i,j(k) (see Materials and Methods) (i, j = 1, … , 27) in the CX or TC networks after a stimulus in the train (k = 1, … , 8). The values of i,j(k) are coded by color, ranging from 2 mV (blue) to 25 mV (red) for TC cells (A) and from 2 mV (blue) to 12.5 mV (red) for CX cells (B) (gAMPA = 0.1 μS between CX cells, gAMPA = 0.1 μS from CX to IN, gAMPA = 0.1 μS from CX to TC, gAMPA = 0.2 μS from CX to RE, gGABAA = 0.03 μS from IN to CX, gAMPA = 0.07 μS from TC to CX, and gAMPA = 0.03 μS from TC to IN).
Secondary EPSPs in the CX cells were preceded by spike bursts in the TC cells (data not shown), which displayed a low-threshold intrathalamic augmenting response that accounted for the enhancement of the CX responses. There was a direct link between the strengths of the augmenting responses in the CX and TC cells. The variability in the parameters of the TC and RE cells accounted for the heterogeneity of the observed TC activity, which was the source of heterogeneity for the CX responses.
In both the TC and CX cells the strength of the augmenting responses depended on the distance of a cell from the center of stimulation. The cells located close to the center of stimulation displayed faster augmentation during repetitive stimulation compared with the delayed augmenting responses at the boundary cells. Note that the action potentials made only a small contribution to the values of i,j. The growth of i,j was caused primarily by the enhancement of the secondary EPSPs in the CX cells or by a combination of the increasing EPSPs and LTSs for TC cells rather than by the increase in the number of spikes per response. This may explain why the i,j values for central and boundary cells were so similar (Fig. 15). The train of stimuli was followed by a few cycles of slow (∼3 Hz) poststimulus oscillation (data not shown).
Thus, the two-dimensional model displayed augmenting responses during repetitive stimulation that were qualitatively similar to the one-dimensional model, suggesting that augmenting responses occur independently of the detailed patterns of connectivity.
DISCUSSION
Cortical augmenting responses during repetitive thalamic stimulation
In vivo recordings from the sensory and motor cortices of cats under barbiturate or ketamine–xylazine anesthetic have revealed that cortical augmenting responses during repetitive stimulation of the dorsal thalamus were preceded by low-threshold augmenting spike bursts in TC cells (Steriade et al., 1998). The secondary EPSP components in cortical cells increased, whereas the primary component of the cortical EPSPs diminished during a train of stimuli. The thalamocortical network model analyzed in this paper shows that the main source of cortical augmenting responses may be thalamic (Bazhenov et al., 1998; Timofeev and Steriade, 1998).
The low-threshold intrathalamic augmenting response in the model during repetitive RE-TC stimulation depended on the hyperpolarization of the TC cells by RE-evoked IPSPs, which deinactivated the low-threshold Ca2+ current in TC cells and enhanced the LTSs. Burst discharges in TC cells activated the TC→CX AMPA receptors, and as these secondary EPSPs grew during intrathalamic augmentation, cortical spike bursts were elicited. The primary cortical EPSPs in the model were elicited by a weak monosynaptic activation of the TC→CX connections. The amplitude of primary EPSP components in the model did not decrease as observed in vivo. The reduction of the primary EPSP component could reflect a decrease in the CX input resistance, in part through partial activation of GABA receptors, consistent with the hyperpolarization observed in cortical cells after the first stimulus.
Although the intrathalamic mechanism that generated the cortical augmenting responses was highly robust to the parameters governing intracortical interactions, the pattern of augmenting responses depended strongly on the balance between IN-evoked inhibition and CX-evoked excitation in the CX cells. A shift toward excitation transformed the spike bursts in CX neurons from well separated bursts to more powerful burst discharges riding on a slow wave of depolarization and to tonic firing after several shocks (Figs. 12,13).
Intracellular recordings from cortical cells during augmenting responses evoked by thalamic or cortical stimuli in vivooften show a hyperpolarization starting from the first stimulus in the train, which is the result of GABAA IPSPs and disfacilitation (Contreras et al., 1996; Timofeev et al., 1996;Steriade et al., 1998). The activation of the GABABsynaptic connections from IN to CX cells can contribute to such a hyperpolarization. However, in simulations GABAB-mediated hyperpolarization started from the third or fourth stimulus (Fig. 12). Another possible mechanism contributing to the hyperpolarization of CX cells is removal of tonic depolarizing input from the thalamus. Ongoing firing of TC cells in the model activated AMPA receptors on CX cells and produced an average depolarization of 4–6 mV. The burst discharges in RE neurons after the first thalamic stimulus elicited GABAA–GABAB IPSPs in TC cells, which immediately terminated the spontaneous firing in TC cells and hyperpolarized the cortical CX-IN network as observed during the slow (<1 Hz) oscillations (Steriade et al., 1993a–c). The low-threshold augmentation of TC responses after the next stimulus led to increased EPSPs in CX cells (Fig. 11).
Prethalamic stimulation of the projection pathways
Consistent with the absence of spindles when prethalamic stimuli are used, compared with the powerful spindle oscillations evoked by corticothalamic stimulation (Steriade et al., 1972; Steriade, 1984), augmenting responses were not observed during 10 Hz prethalamic stimulation of the brachium conjunctivum in simultaneous intracellular recordings from TC cells in VL thalamus and CX cells in area 4. This form of stimulation produced an exclusively monosynaptic input to TC cells, which may account for the absence of an augmenting response (Bazhenov et al., 1998). In the model, low-intensity stimulation of TC cells without RE activation led to monosynaptic single-spike responses in TC cells and disynaptic two- or three-spike responses in RE cells that failed to activate low-threshold intrathalamic augmentation. The cortical CX and IN cells displayed stereotyped EPSPs without Na+ spikes. Increasing the maximal conductance of thalamocortical connections enough to produce spikes in CX cells resulted in weak augmentation of TC and CX responses. This occurred because the thalamocortical feedback increased the burst discharges in RE cells, which enhanced the RE-evoked IPSPs in TC cells and led to stronger deinactivation of the low-threshold Ca2+current.
Cortical augmenting responses during repetitive cortical stimulation
In vivo recordings from cortical neurons of anesthetized cats have revealed augmenting responses during repetitive cortical stimulation (Steriade et al., 1998). Our model shows how this type of augmentation could be generated by the low-threshold intrathalamic augmenting responses and corticothalamocortical (CX→TC→CX) loop. Repetitive cortical stimulation led to the spike bursts in cortical cells followed by EPSPs in RE and TC cells. Spike bursts in TC cells activated afferent TC→CX AMPA connections in CX and IN cells. These secondary EPSPs arrived when CX and IN cells were still depolarized after monosynaptic stimulation and therefore had a significant effect. After lesion of the corticothalamocortical connections that interrupt the loop, the cortical cells showed only stereotyped responses to a train of stimuli. In contrast, deleting the direct intracortical connections affected the monosynaptic EPSPs but did not affect the gradual augmenting responses.
There are other purely intracortical mechanisms that may contribute to the augmenting responses of CX cells in the intact cortical network. Our recent intracellular recordings from intact cortex and isolated cortical slabs in cats under ketamine–xylazine or barbiturate anesthesia demonstrate a slight increase of the secondary, slow depolarization and associated spikes during rhythmic stimuli at 10 Hz (M. Steriade, I. Timofeev, and F. Grenier, unpublished data) (Dürmüller et al., 1998). One of the possible intracortical mechanisms of augmentation is based on the short-term depression of intracortical synapses (A. R. Houweling, M. Bazhenov, I. Timofeev, M. Steriade, and T. J. Sejnowski, unpublished data) (Houweling et al., 1998). In in vivo experiments the contributions of intrathalamic and intracortical mechanisms during intracortical stimulation may be studied separately by the lesion of lateral intracortical connections or thalamocortical afferents.
Post-stimulus oscillations
The network model had a tendency to continue with a few cycles of the slow (∼3 Hz) oscillations after a train of stimuli (Bazhenov et al., 1998; Timofeev and Steriade, 1998). These oscillations originated in the thalamus from the interaction of intrinsic and synaptic currents in TC cells and were similar to the delta oscillations that can be generated in isolated TC cells because of the interplay between Ih and IT currents (McCormick and Pape, 1990; Soltesz et al., 1991; Leresche et al., 1991;Steriade et al., 1991). In the network model, however, the activation of Ih current was elicited mostly by RE-evoked IPSPs. The poststimulus oscillations were terminated by desynchronization of the RE-evoked IPSPs in TC cells. An additional mechanism contributing to the termination of the poststimulus oscillations was Ca2+ regulation of Ih current in TC cells (Bal and McCormick, 1996;Lüthi and McCormick, 1997). As the intracellular Ca2+ concentration increased, the persistent activation of the Ih current depolarized the TC cells.
Although the origin of the slow poststimulus oscillation in the cortex is intrathalamic, the cortex enhances them through mechanisms similar to those that are involved in the generation of spindles (Contreras and Steriade, 1996; Contreras et al., 1997). TC-evoked EPSPs evoke burst discharges in cortical CX and IN cells, which, in turn, reinforce the burst discharges in TC cells by direct activation of the CX→TC AMPA receptors and by reinforcing the burst discharges in RE neurons. The latter effect was dominant in our model, because the CX→RE connections were stronger than the CX→TC connections.
The balance between intracortical IN-evoked inhibition and CX-evoked excitation controls not only the augmenting responses during repetitive stimulation but also the slow poststimulus oscillations. A shift toward excitation by either increased excitatory inputs or disinhibition may transform the oscillations to long-lasting paroxysmal responses. The prolonged duration of the poststimulus oscillations shows that the cortex can contribute to the maintenance of synchronized epileptic-like slow oscillations in the thalamocortical network.
Predictions of the models
The thalamocortical network model of augmenting responses analyzed here makes several predictions that can be experimentally tested. First, if the intrathalamic low-threshold mechanism for cortical augmenting responses is correct, then augmentation in cortical pyramidal cells and inhibitory interneurons should occur simultaneously. Second, repetitive cortical stimulation in the model resulted in augmenting responses both locally and in remote areas of the cortical network because of the CX→TC→CX loop and low-threshold intrathalamic augmentation. This suggest that the thalamus may contribute essentially to the augmenting responses of cortical cells during intracortical stimulation, and the long-range augmenting responses should be observed even after lesion of the lateral intracortical connections between stimulated and recorded cortical areas. Third, during intrathalamic stimulation the spike bursts in CX cells could enhance the low-threshold intrathalamic augmenting responses attributable to the activation of the corticothalamical CX→RE connections reinforcing RE-evoked IPSPs in TC cells. If this occurs, then the low-threshold type of augmenting responses should predominate over the high-threshold type when the cortex is intact. This seems indeed to be the case, because in in vivoexperiments the high-threshold type of augmenting response was rarely observed in animals with an intact cortex (Steriade et al., 1998) compared with decorticated animals (Steriade and Timofeev, 1997). Fourth, during intrathalamic stimulation the augmenting responses should arise first and be stronger in cortical layers innervated by thalamocortical inputs. This agrees with previous data (Castro-Alamancos and Connors, 1996a; Kandel and Buzsáki, 1997) and with our recent experimental results (Steriade et al., 1998). Fifth, a shift in the balance between CX-evoked AMPA excitation and IN-evoked GABAA inhibition in the CX cells toward excitation should enhance the responses of cortical cells to thalamic stimulation sufficiently to transform an augmenting response to a longer-lasting paroxysmal discharge. Experiments are under way to test these predictions.
Footnotes
This research was supported by Human Frontier Science Program, The Howard Hughes Medical Institute, The Sloan Center for Theoretical Neurobiology, The Medical Research Council of Canada, and the Savoy Foundation.
Correspondence should be addressed to Maxim Bazhenov, The Howard Hughes Medical Institute, The Salk Institute, Computational Neurobiology Laboratory, 10010 North Torrey Pines Rd., La Jolla, CA 92037.
REFERENCES
- 1.Avoli M. Inhibitory potentials in neurons of the deep layers of the in vitro neocortical slices. Brain Res. 1986;370:165–170. doi: 10.1016/0006-8993(86)91118-2. [DOI] [PubMed] [Google Scholar]
- 2.Bal T, McCormick DA. What stops synchronized thalamocortical oscillations? Neuron. 1996;17:297–308. doi: 10.1016/s0896-6273(00)80161-0. [DOI] [PubMed] [Google Scholar]
- 3.Bazhenov M, Timofeev I, Steriade M, Sejnowski TJ. Cellular and network models for intrathalamic augmenting responses during 10 Hz stimulation. J Neurophysiol. 1998;79:2730–2748. doi: 10.1152/jn.1998.79.5.2730. [DOI] [PubMed] [Google Scholar]
- 4.Castro-Alamancos MA, Connors BW. Spatiotemporal properties of short-term plasticity in sensorimotor thalamocortical pathways of the rat. J Neurosci. 1996a;16:2767–2779. doi: 10.1523/JNEUROSCI.16-08-02767.1996. [DOI] [PMC free article] [PubMed] [Google Scholar]
- 5.Castro-Alamancos MA, Connors BW. Cellular mechanisms of the augmenting response: short-term plasticity in a thalamocortical pathway. J Neurosci. 1996b;16:7742–7756. doi: 10.1523/JNEUROSCI.16-23-07742.1996. [DOI] [PMC free article] [PubMed] [Google Scholar]
- 6.Connors BW, Malenka RC, Silva LR. Two inhibitory postsynaptic potentials, and GABAa and GABAb receptor-mediated responses in neocortex of rat and cat. J Physiol (Lond) 1988;406:443–468. doi: 10.1113/jphysiol.1988.sp017390. [DOI] [PMC free article] [PubMed] [Google Scholar]
- 7.Contreras D, Steriade M. Cellular basis of EEG slow rhythms—a study of dynamic corticothalamic relationships. J Neurosci. 1995;15:604–622. doi: 10.1523/JNEUROSCI.15-01-00604.1995. [DOI] [PMC free article] [PubMed] [Google Scholar]
- 8.Contreras D, Steriade M. Spindle oscillations in a cats: the role of cortico-thalamic feedback in thalamically generated rhythms. J Physiol (Lond) 1996;490:159–180. doi: 10.1113/jphysiol.1996.sp021133. [DOI] [PMC free article] [PubMed] [Google Scholar]
- 9.Contreras D, Curró Dossi R, Steriade M. Electrophysiological properties of cat reticular thalamic neurones in vivo. J Physiol (Lond) 1993;470:273–294. doi: 10.1113/jphysiol.1993.sp019858. [DOI] [PMC free article] [PubMed] [Google Scholar]
- 10.Contreras D, Timofeev I, Steriade M. Mechanisms of long-lasting hyperpolarization underlying slow sleep oscillations in cat corticothalamic network. J Physiol (Lond) 1996;494:251–264. doi: 10.1113/jphysiol.1996.sp021488. [DOI] [PMC free article] [PubMed] [Google Scholar]
- 11.Contreras D, Destexhe A, Sejnowski TJ, Steriade M. Spatiotemporal patterns of spindle oscillations in cortex and thalamus. J Neurosci. 1997;17:1179–1196. doi: 10.1523/JNEUROSCI.17-03-01179.1997. [DOI] [PMC free article] [PubMed] [Google Scholar]
- 12.Crunelli V, Haby M, Jassik-Gerschenfeld D, Leresche N, Pirchio M. Cl- and K+-dependent inhibitory postsynaptic potentials evoked by interneurones of the rat lateral geniculate nucleus. J Physiol (Lond) 1998;399:153–176. doi: 10.1113/jphysiol.1988.sp017073. [DOI] [PMC free article] [PubMed] [Google Scholar]
- 13.Destexhe A, Contreras D, Sejnowski TJ, Steriade M. A model of spindle rhythmicity in the isolated thalamic reticular nucleus. J Neurophysiol. 1994a;72:803–818. doi: 10.1152/jn.1994.72.2.803. [DOI] [PubMed] [Google Scholar]
- 14.Destexhe A, Mainen ZF, Sejnowski TJ. Synthesis of models for excitable membranes, synaptic transmission and neuromodulation using a common kinetic formalism. J Comp Neurosci. 1994b;1:195–230. doi: 10.1007/BF00961734. [DOI] [PubMed] [Google Scholar]
- 15.Destexhe A, Bal T, McCormick DA, Sejnowski TJ. Ionic mechanisms underlying synchronized oscillations and propagating waves in a model of ferret thalamic slices. J Neurophysiol. 1996a;76:2049–2070. doi: 10.1152/jn.1996.76.3.2049. [DOI] [PubMed] [Google Scholar]
- 16.Destexhe A, Contreras D, Steriade M, Sejnowski T, Huguenard JR. In vivo, in vitro, and computational analysis of dendritic calcium currents in thalamic reticular neurons. J Neurosci. 1996b;16:169–185. doi: 10.1523/JNEUROSCI.16-01-00169.1996. [DOI] [PMC free article] [PubMed] [Google Scholar]
- 17.Dürmüller N, Timofeev I, Grenier F, Steriade M (1998) Mechanisms of intracortical augmenting responses. Soc Neurosci Abstr, in press. [DOI] [PMC free article] [PubMed]
- 18.Dutar P, Nicoll RA. A physiological role for GABAB receptors in the central nervous system. Nature. 1998;332:156–158. doi: 10.1038/332156a0. [DOI] [PubMed] [Google Scholar]
- 19.Enright WH, Higham DJ, Owren B, Sharp PW (1995) A survey of the explicit Runge-Kutta method. Available fromftp://ftp.cs.toronto.edu/ pub/reports/na/cs-94-291.ps.Z.
- 20.Ferster D, Lindström S. Augmenting responses evoked in area 17 of the cat by intracortical axonal collaterals of cortico-geniculate cells. J Physiol (Lond) 1985;367:217–232. doi: 10.1113/jphysiol.1985.sp015821. [DOI] [PMC free article] [PubMed] [Google Scholar]
- 21.Hernández-Cruz A, Pape HC. Identification of two calcium currents in acutely dissociated neurons from the rat lateral geniculate nucleus. J Neurophysiol. 1989;61:1270–1283. doi: 10.1152/jn.1989.61.6.1270. [DOI] [PubMed] [Google Scholar]
- 22.Hirsch JC, Burnod Y. A synaptically evoked late hyperpolarization in the rat dorsolateral geniculate nucleus in vitro. Neuroscience. 1987;23:457–468. doi: 10.1016/0306-4522(87)90069-8. [DOI] [PubMed] [Google Scholar]
- 23.Hodgkin AL, Huxley AF. A quantitative description of membrane current and its application to conduction and excitation in nerve. J Physiol (Lond) 1952;117:500–544. doi: 10.1113/jphysiol.1952.sp004764. [DOI] [PMC free article] [PubMed] [Google Scholar]
- 24.Houweling AR, Bazhenov M, Timofeev I, Steriade M, Sejnowski TJ (1998) Computational models of intracortical augmenting responses. Soc Neurosci Abstr, in press. [DOI] [PMC free article] [PubMed]
- 25.Huguenard JR, McCormick DA. Simulation of the currents involved in rhythmic oscillations in thalamic relay neurons. J Neurophysiol. 1992;68:1373–1383. doi: 10.1152/jn.1992.68.4.1373. [DOI] [PubMed] [Google Scholar]
- 26.Huguenard JR, Prince DA. A novel T-type current underlies prolonged Ca2+-dependent burst firing in GABAergic neurons of rat thalamic reticular nucleus. J Neurosci. 1992;12:3804–3817. doi: 10.1523/JNEUROSCI.12-10-03804.1992. [DOI] [PMC free article] [PubMed] [Google Scholar]
- 27.Huguenard JR, Prince DA. Intrathalamic rhythmicity studied in vitro: nominal T-current modulation causes robust anti-oscillatory effects. J Neurosci. 1994;12:3804–3817. doi: 10.1523/JNEUROSCI.14-09-05485.1994. [DOI] [PMC free article] [PubMed] [Google Scholar]
- 28.Huguenard JR, Coulter DA, McCormick DA. A fast transient potassium current in thalamic relay neurons: kinetics of activation and inactivation. J Neurophysiol. 1991;66:1305–1315. doi: 10.1152/jn.1991.66.4.1304. [DOI] [PubMed] [Google Scholar]
- 29.Jahnsen H, Llinás R. Electrophysiological properties of guinea-pig thalamic neurones: an in vitro study. J Physiol (Lond) 1984a;349:205–226. doi: 10.1113/jphysiol.1984.sp015153. [DOI] [PMC free article] [PubMed] [Google Scholar]
- 30.Jahnsen H, Llinás R. Ionic basis for electro responsiveness and oscillatory properties of guinea-pig thalamic neurones in vitro. J Physiol (Lond) 1984b;349:227–247. doi: 10.1113/jphysiol.1984.sp015154. [DOI] [PMC free article] [PubMed] [Google Scholar]
- 31.Jones EG. The thalamus. Plenum; New York: 1985. [Google Scholar]
- 32.Kammermeier PJ, Jones SW. High-voltage-activated calcium currents in neurons acutely isolated from the ventrobasal nucleus of the rat thalamus. J Neurophysiol. 1997;77:465–475. doi: 10.1152/jn.1997.77.1.465. [DOI] [PubMed] [Google Scholar]
- 33.Kandel A, Buzsáki G. Cellular-synaptic generation of sleep spindles, spike-and-wave discharges, and evoked thalamocortical responses in the neocortex of the rat. J Neurosci. 1997;17:6783–6797. doi: 10.1523/JNEUROSCI.17-17-06783.1997. [DOI] [PMC free article] [PubMed] [Google Scholar]
- 34.Leresche N, Lightowler S, Soltesz I, Jassik-Gerschenfeld D, Crunelli V. Low-frequency oscillatory activities intrinsic to rat and cat thalamocortical cells. J Physiol (Lond) 1991;441:155–174. doi: 10.1113/jphysiol.1991.sp018744. [DOI] [PMC free article] [PubMed] [Google Scholar]
- 35.Lüthi A, McCormick DA. Both electrophysiological and biochemical oscillations determine spindle wave periodicity. Soc Neurosci Abstr. 1997;23:708. [Google Scholar]
- 36.Mainen Z, Sejnowski TJ. Influence of dendritic structure on firing patterns in model neocortical neurons. Nature. 1994;382:363–366. doi: 10.1038/382363a0. [DOI] [PubMed] [Google Scholar]
- 37.McCormick DA, Huguenard JR. A model of the electrophysiological properties of thalamocortical relay neurons. J Neurophysiol. 1992;68:1384–1400. doi: 10.1152/jn.1992.68.4.1384. [DOI] [PubMed] [Google Scholar]
- 38.McCormick DA, Pape HC. Properties of a hyperpolarization-activated cation current and its role in rhythmic oscillation in thalamic relay neurons. J Physiol (Lond) 1990;431:291–318. doi: 10.1113/jphysiol.1990.sp018331. [DOI] [PMC free article] [PubMed] [Google Scholar]
- 39.Metherate R, Ashe JH. Facilitation of NMDA receptor-mediated EPSP by paired-pulse stimulation in rat neocortex via depression of GABAergic IPSPs. J Physiol (Lond) 1994;484:331–348. doi: 10.1113/jphysiol.1994.sp020443. [DOI] [PMC free article] [PubMed] [Google Scholar]
- 40.Morin D, Steriade M. Development from primary to augmenting responses in primary somatosensory cortex. Brain Res. 1981;205:49–66. doi: 10.1016/0006-8993(81)90719-8. [DOI] [PubMed] [Google Scholar]
- 41.Morison RS, Dempsey EW. Mechanisms of thalamocortical augmentation and repetition. Am J Physiol. 1943;138:297–308. [Google Scholar]
- 42.Paré D, Curró Dossi R, Steriade M. Three types of inhibitory postsynaptic potentials generated by interneurons in the anterior thalamic complex of cat. J Neurophysiol. 1991;66:1190–1204. doi: 10.1152/jn.1991.66.4.1190. [DOI] [PubMed] [Google Scholar]
- 43.Pedroarena C, Llinás R. Dendritic calcium conductances generate high-frequency oscillation in thalamocortical neurons. Proc Natl Acad Sci USA. 1997;94:724–728. doi: 10.1073/pnas.94.2.724. [DOI] [PMC free article] [PubMed] [Google Scholar]
- 44.Soltesz I, Lightowler S, Leresche N, Jassik-Gerschenfeld D, Pollard CE, Crunelli V. Two inward currents and the transformation of low-frequency oscillations of rat and cat thalamocortical cells. J Physiol (Lond) 1991;441:175–197. doi: 10.1113/jphysiol.1991.sp018745. [DOI] [PMC free article] [PubMed] [Google Scholar]
- 45.Steriade M. The excitatory-inhibitory response sequence of thalamic and neocortical cells: state related changes and regulatory systems. In: Edelman GM, Gall WE, Cowan WM, editors. Dynamic Aspects of Neocortical Function. Wiley; New York: 1984. pp. 107–157. [Google Scholar]
- 46.Steriade M, Timofeev I. Short-term plasticity during intrathalamic augmenting responses in decorticated cats. J Neurosci. 1997;17:3778–3795. doi: 10.1523/JNEUROSCI.17-10-03778.1997. [DOI] [PMC free article] [PubMed] [Google Scholar]
- 47.Steriade M, Wyzinski P, Apostol V. Corticofugal projections governing rhythmic thalamic activity. In: Frigyesi TL, Rinvik E, Yahr MD, editors. Corticothalamic Projections and Sensorimotor Activities. Raven Press; New York: 1972. pp. 221–272. [Google Scholar]
- 48.Steriade M, Domich L, Oakson G. Reticularis thalami neurons revisited: activity changes during shifts in states of vigilance. J Neurosci. 1986;6:68–81. doi: 10.1523/JNEUROSCI.06-01-00068.1986. [DOI] [PMC free article] [PubMed] [Google Scholar]
- 49.Steriade M, Curró Dossi R, Nuñez A. Network modulation of a slow intrinsic oscillation of cat thalamocortical neurons implicated in sleep delta waves: cortical potentiation and brainstem cholinergic suppression. J Neurosci. 1991;11:3200–3217. doi: 10.1523/JNEUROSCI.11-10-03200.1991. [DOI] [PMC free article] [PubMed] [Google Scholar]
- 50.Steriade M, Nunez A, Amzica F. A novel slow (<1 Hz) oscillation of neocortical neurons in vivo: depolarizing and hyperpolarizing components. J Neurosci. 1993a;13:3252–3265. doi: 10.1523/JNEUROSCI.13-08-03252.1993. [DOI] [PMC free article] [PubMed] [Google Scholar]
- 51.Steriade M, Nunez A, Amzica F. Intracellular analysis of relations between the slow (<1 Hz) neocortical oscillation and other sleep rhythms of the electroencephalogram. J Neurosci. 1993b;13:3266–3283. doi: 10.1523/JNEUROSCI.13-08-03266.1993. [DOI] [PMC free article] [PubMed] [Google Scholar]
- 52.Steriade M, Contreras D, Curró Dossi R, Nunez A. The slow (<1 Hz) oscillation in reticular thalamic and thalamocortical neurons: scenario of sleep rhythm generation in interacting thalamic and neocortical networks. J Neurosci. 1993c;13:3284–3299. doi: 10.1523/JNEUROSCI.13-08-03284.1993. [DOI] [PMC free article] [PubMed] [Google Scholar]
- 53.Steriade M, Timofeev I, Grenier F, Dürmüller N. Role of thalamic and cortical neurons in augmenting responses and self-sustained activity: dual intracellular recordings in vivo. J Neurosci. 1998;18:6425–6443. doi: 10.1523/JNEUROSCI.18-16-06425.1998. [DOI] [PMC free article] [PubMed] [Google Scholar]
- 54.Timofeev I, Steriade M. The low-frequency rhythms in the thalamus of intact-cortex and decorticated cats. J Neurophysiol. 1996;76:4152–4168. doi: 10.1152/jn.1996.76.6.4152. [DOI] [PubMed] [Google Scholar]
- 55.Timofeev I, Steriade M. Fast (20–40 Hz) oscillations in cat cerebellothalamic pathway and their synchronization with cortical potentials. J Physiol (Lond) 1997;504:153–168. doi: 10.1111/j.1469-7793.1997.153bf.x. [DOI] [PMC free article] [PubMed] [Google Scholar]
- 56.Timofeev I, Steriade M. Intrathalamic mechanisms of incremental responses in reticular and relay cells. J Neurophysiol. 1998;79:2716–2729. doi: 10.1152/jn.1998.79.5.2716. [DOI] [PubMed] [Google Scholar]
- 57.Timofeev I, Contreras D, Steriade M. Synaptic responsiveness of cortical and thalamic neurones during various phases of slow sleep oscillation in cat. J Physiol (Lond) 1996;494:265–278. doi: 10.1113/jphysiol.1996.sp021489. [DOI] [PMC free article] [PubMed] [Google Scholar]
- 58.Traub RD, Miles R. Neuronal networks of the hippocampus. Cambridge UP; Cambridge, UK: 1991. [Google Scholar]
- 59.Ulrich D, Huguenard JR. Nucleus-specific chloride homeostasis in rat thalamus. J Neurosci. 1997;17:2348–2354. doi: 10.1523/JNEUROSCI.17-07-02348.1997. [DOI] [PMC free article] [PubMed] [Google Scholar]
- 60.Zhou Q, Godwin DW, O’Malley DH, Adams PR. Visualization of calcium influx through channels that shape the burst and tonic firing modes of thalamic relay cells. J Neurophysiol. 1997;77:2816–2825. doi: 10.1152/jn.1997.77.5.2816. [DOI] [PubMed] [Google Scholar]


