

Abstract
Neurons in the medial superior olive (MSO) are thought to encode interaural time differences (ITDs), the main binaural cues used for localizing low-frequency sounds in the horizontal plane. The underlying mechanism is supposed to rely on a coincidence of excitatory inputs from the two ears that are phase-locked to either the stimulus frequency or the stimulus envelope. Extracellular recordings from MSO neurons in several mammals conform with this theory. However, there are two aspects that remain puzzling. The first concerns the role of the MSO in small mammals that have relatively poor low-frequency hearing and whose heads generate only very small ITDs. The second puzzling aspect of the scenario concerns the role of the prominent binaural inhibitory inputs to MSO neurons.
We examined these two unresolved issues by recording from MSO cells in the Mexican free-tailed bat. Using sinusoidally amplitude-modulated tones, we found that the ITD sensitivities of many MSO cells in the bat were remarkably similar to those reported for larger mammals. Our data also indicate an important role for inhibition in sharpening ITD sensitivity and increasing the dynamic range of ITD functions. A simple model of ITD coding based on the timing of multiple inputs is proposed. Additionally, our data suggest that ITD coding is a by-product of a neuronal circuit that processes the temporal structure of sounds. Because of the free-tailed bat’s small head size, ITD coding is most likely not the major function of the MSO in this small mammal and probably other small mammals.
Keywords: medial superior olive, interaural time disparities, coincidence detection, inhibition, bat, amplitude modulation, mammalian auditory brainstem
Interaural time differences (ITDs) are a major cue for localizing sounds. ITD processing is thought to be accomplished by neurons that work as coincidence detectors (Jeffress, 1948). This idea is based on the assumption of three main features: (1) phase-locked inputs, (2) coincidence detection, and (3) delay lines. The first assumption is that the discharge of the neurons projecting to coincidence detector neurons encode the temporal structure of a stimulus, e.g., exhibit a phase-locked discharge to the pressure waves of low-frequency tones or the envelopes of high-frequency tones. The second assumption is that binaurally innervated detector neurons respond with a facilitated rate when excitatory inputs from the two ears arrive coincidentally. The third assumption is the existence of an array of cells receiving inputs with systematically varying combinations of axonal length from both ears, so-called “delay lines,” thereby creating a place code of azimuthal position.
The medial superior olive (MSO) seems to comprise all the features that are necessary to work as an ITD-sensitive coincidence detector as proposed by Jeffress (1948): (1) its neurons receive bilateral excitatory inputs and respond with a phase-locked discharge; (2) the neurons respond with a strongly facilitated rate to particular ITDs (for review, see Irvine, 1986, 1992); and (3) different MSO neurons are tuned to different characteristic ITDs (Yin and Chan, 1990), conforming with the idea of an array of delay lines.
However, two major concerns remain. One is that ITD detection should be used only in mammals with good low-frequency hearing and a sufficient inter-ear distance capable of creating biologically useful ITDs (Harrison and Irving, 1966; Irving and Harrison, 1967; Masterton and Diamond, 1967). For mammals with small inter-ear distances and predominantly high-frequency hearing, like small rodents and bats, interaural intensity differences (IIDs) are the main cues for lateralization. However, because a number of studies have shown that many small mammals possess an MSO (for review, see Covey and Casseday, 1995), the question becomes what its function is in these animals.
The second concern is the role of the inhibitory projections to the MSO (see Fig. 1A). Although the Jeffress model does not incorporate a role for inhibition, much evidence suggests that inhibition is involved in ITD coding in the MSO (Clark, 1969; Goldberg and Brown, 1969; Perkins, 1973; Yin and Chan, 1990; Grothe and Sanes, 1994).
Fig. 1.

A, The principal connections of the MSO include not one but two sets of inputs. First, AVCNspherical bushy cells from both sides project directly to MSO neurons providing binaural excitation. Second, glycinergic inhibitory neurons in the MNTB (evoked by contralateral stimulation) and LNTB (evoked by ipsilateral stimulation) project to the MSO.B, PST histograms (PSTHs) for the three sources of MSO inputs: AVCN (ipsilateral and contralateral; fromVater, 1982); MNTB (contralateral), andLNTB (ipsilateral). All of the four inputs show phase-locking in response to SAM stimuli (temporal resolution of the PSTH: 0.1 msec).
Here we examine the two concerns described above. We investigated whether the MSO in the free-tailed bat shows ITD sensitivity similar to that of other mammals and whether ITD coding is its major function. One advantage of studying the MSO of the free-tailed bat is that many of its cells receive the full complement of the common MSO inputs, bilateral excitation and bilateral inhibition, whereas other cells receive less than the full complement (Grothe et al., 1997). In other words, the free-tailed bat MSO has neurons receiving different subsets of the common MSO inputs, allowing us, by means of comparison, to gain information about the role of different inputs—the inhibitory inputs in particular—for creating ITD sensitivity.
MATERIALS AND METHODS
Six Mexican free-tailed bats, Tadarida brasiliensis mexicana, from Texas were used in this study. During surgery the bats were anesthetized with sodium pentobarbital (15 mg/kg) and methoxyflurane inhalation. Skin and muscles were deflected from the upper part of the skull, and a metal rod was mounted to the skull using cyanoacrylate and dental cement that was later used to secure the bat’s head during recordings. A small hole (0.5–1 mm diameter) was cut over the inferior colliculus on one side. The stereotaxic procedure described by Schuller et al. (1986) was used to define the position and angle of penetration of the recording electrode. After the skin and muscles from the bats skull were deflected, the sagittal profile of the skull was scanned at the midline and at 100 μm lateral off the midline on both sides in 50 μm steps. Additionally, the transversal profile was scanned at two different rostrocaudal positions. The individual scans were compared with an averaged standard profile for skull and brain (derived from 10 free-tailed bats from earlier studies). The use of a fixed reference point in the custom-made stereotactic apparatus allowed us to predict the penetration coordinates for hitting the MSO (error less than ±100 μm) (see Fig.2, insert in top left corner). The histological analysis at the end of the experiment (see Fig. 2) allowed us to precisely reconstruct each recording site. For more details seeSchuller et al. (1986).
Fig. 2.

Reconstruction of recording sites in one of the bats used in this study. After the stereotactic procedure described bySchuller et al. (1986), the profile of the skull was measured in the sagittal (top right inset) and the horizontal plane (bottom left inset). The profiles were fitted to standard sections as shown in the top right inset. This way the position of the MSO could be predicted with an error of less than ±100 μm. A small HRP injection (arrow) during one of the first penetrations and a large HRP injection (black area in section 3, black dots ininsets) 24 hr before killing the animal were used to confirm the stereotactic calculations and to precisely reconstruct all recording sites. The shaded areas in the two areas give the range of penetrations in this particular animal. The tilted lines labeled 1–5 (top left inset) give the planes of sectioning.
Recording started after full recovery of the bat in a sound-attenuated and heated room (27–30C°). Water was offered repeatedly to the bat during recording sessions. If the animal emitted alarm calls or struggled (signs of discomfort), the local anesthetic was refreshed, and an additional subanesthetic injection of sodium pentobarbital (10 mg/kg body weight) was given subcutaneously. This dosage of pentobarbital never induced anesthesia. The bats were still awake; their eyes were open, they drank water when it was offered, and they responded when their face or ears were touched gently. There were no noticeable, systematic changes in neuronal response properties from the pentobarbital. These additional pentobarbital injections were administered on only several occasions and then only once during a given recording session. Recording sessions generally lasted from 3 to 5 hr/d to minimize the animals’ discomfort from being restrained, and individual animals were usually tested on 5 consecutive d.
Action potentials were recorded extracellularly using glass pipettes filled with 1 m NaCl. Impedance of the recording electrodes ranged from 5 to 20 MΩ. The electrodes were advanced with a piezoelectric drive (Burleigh Inc.) controlled from outside the recording chamber. Spikes from single units were fed via a recording amplifier, a bandpass filter (0.3–5 kHz), and a window discriminator into a computer. Criteria for recording single neurons were stable waveforms and amplitudes from spike to spike that systematically changed when the electrode was moved slightly in 1 μm steps. In all cases, signal-to-noise ratio was >60%. In contrast to the MSO in other mammals, the neurophonics that make it particularly difficult to isolate single neurons (Yin and Chan, 1990) are much less prominent in the bat MSO. This may be attributable to the sharp frequency tuning of single neurons resulting in a relatively small number of MSO inputs activated by pure tones. The software used for controlling stimulus presentation and recording was programmed by M. Baumann and S. Kieslich (Zoologisches Institut, Universität München). Programming for Tucker-Davis-Technology equipment was provided by John H. Casseday (Department of Psychology, University of Washington).
Acoustic stimuli were presented via custom-made earphones (Schlegel, 1977; Schuller, 1997) fitted to the ears with probe tubes (5 mm diameter). The earphones were calibrated using a one-quarter inch Bruel & Kjaer microphone, and they showed a variability of less than ±3 dB over the frequency range used (15–80 kHz). Acoustic isolation between the two ears was better than 40 dB for all frequencies used in our experiments. Intensities between the two earphones did not vary more than ±3 dB.
Pure tones and sinusoidally amplitude-modulated stimuli (SAM) (100% modulation depth) were used as search stimuli. The stimuli were presented at a rate of four per second. A unit’s best (characteristic) frequency and thresholds for both ears were determined to set stimuli parameters for subsequent control by computer. Binaural characteristics of neurons were tested by keeping the intensity at one ear 20 dB above threshold and changing the intensity of the opposite ear (10 dB steps) and vice versa, using pure tones (40 msec duration) as well as using SAM stimuli at 100 and 200 Hz modulation rate (100 msec duration). The existence of ipsilateral or contralateral inhibition was additionally determined by using the following combination of features as indicators of inhibitory inputs: phasic on-responses to pure tones, nonmonotonic rate level functions, and low-pass filter characteristics for amplitude modulation rates. Because these features are usually not seen in the lower centers that project to the MSO, they are thought to be mediated by inhibition acting at the target MSO cell (cf. Grothe et al., 1997).
ITDs were created digitally using either custom-made hardware (“Delayus”) or Tucker-Davis-Technology-Systems. ITDs ranged from ±1 μsec to ±20 msec. In one animal, 1 sec binaural beat SAM stimuli with beat frequencies of 2 or 5 Hz were additionally used to test ITD sensitivity.
Each test signal was presented either 20 times (normal SAM stimuli) or 30 times (binaural beat), if not indicated differently in text or figure legends. Spike count-based as well as vector strength-based (VS) ITD functions were calculated. VS values range from 0 to 1 and indicate how well neuronal discharges are correlated with the phase of the SAM modulation frequency (calculations according to Goldberg and Brown, 1969). Only statistically significant VS values that fulfilled thep < 0.001 level in the Rayleigh test (Mardia, 1972) were used. To define the characteristic interaural delay (CD) and characteristic phase (CP) of a neuron, mean vectors of interaural phase difference (IPD) functions where calculated (cf. Yin and Kuwada, 1983). Again, only measurements that were statistically significant (see above) were used. IPD functions that had a mean vector with a vector strength below 0.2 were excluded from the analysis.
Recording sites were confirmed by small HRP injections at the end of each experiment. Perfusion and histology procedures followed Vater and Feng (1990).
RESULTS
In a preceding paper (Grothe et al., 1997) we showed that the MSO of the free-tailed bat contains neurons receiving different combinations of the common MSO inputs (Figs.1A,2). Many neurons receive excitatory and inhibitory projections from both ears (EI/EI) defined by indirect evidence such as phasic response patterns, nonmonotonic rate-level functions, and low-filter cut-offs for amplitude-modulated stimuli. These response characteristics are abundant in bat MSO neurons but unusual for anteroventral cochlear nucleus (AVCN) bushy cells, the cells that send excitatory projections to MSO (Vater, 1982). Additionally, MSO cells frequently show strong inhibitory effects at particular IIDs, which cannot be compensated for by changing ITDs [Grothe et al. (1997), and see below]. Each of the inhibitory effects described above are consistent with the anatomical input patterns to the MSO (Grothe et al., 1994, 1997), and they can be blocked pharmacologically in the mustached bat (Grothe, 1994) and the species used in this study (B. Grothe and L. Yang, unpublished results). However, there were subpopulations ofcells that failed to show excitatory effects from the ipsilateral ear (I/EI) or that failed to show prominent inhibitory effects from both ears (E/E). There were also monaural cells that responded only to one ear.
Here we present data from 51 binaural MSO neurons in response to ITDs. In addition, 11 monaural cells were encountered but not included in the analyses below. Furthermore, we recorded from 19 medical nucleus of the trapezoid body (MNTB) and 12 lateral nucleus of the trapezoid body (LNTB) cells to explore the temporal response patterns of the inhibitory MSO inputs. We will turn first to a general description of ITD sensitivity. We then turn to a more specific analysis of the ITD functions found in the different subsets of MSO cells. Differences in the ways that these subgroups respond to ITDs will be used to suggest what role each input plays in ITD coding. Finally, we will propose a simple model of how the excitatory and inhibitory inputs might interact in creating ITD sensitivity. Most data presented were obtained using SAM tones with high-frequency carriers (at each neuron’s best frequency) presented as 100 msec stimuli. In some cases we used 1 sec SAM stimuli with modulation frequencies that differed by 2 or 5 Hz between the two ears, creating a 2 or 5 Hz binaural beat. The carrier frequency was always kept at the characteristic (best) frequency of a neuron, 20 dB above threshold of the contralateral ear. Unless stated otherwise, the IID was set to 0 dB.
MSO inputs phase-lock to SAM stimuli
Auditory neurons in the free-tailed bat are tuned to high frequencies and hence do not phase-lock to pure tones; therefore, we used SAM stimuli. The rationale of using SAM stimuli is that the MSO neuron receives inputs from both ears that are phase-locked to the stimulus envelope and that can be presented with an interaural phase difference. The phase-locked nature of the MSO inputs has been shown in the cat for the two excitatory AVCN inputs as well as for the inhibitory MNTB projection (Smith et al., 1993). The poststimulus-time (PST) histograms in Figure 1B show examples of how MNTB (n = 19) and LNTB (n = 12) neurons in the free-tailed bat phase-lock to the stimulus envelope of SAM stimuli. For both MNTB and LNTB, the phase-locking was robust up to high-modulation frequencies (>800 Hz) in all neurons tested. Whether the inputs are phase-locked to the carrier frequency or the stimulus envelope should not make a difference for the ITD detection mechanism. For example, Yin and Chan (1990) described a cat MSO neuron that was tuned to high frequencies and did not phase-lock to pure tones but exhibited an ITD sensitivity to the stimulus envelope comparable to the ITD sensitivity of low-frequency neurons in response to pure tones.Batra et al. (1989) showed similar results for the rabbit inferior colliculus in response to SAM stimuli, and they argued that these results reflect an input from high-frequency MSO neurons. MSO neurons in the free-tailed bat respond to monaurally as well as binaurally presented 100 msec SAM stimuli, with a robust phase-locked discharge correlated to each cycle of the SAM stimulus (Grothe et al., 1997). Typically there is a decrease in discharge rate over the first 50–80 msec of stimulation. However, despite the initial decrease in spike count, there is still a consistent, phase-locked response throughout the remaining portion of the stimulus, independent of its duration.
MSO neurons show ITD sensitivity
To measure the ITD sensitivity of the bat’s MSO, we tested each cell using a range of ITDs that spanned at least the duration of one full SAM cycle in each direction (±360° IPD) for every SAM rate tested. Figure 3 shows PST histograms for the response to selected ITDs for a typical EI/EI neuron tested with a 200 Hz SAM stimulus. Spike counts diminished progressively as the two stimuli were presented more and more out of phase in either direction. For this cell, the response to the first SAM cycle was not affected, as was the case in about half of the neurons tested. In the remaining half, the on-response was reduced by at least 25%, and in some cells by up to 90%. However, in contrast to the late responses, it never fully disappeared.
Fig. 3.
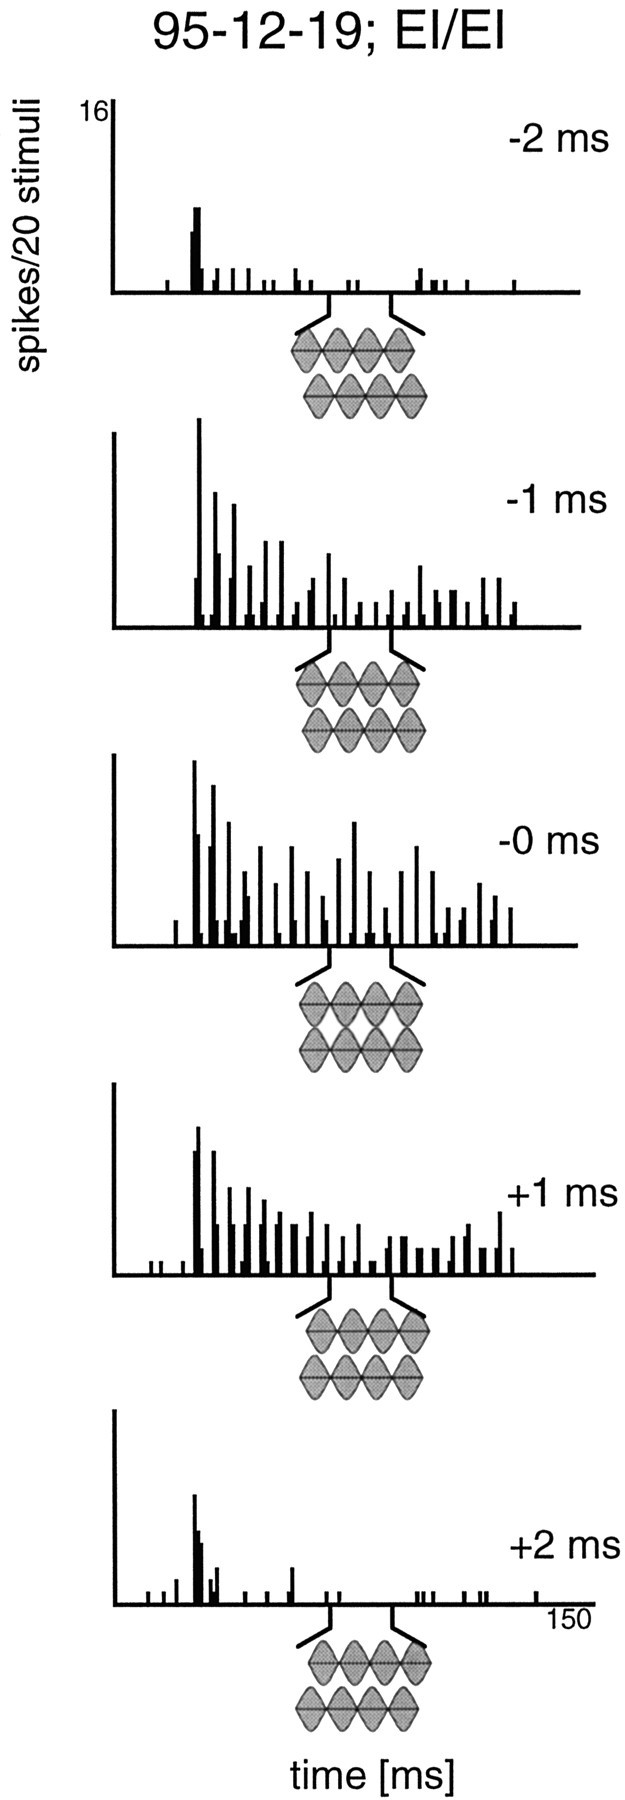
Effects of ITDs on the response of an MSO neuron to 20 repetitions of a 200 Hz SAM tone. The PSTHs show how the cell responded for five different ITDs, ranging from −2 to +2 msec. The neuron responded with good phase-locking to ITDs near 0. When the signal to either ear was delayed, the phase-locked response disappeared and only the first on-response remained (temporal resolution of the PSTH: 0.1 msec).
Figure 4 shows the complete ITD function for the EI/EI cell described above. This function spans the range of a full SAM cycle in both directions, revealing a cyclic ITD function for both the spike count and the synchronization coefficient (vector strength). The peak spike count occurred when the ITD was near 0. Also, the peak spike count for this binaurally derived function was substantially higher than the spike counts evoked by monaural stimulation of either ear (Fig. 4, arrows). Minimum spike counts occurred when the stimuli were shifted approximately one-half of the SAM cycle and were clearly below that for monaural stimulation. The spike count peaked again when the two stimuli were shifted approximately one full SAM cycle in either direction. Thus, the ITD function of this neuron showed an in-phase maximum and out-of-phase minimum, typical of the ITD functions reported previously for MSO cells in other mammals. The majority of MSO cells (90%) exhibited such cyclic ITD functions. As laid out in detail below, the principal positions of peaks and troughs, however, was different in the different subsets of cells (EI/EI, E/E, I/EI).
Fig. 4.

ITD functions from the neuron shown in Figure 2, again in response to 200 Hz SAM. The triangles give the normalized spike rate as a function of ITD; the dotsgive the calculated vector strength as a function of ITD. Note that a 5 msec ITD equals one cycle of the 200 Hz SAM. Both functions were calculated from 20 stimulus repetitions at each ITD. Thearrows give the response to monaural stimulation.
Is the ITD sensitivity in the biologically relevant range for the free-tailed bat?
To get an index of ITD sensitivity, we measured the distance from the peak of the ITD function to the point where the function declined to 75% of the peak. Although the ITD functions that we measured were cyclical, they were not necessarily symmetrical: the steepness of the two halves of the cyclic functions were often not identical. Therefore, we chose to measure the distance from the peak to the 75% decline at the side closer to 0 ITD (Fig.5A). Because the slope of the ITD functions depends on the phase relationship and hence on the modulation rate, we used the highest SAM rate that gave a robust response (spikes/cycle ≥0.5) that was available in our data set, usually 200–400 Hz (n = 38; neurons tested only with SAM rates below 200 Hz are not included). However, because we used 100 Hz (or sometimes 50 Hz) SAM rate steps, our measures most likely underestimate the cells’ best ITD sensitivity.
Fig. 5.

Sensitivity of MSO neurons to ITDs calculated for the highest modulation rate to which each neuron responded (>0.5 spikes per cycle and stimulus presentation). A, The distance from the peak of the ITD function to the 75% point closest to 0 ITD was taken as an index of ITD sensitivity (indicated by theshaded area). B, Distribution of ITD sensitivity of 37 MSO neurons. Note that maximal ITD sensitivity depends in part on the maximal SAM rate to which a neuron responds (for details, see text).
We found that ITD sensitivity varied from cell to cell. The distribution of sensitivity values is shown in Figure 5B. The majority of neurons exhibited ITD sensitivity values below 1000 μsec, but only six neurons had values below 200 μsec.
The distribution of ITD sensitivities described above shows that none of the neurons had an ITD sensitivity in the range relevant for the free-tailed bat, because the bat’s small head can only generate ITDs up to ∼30 μsec (Pollak, 1988). However, nearly half of the neurons tested exhibited ITD sensitivities in the range relevant for larger mammals such as dogs or cats. The striking similarity between ITD functions from bat MSO neurons and those from cat MSO neurons is illustrated in Figure 6. For means of comparison we transformed the ITD functions into IPDs of the modulation frequency. Figure 6A shows an IPD function from a cat MSO neuron in response to a 300 Hz pure tone (data fromYin and Chan, 1990). Figure 6B shows a typical IPD function from a free-tailed bat MSO neuron in response to a 200 Hz SAM stimulus. One can see very little difference between these two functions. However, although the ITD function is within the range of naturally occurring ITDs (Fig. 6, shaded area) for the cat, it is far outside of that for the free-tailed bat.
Fig. 6.

Comparison of the ITD sensitivity of an MSO neuron in the cat (A) [data from Yin and Chan (1990), their Fig. 3] and a neuron in the MSO of the free-tailed bat (B). As illustrated here, ITD functions reported for the cat, as well as those we measured from the bat, showed a correlation of response magnitude with the relative phase difference of the stimulus at the two ears. Hence, to facilitate a direct comparison, ITDs were translated into phase differences on thex-axis of the graphs presented here. In the example shown for the cat (A), the neuron was tested with a 300 Hz pure tone, and sensitivity was related to the relative timing of the 300 cycles/sec at each ear. The stimulus presented to the bat (B) was a high-frequency tone that was amplitude-modulated at a rate of 200 cycles/sec, and sensitivity was related to the relative timing of the amplitude modulations. Theshaded areas on each graph display the range of corresponding ITDs that naturally occurs for these species.
Most EI/EI neurons exhibit typical MSO-type ITD functions
We tested 31 EI/EI neurons for ITD sensitivity to SAM stimuli. These cells were classified as EI/EI because they showed clear evidence of both binaural excitation and binaural inhibition (see Materials and Methods). The responses to ITDs already described for the cell in Figures 3 and 4 were typical for all but one of the 31 EI/EI neurons. In 21 of the 31 EI/EI cells, the binaural response at best ITD was more than 1.3 times that of the summation of the two monaural responses. Thus, there was considerable facilitation in the majority of these cells, a crucial factor in the Jeffress model of coincidence detection. The averaged facilitation for the 31 cells at the best ITD was 1.52 (SD 0.74).
Another key feature of the Jeffress coincidence detector model is that a cell’s best interaural time difference remains stable for different stimulus frequencies. MSO neurons in the cat (Yin and Chan, 1990) and gerbil (Spitzer and Semple, 1995) respond in this way. To determine whether ITD sensitivity in the bat’s MSO also shows this feature, we obtained ITD functions for three or more modulation frequencies (between 50 and 750 Hz) from 18 of the EI/EI neurons. The cyclic shape of the ITD function described above was observed for every SAM rate that the cells could follow with a phase-locked discharge. Figure 7A gives an example of a neuron that was tested with three different modulation rates; 100, 200, and 300 Hz. All three functions peaked near 0 ITD, and the troughs occurred at ITDs corresponding to approximately one-half of the SAM cycle. For the 100 Hz SAM, troughs occurred at approximately ±5 msec, which is the duration of half a cycle for a SAM of 100 Hz. Presenting a 200 and 300 Hz SAM to the same cell generated troughs at approximately ±2.5 and ±3.33 msec, respectively, which is again the duration of half a cycle. The same type of cyclic pattern was observed for the corresponding vector strength functions, although vector strength-based ITDs never showed as precise a match of the peaks for different SAM rates. These observations suggest that the ITD sensitivity of this cell is consistent with the coincidence mechanism proposed by Jeffress (1948).
Fig. 7.
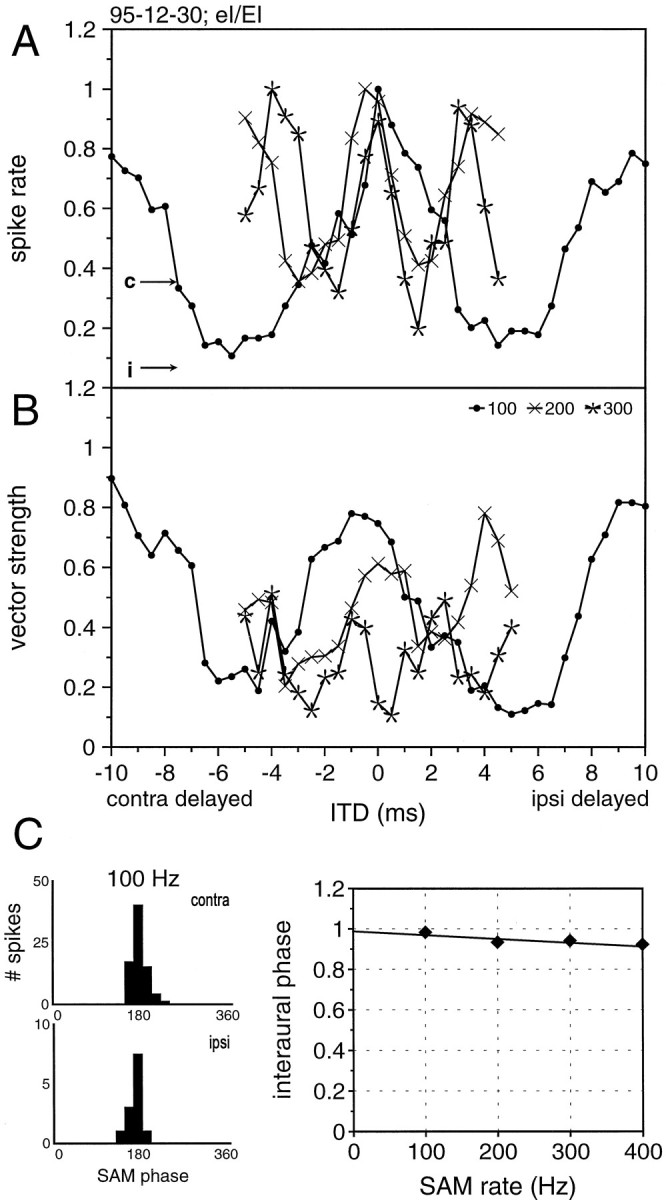
ITD sensitivity of a neuron that receives binaural excitation and inhibition in response to SAM stimuli. A, Normalized discharge rates to SAM stimuli with 100, 200, and 300 Hz modulation rates. Note that the peaks are rather stable, whereas the troughs shift as a function of the modulation frequency.B, The corresponding values of synchronization (vector strength). C, Histograms showing the monaural responses to 100 Hz SAM as a function of modulation phase (left panels) and best interaural phase diagram (right panel). The regression line indicates an EE coincidence mechanism. For details, see text.
For each cell tested, we quantified the measures described above. To this end, we first converted ITD functions into IPD functions. This allowed us to perform a detailed phase analysis that takes into account the entire shape of the function, not only the peak or trough (cf.Goldberg and Brown, 1969; Yin and Kuwada, 1983). First, we calculated the interaural phase delays in degrees as a function of the SAM frequency. The interaural phase delay gives the peak in the IPD functions, which corresponds to the peak in the ITD function. By calculating the interaural phase delays for different functions, one can calculate a CP relationship of the two inputs (equals the intercept of the regression line derived from the measured interaural phase delays for different frequencies with the y-axis). For a Jeffress coincidence detector neuron this CP would be 0 (0°) or 1 (360°). As depicted in Figure 7C, bottom panel, the neuron in fact resembles this aspect of a coincidence detector neuron in that its CP is close to one (0.982 cycles = contralateral leading by 0.018 cycles). Moreover, for a Jeffress coincidence detector neuron, the interaural phase delay at a certain modulation frequency should be predictable from the monaural response to the same frequency and intensity. For example, if the response to ipsilateral stimulation has a different latency than the contralateral response, presenting this difference as ITD should bring the two responses into register. Hence, a coincidence detector neuron should respond maximally to this particular ITD. For the neuron shown in Figure 7, we calculated the phase histograms for the monaural responses (Fig. 7C shows the phase histograms for 100 Hz SAM). The interaural phase delays predicted from these histograms in fact matched the interaural phase delays that we measured: the calculated phase difference for 100 Hz (0.979) differed only ∼0.003 cycles from the measured phase delay. Similar values derive from the comparisons for 200 Hz (0.011) and 300 Hz (0.006). Additionally, the steepness of the regression line gives the CD of the contralateral input. The steepness of 0.0002 of the interaural phase delay function indicates a CD of 200 μsec.
Of the 18 EI/EI cells, 10 behaved as described above. This suggests that MSO cells in the bat and other mammals share a common underlying mechanism for creating ITD sensitivity. Moreover, these neurons seem to conform with the Jeffress model. The characteristics of the ITD and IPD functions shown by the remaining EI/EI cells will be addressed in detail below.
Results from four additional EI/EI cells tested with binaural beat stimuli also support a coincidence mechanism for bat MSO cells. We used binaural beat stimuli because this stimulus has been used as a standard test for ITD sensitivity in a number of previous studies (Yin and Chan, 1990; Spitzer and Semple, 1995).
To generate binaural beat stimuli, we presented SAM tones to both ears, with a modulation rate at the ipsilateral ear that was 2 or 5 Hz higher than that presented to the contralateral ear so that the cycles of the two stimuli went in and out of phase 2 or 5 times per second, respectively. Hence, the stimuli are said to “beat” at 5 Hz. This stimulus paradigm was presented to each of four EI/EI cells, using six different combinations of SAM rates from 75 Hz at the contralateral ear and 77 (2 Hz beat) or 80 Hz (5 Hz beat) at the ipsilateral ear, up to 225 Hz at the contralateral ear and 227 or 230 Hz at the ipsilateral ear.
The response pattern from one of the four EI/EI cells to the beat stimuli is shown in Figure8A (for reasons of clarity only five curves are shown). Each curve represents the response to a different combination of SAM rates, each of which beats at 5 Hz. The curve that achieved the highest spike counts at its peaks was derived by presenting a tone with a SAM rate of 75 Hz to the contralateral ear and a tone with a SAM rate of 80 Hz to the ipsilateral ear. Higher SAM rates (e.g., n SAM rate of 225 to the contralateral ear and 230 to the ipsilateral ear) generated lower spike counts. However, in each curve the periodic response to the 5 Hz beat is apparent, showing that the cell responded best to one particular combination of envelope arrival times per beat.
Fig. 8.

A, ITD sensitivity of a binaurally excited and binaurally inhibited neuron to binaural beat stimuli with different modulation frequencies. The function for the different SAM rates lines up because the beat frequency was 5 Hz for all tests. Hence, the interaural phase difference at a given ITD was identical for all SAM rates. B, Monaural phase histograms and interaural phase histogram indicate an EE coincidence mechanism. For details, see text.
We used the data from the beat stimuli to construct a plot of interaural phase as a function of SAM rate, as we did previously for the static SAM stimuli. Figure 8B gives the interaural phase plot for the data in Figure 8A. The characteristic delay for this cell, calculated from the interaural phase plot, was 1.9 msec. The characteristic phase for this cell, also calculated from the interaural phase plot, was close to 1 (0.954), indicating an EE coincidence mechanism. Comparing the calculated and predicted best IPDs at 100 Hz (0.0038) and 200 Hz (0.029) also supports a coincidence mechanism. Each of the four neurons tested with the beat stimuli behaved like the cell described above.
Taken together, of the 22 EI/EI cells tested with various SAM rates (18 cells tested with static SAM stimuli and four cells tested with beat stimuli), 14 had ITD functions indicative of a Jeffress coincidence mechanism. The responses of the remaining eight EI/EI cells were not consistent with a Jeffress-type coincidence mechanism. These cells are described in the next section.
Some EI/EI neurons showed ITD functions not consistent with the Jeffress coincidence model
Eight cells showed ITD functions and/or interaural phase functions that were not consistent with a Jeffress-type coincidence mechanism, despite clear evidence of receiving EI/EI inputs. Three of these neurons had interaural phase functions that showed unpredictable best delays with different SAM rates and, correspondingly, CD values far from 0 or 1. Two units showed ITD functions suggestive of an IE mechanism: instead of peaking near 0 μsec ITD, their functions had the lowest spike counts near 0 μsec ITD. The remaining three cells exhibited double-cyclic ITD functions with unpredictable second peaks, as explained in detail below. Another feature that distinguished these cells from the one described in the previous section was that their ITD functions were highly asymmetric.
An example of a cell that had a double peak in its ITD function is shown in Figure 9. The phase histograms (SAM phase-related response over all cycles of the 100 msec stimulus) for this cell reveal a fundamental difference between the responses to different SAM rates. At 100 and 200 Hz SAM rates, the neuron responded to a small range of ITDs of approximately 1.5–3 msec (ipsilateral leading) to both SAM rates. This is shown in the three phase histograms in Figure 9B derived from the 200 Hz SAM stimulus. In contrast, at 400 Hz SAM rate this second peak never occurred. The peaks of the ITD functions could not be predicted by the mean phase angles of the monaural responses. For instance, the interaural phase delay predicted from the two phase histograms for monaural stimulation with the 200 Hz SAM would have been 0.18 (ipsilateral delayed), but there was no peak at the corresponding ITD (+0.9 msec).
Fig. 9.
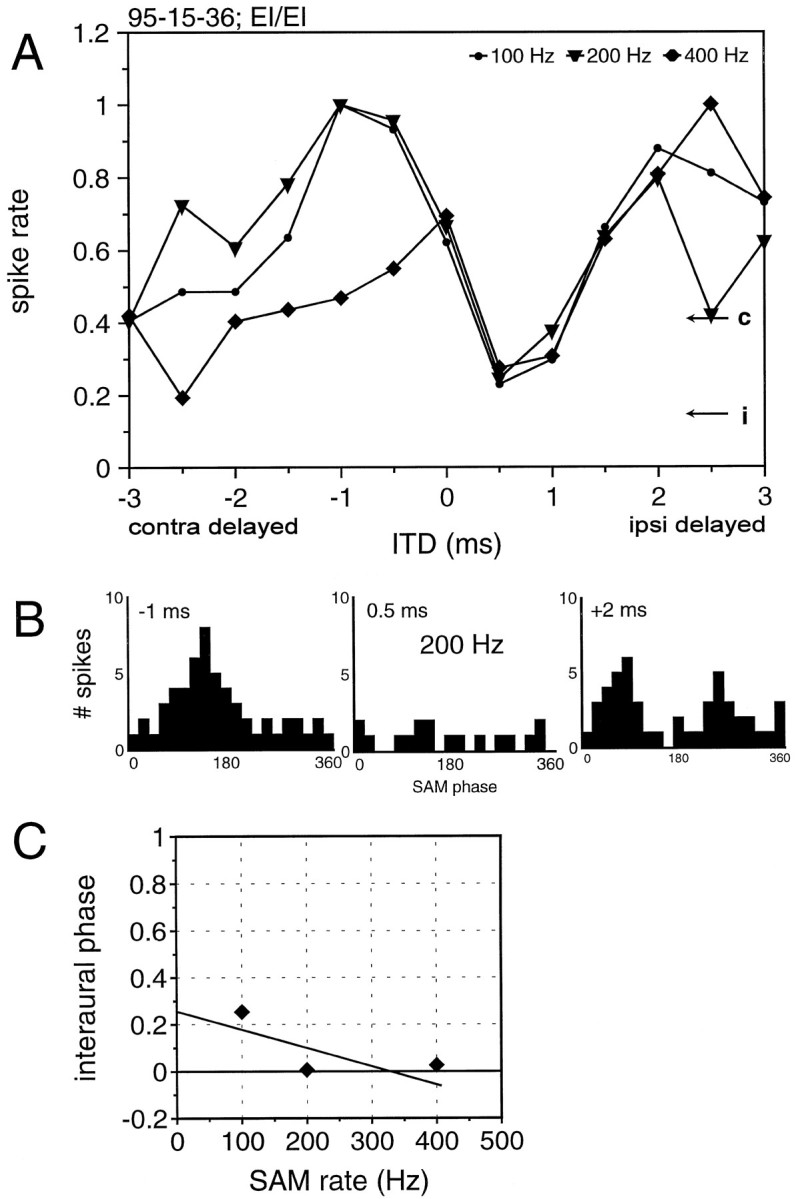
ITD sensitivity of a neuron that receives binaural excitation and binaural inhibition in response to SAM stimuli. This neuron exhibited an ITD sensitivity that differed from those described for other mammals in that the peaks did not line up. A, Normalized discharge rates to SAM stimuli with 100, 200, and 400 Hz modulation rates. B, The phase histograms for binaural responses to 200 Hz SAM exhibit one peak for an ITD of −1 msec but two peaks for +2 msec. The regression line in the interaural phase delay diagram (C) does not conform with either an EE or an EI coincidence mechanism.
The eight neurons described in this section showed clear evidence for binaural excitation and binaural inhibition (EI/EI type). Furthermore, these cells were sensitive to ITDs; they responded differentially to different ITDs. However, either because the ITD functions of these cells had unpredictable peaks with different SAM rates and were highly asymmetric or because they peaked far from 0 μm ITD, they failed to match the Jeffress coincidence detector model. As we shall explain in detail below, the data from these cells suggest a complex interaction of all four inputs, including the inhibitory inputs, in creating ITD sensitivity. In the following sections we will focus on this issue by examining other MSO cells that appeared to lack inhibitory or excitatory inputs.
ITD functions of E/E neurons
Four of the binaural cells that we studied could be driven monaurally from both ears but showed no signs or only very weak signs of inhibitory inputs. The spike count-based ITD functions of these cells failed to show the typical Jeffress-type ITD sensitivity, although they did show a sensitivity in terms of vector strength (two of these cells were tested with static SAM stimuli and two with beat stimuli). The ITD functions and selected PST histograms from one E/E cell are shown in Figure 10. The PST histograms indicate that the cell responded to both excitatory inputs at every ITD, causing the spike count-based ITD function to remain flat. As for vector strength, when the two inputs were out of phase, the two peaks canceled each other out, resulting in a low vector strength, but when the two inputs were in phase, the single peak caused a substantial increase in vector strength.
Fig. 10.

Example of a neuron that showed no evidence of inhibitory inputs. This neuron showed no ITD sensitivity in the spike count function (A). The phase histograms for binaural stimulation with 100 Hz SAM (B) show separate peaks for ITDs far from 0 and coincidence of the two inputs around 1 msec ITD.
ITD functions of I/EI neurons
Further evidence of the importance of the inhibition in creating ITD sensitivity comes from a subset of MSO neurons that showed no sign of ipsilateral excitation but retained contralateral excitation and binaural inhibition. One would expect these I/EI neurons to exhibit an ITD sensitivity typical of I/E neurons as shown for lateral superior olive (LSO) (Joris and Yin, 1995; Park et al., 1996). We tested 16 I/EI neurons. Each of them had cyclic ITD functions for spike counts and vector strength. Figure11A shows ITD functions from an I/EI neuron in response to 100, 200, and 400 Hz SAM rates. For each SAM rate there was a cyclic ITD function with the troughs lining up around 0 ITD. Hence, these neurons show ITD functions consistent with an IE mechanism. This is confirmed by the corresponding interaural delay function (Fig. 11B) revealing a CP of 0.48 and a CD of 400 μsec.
Fig. 11.

ITD sensitivity of a neuron that receives only contralateral excitation but binaural inhibition in response to 100 msec SAM stimuli. A, Normalized discharge rates to SAM stimuli with 100, 200, and 400 Hz modulation rates. Note that the peaks shift as a function of the modulation frequency, whereas the troughs are rather stable. B, Histograms showing the monaural responses to 100 Hz SAM as a function of the modulation phase (left panels). The regression line of the interaural phase delays measured for different SAM rates indicate an EI coincidence mechanism (right panel). For details, see text.
Each of the I/EI neurons retained the cyclic characteristic for all SAM rates tested; however, there were two features that generally distinguished the population of I/EI neurons from the population of EI/EI neurons. First, the peak spike counts from the ITD functions of the I/EI cells never surpassed the spike counts from monaural stimulation, whereas they always did so in the EI/EI cells. Second, although the ITD functions of some of the I/EI cells troughed near 0 μsec ITD, as do E/I cells in the LSO, many of the I/EI cells had troughs that were far from 0 μsec as did the EI/EI cells. In some cases, the troughs were 180° away from 0 ITD. In fact, if ITDs had not been manipulated, four of the I/EI neurons would have been classified as O/EI cells because of the long latency of the ipsilateral inhibition relative to the contralateral excitation. Figure12 gives four examples of I/EI neurons showing different positions of 75% cut-offs, all in response to a 100 Hz SAM rate. Compared with the distribution of peaks observed for the EI/EI cells, the peaks for the I/EI cells encompassed a much broader range of ITDs (p < 0.001; unpaired ttest). However, a substantial number of I/EI cells had peaks within the range observed for the EI/EI cells.
Fig. 12.

ITD functions of four different I/EI neurons. Thearrows mark the 75% cut-offs, which are distributed over a wide range of different ITDs.
In summary, the data from the I/EI cells suggest that ITD sensitivity in these MSO neurons is a consequence of a simple IE mechanism (coincidence of an excitatory and an inhibitory input creates a trough in the ITD function). Therefore, one might suggest that different subsets of MSO cells rely on fundamentally different mechanisms for temporal processing. Alternatively, what appears to be differences in temporal processing might be attributable to variations of a common mechanism: the relative arrival times of multiple excitatory and inhibitory inputs. The following sections will describe how such a temporal interaction might work in creating ITD functions.
Scenario of the interaction of binaural excitation and inhibition in creating ITDs
So far we presented evidence that the inhibitory inputs play an important role in shaping ITD functions in the MSO. Moreover, it appears that the timing of the inhibition might be of particular importance. But how could the complex interaction of the various MSO inputs play together in creating ITD functions, and why do they differ in different EI/EI neurons? We approached this question by constructing a simple scenario that takes into account the time course of each of the different MSO inputs.
Most of the neurons we recorded from had inputs from at least one ear that included both excitation and inhibition. In our previous article (Grothe et al., 1997) we reported that there are two basic temporal patterns of these monaural excitatory and inhibitory inputs. In some neurons inhibition occurred only after excitation, and in other cells inhibition occurred before excitation as well as after. On average, the leading input occurred ∼2 msec before the lagging input (range, ∼0.5 to 5 msec). A similar relationship of monaural excitation and inhibition was found for the mustached bat MSO (Grothe, 1994). Additionally, these previous studies indicate that spikes resulting from excitation occur within a narrow time window, whereas inhibition takes place throughout the stimulus duration. In those neurons that showed inhibition before the excitation as well as after, it appears that only the transient component of the excitation is strong enough to overcome the sustained inhibition. For our model we used the two basic input patterns and the general time parameters described above. In addition, we also considered monaural inputs that lack either the excitatory or inhibitory component.
To determine how these various input patterns might affect ITD sensitivity, we simulated their binaural interactions for different ITDs. Because we do not know the actual underlying EPSPs and IPSPs, we based our calculation on the observable excitatory and inhibitory effects, resulting in the patterns described above. Furthermore, we assumed equal strength of the excitatory and inhibitory inputs such that excitation and inhibition occurring at the same time generate no output (output = 0). Excitation alone was assigned a value of 1 (output = 1). We assumed a facilitation of ∼50% when excitatory inputs are coincident (output = 3). This value roughly corresponds to the facilitation we observed in EI/EI cells. However, this facilitation is not essential for the model because it heightens some of the peaks and hence has a quantitative effect but does not affect the shape of the ITD functions. We simulated the response to 100 msec SAM stimuli with different modulation rates (as used in the recordings). ITDs were varied from −10 to +10 msec, in 0.5 msec steps. The net output at each ITD was calculated using a 0.5 msec binwidth. From these points a smoothed ITD function was calculated using the formula:
where N is the number of preceding periods that is used for smoothing, Aj is the actual value at a given pointj, and Fj is the predicted value at pointj.
The first binaural cell type we simulated was I/EI: pure inhibition from one ear and the most common monaural input pattern from the other ear (leading excitation with lagging inhibition). The results are shown in Figure 13A. The schematic in the left panel show the starting point (ITD = 0) for the 100 and 200 Hz SAM stimulations. Hatched bars represent excitation, and solid bars represent inhibition. Although we calculated the output for each ITD based on 100 msec stimuli, for convenience we only display the inputs for two SAM cycles at one ear and for one cycle at the other ear (the indicated output for each ITD reflects only that of the short portion shown). Note that the timing of the leading excitation remains stable, creating a constant time delay but a changing phase delay of the inhibition. The duration of the cycle-by-cycle inhibition shortens as modulation rate increases, because the duration that each cycle remains above threshold becomes shorter (cf. Vater, 1982;Grothe, 1994).
Fig. 13.
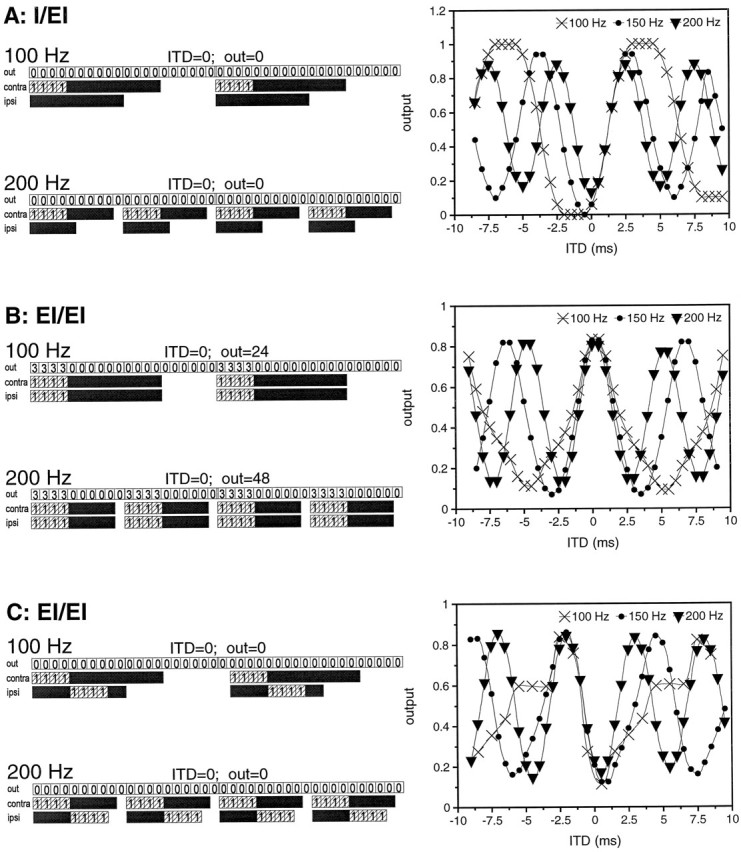
A simple model of ITD coding of MSO neurons in the free-tailed bat via the interaction of multiple excitatory and inhibitory inputs at 0 ITD. The left panels show the temporal interaction of the binaural MSO inputs for 100 and 200 Hz SAM. The right graphs show the calculated ITD function of the MSO neuron (calculated for 100 msec stimulus duration). Black bars indicate inhibition; hatched bars indicate excitation. Inhibition is weighted with −1 and excitation with +1. Facilitation is assumed to be 50%. The predictions for the three main MSO response types (I/EI, EI/EI with symmetric timing, EI/EI with asymmetric timing) are shown in the centered ITD functions. For details, see text.
The full ITD functions (calculated for the entire 100 msec stimulus duration) for three SAM rates (100, 150, and 200 Hz) are shown in the Figure 13A, right panel. The important feature was that the troughs around 0 ITD were much more stable than the peaks. This was typical for the I/EI cells we recorded from (Fig. 12).
The second binaural cell type we simulated was EI/EI, with identical monaural input patterns of the common type (excitation leading) shown in Figure 13B, left panel, for 100 and 200 Hz SAM rates. Again, we assume a fixed time delay of the inhibition compared with the excitation coming from the same side creating a changing phase relationship of the two excitatory and inhibitory inputs. As stated above, the period of effective inhibition shortens at higher rates. The calculated ITD functions (right panel) were symmetric and showed stable peaks at 0 ITD and varying troughs. This was typical for most EI/EI cells that we recorded from (Fig. 8).
However, changing one of the monaural inputs such that inhibition was leading excitation resulted in very different ITD functions (Fig.13C). In this case, unlike the previous EI/EI cell, the ITD functions were asymmetrical and resembled those EI/EI cells that did not match the Jeffress coincidence model (Fig. 9).
In the examples shown above, the leading input from both ears arrived simultaneously. Adding absolute interaural delays would shift the functions but would not change their fundamental features (e.g., stable peaks or troughs, shape, etc.).
Our simple model based on the observed timing relationships of the various MSO inputs can account for most of the basic features of ITD functions that we observed in the free-tailed bat. This finding supports the idea that the timing of both the excitatory inputs and the inhibitory inputs is crucial in shaping ITD sensitivity. Application of this model to other mammals, in which neurons in the MSO phase-lock to low-frequency sinusoids, would require taking into account the fact that the duration of the inhibition would not be frequency-depending. Nevertheless, the delayed binaural inhibition would still cause a sharp decline of the MSO output when the ITDs are causing noncoincident inputs, as shown above.
Are ITD sensitivity and SAM sensitivity related?
In a previous study (Grothe et al., 1997), we showed that MSO neurons in the free-tailed bat are sensitive to SAM rate. They act as low-pass filters for SAM rates in that they respond best to rates below ∼400 Hz, and for some cells they are as low as 90 Hz. A similar sensitivity to SAM rate has also been found in the mustached bat’s MSO. For the mustached bat, it was shown that the mechanism creating the filter characteristic is based on the temporal interaction of excitation and inhibition (Grothe, 1994), which also appears to be the case in the free-tailed bat. Hence, SAM filter characteristics and ITD sensitivity might be created by the same basic mechanism. If so, one would expect an interdependence between ITD functions and the filter characteristics of SAM filter functions.
We therefore compared the 75% cut-off point on a cell’s SAM filter function [response to SAM stimuli as a function of modulation frequency; for details, see Grothe et al. (1997)] and the point of 75% discharge on the cell’s ITD function. We interpret the striking correlation shown in Figure 14 for the I/EI neurons (correlation coefficient = 0.82) and the EI/EI neurons (correlation coefficient = 0.54) as supporting evidence that SAM filter sensitivity and ITD sensitivity are created, at least partly, by the same interaction of excitation and inhibition. The fact that the correlation is more clear-cut for I/EI neurons compared with EI/EI neurons is not surprising because the additional excitatory input to the latter should make for a much more complex interaction between inputs.
Fig. 14.

Correlation of the 75% points in the ITD functions for 200 Hz SAM and the filter cut-offs in the modulation transfer function for SAM stimuli calculated for I/EI and EI/EI neurons.
The effect of IIDs and absolute intensity on ITD functions
It has been argued by Harnischfeger et al. (1985) that even the smallest changes in firing rates that are caused by ITDs could be useful when integrated over a large population of cells and therefore that even bats could use ITDs for lateralization. However, one has to take into account to what extent a neuronal response is affected by other stimulus parameters that change with azimuthal location, such as IIDs. Therefore, we tested the impact that behaviorally relevant IIDs have on ITD functions in the free-tailed bat’s MSO. We did not perform a systematic investigation of how IIDs within the relevant physiological range affect ITD functions on the entire population of cells tested. However, we did measure ITD functions using different IIDs or interaural level differences (ILDs) for 11 EI/EI neurons and 8 I/EI neurons. Positive values indicate IIDs favoring the contralateral ear, whereas negative values indicate IIDs favoring the ipsilateral ear.
The effect of IIDs on the ITD functions of I/EI neurons was uniform. As one would expect if the ipsilateral inhibition is in fact shaping the ITD function, ITD sensitivity vanished if the intensity at the ipsilateral ear was decreased (positive IIDs, favoring the excitatory ear) and was only slightly affected (longer periods of inhibition; data not shown) for negative IIDs.
Each of the 11 EI/EI cells tested changed their ITD sensitivity with varying IIDs, and the changes were unpredictable in that they could not be explained by time intensity trading effects, e.g., amplitude-dependent latency shifts (cf. Harnischfeger et al., 1985;Fuzessery, 1997). In all cases tested, IIDs within the physiological range caused significant changes in the neuronal response to varying ITDs. Figure15A,B gives two examples of neurons that behaved in different ways.
Fig. 15.
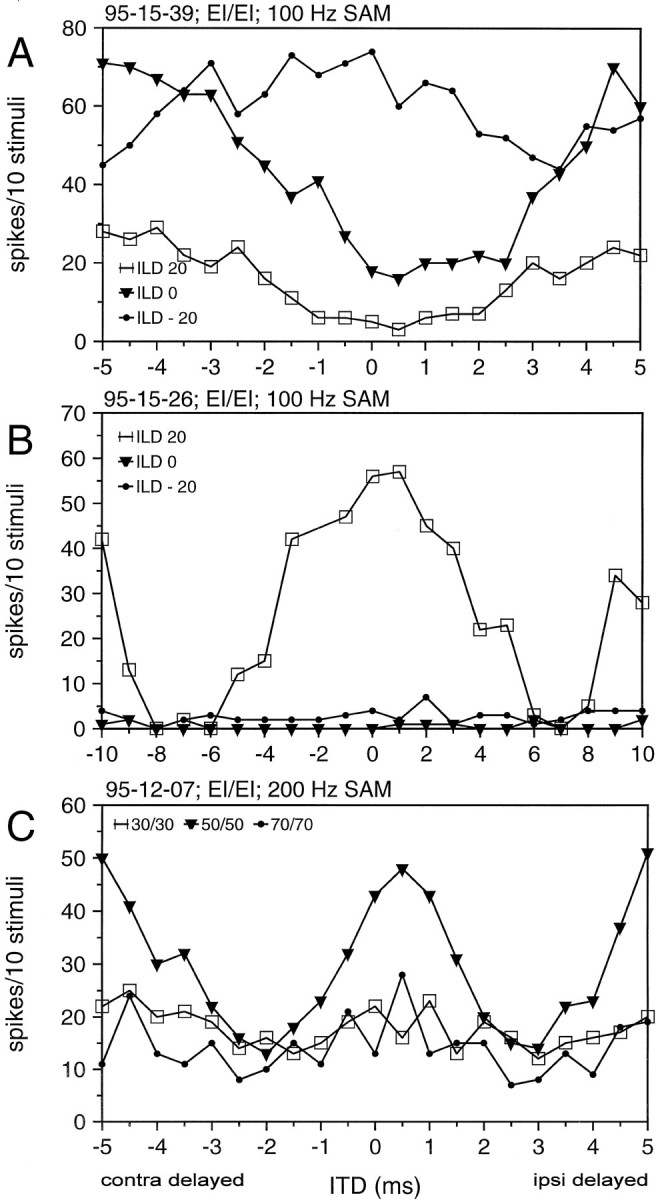
A, B, ITD functions measured at different interaural level differences (ILDs). Positive values: stimulus at the contralateral ear more intense. C, ITD functions measured at ILDs of 0 dB but at different absolute intensities.
Additionally, in six out of six EI/EI neurons, ITD functions changed when IID was kept constant, but absolute intensity was changed by 10 dB. In three of these ITD, sensitivity vanished for intensity shifts in both directions (higher and lower) (Fig. 15C); in the other three, no significant changes could be seen.
DISCUSSION
In summary, nearly all neurons in the free-tailed bat exhibited a sensitivity for ITDs of the SAM stimulus envelope. The ITD sensitivity observed in most, although not all, EI/EI neurons is comparable to that shown in the MSO of other mammals. Despite this apparent coherence with the Jeffress coincidence mechanism, which does not predict a crucial role for inhibition, we found inhibition to be essential to create ITD sensitivity. Moreover, it seems likely that a complex temporal interaction of the four inputs, which are all governed by the temporal structure of the acoustic stimulus, shapes ITD functions in the MSO.
Behavioral relevance of ITD coding in the free-tailed bat MSO
The ITD functions obtained from the MSO in the free-tailed bat seem to be similar to those in other mammals, despite their small inter-ear distance. This in itself makes it unlikely that the ITD functions we measured are of behavioral significance. However,Harnischfeger at al. (1985) argued that even a very small shift in the ITD function might be of significance if assessed by a large population of cells. This argument would hold only if other stimulus parameters do not cause dramatic changes in the MSO response. We have shown previously that these neurons are very sensitive to SAM rate as well as to IIDs, both within biologically significant ranges (Grothe et al., 1997). Therefore, the MSO in the free-tailed bat most likely performs a different role than ITD coding. However, its connectional properties are capable of processing ITDs in the range of those available for larger mammals. Thus, ITD sensitivity in these MSO neurons is a by-product of a circuit that in the bat and most likely in other small mammals codes for other temporal stimulus properties, e.g., frequency and amplitude modulations. Given the fact that the earliest mammals were very small (Rowe, 1988) and adaptations for low-frequency hearing occurred only in a minority of mammals (Heffner and Heffner, 1990;Frost and Masterton, 1994), neurons like those in the MSO of bats, which analyzes temporal structures, may have been preadapted for ITD coding in cases in which animals grow larger during evolution.
Comparison with ITD sensitivity of MSO neurons in other mammals
The major difference between the free-tailed bat MSO and that in larger mammals is that MSO neurons in the free-tailed bat are tuned to high frequencies, and therefore the ITD sensitivity in the free-tailed bat MSO is restricted to ITDs of the stimulus envelope. Additionally, there is a higher variability in the basic binaural input pattern (Grothe et al., 1997). The main result of the present study, however, is that the majority of EI/EI neurons in the free-tailed bat MSO exhibited an ITD sensitivity similar to that shown for the MSO in dogs (Goldberg and Brown, 1969), cats (Yin and Chan, 1990), gerbils (Spitzer and Semple, 1995), and rabbits (Batra et al., 1997). The key feature is that the ITD sensitivity appears to corroborate the coincidence detector mechanism proposed by Jeffress (1948). The predictability of the interaural phase for any given frequency (here, modulation frequency) by the phase histogram for monaural stimulation, as well as the characteristic delays around 0, suggests that the coincidence of binaural excitatory inputs dominates the ITD sensitivity.
The role of inhibition
Inhibitory inputs to MSO neurons have been suggested for many years from physiological data (Goldberg and Brown, 1969; Yin and Chan, 1990). Most neurons show an “out-of-phase” suppression causing the ITD function to drop below the rate of monaural or even spontaneous discharge rates when unfavorable ITDs are presented. Additionally, there are two glycinergic, inhibitory pathways to the MSO: one via the LNTB that is driven by the ipsilateral ear and one via the MNTB that is driven by the contralateral ear (for review, see Cant, 1991; Schwartz, 1992). The same inputs exist in the free-tailed bat (Grothe et al., 1994). Additionally, there is evidence from gerbil (Grothe and Sanes, 1993) and guinea pig (Smith, 1995) slice experiments that glycinergic inhibition is involved in ITD sensitivity. In the gerbil slice preparation, the timing and strength of inhibition seems to define at what ITDs action potentials can occur. Additionally, the inhibition increases the dynamic range of the response (Grothe and Sanes, 1994); however, brain slice recordings can only present indirect evidence.
Inhibitory inputs have also been described for another ITD coding structure, the nucleus laminaris in birds, which is known to function as a coincidence detector for binaural excitatory inputs. There, however, the inhibition is mediated by GABA, derives from other nuclei, and seems to be of more diffuse nature. Recent studies suggest a role of the inhibition in adjusting excitability, independent from sound pressure (Pena et al., 1996; Reyes et al., 1996; Brückner and Hyson, 1997; Viete et al., 1997). Such a role of inhibition has also been proposed in a theoretical study by Reed and Durbeck (1995).
In contrast to the data on the nucleus laminaris in birds, the data presented here suggest a more profound role of inhibition in ITD coding of the free-tailed bat MSO. First, inhibition seems necessary to generate Jeffress-type ITD functions, and second, the relative timing of the inputs, including the inhibitory inputs, determines the characteristics of a neuron’s ITD sensitivity. The evidence from the present study is threefold. (1) Neurons that lacked inhibitory inputs did not show any ITD sensitivity in the spike count-based functions. (2) In cells that lacked one excitatory input (I/EI), a simple interaction of excitation and inhibition seemed to be responsible for the ITD sensitivity. (3) Some EI/EI neurons showed an ITD sensitivity that did not conform with either the Jeffress model or an IE mechanism (cf. Yin and Kuwada, 1983) but rather was in between. (4) There is a correlation of a neuron’s filter characteristic for the modulation rate of SAM stimuli and that of the ITD selectivity. Because the former has been shown to be a result of a temporal interaction of excitation and delayed inhibition, it seem to be unlikely that one would find such a correlation if the latter would be a result of a fundamentally different mechanism. In the mustached bat, the SAM filter characteristic has been shown to be a result of an interaction of excitation and inhibition (Grothe, 1994) that is very similar to the temporal filtering found in MSO cells recorded from gerbil brain slices (Grothe and Sanes, 1994). Such temporal filtering, e.g., low-pass filter characteristics for the SAM rate, has been described in the cat (Joris, 1996) and the free-tailed bat MSO (Grothe et al., 1997). The obtained filter characteristics in the free-tailed bat were rather homogeneous over the different subpopulations of MSO neurons. However, it was impossible to simply predict the cut-off for binaural stimulation from monaural measurements. Thus, a slightly different balance in strength or in timing among the four inputs might lead to very different results in different EI/EI neurons. Consequently, we favor the conclusion that slightly different timing and strength of the four inputs determine the type of the ITD function, favoring either EE or EI mechanisms as suggested by the model presented above.
There are two ways that inhibition might act in shaping the ITD functions of EI/EI neurons that conform with the Jeffress coincidence mechanism. First, cycle-by-cycle inhibition that is delayed compared with the cycle-by-cycle excitatory input from the same ear limits the time frame when this excitation affects the MSO cell (as well as suppresses excitation from the other ear, as shown in Fig.13A). Second, the finding of an inhibition that embraces the excitation (both from the same ear) implies that the exact moment when the excitation can be effective is also a result of a competition between the two inputs from the same side, most likely allowing only highly synchronized excitatory inputs to affect the MSO cell but suppressing sustained nonphase-locked inputs. For both cases, the inhibition takes part in defining when excitation is effective and hence when coincidence of binaural excitation can create a peak in the ITD function.
The concept of an interaction of excitation and inhibition in the MSO cell might present an alternative hypothesis to the concept of the delay lines. The coincidence model assumes that delay lines generate coincidence and that this coincidence does not depend on inhibition (Jeffress, 1948; Schamma et al., 1989; Colburn et al., 1990; Brughera et al., 1996). Such delay lines, generated by axonal lengths, have been shown for the nucleus laminaris inputs in birds (Carr and Konishi, 1990; Carr and Boudreau, 1993), but the anatomical evidence for delay lines in the mammalian MSO is weak for the contralateral and lacking for ipsilateral inputs (Smith et al., 1993). As an alternative, for the excitatory and inhibitory inputs from a given ear, inhibition occurring at the beginning of the excitation could create a functional delay of the excitation. In other words, the early inhibition neutralizes the initial effects of the excitation, hence the delay. Thus, the inhibition could serve the same function as the delay line in creating coincidence. This concept fits our data from the free-tailed bat MSO in response to the ITDs of the envelope of high frequency neurons. It might not explain all phenomena seen in low-frequency MSO neurons in other mammals, particularly for frequencies above 1.5 kHz. However, this scenario might help to explain the apparent contradiction that MSO neurons fit the coincidence model and yet depend heavily on inhibition. Coincidence of excitation seems to be the main mechanism, but it is generated by inhibition, not delay lines.
Footnotes
This work was supported by the Deutsche Forschungsgemeinschaft (SFB 204) and the Alexander-von-Humboldt Foundation. We first thank Gerd Schuller for generous technical support and J. H. Casseday and E. Covey for providing software for running TDT systems. We also thank Claudia Schulte, Stefan Kieslich, and Horst König for technical help. We particularly thank R. Batra, J. Casseday, M. Götz, G. Neuweiler, S. Kuwada, G. Pollak, and T. Yin for important discussions that strongly influenced our work.
Correspondence should be addressed to Dr. Benedikt Grothe, Zoologisches Institut, Luisenstrasse 14, D-80333 München, Germany.
REFERENCES
- 1.Batra R, Kuwada S, Stanford TR. Temporal coding of envelopes and their interaural delays in the inferior colliculus of the unanesthetized rabbit. J Neurophysiol. 1989;61:257–268. doi: 10.1152/jn.1989.61.2.257. [DOI] [PubMed] [Google Scholar]
- 2.Batra R, Kuwada S, Fitzpatrick DC. Sensitivity to interaural temporal disparities of low and high frequency neurons in the superior olivary complex: I. Heterogeneity of responses. J Neurophysiol. 1997;78:1222–1236. doi: 10.1152/jn.1997.78.3.1222. [DOI] [PubMed] [Google Scholar]
- 3.Brückner S, Hyson RL (1997) Influence of GABA on the ITD processing of nucleus laminaris neurons in the chick. ARO Abstr 363. [DOI] [PubMed]
- 4.Brughera AR, Stutman ER, Carney LH, Colburn HS. A model with excitation and inhibition for cells in the medial superior olive. Audit Neurosci. 1996;2:219–233. [Google Scholar]
- 5.Cant NB. Projections to the lateral and medial superior olivary nuclei from the spherical and globular bushy cells of the anteroventral cochlear nucleus. In: Altschuller RA, Bobbin RP, Clopton BM, Hoffman DW, editors. Neurobiology of hearing: the central auditory system. Raven; New York: 1991. pp. 99–119. [Google Scholar]
- 6.Carr CE, Boudreau CE. Organization of the nucleus magnocellularis and the nucleus laminaris in the barn owl: encoding and measuring interaural time differences. J Comp Neurol. 1993;16:223–243. doi: 10.1002/cne.903340302. [DOI] [PubMed] [Google Scholar]
- 7.Carr CE, Konishi M. A circuit for detection of interaural time differences in the brain stem of the barn owl. J Neurosci. 1990;10:3227–3246. doi: 10.1523/JNEUROSCI.10-10-03227.1990. [DOI] [PMC free article] [PubMed] [Google Scholar]
- 8.Clark GM. The ultrastructure of nerve endings in the medial superior olive of the cat. Brain Res. 1969;14:293–305. doi: 10.1016/0006-8993(69)90111-5. [DOI] [PubMed] [Google Scholar]
- 9.Colburn HS, Han YA, Culotta CP. Coincidence model of MSO responses. Hear Res. 1990;49:335–346. doi: 10.1016/0378-5955(90)90112-3. [DOI] [PubMed] [Google Scholar]
- 10.Covey E, Casseday JH. The lower brainstem auditory pathways. In: Poppe AN, Fay RR, editors. Hearing by bats. Springer; New York: 1995. pp. 235–295. [Google Scholar]
- 11.Frost SB, Masterton RB. Hearing in primitive mammals: Monodelphis domestica and Marmosa elegans. Hear Res. 1994;213:179–212. doi: 10.1016/0378-5955(94)90088-4. [DOI] [PubMed] [Google Scholar]
- 12.Fuzessery ZM. Acute sensitivity to interaural time differences in the inferior colliculus of a bat that relies on passive sound localization. Hear Res. 1997;109:46–62. doi: 10.1016/s0378-5955(97)00053-1. [DOI] [PubMed] [Google Scholar]
- 13.Goldberg JM, Brown PB. Response of binaural neurons of dog superior olivary complex to dichotic tonal stimuli: some physiological mechanisms of sound localization. J Neurophysiol. 1969;32:613–636. doi: 10.1152/jn.1969.32.4.613. [DOI] [PubMed] [Google Scholar]
- 14.Grothe B. Interaction of excitation and inhibition in processing of pure tone and amplitude-modulated stimuli in the medial superior olive of the mustached bat. J Neurophysiol. 1994;71:706–721. doi: 10.1152/jn.1994.71.2.706. [DOI] [PubMed] [Google Scholar]
- 15.Grothe B, Sanes DH. Bilateral inhibition by glycinergic afferents in the medial superior olive. J Neurophysiol. 1993;69:1192–1196. doi: 10.1152/jn.1993.69.4.1192. [DOI] [PubMed] [Google Scholar]
- 16.Grothe B, Sanes DH. Synaptic inhibition influences the temporal coding properties of medial superior olivary neurons: an in vitro study. J Neurosci. 1994;14:1701–1709. doi: 10.1523/JNEUROSCI.14-03-01701.1994. [DOI] [PMC free article] [PubMed] [Google Scholar]
- 17.Grothe B, Schweizer H, Pollak GD, Schuller G, Rosemann C. Anatomy and projection patterns of the superior olivary complex in the Mexican free-tailed bat, Tadarida brasiliensis mexicana. J Comp Neurol. 1994;343:630–649. doi: 10.1002/cne.903430412. [DOI] [PubMed] [Google Scholar]
- 18.Grothe B, Park TJ, Schuller G. Medial superior olive in the free-tailed bat: response to pure tones and amplitude-modulated tones. J Neurophysiol. 1997;77:1553–1565. doi: 10.1152/jn.1997.77.3.1553. [DOI] [PubMed] [Google Scholar]
- 19.Harnischfeger G, Neuweiler G, Schlegel P. Interaural time and intensity coding in superior olivary complex and inferior colliculus of the echolocating bat Molossus ater. J Neurophysiol. 1985;53:89–109. doi: 10.1152/jn.1985.53.1.89. [DOI] [PubMed] [Google Scholar]
- 20.Harrison JM, Irving R. Visual and nonvisual auditory systems in mammals. Anatomical evidence indicates two kinds of auditory pathways and suggests two kinds of hearing in mammals. Science. 1966;154:738–743. doi: 10.1126/science.154.3750.738. [DOI] [PubMed] [Google Scholar]
- 21.Heffner RS, Heffner HE. Evolution of sound localization in mammals. In: Berkley M, Stebbins WC, editors. Comparative perception, Vol 1: Discrimination. Wiley; New York: 1990. pp. 285–314. [Google Scholar]
- 22.Irvine DRF. Progress in sensory physiology. The auditory brainstem. Springer; Berlin: 1986. [Google Scholar]
- 23.Irvine DRF. Auditory brainstem processing. In: Popper AN, Fay RR, editors. The mammalian auditory pathway: neurophysiology. Springer; New York: 1992. pp. 153–231. [Google Scholar]
- 24.Irving R, Harrison JM. The superior olivary complex and audition: a comparative study. J Comp Neurol. 1967;130:77–86. doi: 10.1002/cne.901300105. [DOI] [PubMed] [Google Scholar]
- 25.Jeffress LA. A place theory of sound localization. J Comp Physiol Psychol. 1948;41:35–39. doi: 10.1037/h0061495. [DOI] [PubMed] [Google Scholar]
- 26.Joris PX. Envelope coding in the lateral superior olive. II. Characteristic delays and comparison with responses in the medial superior olive. J Neurophysiol. 1996;76:2137–2156. doi: 10.1152/jn.1996.76.4.2137. [DOI] [PubMed] [Google Scholar]
- 27.Joris PX, Yin TC. Envelope coding in the lateral superior olive. I. Sensitivity to interaural time differences. J Neurophysiol. 1995;73:1043–1062. doi: 10.1152/jn.1995.73.3.1043. [DOI] [PubMed] [Google Scholar]
- 28.Mardia KV. Statistics of directional data. Academic; New York: 1972. [Google Scholar]
- 29.Masterton RB, Diamond IT. Medial superior olive and sound localization. Science. 1967;155:1696–1697. doi: 10.1126/science.155.3770.1696-a. [DOI] [PubMed] [Google Scholar]
- 30.Park TJ, Grothe B, Pollak GD, Schuller G, Koch U. Neural delays shape selectivity to interaural intensity differences in the lateral superior olive. J Neurosci. 1996;16:6554–6566. doi: 10.1523/JNEUROSCI.16-20-06554.1996. [DOI] [PMC free article] [PubMed] [Google Scholar]
- 31.Pena JL, Viete S, Albeck Y, Konischi M. Tolerance to sound intensity of binaural coincidence detection in the nucleus laminaris of the barn owl. J Neurosci. 1996;16:7046–7054. doi: 10.1523/JNEUROSCI.16-21-07046.1996. [DOI] [PMC free article] [PubMed] [Google Scholar]
- 32.Perkins RE. An electron microscopic study of synaptic organization in the medial superior olive of normal and experimental chinchillas. J Comp Neurol. 1973;148:387–415. doi: 10.1002/cne.901480306. [DOI] [PubMed] [Google Scholar]
- 33.Pollak GD. Time is traded for intensity in the bat’s auditory system. Hear Res. 1988;36:107–124. doi: 10.1016/0378-5955(88)90054-8. [DOI] [PubMed] [Google Scholar]
- 34.Reed MC, Durbeck L. Delay lines and auditory processing. Comments Theor Biol. 1995;3:441–461. [Google Scholar]
- 35.Reyes AD, Rubel EW, Spain WJ. In vitro analysis of optimal stimuli for phase-locking and time-delayed modulation of firing in avian nucleus laminaris neurons. J Neurosci. 1996;16:993–1007. doi: 10.1523/JNEUROSCI.16-03-00993.1996. [DOI] [PMC free article] [PubMed] [Google Scholar]
- 36.Rowe T. Definition, diagnosis and origin of mammalia. J Vertebr Paleontol. 1988;8:241–262. [Google Scholar]
- 37.Schlegel P. Calibrated earphones for the echolocating bat, Rhinolophus ferrumequeinum. J Comp Physiol. 1977;118:353–356. [Google Scholar]
- 38.Schuller G. A cheap earphone for small animals with good frequency response in the ultrasonic frequency range. J Neurosci Methods. 1997;71:187–190. doi: 10.1016/s0165-0270(96)00142-2. [DOI] [PubMed] [Google Scholar]
- 39.Schuller G, Radtke-Schuller S, Betz M. A stereotaxic method for small animals using experimentally determined reference profiles. J Neurosci Methods. 1986;18:339–350. doi: 10.1016/0165-0270(86)90022-1. [DOI] [PubMed] [Google Scholar]
- 40.Schwartz IR. The superior olivary complex and lateral lemniscal nuclei. In: Webster DB, Popper AN, Fay RR, editors. The Mammalian auditory pathway: neuroanatomy. Springer; New York: 1992. pp. 117–167. [Google Scholar]
- 41.Shamma SA, Shen NM, Gopalaswamy P. Stereausis: binaural processing without neural delays. J Acoust Soc Am. 1989;86:989–1006. doi: 10.1121/1.398734. [DOI] [PubMed] [Google Scholar]
- 42.Smith PH. Structural and functional differences distinguish principal from nonprincipal cells in the guinea pig MSO slice. J Neurophysiol. 1995;73:1653–1667. doi: 10.1152/jn.1995.73.4.1653. [DOI] [PubMed] [Google Scholar]
- 43.Smith PH, Joris PX, Yin TC. Projections of physiologically characterized spherical bushy cell axons from the cochlear nucleus of the cat: evidence for delay lines to the medial superior olive. J Comp Neurol. 1993;331:245–260. doi: 10.1002/cne.903310208. [DOI] [PubMed] [Google Scholar]
- 44.Spitzer MW, Semple MN. Neurons sensitive to interaural phase disparity in gerbil superior olive: diverse monaural and temporal response properties. J Neurophysiol. 1995;73:1668–1690. doi: 10.1152/jn.1995.73.4.1668. [DOI] [PubMed] [Google Scholar]
- 45.Vater M. Single unit responses in cochlear nucleus of horseshoe bats to sinusoidal frequency and amplitude modulated signals. J Comp Physiol. 1982;149:369–388. [Google Scholar]
- 46.Vater M, Feng AS. Functional organization of ascending and descending connections of the cochlear nucleus of horseshoe bats. J Comp Neurol. 1990;292:373–95. doi: 10.1002/cne.902920305. [DOI] [PubMed] [Google Scholar]
- 47.Viete S, Pena JL, Konishi M. Effects of interaural intensity difference on the processing of interaural time difference in the owl’s nucleus laminaris. J Neurosci. 1997;17:1815–1824. doi: 10.1523/JNEUROSCI.17-05-01815.1997. [DOI] [PMC free article] [PubMed] [Google Scholar]
- 48.Yin TCT, Kuwada S. Binaural interaction in low-frequency neurons in inferior colliculus of the cat. III. Effects of changing frequency. J Neurophysiol. 1983;50:1020–1042. doi: 10.1152/jn.1983.50.4.1020. [DOI] [PubMed] [Google Scholar]
- 49.Yin TCT, Chan JC. Interaural time sensitivity in medial superior olive of cat. J Neurophysiol. 1990;64:465–488. doi: 10.1152/jn.1990.64.2.465. [DOI] [PubMed] [Google Scholar]