Abstract
Insulin causes a suppression of whole-cell voltage-dependent outward current in cultured neurons from the rat olfactory bulb. This suppression is time-dependent; it is mimicked by application of Src tyrosine kinase inside the cell via the whole-cell patch electrode or by treatment of the olfactory bulb neurons with the tyrosine phosphatase inhibitor pervanadate. The C-type inactivation properties of the outward current in olfactory bulb neurons resemble those of the cloned Kv1.3 potassium channel. In addition, at picomolar concentrations at which it is specific for Kv1.3, the scorpion toxin margatoxin blocks most of the olfactory bulb neuron outward current. Immunocytochemical analysis demonstrates that Kv1.3 is prominent in the cultured olfactory bulb neurons. To identify specific amino acid residues that might be important for potassium current modulation, we examined the effects of pervanadate and insulin on wild-type and mutant Kv1.3 channels expressed in human embryonic kidney (HEK 293) cells. As shown previously, treatment with either pervanadate or insulin suppresses Kv1.3 current in these cells. Mutational analysis demonstrates that at least two distinct tyrosine residues are required for current suppression by pervanadate. Insulin treatment stimulates the tyrosine phosphorylation of Kv1.3 in HEK 293 cells, and a different combination of tyrosine residues is required for the current suppression by insulin. The results suggest that complex patterns of phosphorylation may be involved in the modulation of neuronal potassium current by receptor and nonreceptor tyrosine kinases.
Keywords: tyrosine kinase, tyrosine phosphatase, potassium channel, insulin receptor, modulation, mutational analysis, olfactory bulb, neuron, Kv1.3
Modulation of membrane ion channels is a fundamental mechanism in neuronal plasticity. The molecular mechanism of ion channel modulation that is best understood is modulation by protein phosphorylation. Ion channels, like many other proteins, are substrates for protein kinases and phosphoprotein phosphatases, and phosphorylation can influence a variety of channel functional properties. Although serine–threonine phosphorylation has been most thoroughly studied (Levitan, 1994), more recently the role of tyrosine phosphorylation in channel modulation has begun to be elucidated (Jonas and Kaczmarek, 1996). Both ligand-gated and voltage-dependent ion channels are subject to modulation by tyrosine phosphorylation, and different channel properties are modulated depending on the specific type of channel and tyrosine kinase involved (Hopfield et al., 1988; Huang et al., 1993; Wang and Salter, 1994; Yu et al., 1997). In the case of voltage-dependent potassium (Kv) channels, a consistent pattern has begun to emerge, in that the activity of several different cloned Kv channels is suppressed after phosphorylation by both receptor and nonreceptor tyrosine kinases (Huang et al., 1993; Peralta, 1995; Holmes et al., 1996a,b; Bowlby et al., 1997; Fadool et al., 1997).
The physiological significance of channel modulation by tyrosine phosphorylation is studied best by examining the modulation of native ion channels in neurons, either in situ or in cell culture. On the other hand, the expression of cloned ion channels in heterologous host cells provides a convenient means of analyzing the molecular details of channel modulation. We have attempted to marry these two approaches for the Kv1.3 potassium channel, a prominent potassium channel in specific brain regions, including the olfactory bulb and olfactory cortex (Kues and Wunder, 1992). The insulin receptor tyrosine kinase is also expressed at high levels in the olfactory bulb (Gupta et al., 1992; Folli et al., 1994), and it is becoming evident that insulin can modulate neuronal ion channels (Jonas et al., 1996) and may be important for certain higher brain functions (Wickelgren, 1998). We show here that a substantial portion of the outward current in cultured olfactory bulb neurons (OBNs) is carried through Kv1.3 channels and that the outward current in these neurons is suppressed markedly within minutes after activation of the insulin receptor tyrosine kinase. Incubation of OBNs with the tyrosine phosphatase inhibitor pervanadate or internal perfusion of the tyrosine kinase Src also suppress the outward current with a similar time course. We have used mutational analysis of cloned Kv1.3 to identify specific combinations of tyrosine residues that are important for current suppression by pervanadate and insulin. Interestingly, a different combination of residues is required for suppression of Kv1.3 by Src (Fadool et al., 1997), and yet another tyrosine residue is involved in the suppression of Kv1.3 by activation of the epidermal growth factor receptor (EGFr) tyrosine kinase (Bowlby et al., 1997). The study of a modulatory phenomenon in neurons, in combination with mutational analysis in a heterologous expression system, provides an approach to elucidating the molecular details of a physiological response. The data are consistent with the idea that the modulation of neuronal potassium current may require complex patterns of protein tyrosine phosphorylation.
MATERIALS AND METHODS
Solutions and reagents. Human embryonic kidney (HEK 293) cell patch pipette solution contained (in mm): 30 KCl, 120 NaCl, 10 HEPES, and 2 CaCl2, pH 7.4. OBN patch pipette solution contained (in mm): 145 KCl, 10 HEPES, 10 EGTA, 2 MgCl2, and 0.20 NaATP, pH 7.3. HEK 293 cell bath recording solution contained (in mm): 150 KCl, 10 HEPES, 1 EGTA, and 0.5 MgCl2, pH 7.4. OBN bath recording solution contained (in mm): 150 NaCl, 5 KCl, 2.6 CaCl2, 2 MgCl2, 10 HEPES, and 100 nm tetrodotoxin (TTX), pH 7.3. Protease and phosphatase inhibitor (PPI) solution contained (in mm): 25 Tris, 250 NaCl, 5 EDTA, 1 Na3VO4, 1 phenylmethylsulfonyl fluoride, and 1% Triton X-100, 1 μg/ml each leupeptin and pepstatin, and 2 μg/ml aprotinin, pH 7.5. All salts were purchased from Sigma, St. Louis, MO. Tissue culture and transfection reagents were purchased from Life Technologies (Gaithersburg, MD). TTX and nerve growth factor (NGF) 7S were purchased from Calbiochem (La Jolla, CA). Human recombinant insulin was purchased from Upstate Biotechnology (Lake Placid, NY) or Boehringer Mannheim (Indianapolis, IN). Margatoxin (MgTx) was a generous gift from Dr. Reid Leonard, Merck Research Laboratories (Rahway, NJ).
Pervanadate (Na3VO4) (Sigma) was prepared from a 1 mm orthovanadate stock solution as described previously (Fantus et al., 1989). Immediately before use, the orthovanadate stock was mixed with 0.003% H2O2for 15 min at room temperature, followed by the addition of 54 μm catalase to remove residual H2O2. This protocol generated the peroxidized form of vanadate, pervanadate, which was stable for 2 hr.
cDNA constructs and antibodies. Kv1.3 channels were expressed transiently in HEK 293 cells using the Invitrogen (San Diego, CA) vector pcDNA3. Kv1.3 was subcloned into pcDNA3 at the unique HindIII site of the multiple cloning region, placing the channel coding region downstream from a cytomegalovirus promoter. The insulin receptor (IR) cDNA was generously provided by Richard Roth (Stanford University, Stanford, CA) in the pECE vector. The entire IR coding region was removed using the unique restriction sites SalI and XbaI and subcloned into pcDNA3 between the XhoI andXbaI sites in the multiple cloning region.
A rabbit polyclonal antiserum, raised against a MalE fusion protein (New England BioLabs, Beverly, MA) containing an extracellular sequence specific to Kv1.3 (Cai and Douglass, 1993), was generously provided by Dr. James Douglass (Vollum Institute, Portland, OR). This antibody was used for immunocytochemical analysis of OBNs and of HEK 293 cells transfected with Kv1.3 channel cDNA, and for immunoprecipitation and Western blot detection of Kv1.3. Tyrosine-phosphorylated proteins were immunoprecipitated and detected on Western blots with the mouse monoclonal antibody 4G10 (Upstate Biotechnology), which recognizes phosphotyrosine.
Primary cell culture. Olfactory bulbs were harvested from 24-hr-old Sprague Dawley rats, and neuronal primary cultures were prepared using the procedure of Huettner and Baughman (1986) as modified by Egan et al. (1992). Briefly, animals were killed by decapitation according to American Veterinary Medical Association-approved methods. Olfactory bulbs were removed quickly from the cranium and placed into 10 ml serum-free DMEM (Life Technologies) equilibrated previously at 37°C in a 5% CO2 incubator. Olfactory bulbs from four to five animals were incubated whole in a physiological saline solution containing cysteine-activated papain (200 U; Worthington, Freehold, NJ) for 1 hr at 37°C in the 5% CO2 incubator. The bulbs were then washed in DMEM containing 5% fetal bovine serum (Life Technologies) and 5 mg/ml trypsin inhibitor (Boehringer Mannheim) for 10 min to stop the enzymatic activity of the papain. Cells were dissociated by trituration using a graded-size series of fire-polished siliconized Pasteur pipettes; the resulting neuron and glia suspension was plated onto poly-d-lysine hydrobromide-coated (molecular weight, 49,300–53,000; Sigma) 12 mm glass coverslips, and incubated in DMEM supplemented with 2% penicillin–streptomycin and 5% fetal bovine serum (Life Technologies). Cytosine arabinoside (10 μm; Sigma) was added to the medium for 36 hr between days 3–5 to stop the overgrowth of dividing cells and to promote better survival of the neurons. Growth medium was changed twice a week, allowing viable neurons for at least 2 months. Neurons were used for patch recording or immunocytochemistry 3–32 d after plating.
Maintenance of HEK 293 cell cultures and transfection. HEK 293 cells were maintained in minimal essential medium (MEM), 2% penicillin–streptomycin, and 10% fetal bovine serum (Life Technologies). Before transfection, cells were grown to confluency (7 d), dissociated with trypsin-EDTA (Sigma) and mechanical trituration, diluted in MEM to a concentration of 600 cells/μl, and replated on Corning dishes (catalog #25000; Fisher Scientific, Houston, TX). cDNA was introduced into the HEK 293 cells with a lipofectamine reagent (Life Technologies) 3–4 d after cell passage. At the time of transfection, the cells were ∼20–30% confluent. Lipofectamine and cDNA were allowed to complex for 30 min. The DNA–lipofectamine complex was diluted in 1 ml of serum-reduced OptiMEM (Life Technologies), and cells were transfected for 4.5–5 hr with 1 μg of Kv1.3 cDNA or with 0.75 μg each of Kv1.3 and IR cDNA per 35 mm dish. Plasmid DNA with no coding insert served as the control.
Transfection efficiency was monitored in parallel plates by transfecting with a Lac Z expression plasmid and subsequently staining the β-galactosidase reaction product. Staining efficiency was routinely 70–90%, and physiological expression of Kv1.3 was observed in 40–60% of the cells. In later experiments, constructs were cotransfected with pHook (Invitrogen) as a means of rapidly selecting transfected cells. pHook encodes a transmembrane domain from the PDGF-R, which is then anchored on the extracellular side of the plasma membrane. Before patch recording, a brief incubation with an appropriate antibody linked to a 5 μm polystyrene bead allows recognition of transfected cells. More than 85% of bead-labeled cells expressed Kv1.3 current. Typically, single channel events could be detected as early as 9 hr post-transfection, and macroscopic currents were observed in the range of 24–72 hr.
Tyrosine phosphorylation of Kv1.3. Cells were transfected as above, but at 80–90% confluency and with a total of 7 μg cDNA per 60 mm dish. Equal amounts of channel and IR cDNA were mixed. HEK 293 cells were harvested 2 d post-transfection by lysis in ice-cold PPI solution. The lysates were clarified by centrifugation at 14,000 ×g for 10 min at 4°C and incubation for 1 hr with 3 mg/ml Protein A-Sepharose (Pharmacia, Piscataway, NJ), followed by another centrifugation step to remove the Protein A-Sepharose. Tyrosine-phosphorylated proteins were immunoprecipitated from the clarified lysate by overnight incubation at 4°C with 5 μg/ml 4G10 antibody, followed by a 2 hr incubation with Protein A-Sepharose and centrifugation as above. The immunoprecipitates were washed 4 times with ice-cold PPI solution (modified to contain 0.1% Triton X-100). Lysates and washed immunoprecipitates were diluted in SDS gel loading buffer (Sambrook et al., 1989) containing 1 mmNa3VO4, and proteins were separated on 10% acrylamide SDS gels and transferred to nitrocellulose for Western blot analysis. Blots were blocked with 5% nonfat milk and incubated overnight at 4°C in primary antibody against Kv1.3, then with horseradish peroxidase-conjugated goat anti-rabbit secondary antibody (Amersham, Arlington Heights, IL) for 90 min at room temperature. ECL (Amersham) exposure on Fuji RX film (Fisher Scientific) was used to visualize labeled protein.
Electrophysiology of OBNs. OBNs were voltage-clamped in the whole-cell recording configuration using an Axopatch-1B amplifier (Axon Instruments, Foster City, CA). Cells were visualized at 40× magnification using a phase contrast water immersion lens (Carl Zeiss, Thornwood, NJ). Electrodes were fabricated from Jencons glass (catalog #M15/10; Jencons Limited, Bedfordshire, England), fire-polished to ∼1 μm, and coated near the tip with beeswax to reduce the electrode capacitance. Pipette resistances were between 9 and 14 MΩ. All voltage signals were generated, and data were acquired using a microstar DAP 800/2 board (Microstar Lab, Bellevue, WA). The amplifier output was filtered at 2 kHz, digitized at 2–5 kHz, and stored for later analysis.
Typically cells were held at −90 mV and stepped to depolarizing potentials for a pulse duration of 400 msec at a stimulating interval of 30–60 sec. In the studies involving MgTx block of OBN outward current, picomolar concentrations of MgTx were applied to the bath. Peak current amplitudes from OBNs in the whole-cell configuration before and 10 min after MgTx application were measured to permit a paired statistical comparison. Parallel experiments with Kv1.3 expressed in HEK 293 cells demonstrated that MgTx block was complete in <10 min.
The effect on OBN outward current of 0.5 U of c-Srcpp60 (Upstate Biotechnology) plus 200 μm MgATP (Sigma), applied via the recording electrode to allow access to the cell cytosol, was tested by the same stimulation protocol as above. Immediately on breakthrough to the whole-cell configuration, the initial peak current magnitude was recorded as the 0 time condition. The amount of current remaining at 24 min, in the absence or presence of Src, was normalized to the 0 time value. Boiled c-Srcpp60, ATP alone, and c-Srcpp60 − ATP served as negative controls.
The effect of bath-applied pervanadate, insulin, or NGF on whole-cell OBN current was determined by measuring peak current amplitude, inactivation rate, and deactivation rate before and 5–20 min after application to carry out a within cell or paired statistical comparison. In the case of pervanadate, cells were pretreated for 5–10 min with the carrier 0.003% H2O2 + 54 μm catalase to confirm the stability of the patch.
Electrophysiology of HEK 293 cells. Macroscopic currents in cell-attached membrane patches were recorded 24–72 hr after transfection. The Kv1.3 channel expression was so robust that it was not possible to record whole-cell currents without saturating the amplifier. The diameter of the patch electrode, and hence number of ion channels sampled, was held uniform by checking the bubble number of the pipette immediately after electrode fabrication and polishing (Mittman et al., 1987). Patches were held routinely at a holding potential of −80 or −90 mV, and the voltage was stepped to depolarizing potentials for a pulse duration of 1000 msec. Stimuli were delivered at 45 sec or longer intervals to prevent cumulative inactivation of the Kv1.3 channel (Marom et al., 1993). Testing for MgTx block was identical to that described above for the OBNs, with the exception that the toxin was applied in the patch electrode. Pervanadate and insulin treatment and analysis were also the same as described for OBNs above.
All electrophysiological data were analyzed using software written in our laboratory, in combination with the analysis packages Origin (MicroCal Software, Northampton, MA) and Quattro Pro (Borland International, Scotts Valley, CA). Data traces were subtracted linearly for leakage conductance. Functional expression of Kv1.3 current was defined as the presence of a nonohmic current at depolarizing voltages. The inactivation of the macroscopic current was fit to the sum of two exponentials by minimizing the sums of squares. The two inactivation time constants were combined by multiplying each by its weight and summing as described previously (Kupper et al., 1995). The deactivation of the macroscopic current was fit similarly, but to a single exponential. Differences between control and treatment groups within single cells were analyzed by paired t test with statistical significance defined at the 0.95 confidence level.
Immunocytochemistry. Cultured OBNs and transfected HEK 293 cells were rinsed once in PBS and then lightly fixed in St. Marie fixative (95% EtOH and 5% acetic acid) for 10 min at −20°C. The fixative was removed by rinsing with three changes of PBS for 10 min each, and nonspecific binding was blocked by incubation for 25 min in PBS containing 1% albumin Fraction V (fatty acid free; Sigma) and 2–5% goat serum (PBS-Block). Neurons or HEK 293 cells were incubated with primary antiserum diluted in PBS-Block for 2 hr at room temperature, washed with three changes of PBS, and then were reincubated for 2 hr at room temperature with a fluorescein-conjugated goat anti-rabbit secondary antibody (Boehringer Mannheim or Amersham) in PBS-Block. Neurons or HEK 293 cells were washed with three changes of PBS for 10 min, rinsed in millipore water, and mounted in 60:40 glycerol–PBS with 0.1% p-phenylene diamine added to prevent photobleaching. Photomicroscopy was performed at 40× with a Ph3 objective using a Microphot-fxa Nikon (Columbia, MD) microscope equipped with fluorescence. Microscope use was generously provided by Dr. John Dowling (Biological Laboratories, Harvard University, Boston, MA).
Site-directed mutagenesis. The parent Kv1.3 clone was propagated in Escherichia coli DH-1. Plasmid DNA preparation was by standard methods using a Qiagen (Chatsworth, PA) plasmid kit followed by phenol-chloroform extraction and ethanol precipitation (Sambrook et al., 1989). All Kv1.3 channel mutants were constructed using two sequential PCRs (Landt et al., 1990) in an Eri-Comp (Twin Block System, San Diego, CA) thermocycler, using Taqpolymerase (Promega, Madison, WI). The circularized plasmid containing the channel gene served as the DNA template. For each tyrosine mutation, three oligonucleotides, each 15–24 b in length, were synthesized. Two of the oligonucleotides were complementary to sequences on opposite sides of the tyrosine residue to be mutated, and the third was a mutant primer with a single base change to convert the tyrosine to phenylalanine. In the case of YYY111–113, the three adjacent tyrosines were treated as a unit and mutated together to phenylalanines. The first PCR used the mutagenic primer and the upstream primer. The second PCR used the amplified, gel-purified product of the first reaction (Gene Clean II; Bio Labs 101, Vista, CA) and the downstream oligonucleotide as primers. In this way a stretch of mutant DNA flanked by two unique restriction sites was obtained; the product was double digested and ligated into the parent channel backbone using T4 DNA ligase (Promega). The resulting mutant construct was sequenced using a cycle-sequencing reaction (Prism) and an automated sequencer (Applied Biosystems Inc., Princeton, NJ) to verify the mutation and detect PCR errors.
RESULTS
Characteristics of cultured OBNs
OBNs from neonatal rats can be maintained in culture for as long as 2 months and are readily amenable to patch recording (Huettner and Baughman, 1986; Egan et al., 1992). The cultures contain both glial-like and neuronal cell types that we characterized immunocytochemically with a neural cell-typing kit (Boehringer Mannheim). Astrocytes (GFAP-positive) constitute the majority of a confluent mitotic cell layer that also contains scattered fibroblasts (fibronectin positive) and oligodendrocyte-like cells (Gal C-positive). On top of this layer are two types of neurons that can be distinguished by their morphology. The first type is pyramidal shaped and has a single large neurite extending from each of its corners. The second type is bipolar, which in later stages of cell culture, is seen also in clusters independent of the supporting glial-like cell layer (Frosch and Dichter, 1984). As described previously for olfactory bulb neurons (Trombley and Westbrook, 1990; Bufler et al., 1992), the pyramidal cells are probably mitral–tufted cells, and the bipolar cells are probably granule cells. The cultured neurons could be divided into two distinct subsets based on the rate of inactivation of the voltage-dependent outward current (data not shown); however all cells responded to insulin and Src in the same way, and there was no obvious correlation between inactivation rate and cell morphology, and hence the data were not divided by cell type.
Modulation of voltage-dependent outward current in OBNs by insulin
Several recent studies have demonstrated that the activation of receptor tyrosine kinases by appropriate ligands can modulate neuronal ion channels (Jonas et al., 1996; Hilborn et al., 1998). Because insulin receptors are prominent in the olfactory bulb (Gupta et al., 1992; Folli et al., 1994), we tested the effects of insulin on outward currents in cultured olfactory bulb neurons. As shown in Figure1A, insulin treatment decreases the amplitude of the outward current evoked by a depolarizing voltage pulse. Although TrkA receptors that bind NGF are also present in the olfactory bulb (Sobreviela et al., 1994), prolonged NGF treatment does not affect the amplitude of the outward current (Fig.1B). This result demonstrates that there is selective coupling of some, but not all, receptor tyrosine kinases to potassium channels in OBNs.
Fig. 1.
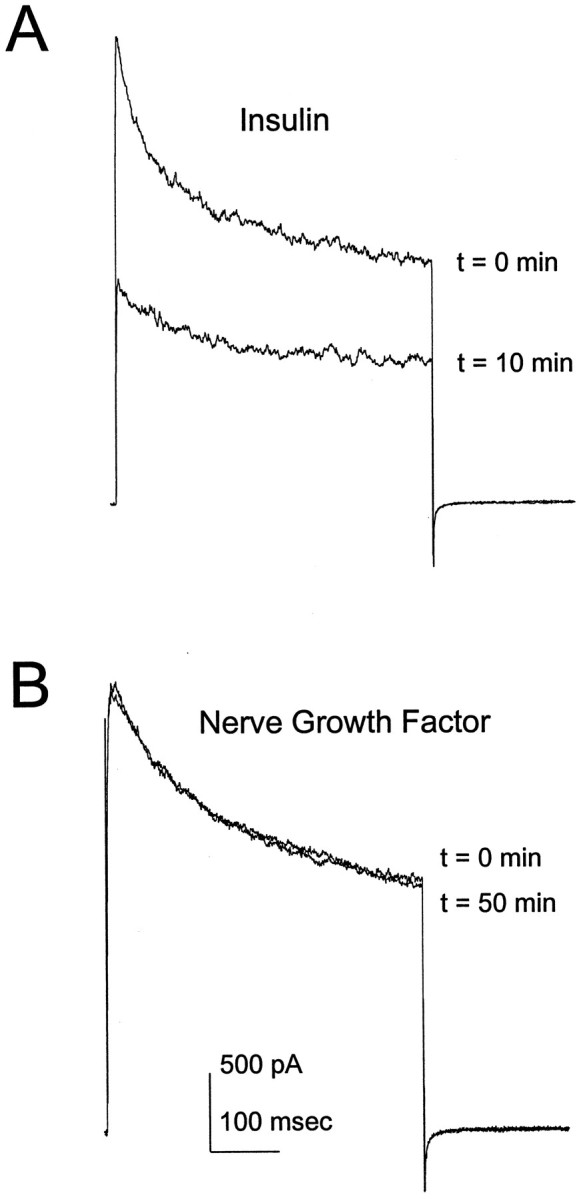
Effects of insulin and nerve growth factor on OBN outward current. Whole-cell outward current responses were elicited by voltage steps to +40 mV from a holding potential of −90 mV. Cells were allowed to stabilize for 10 min after achieving the whole-cell recording configuration, and the control outward current was recorded (t = 0). Insulin (10 μg/ml) (A) or nerve growth factor (100 nm) (B) was added to the bath att = 0, and outward current was measured at 1 min intervals thereafter. The traces shown were elicited 10 (A) or 50 min (B) after addition of the ligand.
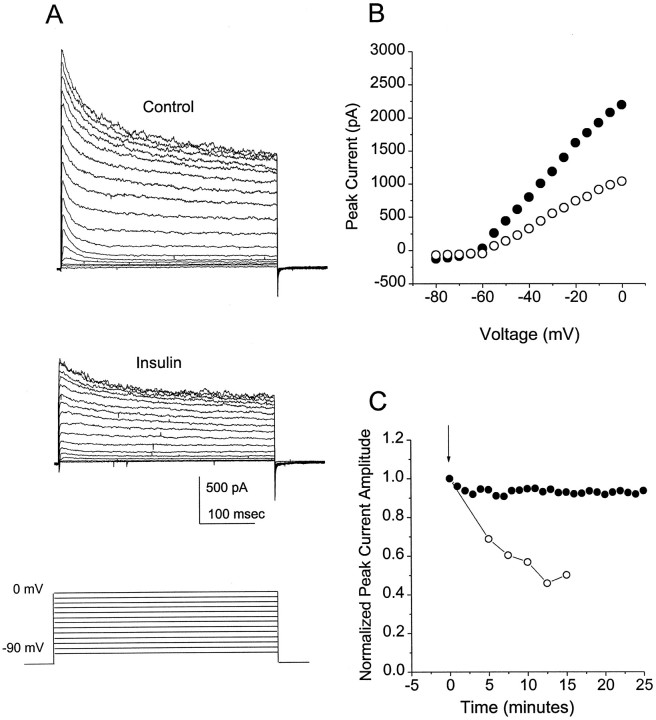
As shown in Figure 2, Aand B, the suppression of outward current by insulin can be seen at all depolarizing voltages at which outward current can be evoked. The effect of insulin takes several minutes to develop (Fig.2C), consistent with the idea that modulation of current involves the activation of an intracellular metabolic cascade downstream from the insulin receptor tyrosine kinase. Generally a steady state suppression of ∼50% is reached 10–20 min after application of insulin.
Fig. 2.
Characteristics of the OBN response to insulin.A, Outward current was elicited by voltage steps every 30 sec from a holding potential of −90 mV to depolarizing potentials between −70 and 0 mV (5 mV increments). Shown are the currents elicited before (Control) and 10 min after (Insulin) application of 10 μg/ml insulin to the bath.B, Plot of the peak current amplitude as a function of the voltage during the depolarizing pulse. C, Change in peak outward current as a function of time after addition (arrow) of 10 μg/ml insulin (○) or control OBN bath solution (•). The current at each time point was normalized to the current at t = 0 for that cell.
Modulation of voltage-dependent outward current in OBNs by Src
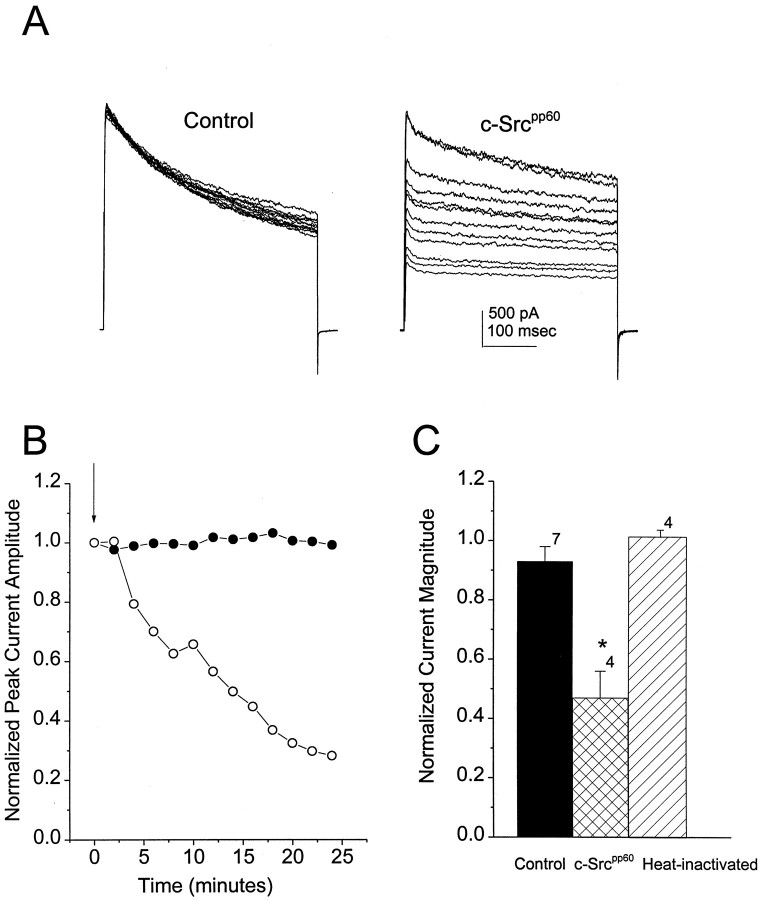
Among the downstream targets of receptor tyrosine kinases are members of the Src family of nonreceptor tyrosine kinases (Hilborn et al., 1998). Because it is known that Src can interact with and suppress the activity of several cloned potassium channels (Holmes et al., 1996b; Fadool et al., 1997), we investigated whether Src might mimic the actions of insulin on outward current in cultured OBNs. As shown in Figure 3A, when active recombinant Src kinase together with MgATP is included in the patch electrode, the outward current evoked by a depolarizing step to +40 mV decreases with time after achieving the whole-cell patch recording configuration. The time course of suppression by Src (Fig.3B) is comparable to that after insulin treatment (Fig.2C), although it is not clear whether this prolonged time course reflects the involvement of a downstream cascade or simply the time required for Src to diffuse from the electrode into the cell. Less than half of the outward current remains after 24 min in the whole-cell recording configuration when Src is included in the patch electrode, whereas there is no significant decrease in the current during this time in the absence of Src (Fig.3B,C). Heat-inactivated Src does not suppress the outward current (Fig. 3C), and Src is ineffective in the absence of ATP (data not shown), suggesting that the tyrosine kinase activity of Src is required to produce the modulation.
Fig. 3.
Effect of Src on OBN outward current.A, Outward currents were elicited by depolarizing from −90 to +40 mV at 1 min intervals. Whole-cell patch electrodes were back-filled with either control patch solution (Control) or 0.5 U of recombinant c-Src (c-Srcpp60). Every second pulse during a 24 min recording period is shown for each cell.B, Change in peak outward current as a function of time in a control (•) and an Src-treated (○) cell. Normalization as in Figure 2. C, Mean normalized peak current amplitudes after 24 min of recording for cells treated with control patch solution (Control) or active c-Src (c-Srcpp60). *Significantly different, Student’s t test. Shown also for comparison is the normalized peak current remaining after the same time period in cells treated with heat-inactivated c-Src (Heat-inactivated).
Modulation of voltage-dependent outward current in OBNs by pervanadate
To determine whether the outward current in OBNs can be modulated by endogenous tyrosine kinases, we treated cells with pervanadate while recording current in the whole-cell patch configuration. At concentrations in the micromolar range, pervanadate specifically inhibits tyrosine phosphatases and has little effect on serine–threonine phosphatases (Bourgoin and Grinstein, 1992). As shown in Figure 4A, the outward current amplitude in response to a depolarizing pulse to +40 mV is substantially decreased after 10 min treatment with 100 μm pervanadate. Suppression of current was seen with as little as 10 μm pervanadate (data not shown). The time course (Fig. 4B) and extent (Fig. 4C) of the suppression by pervanadate are comparable to those produced by insulin or Src treatment. These results demonstrate that there is a constitutive phosphorylation and dephosphorylation cycle in OBNs, resulting from the activities of endogenous tyrosine kinases and phosphatases, that can influence the amplitude of the voltage-dependent outward current.
Fig. 4.
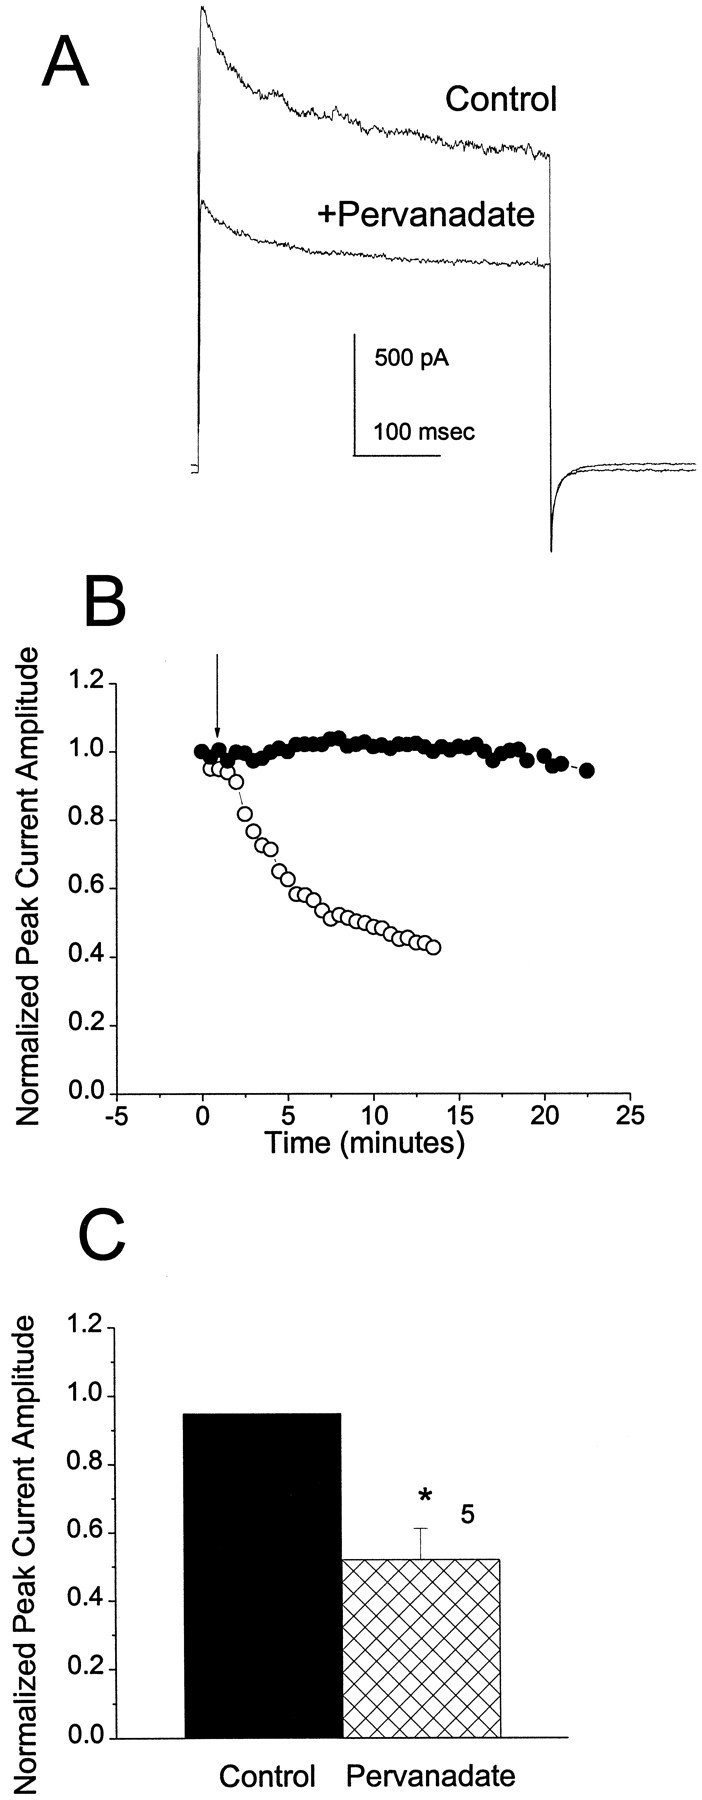
Effect of pervanadate on OBN outward current.A, Outward current elicited by a depolarization from −90 to +40 mV before (Control) and 5 min after (Pervanadate) addition of 100 μm sodium pervanadate to the bath. B, Change in peak outward current as a function of time after addition (arrow) of either carrier solution (•) or pervanadate (○). Normalization as in Figure 2. C, Mean normalized peak current amplitude after 5 min of recording for cells treated with carrier solution (Control) or 100 μm pervanadate (Pervanadate). *Significantly different, pairedt test.
Characterization of the voltage-dependent outward current in OBNs
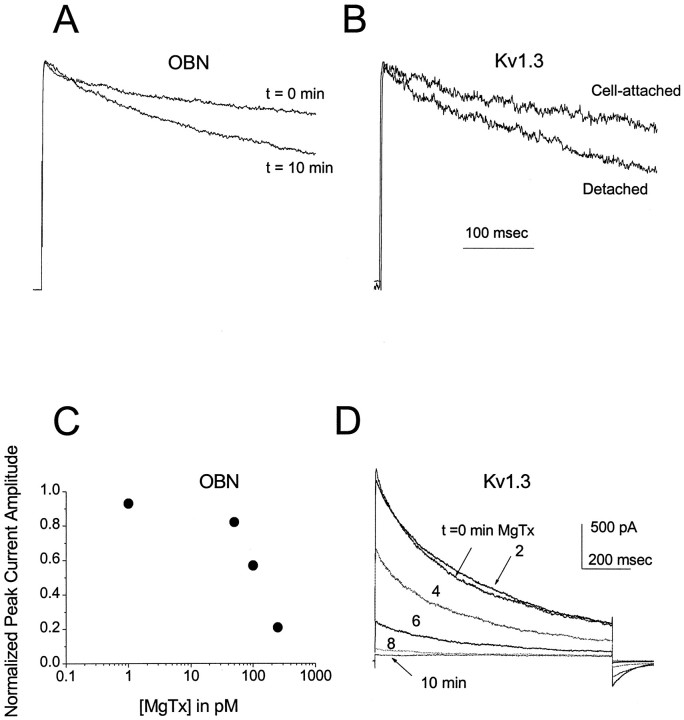
OBNs express a variety of potassium channels that normally contribute to the total outward current (Wang et al., 1996; Chen and Shepherd, 1997). Because the concentrations of sodium and calcium in our whole-cell patch electrodes were kept very low, the prominent sodium-dependent (Egan et al., 1992) and calcium-dependent (Egan et al., 1993) potassium channels in these neurons are not activated under the conditions of our experiments. Thus Kv channels, several of which are expressed in the olfactory bulb, must be responsible for most of the outward current seen in Figures 1-4. Several lines of evidence suggest that a major portion of the Kv current is carried by channels that resemble the cloned Kv1.3 potassium channel. First, it is known that the rate of C-type inactivation of cloned Kv1.3 expressed inXenopus oocytes increases as a function of time when membrane patches are detached from the cell in the inside-out recording configuration (Marom et al., 1993). Similarly, the inactivation rate of native Kv1.3 in T lymphocytes increases with time in the whole-cell recording configuration (Oleson et al., 1993). As shown in Figure5A, the voltage-dependent outward current in OBNs also exhibits faster C-type inactivation with time in the whole-cell recording configuration, comparable to the change in inactivation kinetics of Kv1.3 in detached inside-out patches from HEK 293 cells (Fig. 5B).
Fig. 5.
Comparison of outward current in OBNs and HEK 293 cells. A, Inactivation kinetics of OBN outward current immediately (t = 0 min) and 10 min after (t = 10 min) achieving the whole-cell recording configuration. B, Inactivation kinetics of Kv1.3 current in a cell-attached patch on a HEK 293 cell and 10 min after detaching in the inside-out patch configuration. For both A andB, the peak currents are normalized to better visualize the inactivation kinetics. C, Plot of the normalized peak outward current amplitude in an OBN 10 min after application of the indicated concentration of MgTx to the bath. Each point represents the mean for three to four cells; currents were normalized to the initial current for each cell. D, Kv1.3 currents in a cell-attached patch on a HEK 293 cell evoked by a depolarizing voltage step from −90 to +40 mV at the indicated times after achieving a gigaohm seal. 100 pm MgTx was present in the patch electrode.
Pharmacological experiments also suggest that much of the voltage-dependent outward current in OBNs is Kv1.3-like. The scorpion toxin MgTx selectively binds to and blocks Kv1.3 with very high affinity in the picomolar range; in contrast, MgTx blocks other Kv channels, only at much higher (micromolar) concentrations (Knaus et al., 1995). We find that 100–250 pm MgTx blocks 50–83% of the outward current in OBNs (Fig. 5C) and all of the Kv1.3 current in HEK 293 cells (Fig. 5D) within 10 min.
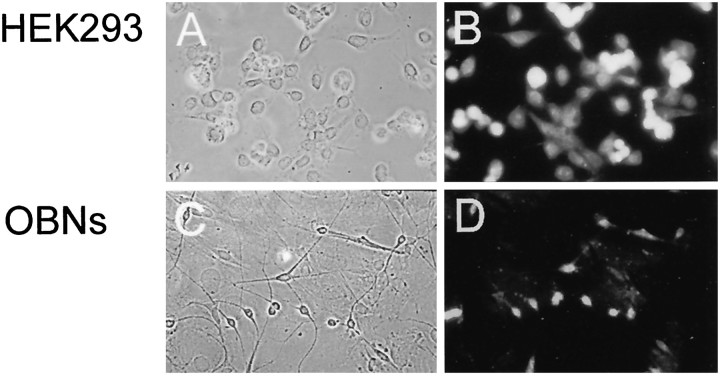
Finally, we used immunocytochemical analysis to determine whether Kv1.3 is present in the cultured OBNs. Previous experiments using in situ hybridization demonstrated that the highest concentration of Kv1.3 messenger RNA is in the olfactory bulb and olfactory cortex (Kues and Wunder, 1992). As shown in Figure 6, an antibody directed against a putative extracellular loop of Kv1.3 stained HEK 293 cells that had been transfected with Kv1.3 cDNA. Note that not all the cells present in the field of view (Fig.6A) were stained with the antibody (Fig.6B), reflecting the fact that transfection efficiency was <100%. In contrast, all of the OBNs in the field (Fig.6C) stained with the anti-Kv1.3 antibody (Fig.6D), whereas the mitotic glial-like cell layer on which the neurons were growing did not stain. Both the mitral and granule neurons appeared to stain equally well for Kv1.3.
Fig. 6.
Expression of Kv1.3 in HEK 293 cells and OBNs. Photomicrographs of Kv1.3-transfected HEK 293 cells (A, B) and OBNs (C, D), under bright-field illumination (A, C) and epifluorescence (B, D). Cells were immunolabeled with an antibody directed against a putative extracellular domain in Kv1.3 and visualized with a fluorescent-conjugated secondary antibody.
Mutational analysis of pervanadate-induced modulation of Kv1.3
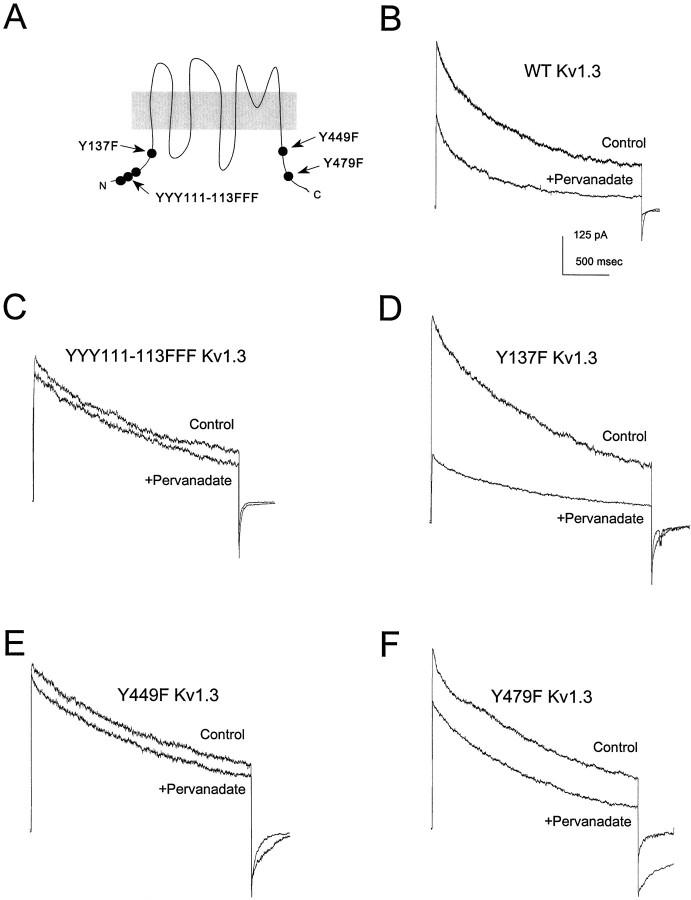
These findings suggested that mutational analysis of cloned Kv1.3 expressed in HEK 293 cells might provide insight into the molecular details of modulation of outward current in OBNs. As shown in Figure7B and Table1, pervanadate treatment decreases the amplitude of wild-type Kv1.3 current without influencing channel kinetics, confirming our previous report (Holmes et al., 1996a). Because there are at least six tyrosine residues in the channel protein that might serve as substrates for tyrosine kinases (Fig.7A), we performed an extensive mutational analysis. The three adjacent tyrosine residues at positions 111–113 were treated as a unit and mutated together to phenylalanines, and the three tyrosines at positions 137, 449, and 479 were mutated individually to phenylalanines; the properties of each of the four Kv1.3 mutant channels were then examined. All of the mutant channels expressed well in HEK 293 cells and could be activated by depolarization, and none of the mutations altered the basal inactivation or deactivation kinetics of Kv1.3 (Table 1).
Fig. 7.
Mutational analysis of the effect of pervanadate on Kv1.3 expressed in HEK 293 cells. A, Schematic representation of the positions of the tyrosine residues in Kv1.3 that were mutated to phenylalanines. B–F, Kv1.3 outward currents evoked in cell-attached membrane patches by depolarizations from −80 to +40 mV, 20 min after addition of carrier (Control) or 100 μm sodium pervanadate (+Pervanadate) to the bath. The particular mutant channel analyzed is indicated in each panel (WT, wild-type).
Table 1.
Properties and modulation by pervanadate of wild-type and mutant Kv1.3 channels
| Channel construct and treatment | Peak current (pA) | Inactivation time constant (msec) | Deactivation time constant (msec) |
|---|---|---|---|
| Wild-type Kv1.3 (n = 10) | |||
| Control | 374 ± 69 | 861 ± 117 | 30 ± 4 |
| Pervanadate | 210 ± 40* | 813 ± 73 | 34 ± 9 |
| Y449F Kv1.3 (n = 6) | |||
| Control | 491 ± 85 | 833 ± 72 | 37 ± 5 |
| Pervanadate | 466 ± 79 | 758 ± 79 | 63 ± 24 |
| YYY111-113FFF Kv1.3 (n = 4) | |||
| Control | 477 ± 120 | 775 ± 83 | 21 ± 4 |
| Pervanadate | 408 ± 86 | 677 ± 87 | 14 ± 3 |
| Y137F Kv1.3 (n = 8) | |||
| Control | 494 ± 134 | 838 ± 113 | 30 ± 3 |
| Pervanadate | 214 ± 90* | 521 ± 91* | 12 ± 3* |
| Y479F Kv1.3 (n = 5) | |||
| Control | 837 ± 252 | 789 ± 161 | 33 ± 7 |
| Pervanadate | 533 ± 115* | 683 ± 76 | 25 ± 4 |
Currents were evoked by 1 sec depolarizing pulses to +40 mV. Pervanadate treatment was as described for Figure 7. Values are means ± SEM. Time constant values were estimated from exponential fits to the inactivating or deactivating portion of the current. There were no significant differences (ANOVA) in basal biophysical parameters of the wild-type and mutant channels.
*Pervanadate-treated is significantly different from control by pairedt test.
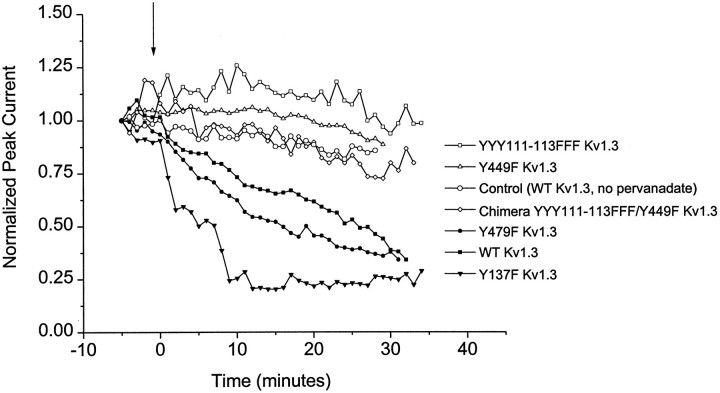
Neither Y137 nor Y479 appears to be necessary for the suppression of current by pervanadate, because the modulation persists in the Y137F (Fig. 7D) and Y479F (Fig. 7F) mutant channels (see also Table 1). In contrast, both Y449 and at least one of the three tyrosines in the YYY111–113 triplet are necessary for the modulation because no effect of pervanadate is seen in either the YYY111–113FFF (Fig. 7C) or the Y449F (Fig. 7E) mutant channel. As shown in Figure 8, these two mutant channels do not respond even to prolonged treatment with pervanadate.
Fig. 8.
Time course of current suppression by pervanadate for wild-type (WT) and mutant Kv1.3 channels. Outward currents in cell-attached patches on channel-expressing HEK 293 cells elicited by depolarizations from −80 to +40 mV at 1 min intervals. 100 μm sodium pervanadate was added at thearrow. Control (○) indicates WT Kv1.3 treated with carrier solution instead of pervanadate.
Mutational analysis of insulin-induced modulation of Kv1.3
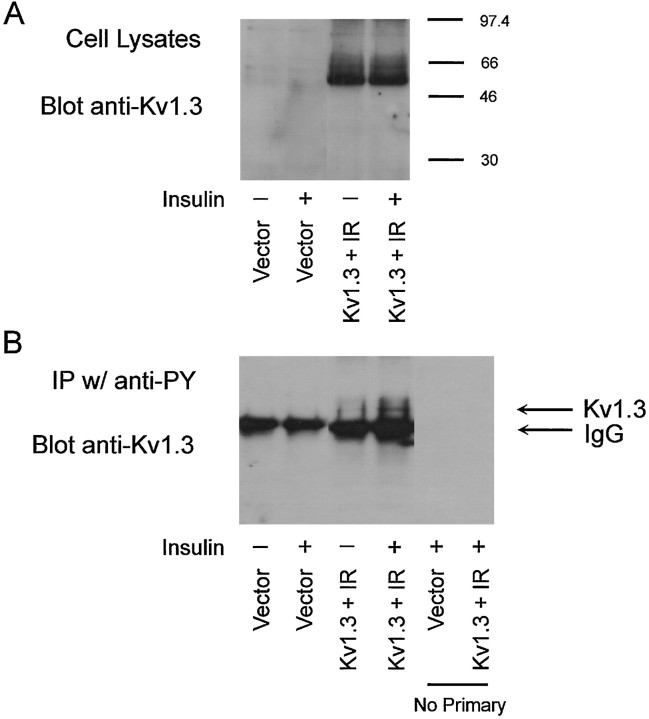
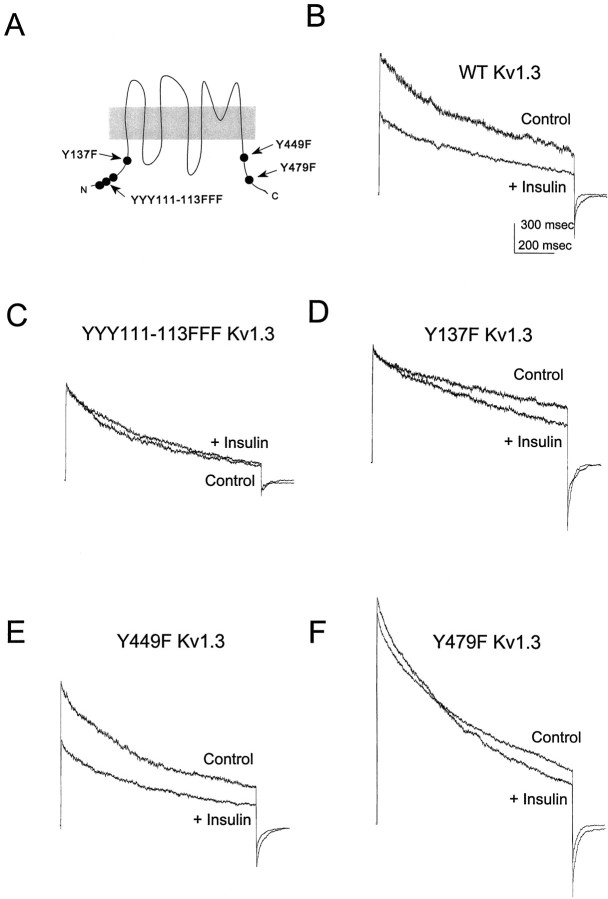
Because insulin can participate in a variety of signaling pathways and may have effects that are independent of tyrosine phosphorylation, we used an immunoprecipitation–Western blot strategy (Holmes et al., 1996a) to measure the effect of insulin on the tyrosine phosphorylation of Kv1.3 in HEK 293 cells. As shown in Figure9B, insulin treatment increases the tyrosine phosphorylation of Kv1.3 without affecting the level of channel protein (Fig. 9A). Hence we examined the effects of insulin on the functional properties of wild-type and mutant Kv1.3 channels as described above for pervanadate. Insulin suppresses wild-type Kv1.3 current in HEK 293 cells cotransfected with the IR (Fig. 10B, Table2). Although Y449 does not appear to be necessary for the current suppression (Fig. 10E), mutation of the YYY111–113 triplet (Fig. 10C), Y137 (Fig.10D), or Y479 (Fig. 10F) to phenylalanine eliminates this response to insulin (Table 2).
Fig. 9.
Insulin increases the tyrosine phosphorylation of Kv1.3. HEK 293 cells were transfected with vector alone or cDNA encoding Kv1.3 and the IR. Two days later, the serum-containing medium was replaced with Opti-MEM (Life Technologies) for 20 min, and cells were then treated with either Opti-MEM vehicle (−) or 20 μg/ml insulin (+) for 20 min. A, Western blot to measure the amount of Kv1.3 protein expressed. B, Immunoprecipitation–Western blot to measure tyrosine-phosphorylated Kv1.3. The prominent protein band below the Kv1.3 band is the heavy chain of IgG.
Fig. 10.
Mutational analysis of the effect of insulin on Kv1.3 expressed together with the IR in HEK 293 cells.A, Schematic representation of the positions of the tyrosine residues in Kv1.3 that were mutated to phenylalanines.B–F, Kv1.3 outward currents evoked in cell-attached membrane patches by depolarizations from −80 to +40 mV, 20 min after addition of vehicle (Control) or 10 μg/ml insulin (+ Insulin) to the bath. The particular mutant channel analyzed is indicated in each panel (WT, wild-type).
Table 2.
Properties and modulation by insulin of wild-type and mutant Kv1.3 channels
| Channel construct and treatment | Peak current (pA) | Inactivation time constant (msec) | Deactivation time constant (msec) |
|---|---|---|---|
| Wild-type Kv1.3 (n = 14) | |||
| Control | 1411 ± 289 | 711 ± 52 | 34 ± 5 |
| Insulin | 1195 ± 293* | 616 ± 75 | 42 ± 9 |
| Y449F Kv1.3 (n = 6) | |||
| Control | 823 ± 220 | 736 ± 92 | 27 ± 4 |
| Insulin | 727 ± 227* | 621 ± 67 | 26 ± 7 |
| YYY111-113FFF Kv1.3 (n = 4) | |||
| Control | 483 ± 139 | 725 ± 121 | 34 ± 3 |
| Insulin | 444 ± 121 | 636 ± 87 | 43 ± 8 |
| Y137F Kv1.3 (n = 6) | |||
| Control | 1186 ± 467 | 788 ± 45 | 25 ± 3 |
| Insulin | 1081 ± 454 | 715 ± 109 | 41 ± 5* |
| Y479F Kv1.3 (n = 6) | |||
| Control | 2167 ± 303 | 642 ± 70 | 31 ± 4 |
| Insulin | 2190 ± 412 | 578 ± 78 | 34 ± 5 |
Cells were transfected with both Kv1.3 and the IR. Currents were evoked by 1 sec depolarizing pulses to +40 mV. Insulin treatment was as described for Figure 10. Values are means ± SEM. Time constant values were estimated from exponential fits to the inactivating or deactivating portion of the current.
*Insulin-treated is significantly different from control by pairedt test.
DISCUSSION
The olfactory bulb receives odor information from the primary olfactory receptor neurons and processes it in a way that serves as the basis for olfactory perception (Chen and Shepherd, 1997). At least two peripheral processes in olfaction, pheromone transduction (Zufall and Hatt, 1991) and termination of the odorant response (Boekhoff et al., 1992), involve intracellular messenger systems and protein phosphorylation. In contrast, little is known about the role of phosphorylation in information processing in the olfactory bulb. Insulin receptors and insulin-dependent tyrosine kinase activity are present at high levels in the rat olfactory bulb (Gupta et al., 1992;Folli et al., 1994), and the Trk receptors for several different neurotrophins have also been detected (Sobreviela et al., 1994; Roskams et al., 1996; Yan et al., 1997).
We show here that insulin treatment suppresses the voltage-dependent outward current in cultured OBNs. Insulin has also been shown to influence ionic currents in Aplysia neurons (Jonas et al., 1996). Both mitral cells and granule cells, the two major morphologically distinguishable neuron types in the olfactory bulb, appear to be affected in the same way by insulin. Because the nonreceptor tyrosine kinase Src plays a key role in the pathways activated by many receptor tyrosine kinases, we asked whether Src might participate in this action of insulin on OBN outward current. Direct application of active Src kinase to the cytoplasm of OBNs mimics the suppression produced by insulin treatment. It has been shown recently that several different growth factor receptor tyrosine kinases inhibit sodium currents in PC12 cells via the Src-signaling pathway (Hilborn et al., 1998). However, we cannot rule out the possibility that, in OBNs, insulin and Src operate via parallel but independent pathways to produce similar suppression of outward current. It is interesting that inhibition of endogenous tyrosine phosphatase activity in the OBNs with pervanadate also leads to suppression of the outward current, presumably via the actions of endogenous tyrosine kinase(s). Again, this may be a parallel phenomenon, and we cannot be certain that the endogenous tyrosine kinase activity is important for the action of insulin. Future experiments with inhibitors that interfere with the coupling of the insulin receptor tyrosine kinase to specific downstream signaling pathways will be required to address this question.
It is difficult to identify specific amino acid residues that contribute to the modulation of native ion channels in neurons. However, the Kv1.3 potassium channel is expressed prominently in olfactory bulb and in the cultured OBNs. Although clearly there are other potassium channels in these neurons, MgTx sensitivity and other criteria suggest that as much as 80% of the voltage-dependent outward current may be attributable to Kv1.3 channels. In addition, we have shown previously that cloned Kv1.3 expressed in HEK 293 cells, like the voltage-dependent outward current in OBNs, is suppressed by insulin (Bowlby et al., 1997), Src (Fadool et al., 1997), and pervanadate (Holmes et al., 1996a) treatment. Accordingly, we decided to carry out detailed mutational analysis of Kv1.3 to determine whether specific tyrosine residues are required for its modulation by these treatments. We showed previously that at least one tyrosine residue, at position 449 of Kv1.3, is involved in the modulation by pervanadate (Holmes et al., 1996a) and that Y449 together with another tyrosine residue at position 137 is required for current suppression by Src (Fadool et al., 1997). The fact that several tyrosines are involved in the modulation of Kv1.3 by Src prompted us to re-examine the effect of pervanadate. The more extensive mutational analysis of the pervanadate response presented here demonstrates that at least one additional tyrosine residue in the YYY111–113 triplet is required together with Y449 for pervanadate modulation. In the case of insulin, the modulation is even more complex, because the YYY111–113 triplet, Y137, and Y479 are all required for the suppression of current. Adding to the complexity is our finding that activation of another growth factor receptor, the EGFr, also suppresses Kv1.3, but only Y479 is necessary for this response (Bowlby et al., 1997). It is striking that different tyrosines or combinations of tyrosines are involved in the responses of Kv1.3 to these different agents, and yet in each case the current amplitude is suppressed. Although the mutational analysis demonstrates that the tyrosines are necessary for the responses, it has not yet been shown unequivocally that it is their phosphorylation that is required. If this turns out to be the case, it seems likely that the specific kinase or set of kinases that phosphorylates the channel is different for each of the modulatory phenomena.
Both serine–threonine and tyrosine phosphorylation pathways can modulate potassium currents in OBNs, and such modulation probably plays an important role in the response of the olfactory bulb to sensory input. The present data add to our growing awareness of the complexity of the signal transduction pathways that impinge on ion channels. Unraveling the molecular details of the responses of particular ion channels to activation of these pathways will be essential for understanding information processing in the olfactory system as well as in other parts of the brain.
Footnotes
This work was supported by grants from the National Institutes of Health to I.B.L. and a National Institutes of Health national research service award and a FIRST award to D.A.F. We are grateful to Richard Huganir and Richard Roth for cDNA constructs, James Douglass for antibodies, Jing Wang and James Fadool for technical hints, and Jeremy Scarpate, Deanne Tabb, and especially Kristal Tucker for technical assistance.
Correspondence should be addressed to Dr. Debra A. Fadool, Department of Zoology and Wildlife Sciences, 331 Funchess Hall, Auburn University, Auburn, AL 36849-5415.
REFERENCES
- 1.Boekhoff I, Schleicher S, Strotman J, Breer H. Odor-induced phosphorylation of olfactory cilia proteins. Proc Natl Acad Sci USA. 1992;89:11983–11987. doi: 10.1073/pnas.89.24.11983. [DOI] [PMC free article] [PubMed] [Google Scholar]
- 2.Bourgoin S, Grinstein S. Peroxides of vanadate induce activation of phospholipase D in HL-60 cells. J Biol Chem. 1992;267:11908–11916. [PubMed] [Google Scholar]
- 3.Bowlby MR, Fadool DA, Holmes TC, Levitan IB. Modulation of the Kv1.3 potassium channel by receptor tyrosine kinases. J Gen Physiol. 1997;110:601–610. doi: 10.1085/jgp.110.5.601. [DOI] [PMC free article] [PubMed] [Google Scholar]
- 4.Bufler J, Zufall F, Franke C, Hatt H. Patch-clamp recordings of spiking and nonspiking interneurons from rabbit olfactory bulb slices: membrane properties and ionic currents. J Comp Physiol [A] 1992;170:145–152. doi: 10.1007/BF00196896. [DOI] [PubMed] [Google Scholar]
- 5.Cai Y-C, Douglass J. In vivo and in vitro phosphorylation of the T lymphocyte type n (Kv1.3) potassium channel. J Biol Chem. 1993;268:23720–23727. [PubMed] [Google Scholar]
- 6.Chen WR, Shepherd GM. Membrane and synaptic properties of mitral cells in slices of rat olfactory bulb. Brain Res. 1997;745:344–348. doi: 10.1016/s0006-8993(96)01150-x. [DOI] [PubMed] [Google Scholar]
- 7.Egan TM, Dagan D, Kupper J, Levitan IB. Properties and rundown of sodium-activated potassium channels in rat olfactory bulb neurons. J Neurosci. 1992;12:1964–1976. doi: 10.1523/JNEUROSCI.12-05-01964.1992. [DOI] [PMC free article] [PubMed] [Google Scholar]
- 8.Egan TM, Dagan D, Levitan IB. Properties and modulation of a calcium-activated potassium channel in rat olfactory bulb neurons. J Neurophysiol. 1993;69:1433–1442. doi: 10.1152/jn.1993.69.5.1433. [DOI] [PubMed] [Google Scholar]
- 9.Fadool DA, Holmes TC, Berman K, Dagan D, Levitan IB. Tyrosine phosphorylation modulates current amplitude and kinetics of a neuronal voltage-gated potassium channel. J Neurophysiol. 1997;78:1563–1573. doi: 10.1152/jn.1997.78.3.1563. [DOI] [PubMed] [Google Scholar]
- 10.Fantus IG, Kadota S, Deragon G, Foster B, Posner BI. Pervanadate [peroxide(s) of vanadate] mimics insulin action in rat adipocytes via activation of the insulin receptor by tyrosine kinase. Biochemistry. 1989;28:8864–8871. doi: 10.1021/bi00448a027. [DOI] [PubMed] [Google Scholar]
- 11.Folli F, Bonfanti L, Renard E, Kahn CR, Merighi A. Insulin receptor substrate-1 (IRS-1) distribution in the rat central nervous system. J Neurosci. 1994;14:6412–6422. doi: 10.1523/JNEUROSCI.14-11-06412.1994. [DOI] [PMC free article] [PubMed] [Google Scholar]
- 12.Frosch MP, Dichter MA. Physiology and pharmacology of olfactory bulb neurons in dissociated cell culture. Brain Res. 1984;290:321–332. doi: 10.1016/0006-8993(84)90950-8. [DOI] [PubMed] [Google Scholar]
- 13.Gupta G, Azam M, Baquer NZ. Modulation of rat brain insulin receptor kinase activity by diabetes. Neurochem Int. 1992;20:487–492. doi: 10.1016/0197-0186(92)90027-o. [DOI] [PubMed] [Google Scholar]
- 14.Hilborn MD, Vaillancourt RR, Rane SG. Growth factor receptor tyrosine kinases acutely regulate neuronal sodium channels through the Src signaling pathway. J Neurosci. 1998;18:590–600. doi: 10.1523/JNEUROSCI.18-02-00590.1998. [DOI] [PMC free article] [PubMed] [Google Scholar]
- 15.Holmes TC, Fadool DA, Levitan IB. Tyrosine phosphorylation of the Kv1.3 potassium channel. J Neurosci. 1996a;16:1581–1590. doi: 10.1523/JNEUROSCI.16-05-01581.1996. [DOI] [PMC free article] [PubMed] [Google Scholar]
- 16.Holmes TC, Fadool DA, Ren R, Levitan IB. Association of Src tyrosine kinase with a human potassium channel mediated by SH3 domain. Science. 1996b;274:2089–2091. doi: 10.1126/science.274.5295.2089. [DOI] [PubMed] [Google Scholar]
- 17.Hopfield JF, Tank DW, Greengard P, Huganir RL. Functional modulation of the nicotinic acetylcholine receptor by tyrosine phosphorylation. Nature. 1988;336:677–680. doi: 10.1038/336677a0. [DOI] [PubMed] [Google Scholar]
- 18.Huang X-Y, Morielli AD, Peralta EG. Tyrosine kinase-dependent suppression of a potassium channel by the G-protein-coupled m1 muscarinic acetylcholine receptor. Cell. 1993;75:1145–1156. doi: 10.1016/0092-8674(93)90324-j. [DOI] [PubMed] [Google Scholar]
- 19.Huettner JE, Baughman RW. Primary culture of identified neurons from the visual cortex of postnatal rats. J Neurosci. 1986;6:3044–3060. doi: 10.1523/JNEUROSCI.06-10-03044.1986. [DOI] [PMC free article] [PubMed] [Google Scholar]
- 20.Jonas EA, Kaczmarek LK. Regulation of potassium channels by protein kinases. Curr Opin Neurobiol. 1996;6:318–323. doi: 10.1016/s0959-4388(96)80114-0. [DOI] [PubMed] [Google Scholar]
- 21.Jonas EA, Knox RJ, Kaczmarek JK, Schwartz JH, Solomon DH. Insulin receptor in Aplysia neurons: characterization, molecular cloning, and modulation of ion currents. J Neurosci. 1996;16:1645–1658. doi: 10.1523/JNEUROSCI.16-05-01645.1996. [DOI] [PMC free article] [PubMed] [Google Scholar]
- 22.Knaus H-G, Koch ROA, Eberhart A, Kaczorowski GJ, Garcia ML, Slaughter RS. [125I]Margatoxin, an extraordinarily high affinity ligand for voltage-gated potassium channels in mammalian brain. Biochemistry. 1995;34:13627–13634. doi: 10.1021/bi00041a043. [DOI] [PubMed] [Google Scholar]
- 23.Kues WA, Wunder F. Heterogeneous expression patterns of mammalian potassium channel genes in developing and adult rat brain. Eur J Neurosci. 1992;4:1296–1308. doi: 10.1111/j.1460-9568.1992.tb00155.x. [DOI] [PubMed] [Google Scholar]
- 24.Kupper J, Bowlby MR, Marom S, Levitan IB. Intracellular and extracellular amino acids that influence C-type inactivation and its modulation in a voltage-dependent potassium channel. Pflügers Arch. 1995;430:1–11. doi: 10.1007/BF00373833. [DOI] [PubMed] [Google Scholar]
- 25.Landt O, Grunert H, Hahn U. General method for rapid site-directed mutagenesis using the polymerase chain reaction. Gene. 1990;96:125–128. doi: 10.1016/0378-1119(90)90351-q. [DOI] [PubMed] [Google Scholar]
- 26.Levitan IB. Modulation of ion channels by protein phosphorylation and dephosphorylation. Annu Rev Physiol. 1994;56:193–212. doi: 10.1146/annurev.ph.56.030194.001205. [DOI] [PubMed] [Google Scholar]
- 27.Marom S, Goldstein SAN, Kupper J, Levitan IB. Mechanism and modulation of inactivation of the Kv3 potassium channel. Receptors Channels. 1993;1:81–88. [PubMed] [Google Scholar]
- 28.Mittman SC, Flaming DG, Copenhagen DR, Belgum JH. Bubble pressure measurement of micropipet tip outer diameter. J Neurosci Methods. 1987;22:161–166. doi: 10.1016/0165-0270(87)90010-0. [DOI] [PubMed] [Google Scholar]
- 29.Oleson DR, DeFelice LJ, Donahoe RM. A comparison of K+ channel characteristics in human T cells: perforated-patch versus whole-cell recording techniques. J Membr Biol. 1993;132:229–241. doi: 10.1007/BF00235740. [DOI] [PubMed] [Google Scholar]
- 30.Peralta EG. Dual modulation of a potassium channel by the m1 muscarinic and 2-adrenergic receptors. Life Sciences. 1995;56:957–964. doi: 10.1016/0024-3205(95)00034-4. [DOI] [PubMed] [Google Scholar]
- 31.Roskams AJI, Bethel MA, Hurt J, Ronnett GV. Sequential expression of Trks A, B, and C in the regenerating olfactory neuroepithelium. J Neurosci. 1996;16:1294–1307. doi: 10.1523/JNEUROSCI.16-04-01294.1996. [DOI] [PMC free article] [PubMed] [Google Scholar]
- 32.Sambrook J, Fritsch EF, Maniatas T. Molecular cloning: a laboratory manual. Cold Spring Harbor Laboratory; New York: 1989. [Google Scholar]
- 33.Sobreviela T, Clary DO, Reichardt LF, Brandabur MM, Kordower JH, Mufson EJ. Trk-A-immunoreactive profiles in the central nervous system: colocalization with neurons containing p75 nerve growth factor receptor, choline acetyltransferase, and serotonin. J Comp Neurol. 1994;350:587–611. doi: 10.1002/cne.903500407. [DOI] [PMC free article] [PubMed] [Google Scholar]
- 34.Trombley PQ, Westbrook GL. Excitatory synaptic transmission in cultures of rat olfactory bulb. J Neurophysiol. 1990;64:598–606. doi: 10.1152/jn.1990.64.2.598. [DOI] [PubMed] [Google Scholar]
- 35.Wang XY, McKenzie JS, Kemm RE. Whole-cell K+ currents in identified olfactory bulb output neurones of rats. J Physiol (Lond) 1996;490:63–77. doi: 10.1113/jphysiol.1996.sp021127. [DOI] [PMC free article] [PubMed] [Google Scholar]
- 36.Wang YT, Salter MW. Regulation of NMDA receptors by tyrosine kinases and phosphatases. Nature. 1994;369:233–235. doi: 10.1038/369233a0. [DOI] [PubMed] [Google Scholar]
- 37.Wickelgren I. Tracking insulin to the mind. Science. 1998;280:517–519. doi: 10.1126/science.280.5363.517. [DOI] [PubMed] [Google Scholar]
- 38.Yan Q, Radeke MJ, Matheson CR, Talvenheimo J, Welcher AA, Feinstein SC. Immunocytochemical localization of TrkB in the central nervous system of the adult rat. J Comp Neurol. 1997;378:135–157. [PubMed] [Google Scholar]
- 39.Yu X-M, Askalan R, Keil GJ, Salter MW. NMDA channel regulation by channel-associated protein tyrosine kinase Src. Science. 1997;275:674–678. doi: 10.1126/science.275.5300.674. [DOI] [PubMed] [Google Scholar]
- 40.Zufall F, Hatt H. Dual activation of a sex pheromone-dependent ion channel from insect olfactory dendrites by protein kinase C activators and cyclic GMP. Proc Natl Acad Sci USA. 1991;88:8520–8524. doi: 10.1073/pnas.88.19.8520. [DOI] [PMC free article] [PubMed] [Google Scholar]


