Abstract
Death of oligodendrocyte (OL) precursors can be triggered in vitro by cystine deprivation, a form of oxidative stress that involves depletion of intracellular glutathione. We report here that OLs demonstrate maturation-dependent differences in survival when subjected to free radical-mediated injury induced by glutathione depletion. Using immunopanning to isolate rat preoligodendrocytes (preOLs), we generated highly enriched populations of preOLs and mature OLs under chemically defined conditions. Cystine deprivation caused a similar decrease in glutathione levels in OLs at both stages. However, preOLs were completely killed by cystine deprivation, whereas mature OLs remained viable. Although the glutathione-depleting agents buthionine sulfoximine and diethylmaleate were more potent in depleting glutathione in mature OLs, both agents were significantly more toxic to preOLs. Glutathione depletion markedly increased intracellular free radical generation in preOLs, but not in mature OLs, as indicated by oxidation of the redox-sensitive probe dihydrorhodamine 123. The antioxidants α-tocopherol, idebenone, and glutathione monoethylester prevented the oxidation of dihydrorhodamine in cystine-depleted preOLs and markedly protected against cell death. When the intracellular glutathione level was not manipulated, preOLs were also more vulnerable than mature OLs to exogenous free radical toxicity generated by a xanthine–xanthine oxidase system. Ultrastructural features of free radical-mediated injury in glutathione-depleted preOLs included nuclear condensation, margination of chromatin, and mitochondrial swelling. These observations indicate that preOLs are significantly more sensitive to the toxic effects of glutathione depletion and that oligodendroglial maturation is associated with decreased susceptibility to oxidative stress.
Keywords: oligodendrocyte, glutathione, cystine, free radicals, oxidative stress, growth factor
Periventricular leukomalacia (PVL) is a lesion of the periventricular cerebral white matter that has its peak incidence in the premature infant and underlies the subsequent development of cerebral palsy and cognitive impairment (Volpe, 1995). PVL is initiated by cerebral ischemia as a consequence of the presence in the white matter of vascular end zones and of the occurrence in the premature infant of a pressure-passive circulation (Volpe, 1997). Impaired myelination is the principal pathological sequela of PVL (Rorke, 1992), a finding supported by brain imaging studies from clinically affected children (Flodmark et al., 1989; van de Bor et al., 1989).
Definition of the specific oligodendrocyte (OL) developmental stage when the vulnerability to injury is greatest would be a critical advance in the understanding of PVL but has been hampered by the lack of a suitable model system. We sought here to account for the propensity of PVL to occur in the premature infant by determining whether OLs demonstrate maturation-dependent differences in susceptibility to death induced by oxidative stress. We chose to study oxidative stress, because PVL is related to cerebral ischemia, and ischemia and reperfusion is well established to lead to generation of injurious oxygen free radicals (Hill, 1991; Traystman et al., 1991;Kelly, 1993). Thus, we developed an in vitro system to study two distinct OL maturational stages, the preoligodendrocyte (preOL) and the mature OL. The availability of stage-specific antibodies, developed against an array of sequentially expressed OL cell surface and myelin-specific glycolipids and glycoproteins (for review, see Pfeiffer et al., 1993), enabled us to isolate highly enriched populations of preOLs by immunopanning (Gard et al., 1993). The preOL, derived from A2B5 monoclonal antibody-positive OL progenitors, is the mitotically active premyelinating precursor to the mature myelin basic protein (MBP)-positive OL and is identified by immunoreactivity to the O4 but not the O1 monoclonal antibody (Pfeiffer et al., 1993; McMorris and McKinnon, 1996). The long-term maintenance of OLs was achieved using growth factors, including platelet-derived growth factor (PDGF), basic fibroblast growth factor (bFGF), and ciliary neurotrophic factor (CNTF), which promote their in vitro survival, proliferation, or differentiation (Barres and Raff, 1994).
We recently reported that cystine deprivation induced the death of a mixed population of OL precursors via a form of oxidative stress induced by depletion of intracellular glutathione (Yonezawa et al., 1996). These studies were conducted in a serum-containing system in which the dependence on cystine for OL survival could be prevented by a diffusible factor released by astrocyte-rich mixed glial cultures. The present study characterized the intrinsic vulnerability of OLs to death triggered by oxidative stress at defined maturational stages in a chemically defined system in which the extrinsic effects of serum- and glial-derived factors were eliminated. We found that preOLs and mature OLs displayed maturation-dependent differences in susceptibility to death caused by glutathione depletion.
MATERIALS AND METHODS
Oligodendrocyte cultures. Primary cultures of O4+O1− preOLs were prepared from the cerebral hemispheres of 4-d-old Sprague Dawley rats according to the immunopanning protocol of Gard et al. (1993). The isolated preOLs (2 × 10⁴) were seeded in 50 μl droplets of DMEM/Hepes-buffered Earle’s balanced salt solution (1:1) on coverslips (12 mm in diameter) (633029; Carolina Biological Supply, Burlington, NC) coated with 50 μg/ml poly-d-ornithine (P-0546; Sigma, St. Louis, MO). Five coverslips in a 35 mm diameter dish were incubated for 30 min at 36°C in a humidified CO2 incubator (95% air–5% CO2), after which 2 ml of a serum-free basal defined medium (BDM), prepared as previously described (Gard et al., 1993), was added to the dish. Cystine-containing BDM was prepared using cystine-free DMEM (custom formula 96–0214DJ; Life Technologies, Grand Island, NY). To generate cultures greatly enriched in either preOLs or mature OLs (see Results), the basal medium was supplemented every 72 hr, including at the time of plating, with selected combinations of growth factors: (1) 10 ng/ml PDGF AA and bFGF for 3 or 8 d after plating; (2) 10 ng/ml CNTF, 5 μm forskolin, and 15 nm 3,3′,5-Triido-l-thyronine (T3) for 8 d after plating; or (3) 10 ng/ml PDGF AA and bFGF for the first 8 d after plating, followed by an 8 d supplementation with 10 ng/ml CNTF, 5 μm forskolin, and 15 nm T3. PDGF AA, bFGF, CNTF, and NT-3 were from Peprotech (Princeton, NJ).
Immunocytochemical characterization of oligodendroctyes. The mouse monoclonal antibodies A2B5, O4, and O1 (1:50) were visualized in live cultures using fluorescein-conjugated (μ-chain-specific) IgM (Vector Laboratories, Burlingame, CA) as secondary antisera (Bansal et al., 1989). The O4 and O1 antibodies were prepared using hybridoma cells, which were the generous gift of Dr. Stephen Pfeiffer (University of Connecticut Health Center, Farmington, CT). Mouse monoclonal antibodies against MBP (1:100) (Boehringer Mannheim, Indianapolis, IN) and glial fibrillary acidic protein (GFAP; 1:400) (Sigma) were localized using cultures fixed for 10 min at room temperature in 4% formaldehyde in HBSS before immunocytochemistry. Anti-MBP and anti-GFAP antibodies were visualized with fluorescein-conjugated goat anti-mouse IgG (Vector).
Quantitative characterization of the distributions of OL maturational stages generated by particular culture conditions was determined in a minimum of three experiments. At least 10 20× fields (>1000 cells) were counted using a Nikon epifluorescent microscope to quantify the number of cells labeled by each antibody. Coverslips were mounted in Fluoromount-G (Southern Biotechnology, Birmingham, AL) containing 0.5 μg/ml Hoechst 33258 (Sigma) prepared as a 5 mg/ml stock solution in water. Total cell number or nuclear condensation associated with cell death were determined by visualizing nuclei labeled with Hoechst 33258.
Quantification of viable cells. Survival of cells was determined after 24 hr, unless otherwise indicated, by using Alamar blue (AB) (AccuMed International, Westlake, Ohio) as an index of viability (McGahon et al., 1995). The assay solution was prepared by diluting a 100× stock solution of AB into Earle’s balanced salt solution (EBSS) (14015–028; Life Technologies). Aliquots of 300 μl of assay solution were transferred to 24-cell well plates and warmed to 36°C in a humidified CO2 incubator before use. Coverslips were incubated in the assay solution for 2 hr, unless otherwise indicated. The fluorescence of the assay solution (1:50 in EBSS) was measured (excitation at λ = 560 nm; emission at λ = 590 nm) with a Hitachi F-2000 fluorescence spectrophotometer. The incubation time for AB exposure produced a value that was no less than five times greater than background and yielded an increase in fluorescence that was linear over the duration of the assay.
Glutathione measurement. Total glutathione was determined by using a previously described kinetic assay (Tietze, 1969). The medium was aspirated, and the cultured cells were washed twice with HBSS. Perchloric acid (0.3 m, 200 μl) was added to each coverslip and incubated for 15 min on ice with gentle shaking. The perchloric acid solution was transferred to a 1.5 ml microcentrifuge tube and adjusted to pH 7.6 with 3 m potassium bicarbonate (20–25 μl). After a 30 min incubation on ice, the solution was centrifuged at 14,000 rpm for 5 min at 2–4°C. For determination of glutathione content, 50 μl of the supernatant solution was added to a 96-cell well plate containing the following: 50 μl of vehicle solution containing 0.3 m perchloric acid adjusted to pH 7.6 with 3 m potassium bicarbonate, 50 μl of 2.4 mm 5,5′-dithiobis-2-nitrobenzoic acid (D-8130; Sigma), and 50 μl of 40 μg/ml glutathione reductase (Boehringer Mannheim) in 0.1 m sodium phosphate buffer (pH 7.6) with 5 mm EDTA. Immediately after adding 50 μl of 0.8 mm NADPH (N-1630; Sigma), the initial rate of reaction at 25°C was determined from the change of absorbance at 405 nm measured every 15 sec over the first 6 min of the reaction (Thermomax microplate reader; Molecular Devices, Sunnyvale, CA). Total glutathione content (reduced and oxidized) was determined in reference to a standard curve. Protein content was determined by a Micro BSA protein assay kit (Pierce, Rockford, IL).
Glutathione depletion studies. For cystine deprivation studies, dishes containing five coverslip cultures were routinely washed once in 2 ml of cystine-depleted medium immediately before transfer to experimental medium (2 ml) to remove excess cystine derived from the culture medium. Buthionine sulfoximine (BSO) (B2640; Sigma) and diethylmaleate (DEM) (M5887; Sigma) 10 mm stock solutions were freshly prepared in BDM. Cultures were exposed to 2 ml of medium containing BSO or DEM. Glutathione monoethylester (G1404; Sigma) was prepared as a 100 mm stock solution in sterile 50 mm PBS, pH 7.4, which was stored at −80°C until use.
Free radical scavengers. Idebenone (Takeda Chemical Industries, Osaka, Japan) and α-tocopherol were prepared as 1 mm stock solutions in DMSO and stored at −20°C until they were directly added to the experimental medium.
Fluorescence imaging by confocal microscopy.Dihydrorhodamine 123 (D-632; Molecular Probes, Eugene, OR) was prepared as a 10 mm stock solution in DMSO and stored at −20°C. Cells were loaded in medium containing 5 μmdihydrorhodamine 123 at 36°C in a 5% CO2 incubator for 20 min before microscopy. After loading, the cells were briefly washed twice in HBSS and immediately visualized using either a Zeiss Microphot epifluorescent microscope or a laser scanning confocal microscope (Noran Instruments), with an argon-ion laser coupled to an inverted microscope (Nikon Diaphot 200) and equipped with a 40× oil-immersion objective (Nikon Plan Fluor, 1.30 NA). Cells loaded with dihydrorhodamine were visualized by excitation at λ = 490 ± 15 nm light using a rhodamine long-pass filter, and fluorescence emission was detected at λ > 515 nm. The beam was attenuated using a 15 nm dichroic confocal aperture. In all experiments, laser settings, including brightness, contrast, and exposure time (100 nsec), were held constant. Frame-averaged confocal images (32 per image) were digitalized at 512 × 480 pixels using microcomputer-based imaging software (Noran OZ with Intervision). For analysis of cellular fluorescence intensity, regions of interest were selected to include oligodendroglial cytoplasm but to exclude the nucleus. Values reported represent the average of mean pixel intensities determined from comparable numbers of cellular profiles (>50) for all conditions.
Exogenous free radical toxicity studies. Superoxide anion was generated using xanthine (X-0626; Sigma) and xanthine oxidase (X-1857; Sigma). Xanthine was freshly prepared in experimental medium and diluted to a final concentration of 50 μm. Exposure of OL cultures to superoxide anion was initiated by the addition of xanthine oxidase (5 mU/ml) to the xanthine-containing medium.
Ultrastructural characterization of OL tissue cultures. Six coverslip cultures of preOLs exposed for 14.5 hr to cystine-containing or cystine-depleted medium were fixed and processed for electron microscopy using a protocol identical to that described previously (Rosenberg and Harris, 1993). A minimum of 50 separate regions were sampled from two separate coverslips per condition and photographed in a JEOL 1200 EX electron microscope.
Statistical analysis. Unless otherwise noted, all experiments were replicated three times, and all values were derived from measurements done in triplicate. Significance for multiple comparisons was determined by one-way ANOVA with post hoccomparison by Student–Newman–Keuls multiple comparisons test using the Instat 2 computer program (Graph Pad Software, San Diego, CA) or by factorial ANOVA using SAS version 6.12 (SAS Institute, Cary, NC). The Student’s t test was used for comparison of two conditions. In the text, dispersion in single experiments is indicated by the SD and in pooled data by the SEM. Survival data are presented as the percentage of viable cells compared with control cultures.
RESULTS
Production of preOLs and mature OLs in culture
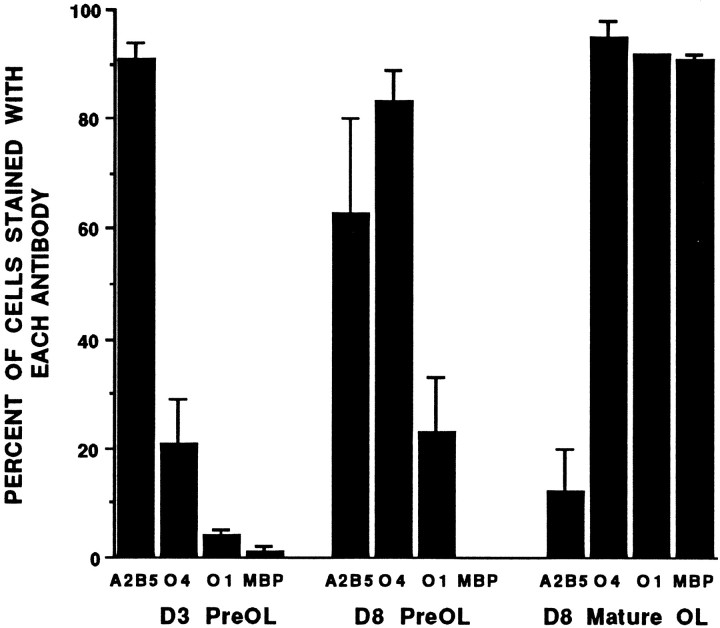
To determine whether OLs display maturation-dependent differences in survival in response to cystine deprivation, we first sought to establish culture conditions to generate highly enriched populations of preOLs or mature OLs. We evaluated the effects of selected combinations of growth factors on O4+O1− preOLs isolated by immunopanning (see Materials and Methods). We first characterized cells grown in the presence of preOL medium that consisted of medium supplemented with 10 ng/ml bFGF and PDGF AA. These growth factors have been shown to promote the preOL phenotype (Bogler et al., 1990; McKinnon et al., 1990; Huber et al., 1994). After 3 d in culture, the majority of cells were apparent OL progenitors that displayed an immature phenotype characterized by cells with a bipolar morphology. Immunocytochemical characterization with monoclonal antibodies directed to OL cell surface epitopes confirmed that most of these cells were OL progenitors but with some preOLs present; 91 ± 3% stained with the A2B5 antibody, and 21 ± 8% stained with the O4 antibody (Fig.1). After 8 d in culture, large numbers of preOLs were generated. Most cells displayed a more mature phenotype characterized by cells with a simple multipolar morphology. The majority (83 ± 6%) stained with O4 antibody. A minority of the cells (23 ± 10%) stained with O1 antibody. Contamination by astrocytes in 8-d-old cultures was 5.6 ± 2.8% (n= 4).
Fig. 1.
Quantitative immunocytochemical characterization of cultures generated when preOLs were maintained for 3 or 8 d in preOL medium or 8 d in mature OL medium. Immunocytochemical characterization of sister coverslips was done using the four monoclonal antibodies indicated. Values represent the mean ± SD from three separate experiments. Ten 20× fields (>1000 cells) were counted on one coverslip per condition in each experiment. Total cell number was determined by counting all cells labeled with Hoechst 33258 (see Materials and Methods).
We tested the response of preOLs to a mature OL medium, which consisted of BDM supplemented with 10 ng/ml CNTF, 15 nmT3, and 5 μm forskolin. After 8 d in culture, a greatly enriched population of mature OLs was generated (Fig. 1). Most cells elaborated extensive sheets of membrane that stained for MBP. Immunocytochemical characterization confirmed that the majority of these cells were mature MBP-positive OLs (91 ± 1%) (Fig. 1).
Maturation-dependent difference in OL dependence on cystine for survival
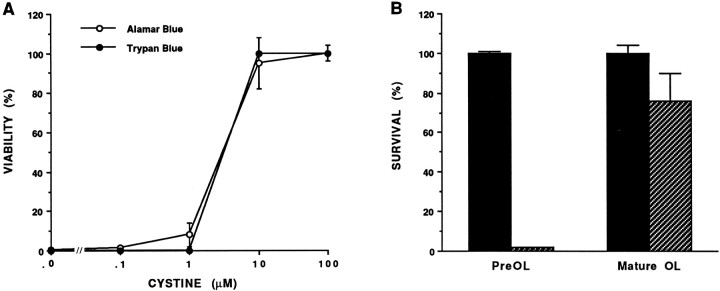
We next asked whether preOLs and mature OLs displayed a difference in their response to oxidative stress induced by cystine deprivation. A clear dependence of preOLs on cystine for survival was shown by a 24 hr exposure to medium containing varying concentrations of cystine (Fig.2A). Loss of cell viability in cystine-depleted medium was quantified by a sensitive fluorescent assay that measured the decrease in metabolism of the proprietary formazan dye AB (see Materials and Methods). Figure2A shows that AB fluorescence was a direct measure of preOL death under conditions of oxidative stress. When cells were exposed to varying concentrations of cystine, there was no significant difference in the EC50 for OL viability, as determined using either AB or trypan blue (TB) (Perry et al., 1997) (Fig.2A) or the MTT assay (Mosmann, 1983) (data not shown). In six experiments, the EC50 for cystine, determined by using AB, ranged from 0.5 to 35 μm, with an EC50 of 2 ± 2 μm for five of these experiments. In three experiments, the EC50 for cystine, determined by using TB, ranged from 0.2 to 6 μm, with an EC50 of 3.1 ± 2.9 μm.
Fig. 2.
A, AB is a direct measure of OL viability. Dose-response curves of preOL survival as a function of the concentration of cystine in the culture medium were compared using AB or cell counts with TB. In this experiment the EC50 for cystine was 3 μm, as determined by AB or TB.B, PreOLs are markedly more vulnerable to cystine deprivation than mature OLs. The survival of preOLs was 2 ± 0.3 versus 76 ± 14% for the mature OLs.
When the 24 hr survival of preOLs and mature OLs in cystine-depleted medium was compared, preOLs were almost completely killed, whereas mature OLs were largely viable. The cystine-deprived preOLs had a survival of 2 ± 0.3% compared with 76 ± 14% for the mature OLs (Fig. 2B). In eight separate experiments, the mean 24 hr survival of preOLs in cystine-depleted medium was 3 ± 1% of control (p < 0.001). In contrast to preOLs, mature OLs in 10 separate experiments showed a much greater viability of 87 ± 3% of control (p < 0.005) when exposed to cystine-depleted medium for 24 hr (Fig. 2B).
Survival of mature OLs is independent of cell density and previous history of growth factor exposure
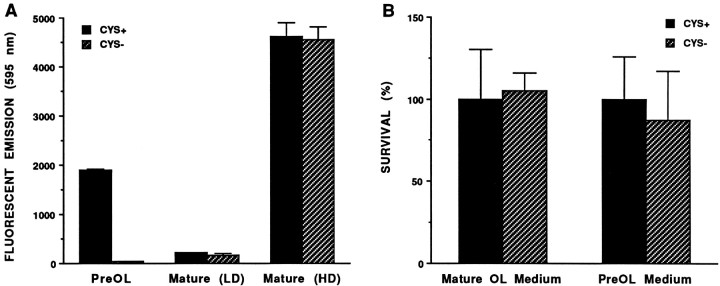
We next considered that the enhanced survival of mature OLs in cystine-depleted medium might be related to the conditions under which the cells were grown. We first investigated the effect of cell density on the survival of mature OLs. PreOLs cultured in the presence of PDGF and bFGF were mitotically active; therefore, cell number continuously increased after plating. However, mature OLs were of much lower density, because they were generated from cultures that expanded more slowly in the mature OL medium. To assess the effect of increased cell density on mature OL survival, we generated mature OLs at a density comparable to or greater than that of preOLs grown for 8 d. This was accomplished by culturing preOLs for 8 d in preOL medium. Thereafter, from day 9–16 in culture, bFGF and PDGF were withdrawn, and the preOLs were supplemented every 72 hr with the mature OL medium. This protocol generated a more dense population of mature OLs that were immunocytochemically similar to the lower density cultures of mature OLs (data not shown). Figure3A shows the results of a representative experiment demonstrating that an increase in cell density did not decrease the survival of mature OLs after a 24 hr exposure to cystine-depleted medium. The average 24 hr survival of the higher density cultures was 95 ± 2% of control (n = 10). Unless otherwise noted, mature OLs generated by this protocol were used in all subsequent experiments.
Fig. 3.
A, Cell density has no effect on the survival of mature OLs in cystine-depleted basal defined medium (CYS-). Survival of preOLs was also determined to confirm the relative toxicity of the cystine-depleted medium to the two OL stages. Mature OLs were generated at low density (LD) or high density (HD), as described in Materials and Methods. Values are expressed as the corrected fluorescent emission at 595 nm of the reaction product generated after a 2 hr incubation in AB. In this experiment, the survival of the preOLs was 2 ± 0.4%. The survival of the mature OLs at low density was 76 ± 14%, and survival was 99 ± 6% for the mature OLs at high density.B, Lack of effect of previous history of growth factor exposure on the survival of low-density mature OLs in cystine-depleted medium (CYS-). The survival of mature OLs generated by continuous exposure of preOLs to mature OL medium for 9 d (Mature OL Medium) did not differ from control. The survival of mature OLs, generated by a 7 d exposure of preOLs to mature OL medium, followed by a 2 d exposure to preOL medium (PreOL Medium), did not differ from control.
Another potential explanation for the difference in viability of preOLs and mature OLs was an effect on viability mediated by one or more of the growth factors to which the cells were exposed during culture. We reasoned that if the enhanced vulnerability of preOLs to cystine deprivation was conferred by the growth factors with which they were generated (i.e., PDGF and bFGF), then exposure to these same growth factors might also decrease the survival of cystine-deprived mature OLs. This was assessed by exposing low-density 7-d-old cultures of mature OLs (i.e., with no previous exposure to bFGF or PDGF) to preOL medium (containing bFGF and PDGF) for 48 hr. The effect of cystine deprivation on the survival of 9-d-old cultures of mature OLs exposed only to the mature OL medium did not differ, however, from the effect on the 9-d-old cultures of mature OLs that had previous exposure to preOL medium (Fig. 3B). A lack of effect of previous exposure to PDGF and bFGF on the survival of mature OLs was further supported by the observation that the higher density cultures of mature OLs remained largely viable in cystine-depleted medium, despite their previous history as preOLs exposed continuously for 8 d to PDGF and bFGF (Fig. 3A). PreOLs were also equally vulnerable to cystine deprivation when tested in the presence or absence of the growth factors that stimulated their proliferation (i.e., PDGF and bFGF) (data not shown). Hence, regardless of the timing of exposure to PDGF and bFGF, mature OLs retained their resistance to the toxicity of cystine deprivation.
Cystine deprivation induces glutathione depletion in preOLs and mature OLs
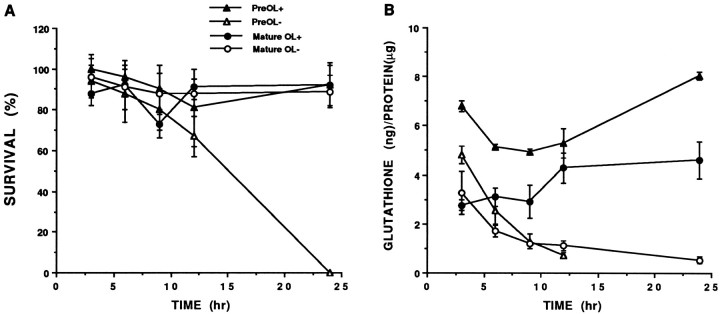
We next asked whether the difference in viability of preOLs and mature OLs might be attributable to a difference in the glutathione depletion resulting from cystine deprivation. In three separate experiments, this was assessed by serial measurements of the viability and total glutathione content of preOLs and mature OLs during a 24 hr exposure to cystine-depleted medium (Fig.4). Figure 4A indicates that preOLs significantly declined in viability within 12 hr and were completely killed within 24 hr, whereas the viability of mature OLs did not differ from control. Figure 4B shows that preOLs and mature OLs had a similar rate of glutathione depletion. In three experiments, the glutathione content of mature OLs at 24 hr (0.5 ± 0.1 ng/μg protein) did not differ significantly from that of preOLs after 12 hr (0.9 ± 0.2 ng/μg protein). In the experiment shown, glutathione in the mature OLs decreased to 11 ± 3% of control at 24 hr compared with a decrease to 14 ± 2% of control in the preOLs at 12 hr. It is noteworthy that although the glutathione level at 12 hr in the preOLs was associated with their eventual death, a similar level in the mature OLs at 24 hr was associated with minimal loss of viability.
Fig. 4.
PreOLs are markedly more vulnerable to cystine deprivation than mature OLs, despite a similar time course for glutathione depletion. The time course of survival of preOLs and mature OLs in cystine-containing or cystine-depleted medium (A) was compared relative to the glutathione content of parallel cultures treated with the same conditions (B). After the indicated exposure times, viability was assayed with AB or glutathione was extracted and assayed.A, PreOLs were completely killed after a 24 hr exposure to cystine-depleted medium. There was no difference in viability at 24 hr for mature OLs in cystine-depleted medium relative to preOLs or mature OLs in cystine-containing medium. B, There was no difference in the decrease in glutathione content of preOLs and mature OLs after a 12 hr exposure to cystine-depleted medium. The glutathione content of the preOLs at 12 hr was 0.7 ± 0.1 ng/μg protein and did not differ significantly from that of mature OLs at 24 hr (0.5 ± 0.1 ng/μg protein). The glutathione content of preOLs at 24 hr is not shown, because it could not be determined due to complete cell death. Statistical comparisons were by factorial ANOVA.
It has been proposed that OLs in vitro may be more vulnerable to death induced by oxidative stress than are astrocytes because of a lower basal glutathione content (Thorburne and Juurlink, 1996). We found, however, that the basal glutathione level of preOLs was significantly higher than that of mature OLs. The basal glutathione level of preOLs was 5.0 ± 0.4 (n = 8) versus 3.2 ± 0.2 ng/μg protein (n = 9) for mature OLs (mean ± SE; p = 0.002). Hence, a higher basal glutathione level did not confer on preOLs greater protection against the toxicity of cystine deprivation.
Effect of glutathione-depleting agents on viability and glutathione levels of mature OLs
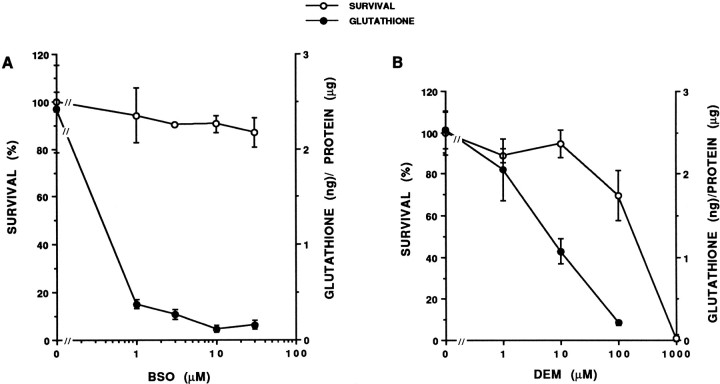
Because mature OLs were more viable than preOLs under conditions of low glutathione (Fig. 4), we next asked whether this resistance to the toxic effects of glutathione depletion might also be seen when mature OLs were treated with agents that pharmacologically depleted intracellular glutathione. We tested BSO, an inhibitor of glutathione synthetase (Griffith, 1982), and DEM, which irreversibly conjugates glutathione and other thiol-containing compounds (Plummer et al., 1981). Figure 5A is representative of the results of two dose-finding experiments that compared the effect of a 24 hr exposure to increasing concentrations of BSO on the viability and glutathione content of mature OLs. At 10 μm, BSO maximally depleted glutathione but had no effect on cell viability. Figure 5B is representative of three dose-finding experiments that compared the effect on the viability and glutathione content of mature OLs of a 24 hr exposure to increasing concentrations of DEM. Progressive decline in the glutathione content of the mature OLs was not associated with significant loss of mature OL viability. At 100 μm DEM, the viability of mature OLs was 70 ± 12% of control (NS), despite depletion of glutathione to 0.2 ± 0.03 ng/μg protein. Significant toxicity was observed at 1 mm DEM.
Fig. 5.
Mature OLs are largely resistant to the toxicity of the glutathione-depleting agents BSO (A) or DEM (B). Dose-response curves compare the survival and glutathione content of mature OLs as a function of the concentration of BSO or DEM. Parallel cultures were exposed for 24 hr to BSO or DEM, after which they were assayed for viability with AB, or glutathione was extracted and assayed. A, There was no significant loss of viability at any concentration of BSO tested relative to control. The EC50 for the effect of BSO on the glutathione content of the mature OLs was 0.25 μm.B, The viability at 100 μm DEM was 70 ± 12% of control (NS), and the glutathione content was 0.2 ± 0.03 ng/μg protein. The glutathione content of the cells at 1 mm DEM could not be determined because of complete cell death. Statistical comparisons were by factorial ANOVA.
Relative effect of glutathione-depleting agents on the viability of preOLs versus mature OLs
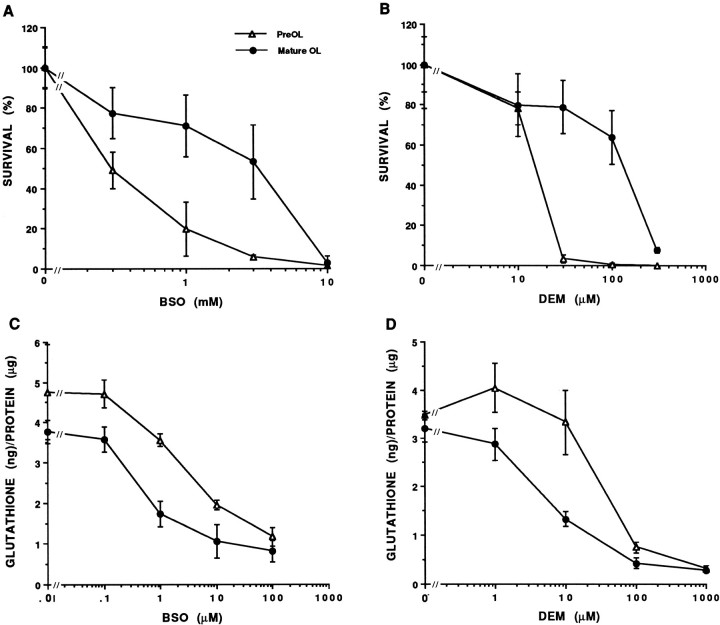
Because cystine deprivation was primarily toxic to preOLs, we next determined whether BSO and DEM might also be more toxic to preOLs than to mature OLs. BSO was significantly more toxic to preOLs (Fig.6A), and in this experiment, the EC50 for the toxicity of BSO to preOLs was 290 μm. The EC50 for the toxicity of BSO to preOLs was 275 ± 20 μm in two separate experiments. By contrast, in this and five additional experiments, we found that BSO had no significant effect on the viability of mature OLs at concentrations <3 mm. At 10 mm BSO, complete loss of viability was observed in only four of eight experiments (Fig.6A).
Fig. 6.
PreOLs are more vulnerable to the toxicity of BSO (A) or DEM (B), despite the fact that these agents more potently deplete glutathione in mature OLs (C, D). A, The EC50 for the toxicity of BSO to preOLs was 290 μm and to mature OLs was 3.3 mm.B, The EC50 for the toxicity of DEM to preOLs was 17 μm and to mature OLs was 103 μm. For the glutathione measurements, glutathione was extracted after an 8 hr exposure to BSO (C) or a 4 hr exposure to DEM (D), at which times there was no loss of cell viability, as described in Results. In this experiment, the EC50 for the effect of BSO on the glutathione content of the preOLs was 2.1 μm and on the mature OLs was 0.5 μm. The EC50 for the effect of DEM on the glutathione content of the preOLs was 33 μm and on the mature OLs was 5.2 μm. Similar results were obtained in one additional experiment.
Figure 6B shows a representative experiment in which DEM was also found to be markedly more toxic to preOLs than to mature OLs. The EC50 for the toxicity of DEM to the preOLs was 17 μm versus an EC50 of 103 μm for the mature OLs. The EC50 for the toxicity of DEM to preOLs ranged from 14 to 80 μm and was 17 ± 3 μm for three of four experiments. The EC50for the toxicity of DEM to mature OLs ranged from 103 to 333 μm and was 148 ± 43 μm for five of six experiments.
Relative effect of glutathione-depleting agents on glutathione levels in preOLs and mature OLs
We next asked whether the enhanced toxicity of BSO and DEM to preOLs might be attributable to a difference in the efficacy of the effect of these agents on glutathione depletion in preOLs. To accurately measure glutathione depletion within preOLs, it was first necessary to determine whether a period of exposure to BSO or DEM could be identified when the total glutathione content was maximally depleted but when no significant loss of cell viability occurred. We found that these conditions were met by an 8 hr exposure to 200 μmBSO or a 4 hr exposure to 100 μm DEM (data not shown). Figure 6C,D is representative of two experiments that compared the effect of an 8 hr exposure to BSO or a 4 hr exposure to DEM on the glutathione level of preOLs and mature OLs. Both BSO and DEM were actually found to deplete glutathione more potently in mature OLs. The EC50 value for glutathione depletion by BSO was 2.1 μm for the preOLs compared with 0.5 μmfor the mature OLs. The EC50 value for glutathione depletion by DEM was 33 μm for the preOLs compared with 5.2 μm for the mature OLs. In the two separate experiments, the mean EC50 value for glutathione depletion by BSO was 6.1 ± 5.6 μm for the preOLs versus 0.7 ± 0.3 μm for the mature OLs. The EC50 for glutathione depletion by DEM was 30 ± 4 μm for the preOLs versus 5.0 ± 0.3 μmfor the mature OLs (p < 0.05). In three additional experiments, a 24 hr exposure to BSO was also more potent in depleting glutathione in mature OLs. The mean EC50 value for glutathione depletion by BSO was 2.2 ± 0.1 μmfor the preOLs compared with 0.2 ± 0.03 μm for the mature OLs (p < 0.001). Glutathione depletion in the preOLs and mature OLs could not be reliably determined after a 24 hr exposure to DEM because of high dose toxicity and resulting cell loss. In summary, despite the fact that preOLs were more vulnerable to the toxicity of glutathione depletion, BSO and DEM were more potent in depleting glutathione in mature OLs than in preOLs.
Effect of glutathione depletion on free radical generation in preOLs versus mature OLs
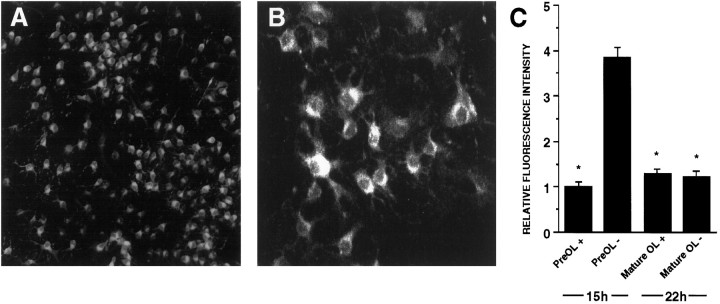
We next asked whether the decreased viability of preOLs in response to glutathione depletion might be related to increased free radical generation, as assessed by oxidation of dihydrorhodamine 123 to the cationic fluorescent probe rhodamine 123 (Rh 123). When we compared the oxidation of dihydrorhodamine 123 by preOLs and mature OLs exposed to cystine-depleted medium, there was a marked increase in Rh 123 fluorescence in preOLs that was observed throughout the cultures after more than a 12 hr exposure (Fig.7A). Visualization of Rh 123 fluorescence by confocal laser microscopy revealed that the probe was heavily concentrated within the cytoplasm (Fig. 7B). Figure7C shows a representative experiment in which the magnitude of the increase in Rh 123 fluorescence in preOLs and mature OLs exposed to cystine deprivation was quantitated by confocal laser microscopy (see Materials and Methods). After a 15 hr exposure to cystine-depleted medium, preOLs had a 3.9-fold increase in Rh 123 compared with control. In seven separate experiments, preOLs displayed a 4.6 ± 0.8-fold increase in Rh 123 relative to control (p < 0.001). In contrast, in three separate experiments mature OLs, after periods of cystine deprivation up to 22 hr, showed no significant increase in fluorescence relative to control preOLs or control mature OLs. We also detected no significant Rh 123 fluorescence in either untreated preOLs or mature OLs cultured in cystine-containing medium (data not shown), suggesting that there was no apparent difference in the basal levels of intracellular reactive oxygen species (ROS) in OLs at either stage.
Fig. 7.
Free radical generation, assessed by Rh 123 fluorescence, is greatly increased in cystine-deprived preOLs but not in mature OLs. A, Low-power fluorescent photomicrograph showing numerous Rh 123 fluorescent preOLs after a 15 hr exposure to cystine-depleted medium. B, Laser confocal digitalized image showing the cytoplasmic distribution of Rh 123 fluorescence in preOLs after a 15 hr exposure to cystine-depleted medium.C, Quantitation of the relative intensity of Rh 123 fluorescence (see Materials and Methods) in preOLs and mature OLs. There was a 3.9-fold increase in Rh 123 fluorescence in preOLs after 15 hr of cystine deprivation (PreOL-) compared with control (PreOL+). Statistical comparisons were among relative fluorescence intensity in control preOLs, control mature OLs, or treated mature OLs relative to treated preOLs. There was no significant increase in Rh 123 fluorescence in control versus treated mature OLs. *p < 0.001.
Free radical scavengers protect preOLs from the toxicity of cystine deprivation
We next tested the hypothesis that if the toxicity of glutathione depletion was mediated by the deleterious effects of intracellular free radicals, free radical scavengers should prevent the death of preOLs caused by exposure to cystine-depleted medium. Figure8A is representative of three separate experiments in which both α-tocopherol (30 μm) and idebenone (1 μm) completely prevented the death of preOLs induced by cystine deprivation. Ascorbate (100 μm) failed to protect preOLs (n = 3), and superoxide dismutase and catalase (10 U/ml) also had no protective effect (n = 3) (data not shown).
Fig. 8.
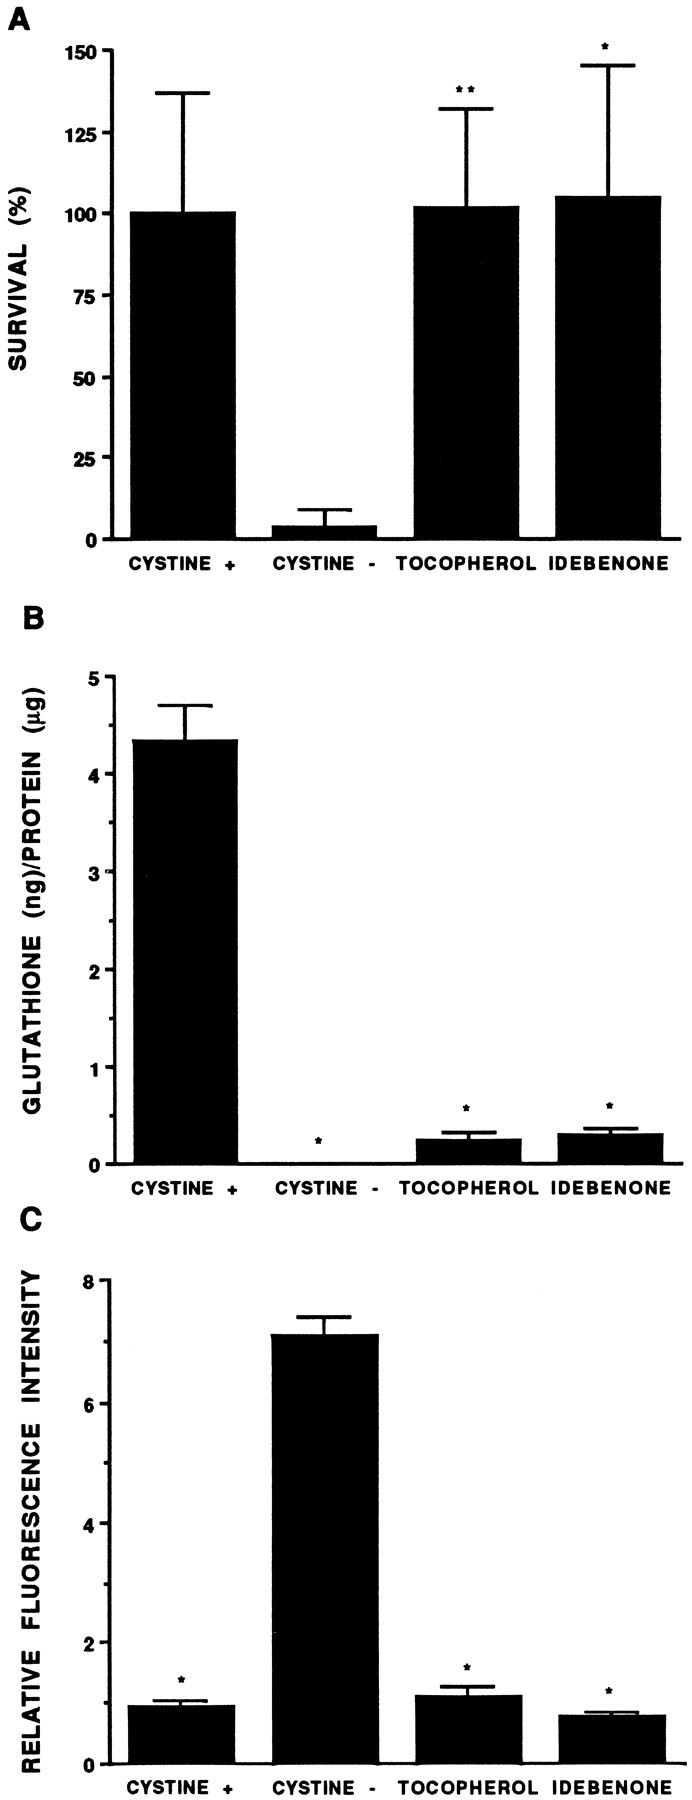
The free radical scavengers α-tocopherol and idebenone protect preOLs against cystine-deprivation (A) via a mechanism downstream of glutathione depletion (B) that suppresses free radical production (C). The relative effect of these free radical scavengers on the viability (A), intracellular glutathione content (B), and relative intensity of Rh 123 fluorescence (C) of preOLs in cystine-depleted medium is shown. Free radical scavengers were added to cystine-depleted medium, and after a 24 hr exposure, parallel cultures were either assayed for viability with AB (A) or glutathione was extracted and assayed (B). Rh 123 fluorescence was quantified after a 15 hr exposure to cystine-depleted medium (C) when preOLs in cystine-depleted medium remained viable. The α-tocopherol and idebenone were dissolved in DMSO, and an equivalent amount of DMSO (0.1% of final medium) was added to control cultures. A, The viability of the free radical scavenger-treated cultures differed significantly from cultures in cystine-depleted medium but did not differ significantly from control. *p < 0.05; **p < 0.05. B, Glutathione content was significantly decreased in cultures in cystine-depleted medium, with or without added free-radical scavengers, compared with control. *p< 0.001. C, The relative intensity of Rh 123 fluorescence of preOLs in cystine-depleted medium was increased significantly relative to control cultures or to those treated with either free radical scavenger. *p < 0.001. Statistical comparisons in A–C were by one-way ANOVA.
To determine whether the protective effect of α-tocopherol and idebenone was mediated by preventing a decline in intracellular glutathione or by conferring protection distal to the actions of glutathione, we measured glutathione levels in cultures of pre-OLs exposed to cystine-depleted medium in the presence of either free radical scavenger (Fig. 8B). We found that although α-tocopherol and idebenone markedly protected against cell death in cystine-depleted medium (Fig. 8A), these compounds did not block the depletion of intracellular glutathione. We next determined whether the protective effects of α-tocopherol and idebenone were mediated by preventing an increase in free radical generation, as assessed by measuring Rh 123 in preOLs subjected to cystine deprivation in the presence of either antioxidant. In two separate experiments, both α-tocopherol (30 μm) and idebenone (1 μm) completely prevented the increase in Rh 123 that was observed in untreated preOLs (Fig. 8C).
Glutathione monoethylester rescues preOLs from the toxicity of cystine deprivation or BSO exposure
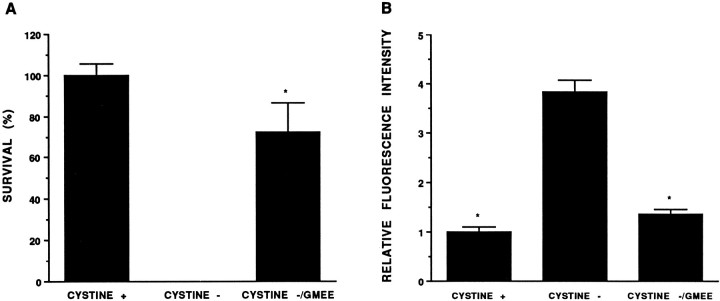
If the toxicity of cystine deprivation to preOLs was mediated principally by causing a decline in intracellular glutathione, then the toxicity might be prevented by delivery of reduced glutathione into the cells. Although reduced glutathione is poorly transported into cells, esterified forms of glutathione are effectively taken up (Anderson et al., 1994). We evaluated the ability of glutathione monoethylester (GMEE) to protect preOLs against the toxicity of cystine deprivation. Figure 9A is representative of three experiments in which 1 mm GMEE markedly protected preOLs against the toxicity of a 24 hr exposure to cystine-depleted medium, with a survival of 72 ± 14%. The mean survival from these three experiments was 78 ± 17%. There was no significant toxicity of 1 mm GMEE (data not shown). To determine whether the protective effect of GMEE was mediated by preventing an increase in free radical generation, Rh 123 was quantitated in preOLs subjected to cystine deprivation (Fig. 9B). In two separate experiments, 1 mm GMEE completely prevented the increase in Rh 123 fluorescence that was observed in cystine-deprived preOLs.
Fig. 9.
GMEE enhances the survival (A) of preOLs exposed to cystine-depleted medium (CYSTINE-) and suppresses free radical production (B) as measured by the relative intensity of Rh 123 fluorescence. Cells were exposed to 1 mm GMEE from the onset of the experiment. A, Survival in the presence of GMEE was 72 ± 14% relative to cultures in cystine-depleted medium. *p < 0.001. B, Treatment with GMEE suppressed Rh 123 fluorescence relative to preOLs exposed to cystine-depleted medium for 15 hr. Statistical comparisons were among relative fluorescence intensity in cystine-depleted medium versus cystine-containing medium (CYSTINE+) or cystine-depleted medium with GMEE. *p < 0.001. There was no significant difference between the GMEE-treated cultures and control (CYSTINE+). Statistical comparisons in Aand B were by one-way ANOVA.
The finding that the potency of BSO to deplete glutathione in preOLs was greater than its toxicity (i.e., the EC50 for the toxicity of BSO was 275 ± 20 μm, whereas the EC50 for glutathione depletion by BSO was 6.1 ± 5.6 μm) raised the question of whether the toxicity of BSO might be mediated through multiple mechanisms. However, if the toxicity of BSO to preOLs were principally mediated via a decline in intracellular glutathione, GMEE might prevent the toxicity. In three experiments, 1 mm GMEE markedly protected preOLs against exposure to 10 mm BSO, with a mean survival of 87 ± 14% (p < 0.001 relative to control or 10 mm BSO).
Maturation-dependent difference in OL vulnerability to xanthine–xanthine oxidase
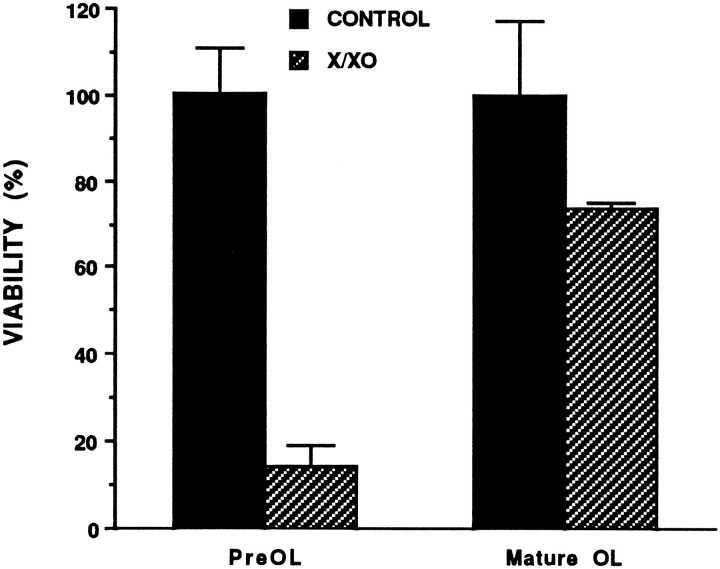
Having shown a difference in OL vulnerability to glutathione depletion, we next sought to determine whether preOLs were also more vulnerable than mature OLs to oxidative stress when glutathione levels were not manipulated. To test this hypothesis, we examined the toxicity of oxygen radicals generated exogenously by xanthine–xanthine oxidase. The superoxide anion generated by this system is converted into several oxygen radicals, including hydrogen peroxide and hydroxyl radical (Kuppusamy and Zweier, 1989; Aizenman, 1995). Dose-finding experiments indicated that maximal toxicity to preOLs was achieved with a concentration of xanthine as low as 50 μm and 5 mU/ml xanthine oxidase (data not shown). Under these conditions, the toxicity of xanthine oxidase was significantly greater to preOLs than mature OLs. As shown in Figure 10, the viability of preOLs was 14 ± 5%, whereas mature OLs had a significantly greater viability of 73 ± 1% (p < 0.001). In four experiments, the mean preOL survival was 19 ± 5 versus 68 ± 2% for mature OLs.
Fig. 10.
PreOLs are more vulnerable than mature OLs to oxygen radicals generated by xanthine oxidase. OL viability was assessed 16 hr after exposure to xanthine (50 μm) and xanthine oxidase (5mU/ml), as described in Materials and Methods. The viability of preOLs was 14 ± 5%, whereas mature OLs had a significantly greater viability of 73 ± 1% (p < 0.001). There was no significant difference between mature OLs in the control or treated groups. The survival of the treated preOLs differed significantly from the control preOLs (p < 0.001). Statistical comparisons were by factorial ANOVA.
Ultrastructural features of free radical-mediated toxicity to preOLs
We reported previously that glutathione-depleted immature OLs grown under serum-rich conditions displayed a number of features consistent with death via apoptosis (Back et al., 1995). To further characterize the mechanism of free-radical mediated toxicity to preOLs, we undertook an ultrastructural analysis of preOLs subjected to cystine-deprivation. After 14.5 hr of exposure to cystine-depleted medium, cellular profiles of preOLs were captured at progressive stages of degeneration (Fig. 11). In contrast to control cells (Fig. 11A), an early feature of dying cells was margination of the chromatin (Fig.11B). At later stages, chromatin became progressively more condensed (Fig. 11C) until the nucleus was reduced in size and uniformly filled with chromatin (Fig. 11D). At all stages of degeneration, the integrity of the plasma and nuclear membranes was retained, but a loss of mitochondrial integrity was observed (Fig. 11B,C). In contrast to control preOLs, mitochondria were uniformly spherical in shape in the cystine-deprived cells, and the cristae were not visualized. Mitochondria were markedly swollen in the end-stage cells (Fig.11D).
Fig. 11.
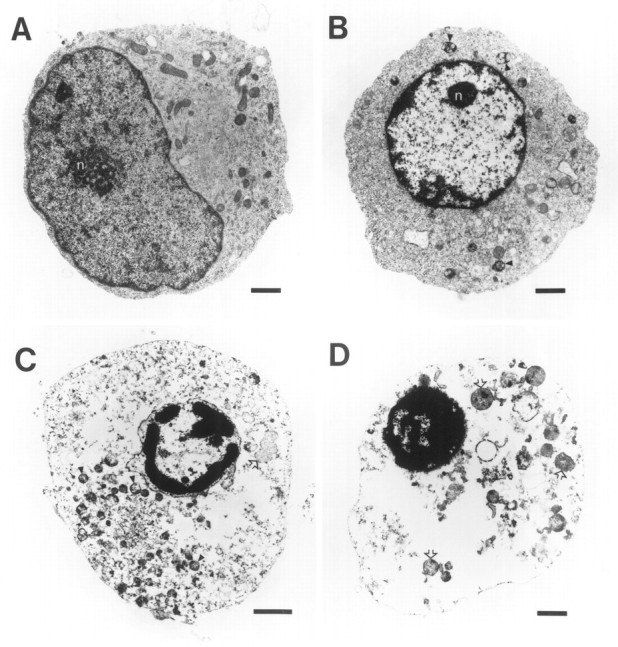
Ultrastructural analysis of the morphological changes observed in glutathione-depleted preOLs captured at various stages of degeneration (B–D) after a 14.5 hr exposure to cystine deprivation. A, Control preOL showing the eccentrically situated nucleus with a uniform distribution of chromatin adjacent to the nuclear membrane. The nucleolus (n) is localized at the center of the nucleus. Mitochondria are uniformly distributed and heterogeneous in shape, and the cristae are readily visualized. B, Note the margination and clumping of chromatin and the condensation of the nucleus and nucleolus (n). Mitochondria are uniformly spherical in shape, and the cristae are no longer visualized (arrowheads). C, In this very degenerated cell, the markedly electron-dense chromatin is condensed and marginated along the intact nuclear membrane, and several droplets of condensed chromatin are present within the nucleus. Most of the degenerated mitochondria (arrowheads) are localized to theleft of the nucleus, several swollen mitochondria are visible (open arrows), and the plasma membrane is intact. D, In this end-stage cell, the chromatin is extremely condensed within the markedly shrunken nucleus. Several extremely swollen mitochondria are visible (arrowheads). The plasma membrane is intact. Scale bars: A,B, D, 1 μm; C, 2 μm. .
DISCUSSION
We developed a novel tissue culture model system to examine the hypothesis that PVL arises because of a maturation-dependent vulnerability of OL precursors to death induced by oxidative stress (Back and Volpe, 1997). We demonstrated that preOLs, in contrast to mature OLs, displayed increased susceptibility to death associated with free radical-mediated injury induced by glutathione depletion or exogenous ROS. These maturation-dependent differences in vulnerability to oxidative stress may be significant for the pathogenesis of PVL, insofar as PVL has its peak incidence in the premature infant (Volpe, 1995, 1997) at a time when OL precursors appear to predominate in the cerebral white matter (Back et al., 1996).
The maturation of OLs correlated with increased resistance to oxidative stress, as supported by the following data: (1) mature OLs were significantly less vulnerable to glutathione depletion caused by cystine deprivation, BSO, or DEM (Figs. 3-6); (2) despite a greater potency to deplete glutathione in mature OLs, BSO and DEM were less toxic to them (Fig. 6); (3) exposure to ROS generated by a xanthine–xanthine oxidase system caused significantly less toxicity to mature OLs than preOLs (Fig. 10); and (4) mature OLs failed to generate intracellular ROS under conditions of glutathione depletion that triggered a marked increase in preOLs (Figs. 7). Moreover, the increased resistance of mature OLs to oxidative stress was observed, despite a lower basal glutathione level in mature OLs than in preOLs and no apparent difference in basal free radical generation. The basis for the increased resistance of mature OLs to oxidative stress is unclear but could involve glutathione-dependent mechanisms, because differences in the rate of total glutathione turnover or the depletion of different subcellular glutathione pools might underlie the increased resistance to oxidative injury. The fact that cystine deprivation similarly reduced the glutathione content in both OL stages (Fig. 4) supports the persistence of cystine transport mechanisms in mature OLs that regulate cystine uptake for glutathione synthesis.
The increased vulnerability of the preOL to oxidative stress correlated with a greater dependence on intracellular glutathione for survival. We found the following: (1) preOLs were more vulnerable than mature OLs to the same degree of glutathione depletion, whether it was caused by cystine deprivation, BSO, or DEM; (2) glutathione depletion caused a marked rise in ROS (Fig. 7), whose toxicity could be prevented by the antioxidants α-tocopherol and idebenone (Fig. 8); and (3) the toxicity of glutathione depletion was prevented by glutathione replacement with glutathione monoethylester (Fig. 9). These data point to a critical role for glutathione in preventing ROS-mediated injury in preOLs. Because glutathione can prevent ROS generation through multiple mechanisms, delayed maturation of one or more of these may underlie the increased vulnerability of preOLs to glutathione depletion. Glutathione scavenges ROS through glutathione peroxidase, a key antioxidant enzyme (Meister, 1989; Vina, 1990), conjugates 4-hydroxynonenal, a lipid peroxidation product that mediates neuronal apoptosis caused by oxidative stress (Kruman et al., 1997), and suppresses the activity of 12-lipoxygenase, which has been linked to apoptosis of immature cortical neurons through a pathway involving a downstream rise in ROS generation and calcium influx (Li et al., 1997). Maturational differences in expression of enzymes that regulate glutathione levels could also underlie the increased vulnerability of preOLs to glutathione depletion (Vina, 1990).
It remains unclear whether glutathione depletion alone is sufficient to trigger the death of preOLs. That glutathione depletion is necessary for preOL death is supported by the protection rendered by GMEE to cystine-deprived preOLs (Fig. 10). Despite the fact that the potency of BSO and DEM to deplete glutathione was greater than their potency to produce toxicity, BSO toxicity also appeared to be mediated through glutathione depletion, because GMEE rescued preOLs from BSO-induced death. One explanation for the disparity between the potency of BSO and DEM to deplete glutathione and their toxicity may be that these agents less effectively deplete mitochondrial glutathione (Meredith and Reed, 1982; Griffith and Meister, 1985). Because mitochondrial glutathione derives from the cytosolic pool (Griffith and Meister, 1985) and has a much longer half-life than cytosolic glutathione (Meredith and Reed, 1982), BSO and DEM may not be toxic to preOLs except at higher concentrations that effectively deplete the mitochondrial pool.
Although the susceptibility of preOLs to glutathione depletion appears related to intracellular ROS generation, the mechanism by which glutathione depletion triggers a rise in ROS is presently unclear. The source of the ROS detected by Rh 123 could not be determined. Although Rh 123 selectively accumulates in mitochondria, there are multiple potential sites of production of this probe (Royall and Ischoropoulos, 1993; Dugan et al., 1995). Our data suggest that ROS generation is a late event that follows a fall in glutathione, because we were unable to detect a rise in Rh 123 fluorescence until at least 12 hr of cystine deprivation (data not shown), at which time glutathione was approaching its nadir (Fig. 4). Primary embryonic cortical neurons also showed an apparent late rise in ROS when depleted of glutathione (Li et al., 1997). Notably, when thymocytes were triggered to undergo apoptosis by several different means, ROS production and cytosolic calcium influx also ensued as late events that followed glutathione depletion and loss of the mitochondrial membrane potential (Macho et al., 1997). Hence, one mechanism by which glutathione depletion may trigger ROS production in preOLs may be through an alteration in mitochondrial function. A role for glutathione in mitochondrial function is supported by the following: (1) activation of the mitochondrial permeability transition appeared to correlate with the level of endogenous oxidized glutathione (Chernyak and Bernardi, 1996); (2) glutathione depletion reduced the activity of the mitochondrial respiratory enzyme complexes I, II–III, and IV (Bolanos et al., 1996); (3) the mitochondrial protein Bcl-2 decreased ROS generation in glutathione-depleted neural cells (Kane et al., 1993); and (4) overexpression of Bcl-2 resulted in a higher basal glutathione level and a failure to deplete glutathione in response to an apoptotic signal, whereas baxoverexpression correlated with a reduction in basal glutathione level (Ellerby et al., 1996; Bojes et al., 1997).
The ultrastructural studies presented here (Fig. 11) begin to address the mechanism of preOL death caused by glutathione depletion. The margination and condensation of chromatin, decrease in nuclear size, vacuolation of the cytoplasm, and preservation of the plasma membrane observed in glutathione-depleted preOLs are general features of apoptosis (Arends et al., 1990) reported to occur in oligodendrocytesin vitro (Cassaccia-Bonnefil et al., 1996) and in vivo (Li et al., 1996). These features differ from those seen in OLs undergoing necrosis in vitro (Mitrovic et al., 1995). That a mitochondrial lesion may be related to preOL death is suggested by the marked swelling of mitochondria in end-stage preOLs (Fig.11D). Interestingly, mitochondrial swelling was an early event in thymocytes undergoing glucorticoid-induced apoptosis and occurred in association with a drop in mitochondrial membrane potential (Petit et al., 1995). Triggering of the permeability transition also caused matrix swelling that resulted in release of multiple proteins from the mitochondrial intermembrane space, including cytochrome C (Scarlett and Murphy, 1997). A decline in mitochondrial membrane potential (Zamzami et al., 1996) associated with permeability transitions (Kristal and Dubinsky, 1997) and the release of cytochrome C (Rosse et al., 1998; Zhovotovsky et al., 1998) precede the downstream activation of caspases in apoptosis.
Our findings of maturation-dependent differences in OL viability in response to glutathione depletion are consistent with the response of OLs to other sources of oxidative stress. C2-ceramide was more toxic to O2A progenitors or CG-4 cells than to mature O1-positive OLs (Cassaccia-Bonnefil et al., 1996; Brogi et al., 1997), and the mechanism of ceramide-induced apoptosis appears to involve an early rise in mitochondrial ROS generation (Quillet-Mary et al., 1997). OL precursors also generated higher levels of ROS than astrocytes when made hypoxic or exposed to blue light, but mature OLs were not examined (Husain and Juurlink, 1995; Thorburne and Juurlink, 1996). Not all sources of oxidative stress to OLs induced apoptosis, however. Although nitric oxide was toxic to OLs, the mechanism of death was necrotic (Mitrovic et al., 1995). Moreover, in immortalized OLs, nitric oxide had minimal toxicity to the least and most mature cell lines (Mackenzie-Graham et al., 1994).
One basis for the increased susceptibility of preOLs to oxidative stress may be a delayed maturational expression of genes that suppress apoptosis, such as bcl-2 (Hockenbery et al., 1993; Rabizadeh et al., 1993) or p35 (Rabizadeh et al., 1993). Alternatively, the death of preOLs may be regulated by a specific pathway triggered by oxidative stress that is downregulated in mature OLs. Recently, diminished expression of one member of the cysteine aspartase family of proteases, Nedd2, was shown to protect against trophic factor withdrawal, whereas an interleukin-1β-converting enzyme-like protease was activated when superoxide dismutase was downregulated (Troy et al., 1997). Thus, ourin vitro system offers a well defined model to address the developmental regulation of genes that may influence the maturational susceptibility of OLs to oxidative stress in the setting of perinatal white matter ischemia.
Footnotes
This research was supported by National Institutes of Health Grants NS01855 (S.A.B.) and P20NS32570 (P.A.R. and J.J.V.), National Institute of Child Health and Human Development Grant P30HD18655 (J.J.V.), a Grass Foundation Morison Fellowship (S.A.B.), a Reynolds Rich Smith Fellowship (S.A.B.), Charles A. Janeway Child Health Research Center Award Fellowship HD27805 (S.A.B.), and a Hearst Foundation Award (S.A.B.). We thank Dr. David Zurakowski for advice on the statistical analysis and Marcia Lind for excellent technical assistance.
Correspondence should be addressed to Dr. Paul A. Rosenberg, Department of Neurology, Enders 3, Children’s Hospital, 300 Longwood Avenue, Boston, MA 02115.
REFERENCES
- 1.Aizenman E. Modulation of N-methyl-d-aspartate receptors by hydroxyl radicals in rat cortical neurons in vitro. Neurosci Lett. 1995;189:57–59. doi: 10.1016/0304-3940(95)11442-y. [DOI] [PubMed] [Google Scholar]
- 2.Anderson ME, Levy EJ, Meister A. Preparation and use of glutathione monoesters. In: Packer L, editor. Oxygen radicals in biological systems, Vol 234, Part D. Academic; San Diego: 1994. pp. 492–499. [DOI] [PubMed] [Google Scholar]
- 3.Arends M, Morris R, Wyllie A. Apoptosis: the role of the endonuclease. Am J Pathol. 1990;136:593–608. [PMC free article] [PubMed] [Google Scholar]
- 4.Back SA, Volpe JJ. Cellular and molecular pathogenesis of periventricular white matter injury. MRDD Research Reviews. 1997;3:96–107. [Google Scholar]
- 5.Back SA, Yonezawa M, Gan X, Rosenberg PA, Volpe JJ. Oligodendrocyte death induced by cystine deprivation occurs by apoptosis. Soc Neurosci Abstr. 1995;21:41. [Google Scholar]
- 6.Back SA, Volpe JJ, Kinney HH. Immunocytochemical characterization of oligodendrocyte development in human cerebral white matter. Soc Neurosci Abstr. 1996;20:1722. [Google Scholar]
- 7.Bansal R, Warrington A, Gard A, Ranscht B, Pfeiffer S. Multiple and novel specificities of monoclonal antibodies O1, O4, and R-mAb used in the analysis of oligodendrocyte development. J Neurosci Res. 1989;24:548–557. doi: 10.1002/jnr.490240413. [DOI] [PubMed] [Google Scholar]
- 8.Barres BA, Raff MC. Control of oligodendrocyte number in the developing rat optic nerve. Neuron. 1994;12:935–942. doi: 10.1016/0896-6273(94)90305-0. [DOI] [PubMed] [Google Scholar]
- 9.Bogler O, Wren D, Barnett SC, Land H, Noble M. Cooperation between two growth factors promotes extended self-renewal and inhibits differentiation of oligodendrocyte-type-2 astrocyte (O-2A) progenitor cells. Proc Natl Acad Sci USA. 1990;87:6368–6372. doi: 10.1073/pnas.87.16.6368. [DOI] [PMC free article] [PubMed] [Google Scholar]
- 10.Bojes H, Datta K, Xu J, Chin A, Simonian P, Nunez G, Kehrer J. Bcl-xL overexpression attenuates glutathione depletion in FL5.12 cells following interleukin-3 withdrawal. Biochem J. 1997;325:315–319. doi: 10.1042/bj3250315. [DOI] [PMC free article] [PubMed] [Google Scholar]
- 11.Bolanos J, Heales S, Peuchen S, Barker J, Land J, Clark J. Nitric oxide-mediated mitochondrial damage: a potential neuroprotective role for glutathione. Free Radic Biol Med. 1996;21:995–1001. doi: 10.1016/s0891-5849(96)00240-7. [DOI] [PubMed] [Google Scholar]
- 12.Brogi A, Strazza M, Melli M, Costantino-Ceccarini E. Induction of intracellular ceramide by interleukin-1β in oligodendrocytes. J Cell Biochem. 1997;66:532–541. doi: 10.1002/(sici)1097-4644(19970915)66:4<532::aid-jcb12>3.0.co;2-d. [DOI] [PubMed] [Google Scholar]
- 13.Cassaccia-Bonnefil P, Aibel L, Chao M. Central glial and neuronal populations display differential sensitivity to ceramide-dependent cell death. J Neurosci Res. 1996;43:382–389. doi: 10.1002/(SICI)1097-4547(19960201)43:3<382::AID-JNR13>3.0.CO;2-7. [DOI] [PubMed] [Google Scholar]
- 14.Chernyak B, Bernardi P. The mitochondrial permeability transition pore is modulated by oxidative agents through both pyridine nucleotides and glutathione at two separate sites. Eur J Biochem. 1996;238:623–630. doi: 10.1111/j.1432-1033.1996.0623w.x. [DOI] [PubMed] [Google Scholar]
- 15.Dugan L, Sensi S, Canzoniero L, Handran S, Rothman S, Lin T-S, Goldberg M, Choi D. Mitochondrial production of reactive oxygen species in cortical neurons following exposure to N-methyl-d-aspartate. J Neurosci. 1995;15:6377–6388. doi: 10.1523/JNEUROSCI.15-10-06377.1995. [DOI] [PMC free article] [PubMed] [Google Scholar]
- 16.Ellerby L, Ellerby H, Park S, Holleran A, Murphy A, Fiskum G, Kane D, Testa M, Kayalar C, Bresden D. Shift of the cellular oxidation-reduction potential in neural cells expressing Bcl-2. J Neurochem. 1996;67:1259–1267. doi: 10.1046/j.1471-4159.1996.67031259.x. [DOI] [PubMed] [Google Scholar]
- 17.Flodmark O, Lupton B, Li D. MR imaging of periventricular leukomalacia in childhood. AJNR. 1989;10:111–118. doi: 10.2214/ajr.152.3.583. [DOI] [PubMed] [Google Scholar]
- 18.Gard AL, Pfeiffer SE, Williams WC., III Immunopanning and developmental stage-specific primary culture of oligodendrocyte progenitors (O4+GalC-) directly from postnatal rodent cerebrum. Neuroprotocols. 1993;2:209–218. [Google Scholar]
- 19.Griffith OW. Mechanisms of action, metabolism and toxicity of buthionine sulfoximine and its higher homologs, potent inhibitors of glutathione synthesis. J Biol Chem. 1982;257:13704–13712. [PubMed] [Google Scholar]
- 20.Griffith OW, Meister A. Origin and turnover of mitochondrial glutathione. Proc Natl Acad Sci USA. 1985;82:4668–4672. doi: 10.1073/pnas.82.14.4668. [DOI] [PMC free article] [PubMed] [Google Scholar]
- 21.Hill A. Current concepts of hypoxic–ischemic–cerebral injury in the term newborn. Pediatr Neurol. 1991;7:317–325. doi: 10.1016/0887-8994(91)90060-x. [DOI] [PubMed] [Google Scholar]
- 22.Hockenbery DM, Oltvai ZN, Yin X-M, Milliman CL, Korsmeyer SJ. Bcl-2 functions in an antioxidant pathway to prevent apoptosis. Cell. 1993;75:241–251. doi: 10.1016/0092-8674(93)80066-n. [DOI] [PubMed] [Google Scholar]
- 23.Huber LA, Madison DL, Simons K, Pfeiffer SE. Myelin membrane biogenesis by oligodendrocytes: developmental regulation of low molecular weight GTP-binding proteins. FEBS Lett. 1994;347:273–278. doi: 10.1016/0014-5793(94)00562-1. [DOI] [PubMed] [Google Scholar]
- 24.Husain J, Juurlink BHJ. Oligodendroglial precursor cell susceptibility to hypoxia is related to poor ability to cope with reactive oxygen species. Brain Res. 1995;698:86–94. doi: 10.1016/0006-8993(95)00832-b. [DOI] [PubMed] [Google Scholar]
- 25.Kane DJ, Sarafian TA, Anton R, Hahn H, Gralla EB, Selverstone J, Valentine, Ord T, Bredesen DE. Bcl-2 inhibition of neural death: decreased generation of reactive oxygen species. Science. 1993;262:1274–1277. doi: 10.1126/science.8235659. [DOI] [PubMed] [Google Scholar]
- 26.Kelly FJ. Free radical disorders of preterm infants. Br Med Bull. 1993;49:668–678. doi: 10.1093/oxfordjournals.bmb.a072639. [DOI] [PubMed] [Google Scholar]
- 27.Kristal B, Dubinsky J. Mitochondrial permeability transition in the central nervous system: induction by calcium cycling-dependent and -independent pathways. J Neurochem. 1997;69:524–538. doi: 10.1046/j.1471-4159.1997.69020524.x. [DOI] [PubMed] [Google Scholar]
- 28.Kruman I, Bruce-Keller AJ, Bredesen D, Waeg G, Mattson MP. Evidence that 4-hydroxynonenal mediates oxidative stress-induced neuronal apoptosis. J Neurosci. 1997;17:5089–5100. doi: 10.1523/JNEUROSCI.17-13-05089.1997. [DOI] [PMC free article] [PubMed] [Google Scholar]
- 29.Kuppusamy P, Zweier J. Characterization of free radical generation by xanthine oxidase. J Biol Chem. 1989;264:9880–9884. [PubMed] [Google Scholar]
- 30.Li Y, Guo Y, Jay V, Stewart P, Wong C. Time course of radiation-induced apoptosis in the adult rat spinal cord. Radiother Oncol. 1996;39:35–42. doi: 10.1016/0167-8140(96)01705-7. [DOI] [PubMed] [Google Scholar]
- 31.Li Y, Maher P, Shubert D. A role for 12-lipoxygenase in nerve cell death caused by glutathione depletion. Neuron. 1997;19:453–463. doi: 10.1016/s0896-6273(00)80953-8. [DOI] [PubMed] [Google Scholar]
- 32.Macho A, Hirsch T, Marzo I, Marchetti P, Dallaporta B, Susin S, Zamzami N, Kroemer G. Glutathione depletion is an early and calcium elevation is a late event in thymocyte apoptosis. J Immunol. 1997;158:4612–4619. [PubMed] [Google Scholar]
- 33.Mackenzie-Graham A, Mitrovic B, Smoll A, Merrill J. Differential sensitivity to nitric oxide in immortalized, cloned murine oligodendrocyte cell lines. Dev Neurosci. 1994;16:162–171. doi: 10.1159/000112103. [DOI] [PubMed] [Google Scholar]
- 34.McGahon AJ, Martin SJ, Bissonnette RP, Mahboubi A, Shi Y, Mogil RJ, Nishioka WK, Green DR. Methods in cell biology, Vol 46, pp 153–185. Academic; San Diego: 1995. The end of the (cell) line: methods for the study of apoptosis in vitro. [DOI] [PubMed] [Google Scholar]
- 35.McKinnon RD, Matsui T, Dubois-Dalcq M, Aaronson SA. FGF modulates the PDGF-driven pathway of oligodendrocyte development. Neuron. 1990;5:603–614. doi: 10.1016/0896-6273(90)90215-2. [DOI] [PubMed] [Google Scholar]
- 36.McMorris FA, McKinnon RD. Regulation of oligodendrocyte development and CNS myelination by growth factors: prospects for therapy of demyelinating disease. Brain Pathol. 1996;6:313–329. doi: 10.1111/j.1750-3639.1996.tb00858.x. [DOI] [PubMed] [Google Scholar]
- 37.Meister A. In: metabolism and functions of glutathione (Dolphin D, Poulson R, Avramovic O, eds), pp 367–474. Wiley; New York: 1989. [Google Scholar]
- 38.Meredith MJ, Reed DJ. Status of the mitochondrial pool of glutathione in the isolated hepatocyte. J Biol Chem. 1982;257:3747–3753. [PubMed] [Google Scholar]
- 39.Mitrovic B, Ignarro LJ, Vinters HV, Akers MA, Schmid I, Uittenbogaart C, Merril JE. Nitric oxide induces necrotic but not apoptotic death in oligodendrocytes. Neuroscience. 1995;65:531–539. doi: 10.1016/0306-4522(94)00491-m. [DOI] [PubMed] [Google Scholar]
- 40.Mosmann T. Rapid colorimetric assay for cellular growth and survival: application to proliferation and cytotoxicity assays. J Immunol Methods. 1983;65:55–63. doi: 10.1016/0022-1759(83)90303-4. [DOI] [PubMed] [Google Scholar]
- 41.Perry S, Epstein L, Gelbard H. In situ Trypan blue staining of monolayer cell cultures for permanent fixation and mounting. Biotechniques. 1997;22:1020–1024. doi: 10.2144/97226bm01. [DOI] [PubMed] [Google Scholar]
- 42.Petit P, Lecoeur H, Zorn E, Daugeuet C, Mignotte B, Gougeon M-L. Alterations in mitochondrial structure and function are early events of dexamethasone-induced thymocyte apoptosis. J Cell Biol. 1995;130:157–167. doi: 10.1083/jcb.130.1.157. [DOI] [PMC free article] [PubMed] [Google Scholar]
- 43.Pfeiffer SE, Warrington AE, Bansal R. The oligodendrocyte and its many cellular processes. Trends Cell Biol. 1993;3:191–197. doi: 10.1016/0962-8924(93)90213-k. [DOI] [PubMed] [Google Scholar]
- 44.Plummer JL, Smith BR, Sies H, Bend JR. Chemical depletion of glutathione in vivo. In: Jakoby WD, editor. Methods in enzymology, Vol 77. Academic; New York: 1981. pp. 50–59. [DOI] [PubMed] [Google Scholar]
- 45.Quillet-Mary A, Jaffrezou J-P, Mansat V, Bordier C, Naval J, Laurent G. Implication of mitochondrial hydrogen peroxide generation in ceramide-induced apoptosis. J Biol Chem. 1997;272:21388–21395. doi: 10.1074/jbc.272.34.21388. [DOI] [PubMed] [Google Scholar]
- 46.Rabizadeh S, LaCount DJ, Friesen PD, Bredesen DE. Expression of the baculovirus p35 gene inhibits mammalian neural cell death. J Neurochem. 1993;61:2318–2321. doi: 10.1111/j.1471-4159.1993.tb07477.x. [DOI] [PubMed] [Google Scholar]
- 47.Rorke LB. Perinatal brain damage. In: Adams JH, Duchen LW, editors. Greenfield’s neuropathology, Ed 5. Edward Arnold; London: 1992. pp. 639–709. [Google Scholar]
- 48.Rosenberg P, Harris K. Localization of synapses in rat cortical cultures. Neuroscience. 1993;53:495–508. doi: 10.1016/0306-4522(93)90214-z. [DOI] [PubMed] [Google Scholar]
- 49.Rosse T, Olivier R, Money L, Rager M, Conus S, Fellay I, Jansen B, Borner C. Bcl-2 prolongs cell survival after Bax-induced release of cytochrome C. Nature. 1998;391:496–499. doi: 10.1038/35160. [DOI] [PubMed] [Google Scholar]
- 50.Royall J, Ischoropoulos H. Evaluation of 2′,7-dichlorofluorescin and dihydrorhodamine 123 as fluorescent probes for intracellular H2O2 production in cultured endothelial cells. Arch Biochem Biophys. 1993;302:348–355. doi: 10.1006/abbi.1993.1222. [DOI] [PubMed] [Google Scholar]
- 51.Scarlett J, Murphy M. release of apoptogenic proteins from the mitochondrial intermembrane space during the mitochondrial permeability transition. FEBS Lett. 1997;418:282–286. doi: 10.1016/s0014-5793(97)01391-4. [DOI] [PubMed] [Google Scholar]
- 52.Thorburne SK, Juurlink BHJ. Low glutathione and high iron govern the susceptibility of oligodendroglial precursors to oxidative stress. J Neurochem. 1996;67:1014–1022. doi: 10.1046/j.1471-4159.1996.67031014.x. [DOI] [PubMed] [Google Scholar]
- 53.Tietze F. Enzymic method for quantitative determination of nanogram amounts of total and oxidized glutathione. Anal Biochem. 1969;27:502–522. doi: 10.1016/0003-2697(69)90064-5. [DOI] [PubMed] [Google Scholar]
- 54.Traystman RJ, Kirsch JR, Koehler RC. Oxygen radical mechanisms of brain injury following ischemia and reperfusion. Am J Physiol. 1991;71:1185–1195. doi: 10.1152/jappl.1991.71.4.1185. [DOI] [PubMed] [Google Scholar]
- 55.Troy CM, Stefanis L, Greene LA, Shelanski ML. Nedd2 is required for apoptosis after trophic factor withdrawal, but not superoxide dismutase (SOD1) downregulation, in sympathetic neurons and PC12 cells. J Neurosci. 1997;17:1911–1918. doi: 10.1523/JNEUROSCI.17-06-01911.1997. [DOI] [PMC free article] [PubMed] [Google Scholar]
- 56.van de Bor M, Guit GL, Schreuder AM. Early detection of delayed myelination in preterm infants. Pediatrics. 1989;84:407–411. [PubMed] [Google Scholar]
- 57.Vina J. Glutathione: metabolism and physiological functions. CRC; Boca Raton, FL: 1990. [Google Scholar]
- 58.Volpe JJ. Neurology of the newborn. Saunders; Philadelphia: 1995. [Google Scholar]
- 59.Volpe JJ. Brain injury in the premature infant: neuropathology, clinical aspects and pathogenesis. MRDD Research Reviews. 1997;3:3–12. [PubMed] [Google Scholar]
- 60.Yonezawa M, Back SA, Gan X, Rosenberg PA, Volpe JJ. Cystine deprivation induces oligodendroglial death: rescue by free radical scavengers and by a diffusible glial factor. J Neurochem. 1996;67:566–573. doi: 10.1046/j.1471-4159.1996.67020566.x. [DOI] [PubMed] [Google Scholar]
- 61.Zamzami N, Marchetti P, Castedo M, Hirsch T, Susin S, Masse B, Kroemer G. Inhibitors of permeability transition interfere with the disruption of the mitochondrial transmembrane potential during apoptosis. FEBS Lett. 1996;384:53–57. doi: 10.1016/0014-5793(96)00280-3. [DOI] [PubMed] [Google Scholar]
- 62.Zhovotovsky B, Orrenius S, Brustugun O, Doskeland S. Injected cytochrome C induces apoptosis. Nature. 1998;391:449–450. doi: 10.1038/35060. [DOI] [PubMed] [Google Scholar]


