

Abstract
Cyclooxygenase-2 (COX-2), a key enzyme in the biosynthesis of prostaglandins, is induced in brain blood vessels by pyrogens, and its essential role in fever has been hypothesized. In this study, we determined (1) the type of cells that express cyclooxygenase-2 in brain blood vessels of lipopolysaccharide-treated rats, and (2) the precise relationship between the time course of fever and that of cyclooxygenase-2 protein expression in these cells. Five hours after the lipopolysaccharide injection (100 μg/kg, i.p.), cyclooxygenase-2-like immunoreactive cells were found in the parenchymal and subarachnoidal blood vessels. In these blood vessels, the cyclooxygenase-2-like immunoreactivity was restricted to the perinuclear region of the endothelial cells as revealed by a laser confocal microscopy, double-immunofluorescence staining with an endothelial marker, and immunoelectron microscopy. On the other hand, the cyclooxygenase-2-like immunoreactive cells were distinct from microglia or perivascular/meningeal macrophages as revealed by double immunostaining with macrophage/microglia-specific antibodies. Cyclooxygenase-2-like immunoreactive cells were first found at 1.5 hr after the lipopolysaccharide injection, at which time the fever had not been developed. After that, the number of cyclooxygenase-2-like immunoreactive cells and fever followed a similar time course, both being highest at 5 hr after the lipopolysaccharide injection and both returning to the baseline by 24 hr. These results demonstrate that brain endothelial cells are the primary sites where the activation of arachidonic acid cascade takes place during fever after intraperitoneal injection of lipopolysaccharide.
Keywords: cyclooxygenase-2, brain endothelial cells, fever, prostaglandins, lipopolysaccharide, immune–CNS communication
When animals become infected, a series of pathological responses occur. These responses, known collectively as the acute-phase response, include fever, activation of the hypothalamo-pituitary-adrenal axis, anorexia, hyperalgesia, and changes in the sleep–wake pattern, most of which are under the control of the CNS (Kent et al., 1992). These facts imply that the immune system somehow communicates with the CNS. The mechanism(s) of this immune–CNS communication is not fully understood, although accumulating data suggest that cytokines and prostaglandins (PGs) play essential roles in it (Milton, 1982; Dinarello et al., 1988; Blalock, 1989; Tilders et al., 1994; Watkins et al., 1995; Matsumura et al., 1998). Until recently, however, little is known about where in the brain the activation of the arachidonic acid cascade (i.e., the biosynthesis of PGs) takes place during infection.
To answer this question, we have been focusing our attention on brain cyclooxygenase-2 (COX-2) in a rat model of fever, one of the consequences of immune–CNS communication. COX-2 is an isoform of cyclooxygenase (Goppelt-Struebe, 1995; Herschman, 1996) that is immediately induced by inflammatory stimuli such as lipopolysaccharides (LPSs) and cytokines, and it enhances the biosynthesis of PGs (Goppelt-Struebe, 1995; Herschman, 1996). Using a COX-2-specific inhibitor, we showed that COX-2 played an essential role in fever that was evoked by an intraperitoneal injection of LPS in rats (Cao et al., 1997). As for the localization of COX-2, we (Cao et al., 1995) and other groups (Breder and Saper, 1996) showed that COX-2 mRNA was strongly induced in the brain blood vessels during fever. Its induction was quantitatively correlated with the magnitude of fever but was not a result of the fever (Cao et al., 1997). Furthermore, COX-2 mRNA in the brain blood vessels was also induced by other pyrogenic substances, such as interleukin-1 β (IL-1β) (Cao et al., 1996) and tumor necrosis factor α (TNF-α) (our unpublished observation). On the basis of these findings, we proposed a hypothesis that during infection the activation of the arachidonic acid cascade takes place in the brain blood vessels, where the newly induced COX-2 accelerates the biosynthesis of prostaglandin E2 (PGE2), which after being released into the brain acts on the CNS neurons to evoke fever.
This hypothesis, however, was based on the observation of COX-2 mRNA, not that of COX-2 protein. The latter obviously represents the enzymatic activity of cyclooxygenase more directly than does its mRNA. Thus, it is still not clear whether expression of COX-2 protein precedes the onset of fever, a condition that is essential for the hypothesis. Furthermore, the cellular identity of COX-2 mRNA-expressing cells was hard to determine in the in situ hybridization study because of the difficulty in conducting a double staining with appropriate cell markers. To determine definitely the cell type and the precise relationship between the time course of fever and that of COX-2 protein expression in these cells, we here studied expression of COX-2 protein in LPS-treated rats by using double immunostaining and immunoelectron microscopic techniques. This study has provided data of importance to facilitate our understanding not only of the mechanism of fever but also of that of immune–CNS communication.
MATERIALS AND METHODS
Materials. Male Wistar rats (8 weeks old) were purchased from Shizuoka Laboratory Animal Cooperative (Shizuoka, Japan). They were housed four or five to a cage in a room at 26 ± 2°C with a standard 12 hr light/dark cycle, with free access to food and water. LPS of Escherichia coli O26:B6 and 3-aminopropyltriethoxysilane (3-APTES) for coating glass slides were purchased from Sigma (St. Louis, MO). Rabbit anti-murine COX-2 polyclonal antibody was purchased from Cayman Chemical (Ann Arbor, MI). This antibody was raised against a synthetic 17-mer peptide that is unique to the C terminus of this protein. The synthetic peptide antigen for preabsorption test was obtained as a generous gift from Dr. Jeff Johnson (Cayman Chemical). Mouse anti-rat COX-2 monoclonal antibody was purchased from Transduction Laboratories (Lexington, KY). This antibody was raised against a C-terminal protein fragment corresponding to amino acids 368–604 of rat COX-2. For preabsorption of this monoclonal antibody, COX-2 protein purified from sheep placenta (Cayman Chemical) was used. Other antibodies used and their sources were as follows: OX-42 (Serotec Ltd, Oxford, UK), ED2 (BMA Biomedicals Ltd, Augst, Switzerland), rabbit anti-human von Willebrand (vW) factor polyclonal antibody (DAKO, Carpinteria, CA), and biotinylated goat anti-rabbit IgG and biotinylated goat anti-mouse IgG (Vector Laboratories, Burlingame, CA).
Western blot analysis. For Western blot analysis, samples rich in brain blood vessels were prepared from a normal rat as well as from an LPS-treated rat that had been injected with LPS (100 μg/kg, i.p.) and killed 5 hr later. The rats were decapitated under deep anesthesia with diethyl-ether, and the brains were quickly removed. Each brain was homogenized in 10 vol of 50 mmTris-HCl, pH 7.5, 0.32 m sucrose, 5 mm EDTA, 1 mm 4-(2-aminoethyl)-benzenesulfonyl fluoride, 10 μg/ml leupeptin, and 1 μg/ml E64 with a Teflon homogenizer, and the homogenate was filtered two times through a nylon mesh (mesh size = 200 μm) with a sufficient amount of PBS (20 mm, pH 7.4). The residue on the nylon mesh was highly enriched in blood vessels. These samples were further homogenized with a sonicator, mixed with 2× concentrated SDS sample buffer (1× 125 mmTris-HCl, pH 6.8, 2% SDS, 5% glycerol, 0.003% bromophenol blue, and 1% β-mercaptoethanol), and boiled for 5 min. The samples were then applied to a polyacrylamide gel (10–20% gradient), electrophoresed, and transferred to a polyvinylidene difluoride membrane (Pall Co., Port Washington, NY). The membrane was blocked for 1 hr at room temperature with a blocking buffer containing 0.5% casein and 0.3% Tween 20 in PBS and incubated overnight at 4°C with the anti-COX-2 antibodies (1:2000 dilution for the monoclonal antibody and 1:3000 for the polyclonal one). After the membrane had been washed with the blocking buffer, it was incubated with alkaline phosphatase-conjugated second antibody for 1 hr at room temperature. Immunoreactive proteins were detected with a Phototope-Star Western blot detection kit (New England Biolabs, Beverly, MA).
Temperature monitoring. In conscious rats, abdominal temperature (Tab) was monitored with a telemetry system as described previously (Cao et al., 1997). At least 1 week before the day of an experiment, a temperature transmitter (Mini-Mitter, Sunriver, OR) was implanted into the abdominal cavity of each rat under pentobarbital anesthesia. The signal from the transmitter was detected by a receiver that had been placed under the rat cage and was fed to an IBM personal computer through an appropriate interface. The temperature data were stored in the computer every 10 min.
Tissue preparation. To study the time course of COX-2 expression, we injected rats with LPS (100 μg/kg in 0.5 ml saline, i.p.) between 9:30 and 10:30 A.M. and killed them at seven time points, i.e., 0.75, 1.5, 3, 5, 8, 12, and 24 hr after the LPS injection. For each time point, at least four rats were prepared. As a negative control, rats were injected with saline (0.5 ml, i.p.) and killed 3 or 5 hr after the injection. Under diethyl-ether anesthesia, the rats were perfused through the left ventricle with 20 mm PBS (50 ml) to remove the blood, and their brains were immediately removed and freshly frozen in dry-ice powder and stored at −80°C until use. The brains were also used for double immunohistochemistry.
For immunoelectron microscopy, three rats were injected with LPS (100 μg/kg in 0.5 ml saline, i.p.), and two rats were injected with saline. Four hours after the injection, they were perfused under deep pentobarbital with 0.1 m phosphate buffer (PB), pH 7.4, followed by a fixative containing 4% paraformaldehyde in 0.1m PB, pH 7.4, and 0.1% glutaraldehyde. The brains were removed and stored in the same fixative at 4°C until use.
Immunohistochemistry. Both antibodies to COX-2, one monoclonal and the other polyclonal, stained the same population of COX-2-like immunoreactive (COX-2-ir) cells, although the two antibodies had a distinct preference for a given type of fixation. That is, the polyclonal anti-COX-2 antibody yielded a better staining of sections made from the freshly frozen brains with a short post-fixation. On the other hand, the monoclonal antibody yielded better results in vibratome sections made from the brain fixed by perfusion. Thus, the two antibodies were used properly according to the purpose of the experiments.
For the quantitative analysis of the time course of COX-2 expression, the freshly frozen brains were used to avoid possible variation of the staining attributable to varied fixation conditions among the rats. The freshly frozen brains were cut at a thickness of 14 μm in a cryostat and thaw-mounted on 3-APTES-coated glass slides. After having been air-dried at room temperature for 30 min, the sections were fixed with 2% paraformaldehyde in 0.1 m PBS, pH 7.4, for 10 min at room temperature. After a rinse with PBS, they were treated with 0.3% H2O2 in the PBS for 30 min followed by 3% normal goat serum (NGS) (Vector Laboratories) and 0.25% Triton X-100 in the PBS. Endogenous biotin activity was blocked with a blocking kit (Vector Laboratories) according to the manufacturer’s instructions. The sections were then incubated with rabbit anti-murine COX-2 polyclonal antibody diluted 2400 times in PBS containing 3% NGS and 0.25% Triton X-100 for 64 hr at 4°C followed by biotinylated goat anti-rabbit IgG (200× dilution) for 1 hr at room temperature. COX-2-like immunoreactivity was visualized with a Vectastain Elite ABC kit using diaminobenzidine (DAB) as a chromogen. Control staining was conducted without the primary antibody or with preabsorbed antibody, in which the diluted primary antibody and the antigen peptide (1 μg/ml) had been mixed and incubated at 4°C overnight.
For immunoelectron microscopy, the sections with 50 μm thickness were made with a microslicer (Dosaka EM, Kyoto, Japan). All of the following protocol were conducted with the sections in a free-floating condition with gentle shaking at room temperature unless stated otherwise. The sections were first treated with 0.3% H2O2 in PBS (0.1 m, pH 7.4) for 30 min followed by 10% NGS in PBS. They were then incubated with mouse anti-rat COX-2 monoclonal antibody diluted 1:600 (0.4 μg/ml) in the PBS containing 10% NGS at 4°C for 48 hr, and thereafter incubated for 1 hr with biotinylated goat anti-rabbit IgG diluted 1:200. Control staining was conducted without the primary antibody or with preabsorbed antibody in which the diluted primary antibody and the purified sheep COX-2 (4 μg/ml) had been mixed and incubated at 4°C overnight. The immunoreactivity was visualized with a Vectastain Elite ABC kit. Some of the sections were mounted on 3-APTES-coated glass slides and used for light microscopic examination, and other sections were processed for electron microscopic examination. The latter were post-fixed with 2% paraformaldehyde and 2% glutaraldehyde in PBS at 4°C overnight and then with 2% osmiumtetroxide in 0.2 m PB at 4°C for 90 min. After they were washed with distilled water, the sections were dehydrated in an ascending series of ethanol and embedded in Epon. Ultrathin sections were cut and picked up on mesh grids (no. 100). The sections were stained with lead citrate and uranyl acetate.
Double immunostaining. For identification of the type of COX-2-positive cells in the blood vessels, COX-2 staining was performed in combination with one of three cell-type markers, including anti-vW factor (endothelial cell marker), OX-42 (parenchymal microglia and perivascular/meningeal macrophage marker), and ED2 (perivascular/meningeal macrophage marker). Freshly frozen brain sections post-fixed with 2% paraformaldehyde were suitable for the double immunostaining. In the case of double staining for COX-2 and vW factor (both antibodies were polyclonal from rabbits), the brain sections were first incubated with anti-COX-2, followed by biotinylated goat anti-rabbit IgG. The immunoreactivity was visualized with Cy3-streptavidin (Amersham Life Science, Arlington Heights, IL). The sections were again treated with 3% NGS and then incubated with anti-human vW factor for 1 hr at room temperature followed by FITC-labeled goat anti-rabbit IgG (Zymed, South San Francisco, CA). In some sections that had been stained for COX-2, FITC-labeled goat anti-rabbit IgG was applied without incubation with anti-human vW factor to confirm that cross-binding of FITC-labeled goat anti-rabbit IgG to the first primary antibody (rabbit anti-COX-2 antibody) was negligible.
In the case of double immunostaining with anti-COX-2 and OX-42 or ED2 (the latter two are monoclonal antibodies), the brain sections were incubated with anti-COX-2 polyclonal antibody premixed with either OX-42 (final dilution ×1000) or ED2 (final dilution ×100) for 64 hr at 4°C followed by biotinylated goat anti-rabbit IgG. COX-2 immunoreactivity was visualized with Cy3-streptavidin, and then the sections were treated with an avidin–biotin blocking kit and incubated with biotinylated goat anti-mouse IgG. The immunoreactivities were visualized with Cy2-streptavidin. Cross-binding of Cy2-streptavidin to the biotinylated goat anti-rabbit IgG was negligible. In some cases, the double-stained sections were further stained with TOTO-3 (Molecular Probes, Eugene, OR) to visualize the nuclei.
Microscopy. The sections colored with DAB were examined with a microscope (Olympus), and the images were captured by a high-resolution CCD video camera system, digitized to 32-bit color images, fed into a Macintosh computer, and stored as PICT files for further analysis and presentation. The sections stained with fluorescent dyes were examined with a confocal laser-scanning microscope (Bio-Rad MRC-1024; Bio-Rad, Hercules, CA). Electron microscopic examination was made with a Hitachi H-7000.
Quantitative analysis and statistics. In the time-course study, numbers of COX-2-ir cells in the subarachnoidal space lateral to the optic chiasma were counted in at least four brain sections from each rat. The mean value of this number in each rat was further averaged among four or five rats in each time point. Data were expressed as mean ± SE.
RESULTS
Western blot analysis
Western blot analysis was performed to examine the specificity of antibodies to COX-2. In the blood vessel-enriched brain samples, both monoclonal and polyclonal antibodies raised against COX-2 recognized a protein band of ∼70 kDa, which is consistent with the molecular weight of rat COX-2 (Fig. 1, lanes a and b) (Herschman, 1996). This signal was enhanced when a rat had been injected with LPS (100 μg/kg, i.p.) and killed 5 hr later (Fig. 1, lane c), a result in good agreement with the previous finding that COX-2 mRNA was strongly induced in the brain blood vessels by the LPS treatment. The protein band corresponding to COX-2 was eliminated when preabsorbed antibodies were used as the primary antibodies (Fig. 1, lanes d and e). Although the polyclonal antibody stained two additional bands of larger molecular sizes, these bands were not eliminated with the preabsorbed antibody (data not shown). Thus, possible nonspecific stainings with the polyclonal antibody were distinguishable from specific ones by using the preabsorbed antibody as a negative control.
Fig. 1.

Western blot analysis of COX-2 in the blood vessel-enriched brain samples from rats that had been left untreated (b, d) or injected with LPS (100 μg/kg, i.p.) 5 hr before being killed (a, c, e). Both the monoclonal antibody (a) and polyclonal antibody (b, c) recognized a protein band, the molecular weight of which corresponded well to that of COX-2. The COX-2 signal was enhanced in the sample from an LPS-treated rat (c) compared with that from the untreated rat (b). Preabsorbed polyclonal antibody did not stain the protein band corresponding to COX-2 (d, e). The position of arrowheads indicates a molecular size of 68 kDa.
COX-2 immunostaining
The two antibodies used in the present study revealed COX-2-like immunoreactivity in a subset of telencephalic neurons in the brain tissue from normal as well as LPS-treated rats. Figure2a shows the COX-2-ir neurons in the hippocampal pyramidal cell layer of a saline-injected rat stained with the monoclonal antibody. This staining was completely eliminated when the preabsorbed antibody was used as the primary antibody (Fig. 2b). Figure 2cshows the staining pattern with the polyclonal antibody of COX-2-ir neurons in the cingulate cortex and COX-2-ir non-neuronal cells in the blood vessels in brain tissue from an LPS-treated rat. These neuronal and non-neuronal COX-2-like immunoreactivities were also eliminated when the preabsorbed polyclonal antibody was used as the primary antibody (Fig. 2d). These results together with those of Western blot analysis thus indicated that the two antibodies specifically recognized constitutively expressed COX-2-like immunoreactivity in the neurons and LPS-induced COX-2-like immunoreactivity in the non-neuronal cells in the blood vessels.
Fig. 2.
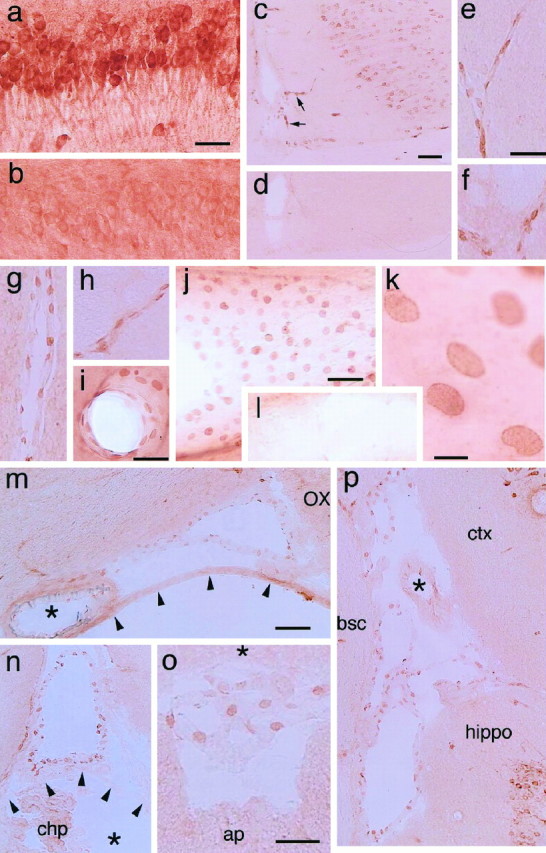
COX-2-ir cells in the brains of rats injected with either saline (a, b, l) or LPS (100 μg/kg, i.p.) (c–k, m–p) 5 hr before being killed.a, COX-2-ir neurons in the pyramidal cell layer of the hippocampus stained with the monoclonal antibody; b, the same area as in a stained with the preabsorbed monoclonal antibody; c, COX-2-ir cells in the cingulate cortex and in the blood vessels penetrating into the brain (arrows); d, the same area as inb stained with the preabsorbed polyclonal antibody;e–h, parenchymal blood vessels stained with the polyclonal antibody; i, j, COX-2-ir cells in the blood vessels stained with the monoclonal antibody; k, a higher magnified view of the same blood vessel as in j;l, no COX-2-ir cells are found in a blood vessel of a saline-treated rat; m, COX-2-ir cells in the subarachnoidal space lateral to the optic chiasma. Thearrowheads and asterisk indicate the arachnoid membrane and the basilar artery, respectively.OX, Optic chiasma; n, COX-2-ir cells in the subarachnoidal space dorsal to the third ventricle. The subarachnoidal space is separated from the third ventricle (*) by the velum interpositum (arrowheads). chp, Choroid plexus; o, COX-2-ir cells in the subarachnoidal space between the cerebellum (*) and dorsal medulla; ap, area postrema; p, COX-2-ir cells in the subarachnoidal space formed by the cortex (ctx), the hippocampus (hippo), and the dorsolateral brain stem, which is a transitional area between the superior colliculus and thalamus;bsc, brachium of the superior colliculus. Note that the blood vessel with a thick wall (denoted by *) contained fewer COX-2-ir cells than those with a thin wall (veins). Scale bars: a, b, e–i, o, 50 μm; c, d, j, l, m, n, p, 100 μm;k, 10 μm.
The distribution of COX-2-ir neurons in the telencephalon was similar to that reported previously by Breder et al. (1995) and was not influenced very much by the LPS treatment. On the other hand, the non-neuronal COX-2-ir cells were observed only in LPS-treated rats and in almost all cases were associated with blood vessels in the brain parenchyma and subarachnoidal space (Fig. 2e–p) and in the spinal cord. The COX-2 staining in these cells was most prominent at the time points of 3 and 5 hr after LPS injection (the detailed time course of COX-2 expression is given in the last part of Results). Figure 2e–h shows COX-2-ir cells in the parenchymal blood vessels stained with the polyclonal antibody. The COX-2-ir structures were oval or spindle-shaped and were situated linearly along the vessel wall. Figure 2i–l shows the results with the monoclonal antibody. In these preparations, probably because of the paraformaldehyde/glutaraldehyde fixation, the COX-2-ir structures were more flattened than those in the freshly frozen and lightly post-fixed samples (Fig. 2e–h). Nevertheless, their oval shape and localization in the vessel wall were essentially the same as those in the former samples. Those blood vessels with COX-2-ir cells were apparently larger in diameter than the capillaries.
COX-2-ir cells were also abundant in subarachnoidal spaces of the LPS-treated rats (Fig. 2m–p). There the COX-2-ir cells lined membranous structures that, in most cases, formed a closed circle, indicating that the membranous structures were blood vessels (further evidence for this point is presented in the following part). A number of COX-2-ir cells were found in blood vessels having a thin wall, whereas few COX-2-ir cells were found in those with a thick wall (Fig. 2m,p). These results indicate that COX-2-ir cells were located predominantly in veins or venules rather than in arteries or arterioles. In the choroid plexus and other parts of the cerebroventricular system, COX-2-ir cells were absent, although the positive cells were present in the blood vessels located close to the ventricular system (Fig. 2n). The examination of COX-2-ir cells in the subarachnoidal space was made only in thaw-mounted brain sections in which the structures of subarachnoidal constituents were better conserved than in those processed by the free-floating method, because the nonparenchymal blood vessels and membranous structures were easily removed or distorted by the latter staining procedure.
Identification of the COX-2-ir cells in the blood vessels
To clarify which subcellular component is responsible for the COX-2-like immunoreactivity, a nuclear-specific fluorescent dye, TOTO-3, was used. Figure3a1–a2 shows laser confocal microscopic views of COX-2-ir cells (red) in a subarachnoidal blood vessel (Fig. 3a1) and those overlaid with TOTO-3 nuclear staining (blue) (Fig. 3a2). It is clear that the COX-2-like immunoreactivity was located mainly in the structure surrounding the nucleus, most likely the nuclear envelope.
Fig. 3.
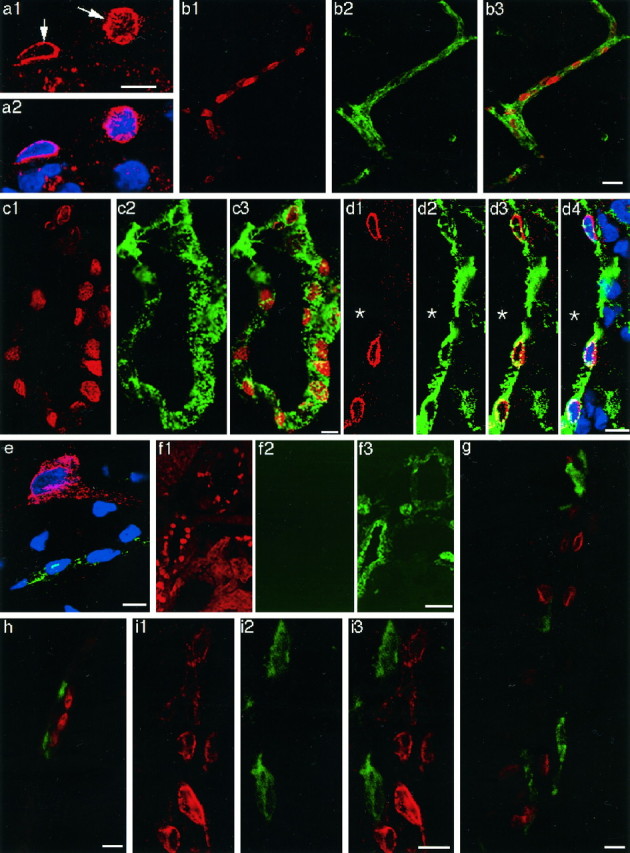
Laser confocal immunofluorescent views of COX-2-positive cells in the brains of LPS-treated rats.a1, COX-2-ir structure (arrows) in the cells of a blood vessel; a2, the COX-2 staining ina1 was overlaid with TOTO-3 nuclear staining (blue). Note that the COX-2-like immunoreactivity was restricted to the surface of the nucleus. COX-2-ir cells in parenchymal (b1) and subarachnoidal (c1, d1) blood vessels. The same blood vessels in b1, c1, andd1 were stained with anti-von Willebrand factor (b2, c2, and d2, respectively). The COX-2 immunostaining (red) was overlaid with von Willebrand factor immunostaining (green) (b3, c3, and d3). d4, The double immunostaining in d3 overlaid with TOTO-3 nuclear staining (blue); e, triple staining of COX-2 (red), von Willebrand factor (green), and nucleus (blue). Note that a neuron was positive for COX-2 but negative for von Willebrand factor; a capillary was positive for von Willebrand factor. COX-2-like immunoreactivity in the neuron was diffusely distributed in the soma and a process. f, A brain section was first stained for COX-2 (f1) and then incubated with FITC-labeled goat anti-rabbit IgG without a previous incubation with anti-von Willebrand factor (f2). Note that fluorescent signal of FITC was very low compared with that in the adjacent section, which had been first stained for COX-2 and then stained for anti-von Willebrand factor as described in Materials and Methods (f3), indicating that cross-binding of FITC-labeled goat anti-rabbit IgG to anti-COX-2 was negligible. Double immunostaining of COX-2-ir cells (red) and ED2-positive macrophages (green) in parenchymal (g) and subarachnoidal (h) blood vessels. COX-2-ir cells (i1) and OX-42-positive cells (i2) were located close to each other but were distinct from one another (i3). Scale bars: 10 μm;b, 20 μm; f, 50 μm.
Figure 3b1–b3 shows double immunostaining for COX-2-like immunoreactivity and vW factor, an endothelial cell marker. All of the COX-2-ir structures (red) were embedded in vW factor-positive structures (green). Also in a larger blood vessel in the subarachnoidal space (Fig. 3c1–c3), all of the COX-2-ir structures were surrounded by vW factor-positive structures. Because vW factor is a cytosolic protein that is specifically present in the endothelial cells (Jaffe et al., 1973;Wagner and Marder, 1983; Theilen and Kuschinsky, 1992), this staining pattern indicates that the COX-2-like immunoreactivity is located in the nucleus of endothelial cells; in other words, COX-2-ir cells are endothelial cells. By overlaying the pattern of TOTO-3 nuclear staining on that of the double immunostaining for COX-2 and vW factor (Fig.3d1–d4), we further confirmed that among the cells associated with the blood vessels, the COX-2-ir cells were the ones that were located closest to the lumen, supporting the idea that the COX-2-ir cells are endothelial cells.
Finally, their endothelial nature was confirmed by the immunoelectron microscopic study (Fig. 4). The COX-2-like immunoreactivity was located mainly in the nuclear envelope of the endothelial cells of LPS-treated rats (Fig. 4a,d). The immunoreactivity was distributed in an intermittent manner on the nuclear envelope from which less intense but distinct immunoreactivity extended to the cytosol and reached the plasma membrane (Fig.4b,c). Consistent with the light-microscopic study, little COX-2-like immunoreactivity was detected in the capillaries (Fig.4e). Incubation without the primary antibody did not yield such staining (Fig. 4f).
Fig. 4.
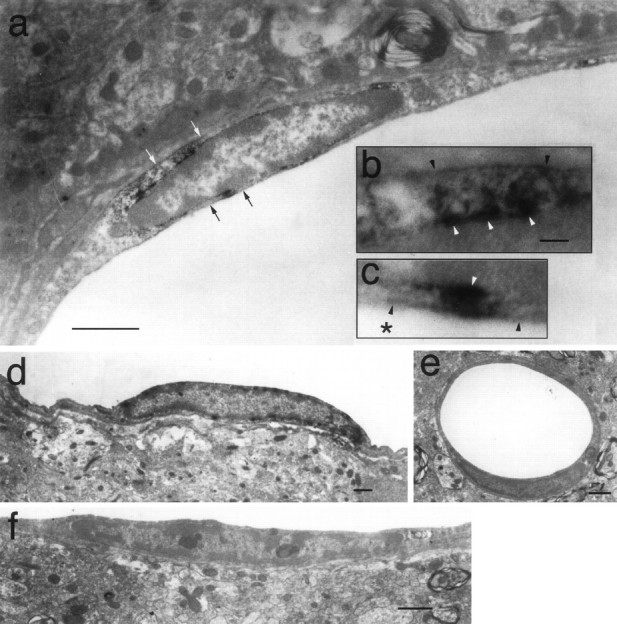
Immunoelectron microscopic observation of COX-2-like immunoreactivity in endothelial cells of LPS-treated rats. COX-2-ir signals were located in the nuclear envelope and the cytosol nearby (a, d). b, c, Magnified views of the regions indicated in a with the white arrows and black arrows, respectively. Theblack and the white arrowheads inb and c indicate plasma membrane and nuclear membrane, respectively. The asterisk inc indicates the luminal side. Minimal COX-2-ir signal was found in capillaries (e). No COX-2-ir signal was observed in the samples incubated without the primary antibody (f). Scale bars: a, d–f, 1 μm; b, c, 0.1 μm.
Because the primary antibodies to COX-2 and vW factor were both of rabbit origin, there was a possibility that the FITC-labeled second antibody, which was expected to bind to anti-vW factor rabbit IgG, also might have bound to anti-COX-2 rabbit IgG, which had been added to the section first. This possibility was clearly excluded by the following two results (Fig. 3e,f1–f3). First, in Figure3e, a triple staining for COX-2 (red), vW factor (green), and nucleic acid (blue) was made in the cerebral cortex. The neuron was positive for COX-2 but negative for vW factor (whereas a small blood vessel was vW factor positive), indicating that the FITC-labeled second antibody did not bind to anti-COX-2 rabbit IgG. Second, when a section was first stained for COX-2 (Fig. 3f1) and then further incubated with FITC-labeled goat anti-rabbit IgG without a previous incubation with anti-vW factor, fluorescent signal of FITC was negligible (Fig.3f2). In contrast, when an adjacent section that had been first stained for COX-2 was further incubated with anti-vW factor followed by FITC-labeled goat anti-rabbit IgG, the fluorescent signal was evident (Fig.3f3).
In contrast to our findings, Elmquist et al. (1997) reported that perivascular microglia and meningeal macrophages were the cells that expressed COX-2 in rats that had been injected with LPS intravenously. Therefore, we examined whether the microglia or macrophages also expressed COX-2-like immunoreactivity in addition to the endothelial cells. Double immunostaining with anti-COX-2 and ED2, which recognizes perivascular and meningeal macrophages, showed that the COX-2-ir cells were distinct from those stained with ED2 in both parenchymal blood vessels (Fig. 3g) and subarachnoidal blood vessels (Fig.3h). Double staining with anti-COX-2 and OX-42, which recognizes the complement 3 receptor expressed in parenchymal and perivascular microglia, also showed that COX-2-ir cells and OX-42-positive cells were distinct from each other although they were sometimes located close to one another (Fig. 3i1–i3). These results indicate that at least in our experimental condition COX-2-like immunoreactivity was induced mainly in the brain endothelial cells and only minutely in the perivascular microglia/meningeal macrophages.
Timing of COX-2 induction in the course of fever
Figure 5 shows the time course of fever after injection of LPS (100 μg/kg, i.p.). Both in LPS- and saline-injected rats, the Tab (<0.5°C) increased slightly immediately after the injections. This increase inTab seemed to be caused by the stress associated with the injection. The Tab of the LPS-injected rats, but not that of the saline-injected ones, started to rise again 1.5 hr after the injection, showed a maximum increase of 2°C approximately 5 hr after the injection, and then gradually declined, representing a typical LPS-induced fever. On the other hand, theTab of the saline-injected rats started to increase 8 hr after the saline injection. This increase was caused by the circadian change in Tab because a similar increase in Tab was also observed in untreated rats.
Fig. 5.

Changes in abdominal temperature (Tab) of LPS-injected rats (squares), saline-injected rats (circles), and untreated rats (triangles). Tab of five rats was measured with a telemetry system without any treatment on the first day. On the second and fourth days, they were injected with saline (0.5 ml, i.p.) and LPS (100 μg/kg, 0.5 ml, i.p.), respectively. All of the injections were made between 9:30 and 10:00 A.M., and the values are expressed as the difference from the preinjection level. The time of injection was set to 0 on the x-axis. For the untreated group, the Tab at 10:00 A.M. was used as the baseline. The downward arrows and the numbers above indicate the time the rats were killed, which was conducted in a separate group of rats (see Fig. 6).
For the evaluation of the amount of COX-2 induction during the time course of fever, we selected seven time points (Fig. 5,arrows) for killing additional rats, the time points approximately corresponding to the latent phase of fever (45 min and 1.5 hr after LPS): rising phase of fever (3 hr), maximal febrile phase (5 hr), early recovery phase (8 hr), late recovery phase (12 hr), and complete recovery phase (24 hr). As a negative control, four rats were injected with saline and killed 3–5 hr later. At each time point, we counted the number of COX-2-ir cells in a restricted region of the subarachnoidal space, which was lateral to the optic chiasma and ventral to the rostral part of the preoptic area (Fig.6). We chose this region because it is close to the anteroventral preoptic area, which was reported to be highly sensitive to PGE2 in terms of the febrile response (Stitt, 1986; Scammell et al., 1996) and to possess a high density of PGE2 receptors (Matsumura et al., 1990, 1992). Figure 6shows COX-2-ir cells in this subarachnoidal space at six of the seven time points after intraperitoneal injection of LPS, and Figure7 summarizes the time course of COX-2-ir cell counts and that of fever. At 45 min after the LPS injection, there were no COX-2-ir cells (Fig. 6a). COX-2-ir cells were first observed at 1.5 hr after the injection (Fig. 6b); their number and intensity of staining further increased until 5 hr (Fig.6c,d) and then gradually declined (Fig. 6e) and disappeared by 24 hr after the injection (Fig. 6f). The important observation here was that by 1.5 hr after the LPS injection, a number of COX-2-ir cells had appeared, at which time the fever was still in the latent phase, for the Tabhad not yet increased (Fig. 7). This is strong evidence that the appearance of COX-2-ir cells preceded the onset of fever. Thus, the induced COX-2 could be the cause of fever. Except for this earlier appearance of COX-2-ir cells than of fever, the number of COX-2-ir cells and fever followed a similar time course up to 24 hr, both being highest at 5 hr after the LPS injection and both returning to the baseline level by 24 hr after the injection. Although not quantitatively analyzed, the time course of COX-2 induction in the endothelial cells of other brain regions was similar to that observed in this subarachnoidal space.
Fig. 6.

Time-dependent changes in the COX-2-ir cells in the subarachnoidal space lateral to the optic chiasma and ventral to the anteroventral preoptic area. After LPS injection, rats were killed at 45 min (a), 1.5 hr (b), 3 hr (c), 5 hr (d), 12 hr (e), and 24 hr (f).
Fig. 7.

Time courses of the number of COX-2-ir cells (•) and change in Tab (■). The data on the numbers of COX-2-ir cells were counted in the same subarachnoidal space as shown in Figure 6.
DISCUSSION
Technical considerations
Several lines of evidence indicated that COX-2-like immunoreactivity visualized in the present study represented the COX-2 protein. First, Western blot analysis showed that the two antibodies properly recognized the band corresponding to the size of COX-2 protein and that the preabsorption test discriminated specific from nonspecific staining. Second, the two different antibodies used here yielded essentially the same staining pattern, which was also consistent with that reported for normal rats (i.e., staining in the telencephalic neurons) (Breder et al., 1995) and LPS-treated rats (i.e., staining in blood vessels) (Elmquist et al., 1997). Third, the distribution of COX-2-ir cells here was in good agreement with that of COX-2 mRNA reported previously in both normal (Yamagata et al., 1993) and LPS-treated rats (Cao et al., 1995, 1997).
Three combinations of double immunostaining, i.e., with anti-COX-2 and anti-vW factor, OX-42, or ED2, were conducted only with freshly frozen brain samples. This was mainly because the antigenicities of these cell markers were well conserved in freshly frozen samples. Possible cross-staining, especially in the combination of two rabbit polyclonal antibodies, i.e., anti-COX-2 and anti-vW factor, was negligible, as shown in Figure 3, e and f1–f3. Another advantage of using the thaw-mounted thin sections was that this preparation retained the anatomical details of the subarachnoidal space better than free-floating sections, thereby making it easy to discriminate arachnoid membrane, pial membrane, and other cell components at the brain surface.
Identity of the COX-2-ir cells
The present result showing that systemic administration of LPS induced COX-2-like immunoreactivity in the cells close to the parenchymal blood vessels is in line with the in situhybridization studies of COX-2 mRNA by our group (Cao et al., 1995,1997) and also agrees well with the previous work by Elmquist et al. (1997). As for the localization of COX-2-ir cells in the subarachnoidal space, however, this study demonstrated for the first time that the COX-2-ir cells there lined a membranous structure that in most cases formed a closed circle (ring shape) and was separated from the arachnoidal membrane, indicating that the COX-2-ir cells were in the blood vessel wall. If the membranous structures had been the meningeal membrane, they would not have formed a closed circle. This is in contrast to the interpretation by Elmquist et al. (1997) that the COX-2-ir cells are meningeal macrophages. The possible reasons for the discrepancy will be discussed in the following paragraph.
The present study provided definitive evidence for the presence of COX-2 in the endothelial cells by double-immunohistochemical and immunoelectron microscopic methods. In contrast, Elmquist et al. (1997)proposed a different view: the COX-2-ir cells in the blood vessels were perivascular microglia and those in the subarachnoidal space were meningeal macrophages. This idea was based on their double-immunohistochemical finding that the COX-2-ir cells were stained with a monoclonal antibody that was reported to specifically recognize activated microglia/macrophages. One possible reason for the discrepancy would be the different experimental conditions between the two studies. We injected LPS intraperitoneally, whereas Elmquist et al. (1997) did so intravenously with a smaller amount. Although COX-2 is potentially inducible in both endothelial cells and microglia/macrophages, as reported in a number of in vitrostudies (Goppelt-Struebe, 1995; Herschman, 1996), the mode of its regulation may not always be identical between the two cell groups (Koll et al., 1997). Thus, different routes and amounts of LPS administration may differentially influence the induction of COX-2 in the two cell groups. Another possibility would be that COX-2 was expressed in both endothelial cells and a subset of microglial cells/macrophages, which were not recognized by the conventional microglial/macrophage markers used in the present study (i.e., OX-42 and ED2) but were only stained with the antibody against the marker for activated microglia used by them. In addition, the present study showed little induction of COX-2 in the choroid plexus. Our previous studies (Cao et al., 1995, 1997) also showed that COX-2 mRNA was induced only minimally in the choroid plexus after intraperitoneal injection of LPS. On the other hand, inductions of COX-2 mRNA and its protein in the choroid plexus were reported by Breder et al. (Breder and Saper, 1996) and Elmquist et al. (1997), respectively. The reason for this discrepancy is not clear at present.
Timing of COX-2 expression and its physiological relevance
The fact that fever induced by intraperitoneal injection of LPS was suppressed by a COX-2-specific inhibitor (Cao et al., 1997) and brain endothelial cells were the major cell population expressing COX-2 in response to LPS suggests that COX-2 in the brain endothelial cells is responsible for fever. However, some points still remained to be clarified before the validity of this hypothesis was established. One of the points was to show that expression of COX-2 protein, which directly reflects potency of the cells to biosynthesize PGs, precedes the occurrence of fever. The present study clearly showed that this is the case. At 1.5 hr after LPS injection, when theTab had not yet increased, COX-2-positive cells were already observed in some brain blood vessels. Unexpectedly, the Western blot analysis showed that the brain blood vessels expressed a low but significant amount of COX-2 protein in the absence of pyrogenic stimuli. Probably, the histochemical techniques, including in situ hybridization technique, were not sensitive enough to detect such a low amount of COX-2 protein constitutively expressed in the blood vessels under the normal condition. The COX-2 constitutively expressed in the brain blood vessels may explain the early onset of fever (10–30 min) that was reported after intravenous administration of LPSs or cytokines (Kluger, 1991).
Another essential issue to be clarified for the understanding of the role of brain endothelial COX-2 in fever is whether PGH2, the product of COX-2, is further converted to PGE2, the fever mediator, in the endothelial cells, and whether PGE2 is secreted into the CSF–brain compartment. Demonstration of PGE2 synthase colocalizing with COX-2 in the endothelial cells would be of importance. However, PGE2 synthase has not yet been identified at the molecular level; therefore, appropriate probes for histochemical study of PGE2 synthase are not available at present. On the other hand, the following results suggest that the endothelial cells do synthesize PGE2 and secrete it into the CSF–brain compartment. First, PGE2-like immunoreactivity was detected in the brain blood vessels after intravenous injection of a high dose of LPS (Van Dam et al., 1993), and second, PGE2 was secreted from cultured brain endothelial cells in a higher amount than PGI2 in response to LPS or cytokine stimuli (de Vries et al., 1995). Third, PGE2 level in the CSF was increased after intraperitoneal injection of LPS, and this response was dependent on COX-2 because pretreatment with a COX-2-specific inhibitor significantly suppressed it (our unpublished observation), suggesting that PGE2 in the CSF is secreted from COX-2-bearing cells close to the CSF compartment. Thus, endothelial cells in the subarachnoidal space could well be the source of PGE2 in the CSF.
COX-2-like immunoreactivity was predominantly expressed in veins and venules rather than in arteries or capillaries. The mechanism of this restricted induction and its physiological significance are not clear at present. It was reported, however, that interleukin-1 type-1 receptor mRNA was also predominantly expressed in venules of the brain (Cunningham et al., 1992; Yabuuchi et al., 1994). Thus, sensitivity to the cytokines or LPS might be higher in the venules and veins than in arteries or capillaries. As for its physiological significance, PGs produced in the endothelial cells in veins may gain access to the CSF more easily than those from the endothelial cells in arteries because of the undeveloped smooth muscle layer in the former.
The induction of COX-2 in the brain endothelial cells was not restricted to the specific brain regions related to fever but was distributed throughout the brain, spinal cord, and subarachnoidal space. What would be the physiological significance of this widespread induction of COX-2? One possibility is that the products of COX-2 exert their action locally, i.e., in the vicinity of their production. Recently, Ericsson et al. (1997) reported that there is an intramedullary prostaglandin-dependent mechanism in the activation of neuroendocrine circuitry by intravenous IL-1. They assumed that circulating IL-1 activates perivascular cells possessing IL-1 receptor to activate arachidonic acid cascade, the product of which acts on medullary neurons. In relation to this notion, we have reported that receptors for PGs are widely distributed throughout the brain and spinal cord (Matsumura et al., 1990, 1992, 1995; Takechi et al., 1996;Matsumura et al., 1998). Another possibility is that the PGs produced are first conveyed to the CSF and transported to the specific brain sites at a distance by a bulk flow of, or diffusion in, the CSF and then they act there to evoke fever and other acute-phase responses. This issue should be clarified in the future.
There has been a long discussion (Tilders et al., 1994; Watkins et al., 1995; Blatteis and Sehic, 1997) as to how the immune system communicates with the CNS. The present study, together with our previous ones (Cao et al., 1996, 1997; Matsumura et al., 1998), suggests that at least under the present experimental conditions, brain endothelial cells constitute one of the routes for immune–CNS communication, in which the endothelial cells transform the blood-borne immune signal into a prostaglandin signal, which in turn acts on the CNS neurons to evoke fever and other acute-phase responses. In this sense, brain endothelial cells, although they construct a barrier between blood and brain, function as an immune–CNS interface as well.
Footnotes
We thank Dr. Jeff Johnson for providing the COX-2 antigen peptide, and Dr. Kanato Yamagata for his helpful discussion.
Correspondence should be addressed to Dr. Kiyoshi Matsumura, Department of Neuroscience, Osaka Bioscience Institute, 6–2-4 Furue-dai, Suita, Osaka 565, Japan.
REFERENCES
- 1.Blalock JE. A molecular basis for bidirectional communication between the immune and neuroendocrine systems. Physiol Rev. 1989;69:1–32. doi: 10.1152/physrev.1989.69.1.1. [DOI] [PubMed] [Google Scholar]
- 2.Blatteis CM, Sehic E. Fever: how may circulating pyrogens signal the brain? News Physiol Sci. 1997;12:1–9. [Google Scholar]
- 3.Breder CD, Saper CB. Expression of inducible cyclooxygenase mRNA in the mouse brain after systemic administration of bacterial lipopolysaccharide. Brain Res. 1996;713:64–69. doi: 10.1016/0006-8993(95)01474-8. [DOI] [PubMed] [Google Scholar]
- 4.Breder CD, Dewitt D, Kraig RP. Characterization of inducible cyclooxygenase in rat brain. J Comp Neurol. 1995;355:296–315. doi: 10.1002/cne.903550208. [DOI] [PMC free article] [PubMed] [Google Scholar]
- 5.Cao C, Matsumura K, Yamagata K, Watanabe Y. Induction by lipopolysaccharide of cyclooxygenase-2 mRNA in rat brain; its possible role in the febrile response. Brain Res. 1995;697:187–196. doi: 10.1016/0006-8993(95)00839-i. [DOI] [PubMed] [Google Scholar]
- 6.Cao C, Matsumura K, Yamagata K, Watanabe Y. Endothelial cells of the rat brain vasculature express cyclooxygenase-2 mRNA in response to systemic interleukin-1β: a possible site of prostaglandin synthesis responsible for fever. Brain Res. 1996;733:263–272. doi: 10.1016/0006-8993(96)00575-6. [DOI] [PubMed] [Google Scholar]
- 7.Cao C, Matsumura K, Yamagata K, Watanabe Y. Involvement of cyclooxygenase-2 in LPS-induced fever and regulation of its mRNA in the rat brain by LPS. Am J Physiol. 1997;272:R1712–R1725. doi: 10.1152/ajpregu.1997.272.6.R1712. [DOI] [PubMed] [Google Scholar]
- 8.Cunningham JET, Wada E, Carter DB, Tracey DE, Battey JF, De Souza EB. In situ histochemical localization of type I interleukin-1 receptor messenger RNA in the central nervous system, pituitary, and adrenal gland of the mouse. J Neurosci. 1992;12:1101–1114. doi: 10.1523/JNEUROSCI.12-03-01101.1992. [DOI] [PMC free article] [PubMed] [Google Scholar]
- 9.de Vries HE, Hoogendoorn KH, van Dijk J, Zijlstra FJ, van Dam A-M, Breimer DD, van Berkel TJC, de Boer AG, Kuiper J. Eicosanoid production by rat cerebral endothelial cells: stimulation by lipopolysaccharide, interleukin-1 and interleukin-6. J Neuroimmunol. 1995;59:1–8. doi: 10.1016/0165-5728(95)00009-q. [DOI] [PubMed] [Google Scholar]
- 10.Dinarello CA, Cannon JG, Wolf SM. New concept on the pathogenesis of fever. Rev Infect Dis. 1988;10:168–190. doi: 10.1093/clinids/10.1.168. [DOI] [PubMed] [Google Scholar]
- 11.Elmquist JK, Breder CD, Sherin JE, Scammell TE, Hickey WF, Dewitt D, Saper CB. Intravenous lipopolysaccharide induces cyclooxygenase 2-like immunoreactivity in rat brain perivascular microglia and meningeal macrophages. J Comp Neurol. 1997;381:119–129. doi: 10.1002/(sici)1096-9861(19970505)381:2<119::aid-cne1>3.0.co;2-6. [DOI] [PubMed] [Google Scholar]
- 12.Ericsson A, Arias C, Sawchenko PE. Evidence for an intramedullary prostaglandin-dependent mechanism in the activation of stress-related neuroendocrine circuitry by intravenous interleukin-1. J Neurosci. 1997;17:7166–7179. doi: 10.1523/JNEUROSCI.17-18-07166.1997. [DOI] [PMC free article] [PubMed] [Google Scholar]
- 13.Goppelt-Struebe M. Regulation of prostaglandin endoperoxide synthase (cyclooxygenase) isozyme expression. Prostaglandins Leukot and Essent Fatty Acids. 1995;52:213–222. doi: 10.1016/0952-3278(95)90039-x. [DOI] [PubMed] [Google Scholar]
- 14.Herschman HR. Prostaglandin synthase 2. Biochim Biophys Acta. 1996;1299:125–140. doi: 10.1016/0005-2760(95)00194-8. [DOI] [PubMed] [Google Scholar]
- 15.Jaffe EA, Hoyer LW, Nachman RL. Synthesis of antihemophilic factor antigen by cultured human endothelial cells. J Clin Invest. 1973;52:2757–2764. doi: 10.1172/JCI107471. [DOI] [PMC free article] [PubMed] [Google Scholar]
- 16.Kent S, Bluthé RM, Kelley KW, Danzer R. Sickness behavior as a new target for drug development. Trends Pharmacol Sci. 1992;13:24–28. doi: 10.1016/0165-6147(92)90012-u. [DOI] [PubMed] [Google Scholar]
- 17.Kluger MJ. Fever: role of pyrogens and cryogens. Physiol Rev. 1991;71:93–127. doi: 10.1152/physrev.1991.71.1.93. [DOI] [PMC free article] [PubMed] [Google Scholar]
- 18.Koll S, Goppelt-Struebe M, Hauser I, Goerig M. Monocytic-endothelial cell interaction: regulation of prostanoid synthesis in human coculture. J Leukoc Biol. 1997;61:679–688. doi: 10.1002/jlb.61.6.679. [DOI] [PubMed] [Google Scholar]
- 19.Matsumura K, Watanabe Yu, Onoe H, Watanabe Y, Hayaishi O. High density of prostaglandin E2 binding sites in the anterior wall of the 3rd ventricle: a possible site of its hyperthermic action. Brain Res. 1990;533:147–151. doi: 10.1016/0006-8993(90)91808-t. [DOI] [PubMed] [Google Scholar]
- 20.Matsumura K, Watanabe Yu, Imai-Matsumura K, Connolly M, Koyama Y, Onoe H, Watanabe Y. Mapping of prostaglandin E2 binding sites in rat brain using quantitative autoradiography. Brain Res. 1992;581:292–298. doi: 10.1016/0006-8993(92)90720-t. [DOI] [PubMed] [Google Scholar]
- 21.Matsumura K, Watanabe Yu, Onoe H, Watanabe Y. Prostacyclin receptor in the brain and central terminals of the primary sensory neurons: an autoradiographic study using a stable prostacyclin analogue [3H]iloprost. Neuroscience. 1995;65:493–503. doi: 10.1016/0306-4522(94)00505-y. [DOI] [PubMed] [Google Scholar]
- 22.Matsumura K, Cao C, Watanabe Yu, Watanabe Y. Prostaglandin system in the brain: sites of biosynthesis and sites of action under normal and hyperthermic conditions. Prog Brain Res. 1998;115:275–295. doi: 10.1016/s0079-6123(08)62040-3. [DOI] [PubMed] [Google Scholar]
- 23.Milton AS. Prostaglandins in fever and the mode of action of antipyretic drugs. In: Milton AS, editor. Pyretics and antipyretics. Springer; Berlin: 1982. pp. 259–267. [Google Scholar]
- 24.Scammell TE, Elmquist JK, Griffin JD, Saper CB. Ventromedial preoptic prostaglandin E2 activates fever-producing autonomic pathways. J Neurosci. 1996;16:6246–6254. doi: 10.1523/JNEUROSCI.16-19-06246.1996. [DOI] [PMC free article] [PubMed] [Google Scholar]
- 25.Stitt JT. Prostaglandin E as the neural mediator of the febrile response. Yale J Biol Med. 1986;59:137–149. [PMC free article] [PubMed] [Google Scholar]
- 26.Takechi H, Matsumura K, Watanabe Y, Kato K, Noyori R, Suzuki M, Watanabe Y. A novel subtype of the prostaglandin receptor expressed in the central nervous system. J Biol Chem. 1996;271:5901–5906. doi: 10.1074/jbc.271.10.5901. [DOI] [PubMed] [Google Scholar]
- 27.Theilen H, Kuschinsky W. Fluorescence labeling of the capillary network in rat brain. J Cereb Blood Flow Metab. 1992;12:347–350. doi: 10.1038/jcbfm.1992.47. [DOI] [PubMed] [Google Scholar]
- 28.Tilders FJH, DeRijk RH, van Dam A-M, Vincent VAM, Schotanus K, Persoons JHA. Activation of the hypothalamus-pituitary-adrenal axis by bacterial endotoxins: routes and intermediate signals. Psychoneuroendocrinology. 1994;19:209–232. doi: 10.1016/0306-4530(94)90010-8. [DOI] [PubMed] [Google Scholar]
- 29.Van Dam A-M, Brouns M, Man-A-Hing W, Berkenbosch F. Immunocytochemical detection of prostaglandin E2 in microvasculature and in neurons of rat brain after administration of bacterial endotoxin. Brain Res. 1993;613:331–336. doi: 10.1016/0006-8993(93)90922-a. [DOI] [PubMed] [Google Scholar]
- 30.Wagner DD, Marder VJ. Biosynthesis of von Willebrand protein by human endothelial cells. J Biol Chem. 1983;258:2065–2067. [PubMed] [Google Scholar]
- 31.Watkins LR, Maier SF, Goehler LE. Cytokine-to-brain communication: a review and analysis of alternative mechanisms. Life Sci. 1995;57:1011–1026. doi: 10.1016/0024-3205(95)02047-m. [DOI] [PubMed] [Google Scholar]
- 32.Yabuuchi K, Minami M, Katsumata S, Satoh M. Localization of type I interleukin-1 receptor mRNA in the rat brain. Mol Brain Res. 1994;27:27–36. doi: 10.1016/0169-328x(94)90180-5. [DOI] [PubMed] [Google Scholar]
- 33.Yamagata K, Andreasson KI, Kaufmann WE, Barnes CA, Worley PF. Expression of a mitogen-inducible cyclooxygenase in brain neurons: regulation by synaptic activity and glucocorticoids. Neuron. 1993;11:371–386. doi: 10.1016/0896-6273(93)90192-t. [DOI] [PubMed] [Google Scholar]