

Abstract
Synchronization of spatially distributed responses in the cortex is often associated with periodic activity. Recently, synchronous oscillatory patterning was described for visual responses in retinal ganglion cells that is reliably transmitted by the lateral geniculate nucleus (LGN), raising the question of whether oscillatory inputs contribute to synchronous oscillatory responses in the cortex.
We have made simultaneous multi-unit recordings from visual areas 17 and 18 as well as the LGN and the retina to examine the interactions between subcortical and cortical synchronization mechanisms. Strong correlations of oscillatory responses were observed between retina, LGN, and cortex, indicating that cortical neurons can become synchronized by oscillatory activity relayed through the LGN. This feedforward synchronization occurred with oscillation frequencies in the range of 60–120 Hz and was most pronounced for responses to stationary flashed stimuli and more frequent for cells in area 18 than in area 17. In response to moving stimuli, by contrast, subcortical and cortical oscillations dissociated, proving the existence of independent subcortical and cortical mechanisms. Subcortical oscillations maintained their high frequencies but became transient. Cortical oscillations were now dominated by a cortical synchronizing mechanism operating in the 30–60 Hz frequency range. When the cortical mechanism dominated, LGN responses could become phase-locked to the cortical oscillations via corticothalamic feedback.
In summary, synchronization of cortical responses can result from two independent but interacting mechanisms. First, a transient feedforward synchronization to high-frequency retinal oscillations, and second, an intracortical mechanism, which operates in a lower frequency range and induces more sustained synchronization.
Keywords: synchronization, visual cortex, thalamus, retina, cross-correlation, oscillations
It has been proposed that assemblies of cortical neurons representing particular conjunctions of features may be defined by the temporal correlation of their responses. The finding that correlations among neurons distributed within and across cortical areas tend to occur with zero phase lag and depend on stimulus configuration suggests that synchronization results from reciprocal interactions rather than a strictly serial transmission or shared input (for review, see Singer and Gray, 1995). Reciprocal connections exist also between the lateral geniculate nucleus (LGN) and the visual cortex, raising the possibility that synchronizing interactions include the thalamus. Recently, evidence has been obtained that LGN cells can synchronize their responses in a stimulus-dependent way and that these interactions are mediated by corticofugal projections (Sillito et al., 1994). LGN cells can also synchronize their discharges with very high temporal precision because of synchronized oscillatory input from the retina (Neuenschwander and Singer, 1996), and evidence indicates that synchronous LGN responses in turn are particularly effective in driving cortical cells (Alonso et al., 1996). This suggests the possibility that the oscillatory patterning of visual responses in the retina and the LGN (Doty and Kimura, 1963; Laufer and Verzeano, 1967; Steriade, 1968a; Arnett, 1975; Ghose and Freeman, 1992; Neuenschwander and Singer, 1996) contributes to the oscillatory modulation and synchronization of cortical responses. This hypothesis is supported by the observation that synchronization of spatially distributed responses in the retina depends on global stimulus properties, such as continuity, in a way similar to that of cortical synchronization. However, retinal and cortical oscillations differ markedly in frequency and time course, making it unlikely that synchronization phenomena in the cortex simply reflect retinal interactions (Ito et al., 1994;Neuenschwander and Singer, 1996).
To investigate the relation between subcortical and cortical synchronization mechanisms, we recorded simultaneously from the retina, the LGN, and the visual cortex and studied the synchronization of responses to stationary and moving stimuli within and across the various processing levels.
MATERIALS AND METHODS
Preparation and surgical procedures. In 11 adult cats, simultaneous recordings were obtained from the LGN and cortical areas 17 and 18. In four additional cats, recordings were also obtained from the retina (Peichl and Wässle, 1979). After induction of anesthesia with ketamine (Ketanest, Parke-Davis, Courbevoie, France; 10 mg/kg, i.m.) and xylazine (Rompun, Bayer, Wuppertal, Germany; 2 mg/kg, i.m.), a tracheotomy was made for artificial ventilation, and the animal was placed in a stereotaxic apparatus. Throughout surgery and during the recordings, general anesthesia was maintained by ventilating the animal with a mixture of 70% N20 and 30% 02 supplemented by 0.5–1.0% halothane. Recording chambers were mounted over the cortical region representing the area centralis in areas 17 and 18 and above the LGN (A 6.5, L 9.5). At the end of the surgery, the skull was secured to a metal rod, and the stereotaxic ear and eye bars were removed. Paralysis was obtained with pancuronium bromide (Pancuronium, Organon Teknika-Cappel, Malvern, PA; 0.15 mg · kg−1 · hr−1). The end-tidal CO2 and the body temperature were kept in the range of 3–4% and 37–38°C, respectively. Ventilation pressure and the electrocardiogram were also monitored continuously. Fluid loss was compensated by continuous infusion of saline solution and administration of glucose and electrolytes through a gastric catheter.
For recording from retinal ganglion cells, the left eye was immobilized by suturing the conjunctiva to a ring attached to the stereotaxic frame. Through a scleral incision, a guide tube was inserted into the posterior eye chamber and positioned under visual control using an ophthalmoscope. All surgical procedures were performed according to the German guidelines for the welfare of experimental animals.
Corneal drying was prevented by contact lenses with an artificial pupil of 3 mm, with refraction corrected for a viewing distance of 114 cm, where a tangent screen was positioned. The optic disk and area centralis were plotted onto the screen with a fundus camera (Zeiss) and served as landmarks for locating the receptive fields.
Recordings. Extracellular single cell or multi-unit activity (MUA) was recorded by means of varnish-coated tungsten electrodes (impedance at 100 Hz: 1.0–2.0 MΩ, ∼25 μm tip diameter). The large majority of our recordings were multi-unit activity and comprised the responses of 2–5 cells. Pairs of electrodes, which could be driven independently (SPI microdrives), were positioned in the retina, the LGN, and the cortex (a total of four to eight electrodes). Exploratory penetrations were first made in the LGN to position the recording electrodes within the representation of the central 10° of the visual field. Subsequently, a guide tube was inserted with the tip placed 4 mm above the LGN to reduce divergence of the electrodes. Simultaneous recordings were obtained from different laminae of the same LGN or from the LGNs of the two hemispheres. Signals were amplified (10,000×) and bandpass-filtered from 0.3 to 3 kHz, and spikes were detected with an amplitude discriminator with the threshold set to twice the noise level. Data were digitized at a rate of 10 kHz and stored on disk (PDP-11, Digital Equipment).
Visual stimulation. Stationary or moving light spots and bars were generated with an optical bench (contrast, 0.75; background luminance ∼0.4 cd/m−2) and front-projected onto a tangent screen. Light was provided by a DC-powered source, and the position and movement of the stimuli were controlled by mirrors mounted on computer-driven galvanometers. Under these conditions the stimulus is free of any oscillatory components. Drifting gratings (spatial frequency, 0.2–1.5 cycles/°; temporal frequency, 1–6 Hz) were generated on a computer screen with a refresh rate of 100 Hz (contrast, 0.50). The direction of movement of the bars and gratings was always perpendicular to their orientation. Bar velocity was varied within a large range, from 1 to 70°/sec. Unless indicated otherwise, stimulation was binocular, after the optical axes had been aligned with a prism placed in front of one of the eyes.
Data analysis. Analysis was performed with a program package developed in LabVIEW (National Instruments, Austin, TX) running on a Power Macintosh. Response histograms (PSTH) were compiled for all channels, and a 1–3 sec window was placed over the epoch of maximal coactivation for correlation analysis. Auto- and cross-correlograms were calculated between individual responses within these windows, with a resolution of 1.0 msec, and subsequently averaged more than 20 stimulus presentations. We restricted statistical analysis to epochs of strong coactivation, excluding correlograms with low spike counts (number of coincidences per bin less than two or firing rates less than 10 spikes/sec).
We have routinely computed shift predictors controls to certify whether synchronized responses arise from neuronal interactions and not simply from stimulus-locked coordination (Perkel et al., 1967). It is important to emphasize that these controls can be applied only if the timing of stimulus onset is highly reproducible, with an accuracy of 1 msec. We used the responses of a photo-diode cell to measure the onset jitters for stimuli generated by the optical bench or the computer screen. The variability observed in stimulus onset was below 1 msec for both methods of stimulation, validating our controls.
A possible problem in using a computer screen for stimulus generation is that Y-cells may follow the monitor retrace at frequencies as high as 100 Hz. Ghose and Freeman (1992) reported that ∼3% of the oscillations in the LGN may show complete phase-locking to the monitor retrace. Ito et al. (1994) also reported a few cases of stimulus-locked oscillations in the cat LGN. Wörgotter and Funke (1995) pointed out that stimulus-locking may occur often in geniculate responses. We have made additional controls to verify whether the strong modulations seen in the correlograms were caused by the 100 Hz flicker of the screen. Cross-correlations computed between the neuronal responses and the photo-diode responses showed only residual modulations that did not survive the subtraction of the shift predictors from the raw correlograms. In our study, synchronous oscillations could be attributed to stimulus flicker in only 7 of 939 pairs of recording sites (RSs). These cases were excluded from our statistics.
To evaluate the neuronal interactions, a damped cosine function was fitted to the correlograms, and its parameters were used to determine the strength and phase shift of correlations and, when oscillations were present, the frequency and modulation depth of oscillatory patterning. An iterative algorithm was used for the fitting procedure [Levenberg-Marquardt algorithm, as described in Press et al. (1986)] to obtain error estimates for the various function parameters and to permit computation of confidence intervals at all data points (König, 1994). Correlation strength was assessed from the modulation amplitude index, which is the ratio between the amplitude of the central peak of the fitted function and its offset. When an oscillatory patterning of the responses was detected, the modulation amplitude of the first satellite peak (MAS) was used to evaluate the oscillation strength. Responses were flagged as synchronous if the following criteria were fulfilled: (1) the modulation of the central peak in the correlogram persisted after subtraction of the shift predictor [computed as a control for stimulus-locked correlations (Perkel et al., 1967)]; (2) the fitted function explained at least 15% of the correlogram variance; (3) the central peak had aZ-score >2; and (4) the modulation amplitude index was ≥0.1. The same criteria were applied to the modulation amplitude of the first satellite peak to flag responses as oscillatory.
A sliding window analysis was used to follow the development of synchronization over time. It consisted in moving over the responses a short analysis window (100–250 msec) in successive steps (50–100 msec). The correlograms obtained from each of those overlapping windows were plotted as a two-dimensional array, where they-axis denotes time lag of the correlation and thex-axis denotes the time course of the responses. The amplitude of the correlograms was normalized by the geometric mean of firing rates and displayed with a color or gray-level code.
The orientation tuning of cortical receptive fields was assessed from responses to moving gratings of different orientations (step of 30°). All recordings from the cortex exhibited pronounced orientation tuning, excluding a contribution of geniculate afferents to the recorded MUA responses.
RESULTS
For correlation analysis we examined 583 pairs of recording sites: 74 were between cortical neurons, 333 were between the LGN and the cortex, 51 were between the retina and the cortex, and 125 were between the retina and the LGN. The results are presented in two parts. First, we summarize data from autocorrelation analysis to illustrate how the oscillatory patterning of responses changes along the retinothalamocortical pathway and how it depends on stimulus conditions. Subsequently, we present results from cross-correlation analysis and examine to which extent correlations between thalamic and cortical activity are attributable to feedforward or feedback interactions.
Stimulus dependency of oscillatory patterning
Autocorrelation analysis revealed an oscillatory patterning of responses for at least one stimulus condition in the majority of recording sites: 57% in A17 (71 of 124 RSs), 70% in A18 (39 of 56 RSs), 69% in the LGN (334 of 485 RSs), and 77% in the retina (92 of 120 RSs). The distributions of oscillation frequency of cortical, thalamic, and retinal responses were broad and overlapping (Fig.1). Frequencies ranged from 20 to 124 Hz (mean, 49 Hz) in the cortex, from 20 to 132 Hz (mean, 92 Hz) in the LGN, and from 30 to 126 Hz (mean, 89 Hz) in the retina. In the cortex, the distribution of oscillation frequencies was bimodal; most were in the range of 20–60 Hz, but there was a second cluster above 80 Hz. Oscillation frequencies of thalamic and retinal responses distributed more uniformly: between 60 and 120 Hz.
Fig. 1.

Distribution of oscillation frequencies for all autocorrelation functions exhibiting a significant modulation. A17 (614 autocorrelation functions from 124 RSs), A18 (377 from 56 RSs), LGN (4084 from 485 RSs), and retina (841 from 120 RSs). Notice that oscillation frequencies cover a large range for all structures. Cortical oscillations tend to have a bimodal distribution, with two distinct clusters at 20–60 and 80–120 Hz, whereas thalamic and retinal oscillatory responses cover mostly the high-frequency range: from 60 to 120 Hz.
Oscillation frequency depended on stimulus conditions, and this dependence was particularly pronounced for cortical responses. In the cortex, moving and stationary stimuli evoked oscillations in two distinct frequency bands, respectively. Drifting gratings or moving bars (dynamic condition) evoked preferentially 30–60 Hz oscillations (mean, 44 Hz), whereas stationary flashed stimuli (static condition) induced 60–120 Hz oscillations (mean, 78 Hz; p < 0.001, ANOVA). By contrast, responses in the retina and the LGN tended to oscillate always in the high-frequency range, regardless of the stimulus condition. This is exemplified in Figure2 for responses recorded simultaneously from A18 and the LGN. In A18 the responses evoked by drifting gratings exhibited a strong oscillatory patterning at 37 Hz, whereas responses to stationary flashed stimuli oscillated at 75 Hz. In the LGN, oscillation frequency was high for both conditions and changed less and in the opposite direction when stimuli were changed from the dynamic (89 Hz) to the static condition (79 Hz). On average, oscillation frequencies of subcortical responses changed by −11 ± 3 Hz (n = 4800 correlograms) and those of cortical responses changed by + 30.3 ± 12 Hz (n = 888) when the stimulation condition was changed from dynamic to static. This dissociation of oscillation frequencies between the retina and the LGN on the one hand and the cortex on the other suggests the existence of two oscillatory mechanisms: a cortical mechanism that operates in the low-frequency range (between 30 and 60 Hz) and is activated preferentially with moving stimuli, and a subcortical, most likely retinal mechanism that operates in the high-frequency range (60–120 Hz) and is activated by both stationary and dynamic stimuli.
Fig. 2.

Comparison of oscillation frequencies for static and dynamic stimuli. Simultaneous multi-unit recordings were obtained from A18 and ipsilateral lamina A1, as represented in the top left inset. Left panels show autocorrelation functions obtained for responses to drifting gratings whose orientation and drift velocity matched the tuning of the cortical neurons (Dynamic). Right panels show autocorrelations for responses to a stationary, rectangular light stimulus flashed over the receptive fields (Static). Oscillation frequency indicated in each panel was derived from a generalized Gabor function fitted to the correlogram. Orientation tuning curves for A18 and LGN cells are shown to theleft; the arrow indicates the direction of motion. Notice that oscillation frequency for the cortical cells is much lower in response to the dynamic (37 Hz) than to the static stimulus (75 Hz). For the LGN cells, oscillatory modulations have similar high frequencies, regardless of stimulus condition. A schematic representation of the receptive fields (circles andrectangles; the crossing line denotes orientation preference) and stimulus is shown on the topof the figure (scale bar = 1° of visual angle;cross, area centralis representation). In the examples presented in this figure as well as in the following ones, the drifting gratings were generated on a 100 Hz computer screen. Flashed light squares or moving bars were generated by an optical bench-fitted DC source. In this condition the stimulus is free of any oscillatory component.
Another consistent stimulus dependence of oscillation frequencies was that ON responses to static stimuli usually oscillated at higher frequencies (LGN, mean 88 Hz; A17, mean 67 Hz; A18, mean 75 Hz) than OFF responses (LGN, mean 78 Hz; A17, mean 35.2 Hz; A18, mean 57 Hz; p < 0.001 for LGN, p < 0.05 for A18; difference did not reach significance for A17).
To examine whether the oscillatory patterning of cortical responses is influenced by stimulus orientation, we determined the probability of occurrence of oscillations and their frequency for 12 different orientations of the drifting gratings (steps of 30°) at 71 recording sites (Fig. 3). Oscillation probability was significantly higher for responses to preferred than to nonpreferred orientations (p < 0.001, χ2 test). For optimally oriented gratings, oscillations were in the low-frequency range (mean, 35 ± 13 Hz), whereas they distributed around the higher frequencies, characteristic of subcortical responses, for gratings orthogonal to the optimal orientation (mean, 66 ± 36 Hz; p < 0.001, ANOVA and Scheffé’s post hoc test). The variance of oscillation frequencies was smaller by a factor of 2 in responses to optimally oriented gratings than in responses to other orientations.
Fig. 3.
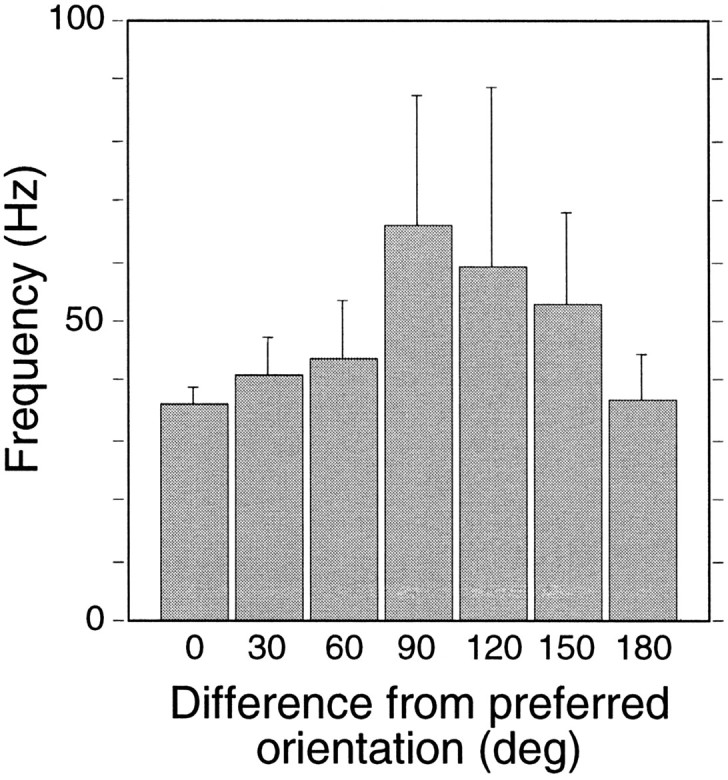
Dependence of oscillation frequency of cortical responses on stimulus orientation. Means of oscillation frequency were plotted as a function of the difference between stimulus orientation and the cells’ preferred orientation (0 and 180° refer to the preferred orientation but opposite directions; for all other orientation differences, the two opposite directions of motion were pooled together because they yielded similar results). Error bars represent 95% confidence intervals. Oscillation frequency is higher when the stimulus does not match the preferred orientation; the effect reaches significance for offsets of 60 and 90° (p < 0.001, ANOVA, Scheffé’s post hoc test).
Temporal dynamics of oscillatory activity
The sliding window analysis revealed that the oscillations in two frequency ranges follow different time courses in both cortical and subcortical responses. The low-frequency oscillations (30–60 Hz) that occur in the cortex with dynamic stimuli typically increased in strength during the response, whereas the high-frequency (60–120 Hz) oscillations evoked by the same moving stimulus in the retina and the LGN tended to be transient and to decay within 1 sec or less (Fig.4A, left panels). Occasionally, moving gratings evoke not only low-frequency (30–60 Hz) but also high-frequency (60–120 Hz) oscillations in the cortex. In this case, these high-frequency oscillations develop shortly after stimulus onset and decay rapidly, giving way to the more slowly developing 30–60 Hz oscillations. When static stimuli were applied, both cortical and subcortical responses exhibited only high-frequency oscillations that were transient and decayed more rapidly in the cortical than in the subcortical responses (Fig. 4A, right panels).
Fig. 4.
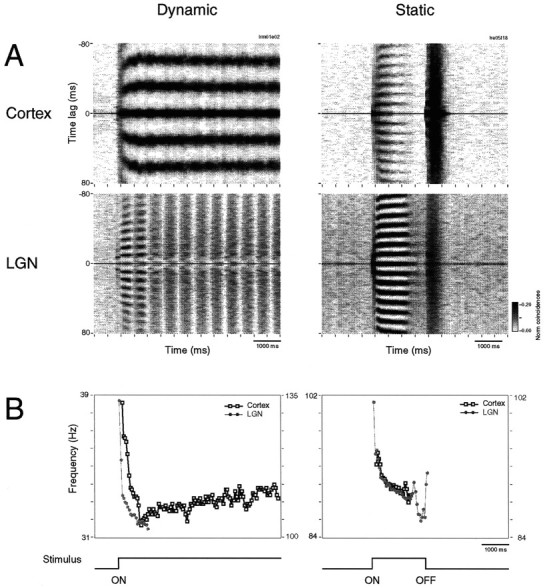
Oscillatory patterning of cortical and geniculate oscillations as a function of dynamic and static stimulation conditions. Simultaneous multi-unit recordings were obtained from left A17 and left LGN (lamina A1, dynamic condition) and from left A18 and right LGN (lamina A1, static condition). A, Sliding window autocorrelation functions computed for the two stimulus conditions (left panels, Dynamic; right panels, Static). Drifting gratings induce strong 30–60 Hz oscillations in the cortex that persist during the entire response (top left panel), and high-frequency oscillations in the LGN are limited to the initial phase of the response (bottom left panel). The flashed light stimulus induces high-frequency oscillatory responses of similar frequency in both the cortex and the LGN (top and bottom right panels), oscillatory responses being stronger for LGN than for cortical neurons. B, Absolute change of oscillation frequency after response onset (■, cortex; •, LGN). In theleft panel, two different Y-scales were used (cortical oscillation frequency, left; LGN,right). Time course of the stimulus is indicatedbelow the panels. Calibration, 1000 msec. Sliding correlation analysis window, 200 msec; step, 50 msec.
Another time-dependent change in oscillatory patterning is that oscillation frequency decreases during the course of the responses, whereby the decrease in frequency is steepest immediately after response onset (Fig. 4B). This trend was apparent for responses to both static and dynamic stimuli, for oscillations in both frequency ranges, and was significant for all recordings (p < 0.0001, Wilcoxon test).
To obtain a quantitative measure for the dynamic changes of the oscillatory patterning of responses, we compared averaged autocorrelation functions computed from two 2000 msec windows, one placed over the initial phase and the other over the middle phase of the responses to drifting gratings. For cortical cells, oscillation probability was the same in the two windows, but there was a significant trend for oscillations to be stronger, as assessed from MAS values, in the late-response phase than in the early-response phase (p < 0.001, Wilcoxon test). Subcortical responses, by contrast, were more likely to be oscillatory in the early than in the late phase of the responses (p < 0.001, χ2 test), and accordingly, the strength of the oscillation was also consistently higher during the early phase of the responses (p < 0.001, Wilcoxon test) (Fig.5).
Fig. 5.

Changes of oscillation probability and strength in responses to drifting gratings. A, The modulation amplitude of the first satellite peak (MAS) is plotted for average autocorrelation functions computed from 2000 msec windows placed over the onset (abscissa) and the late (ordinate) phase of the responses. ○, LGN; •, retina. Cases in which oscillations occurred only in the early or the late response epoch are aligned along thex- and y-axes, respectively. Notice that retinal and thalamic oscillations occur preferentially at response onset, because more cases are found below the diagonal or over thex-axis. B, Same analysis for cortical neurons. ○, A17; •, A18. Cortical cells tend to increase oscillatory modulation over time: most points are located above the diagonal.
Synchronous oscillations within and between the cortex and the LGN
Responses to both static and moving stimuli could be synchronized between thalamic and cortical (A17 and A18) neurons with a precision in the millisecond range. Synchronization occurred between cells with both overlapping and nonoverlapping receptive fields and with equal likelihood for LGN cells in laminae A, A1, or C. Figure6 shows examples of oscillatory responses to the onset and offset of static stimuli recorded simultaneously from A18 and the LGN. The cross-correlograms indicate that the responses were synchronized, and the shift predictors show that synchronization was not attributable to stimulus locking but to neuronal interactions. Oscillation frequency was higher for the ON responses than for the OFF responses (∼90 vs 50 Hz), and phase shifts were 1.7 and 2.6 msec, respectively.
Fig. 6.

Synchronization between the LGN and the cortex of oscillatory responses evoked by the onset and offset of static stimuli.A, Responses to onset recorded simultaneously from left A18 and lamina A1 of the left LGN. Orientation tuning curves for cortical and thalamic recording sites are shown next to the panels. The onset of flashed stimulus-evoked oscillatory responses was at 93 Hz in the LGN and 87 Hz in A18 (autocorrelation functions, left panels). Response synchronization occurs at 91 Hz with a phase shift (ϕ) of 1.7 msec (top right panel). The shift predictor is flat, indicating that the correlation was not time-locked to the stimulus (bottom right panel).B, Simultaneous recordings of OFF responses from left A18 and lamina A of the left LGN. The offset of a light stimulus evokes strong oscillatory responses at 49 Hz in both the LGN and the cortex with a phase shift of 2.6 msec. Note that the shift predictor shows no significant modulation.
Figure 7 shows two examples of thalamocortical synchronization for responses to drifting gratings. In the first example, thalamic and cortical cells had nonoverlapping RFs and were activated with a grating whose orientation matched the cortical cells’ preference. The responses recorded from A17 exhibited a strong oscillatory modulation at 34 Hz, and those of the LGN neurons exhibited a weak modulation at 106 Hz. Despite these widely disparate oscillation frequencies, the cross-correlogram shows a significant modulation in the frequency range of the cortical oscillation (frequency, 33 Hz; phase shift, 3.4 msec). In the second example, thalamic and cortical cells had partially overlapping RFs, and the cortical recording was from area 18. Here, the grating had been rotated by 135° off the cells’ preferred orientation. In this case, both LGN and cortical cells oscillated at similarly high frequencies (∼102 Hz) and synchronized with virtually zero phase shift (0.1 msec).
Fig. 7.

Synchronization between the LGN and the cortex of oscillatory responses evoked by dynamic stimuli. Conventions are the same as in Figure 6. A, Simultaneously recorded responses from left A17 and lamina A of the left LGN. A moving grating matching the tuning of the cortical cell (arrow in tuning curve) evoked oscillatory responses in A17 at 34 Hz (autocorrelation functions, left panels). Geniculate responses were weakly modulated at 106 Hz. Note the weak but significant response synchronization at the cortical frequency with a phase shift of 3.4 msec (top right panel). The shift predictor was not significantly modulated (bottom right panel). B, Simultaneous recordings from left A18 and lamina A of the left LGN. A drifting grating suboptimal for the tuning of the cortical neurons evoked strong oscillatory responses of similar frequency in the LGN and the cortex, and strong synchronization with a phase shift of 0.1 msec. Note that response synchronization was not time-locked to stimulus onset.
To determine to what extent thalamic oscillations prime cortical synchronization, we searched for relations between intracortical synchronization and synchronous oscillations in the LGN. In the example given in Figure 8, two pairs of simultaneous recordings were obtained from A17 and the LGN (ipsilateral lamina A1). Drifting gratings evoked oscillatory responses at both cortical recording sites that were tightly synchronized, as indicated by the pronounced modulation in the averaged cross-correlogram. Oscillation frequency was 33 Hz, and the phase shift was 0.8 msec. The sliding window analysis revealed that synchronization was maintained throughout the responses, without any sign of decay. The responses at the two recording sites in the LGN were also synchronized but oscillated at a much higher frequency, and these synchronous oscillations were confined to the beginning of the response (frequency, 106 Hz; phase shift, 0.0 msec). The cross-correlograms computed between the LGN and A17 showed no significant modulation for any of the four combinations of recording sites (only one pair combination is shown in Fig. 8), indicating that the sustained correlation in the cortex was independent of the temporal patterning of afferent LGN activity.
Fig. 8.
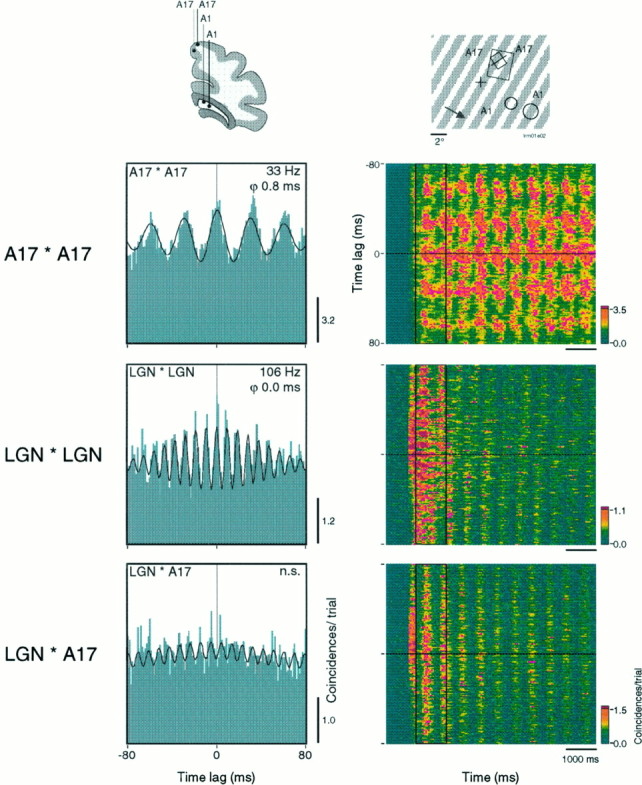
Relation between corticocortical and intrathalamic synchronization. Responses were recorded simultaneously from four separate sites, two in the left A17 and two in the left LGN lamina A1 (top left inset). Drifting gratings with an orientation intermediate to the optimal orientation of the cortical neurons (top right inset) induce strong and stable corticocortical synchronization at a frequency of 33 Hz and a phase shift of 0.8 msec (cross-correlation function, top left panel). The sliding window cross-correlation (analysis window, 250 msec; step, 50 msec) shows that synchronous oscillations do not decay over time (top right panel). In contrast, intrageniculate synchronization occurs only during the initial response epoch (middle panels). There is no significant correlation between the responses of cortical and LGN neurons (bottom panels), indicating that cortical synchronization is independent of oscillatory LGN input. Average cross-correlation functions were computed from the 1000 msec window indicated in the right panels.
Responses recorded from different cortical sites usually synchronized at low oscillation frequencies (mean 32 ± 8 Hz) when evoked by moving stimuli, and at high frequencies (mean 60 ± 14 Hz) when induced by flashed stimuli (p < 0.001, ANOVA). By contrast, responses recorded from different sites in the LGN synchronized at high oscillation frequencies, regardless of the type of stimulus (84 ± 12.6 Hz for stationary, and 98 ± 12.4 Hz for dynamic stimuli). In agreement with the data from autocorrelation analysis, this suggests that moving stimuli activate intracortical synchronizing mechanisms more readily than static stimuli, and that cortical synchronizing mechanisms operate at lower frequencies than the subcortical mechanism. With moving stimuli, cortical responses tend to synchronize in the low-frequency (30–60 Hz) range, and this synchronization is independent of the oscillatory patterning of thalamic responses that occurs in a higher frequency range. With stationary stimuli, both cortical and subcortical neurons engage in the high-frequency oscillations, whereby cortical cells appear to become synchronized to the subcortical input. This suggests the existence of two synchronizing mechanisms: a subcortical mechanism that is activated by both stationary and moving stimuli and operates in the high-frequency range (60–120 Hz), and a cortical mechanism that is activated best by moving stimuli and operates in the low-frequency range (30–60 Hz). Accordingly, the incidence of synchronization between the LGN and the cortex was lower for responses to moving than for responses to static stimuli. The interpretation of independent subcortical and cortical synchronizing mechanisms is supported further by the different time course of synchronization in the 60–120 and 30–60 Hz ranges. Cross-correlograms obtained from early and late phases of cortical responses to moving gratings showed that the probability of occurrence of synchronization in the 30–60 Hz range remained the same throughout the response (p = 0.7, χ2 test) and that the strength of synchronization increased over time (p < 0.05, Wilcoxon). In the LGN, by contrast, synchronization among responses to moving stimuli occurred in the 60–120 Hz range and tended to be limited to the onset of the responses (p < 0.001, χ2 test).
Evidence for feedforward synchronization
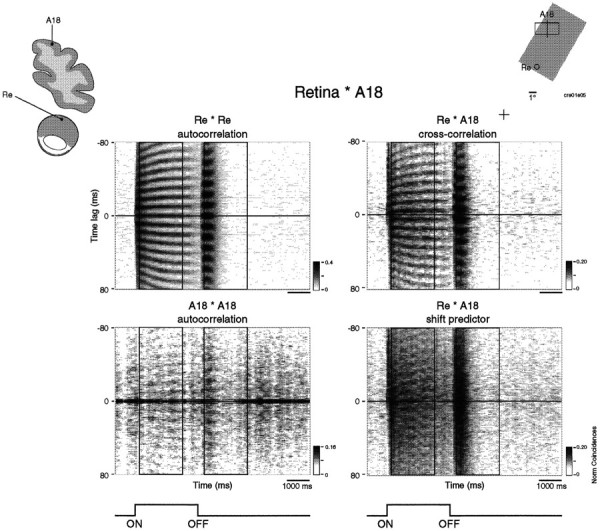
To determine to what extent the synchronization between thalamic and cortical responses was attributable to feedforward or feedback mechanisms, we also recorded from retinal ganglion cells in four additional experiments. Because in the cat the retina receives no centrifugal projections, retinocortical synchronization can only be caused by feedforward synchronization. Figure9 shows an example of synchronous oscillations that propagate along the retinothalamocortical pathway. Simultaneous recordings were obtained from the nasal retina of the left eye and lamina A of the right LGN, which receives input from the nasal retina of this eye. In addition, we recorded from left A18, which receives its retinal input from the temporal retina of the left eye and the nasal retina of the right eye. The cortical neurons were binocular and had a clear orientation tuning, with receptive fields partially overlapping those of the recorded LGN cells. A stationary stimulus evoked strong oscillatory responses at 91 Hz at all recording sites (Fig. 9A), and these responses were correlated across all pair combinations (Fig. 9B). This is direct evidence for feedforward synchronization and faithful transmission of the oscillatory patterning of retinal responses to cortical neurons. The precise correlation between the responses in the LGN and contralateral cortex can be explained by intraretinal synchronization. As described in a previous study (Neuenschwander and Singer, 1996), responses of retinal ganglion cells can synchronize over large distances if driven by a continuous stimulus, and these synchronous discharges are reliably transmitted by the LGN. As expected from a pure feedforward synchronization, there was a large positive phase shift between retina and cortex of 5.2 msec, whereby the retina was leading. It is important to emphasize that this feedforward synchronization is not caused by stimulus locking, because the shift predictor controls showed only residual modulation (Fig. 9C). The synchronized volleys that are generated by horizontal interactions within the retina and are only loosely related to stimulus onset are what is transmitted and give rise to the robust synchronization.
Fig. 9.

Synchronization between the retina, the LGN, and the cortex of oscillatory responses evoked by a stationary stimulus (top right inset). Responses were recorded simultaneously from the left retina (LRe), right LGN lamina A (RA), and left A18 (LA18,top left inset). A, Autocorrelation functions. The onset of the stimulus evokes strong oscillatory patterning at all sites, at a frequency of 91 Hz. B, Cross-correlation functions. Responses are correlated between all recording pairs. C, The shift predictor controls indicate that this feedforward synchronization is not caused by stimulus locking. The asymmetrical residual modulations are caused by random changes in phase within and across trials of stimulus presentation, and tend to average out, increasing the number of trials.
In the example of Figure 9, the geniculocortical interactions were particularly strong (MA, 2.98) and had the smallest phase shift of all examined pairs (1.1 msec). This probably reflects the fact that LGN and cortical receptive fields were overlapping in this case. In general, correlation strength was weaker for pairs with nonoverlapping receptive fields (p < 0.05, ANOVA). The fact that correlations also occurred between neurons with nonoverlapping receptive fields indicates that synchronization has spread tangentially within the retina, the LGN, or the cortex.
As was the case for thalamocortical synchronization, correlations between the retina and the cortex were also more frequent for static than for moving stimuli. Figure 10shows an example where retinocortical synchronization occurred in MUA responses to both the onset and offset of a stationary light bar. Stimulus onset induced strong oscillations at 102 Hz in the retina. The cortical responses showed only a weak oscillatory modulation at the same frequency (Fig. 10A). Although this modulation did not reach our significance criteria, the cross-correlation function exhibited a clear and significant modulation. Similar relations were observed for the responses to stimulus offset, except that oscillation frequencies were lower (86 Hz) (Fig. 10B). Phase shifts in both cases were in the range of 4 msec, suggesting that phase shifts depend on receptive field positions rather than on response polarity. The sliding window analysis in Figure11 shows that the retinocortical synchronization follows a time course similar to that of the thalamocortical correlations.
Fig. 10.

Synchronized oscillatory responses in the retina and the cortex after the onset and offset of a static stimulus. Multi-unit activity was recorded from the left retina (LRe) and left A18 (LA18, top left inset). A, The onset of the stimulus (top right inset) evokes oscillatory responses at 102 Hz in the retina, but only weakly oscillatory responses in A18 (autocorrelation functions, left panels). Still, responses are synchronized with a phase shift of 4.3 msec (cross-correlation function, top right panel). As indicated by the shift predictor (bottom right panel), this synchronization is not caused by stimulus locking. B, Stimulus offset evokes oscillatory responses at both sites at lower frequency (around 86 Hz, autocorrelation functions, left panels). Retinal and cortical responses are synchronized with a phase shift of 4.7 msec (cross-correlation function, top right panel). The shift predictor (bottom right panel) excludes stimulus locking.
Fig. 11.
Sliding window analysis of retinocortical synchronization (window 250 msec, step 50 msec). Recordings are the same as in Figure 10. Both stimulus onset and offset evoke strong and stable oscillatory responses in the retina at different oscillation frequencies (top left panel). Cortical responses show similar but much weaker oscillatory modulation (bottom left panel). The sliding window cross-correlation analysis shows strong and sustained synchronization of ON responses and strong but more transient synchronization of OFF responses (top right panel). Note the lack of correlations in the shift predictor (bottom right panel). The windows used for computing the correlograms in Figure 9 are depicted by thevertical lines in the two-dimensional plots.
Table 1 summarizes the incidence of synchronous oscillations for all recording pairs obtained in this study and shows that synchronization probability is twice as high for LGN–A18 as for LGN–A17 pairs. A similar trend was observed for the retina–A18 and retina–A17 correlations.
Table 1.
Relative incidence of synchronous oscillations for areas A17 and A18, lateral geniculate (LGN), and retina
| n | Total | % | |
|---|---|---|---|
| A17–A17 | 19 | 37 | 51.4 |
| A17–A18 | 10 | 22 | 45.4 |
| A18–A18 | 10 | 15 | 60.0 |
| LGN–A17 | 57 | 232 | 24.0 |
| LGN–A18 | 52 | 101 | 51.0 |
| Retina–A17 | 3 | 17 | 17.0 |
| Retina–A18 | 11 | 34 | 32.3 |
| Retina–LGN | 58 | 125 | 67.3 |
| LGN–LGN | 149 | 307 | 48.5 |
| Retina–retina | 33 | 49 | 67.3 |
Frequency and phase distributions of synchronous responses
The distribution of oscillation frequencies is shown in Figure12 for all recording pairs exhibiting synchronized oscillatory responses. Corticocortical synchronization usually occurred at 30–50 Hz, although not exclusively. In a few A17–A18 and A18–A18 pairs, correlated activity was also seen at frequencies above 60 Hz. Intraretinal, intrageniculate, and retinogeniculate synchronization occurred mostly within the frequency range of 60–120 Hz. Only geniculocortical interactions covered both ranges: from 30 to 120 Hz. Retinocortical correlations, by contrast, occurred only in the high-frequency range (60–120 Hz), as expected from a simple feedforward synchronization by retinal oscillations. For LGN–A18 pairs, the median oscillation frequency of modulated cross-correlograms was 90 Hz (50th percentile), whereas for LGN–A17 pairs this value was below 50 Hz, suggesting that cells in A18 are more likely to follow the high-frequency oscillations of the LGN than cells in A17. This was true for responses to both moving and stationary stimuli, but the effect was stronger for the latter condition.
Fig. 12.

Box plot of the distribution of oscillation frequencies for all cases of synchronous oscillations. Thehorizontal bars depict the median (50th percentile), the boundaries of the boxes depict the 25th percentile, and the error bars depict the 10th percentile. Note that thalamocortical correlations span the largest frequency range.
For all pairs of recording sites exhibiting synchronous oscillations, we examined whether cells at both recording sites oscillated (as seen in the autocorrelograms), and if so, whether the oscillation frequency differed (Fig. 13). For retinogeniculate pairs, cells tended to oscillate at both sites and at the same frequency, as indicated by the large cluster along the diagonal in the scatter plot of Figure 13A. There were only a few cases where responses exhibited significant oscillatory patterning at only one of the two sites. The scatter plot for geniculocortical pairs shows three major clusters. Two are along the diagonal, indicating that one group of pairs oscillated at low frequencies between 20 and 60 Hz, and the other oscillated at frequencies between 70 and 120 Hz. The third cluster corresponds to pairs where LGN cells oscillated in the 60–120 Hz range and cortical neurons oscillated in the 30–60 Hz frequency range. Synchronization between thalamus and cortex can therefore occur in both the high- and low-frequency ranges characteristic of subcortical and cortical synchronization mechanisms, respectively. In addition, synchronization may arise between cells oscillating at different nonharmonic frequencies (as in the example of Fig. 7A) or when responses are oscillatory at only one of the sites. In the latter case, oscillation frequencies were always high for the LGN and low for the cortex (clusters over the x- and y-axes) (Fig.13B). Synchronous oscillations between the retina and the cortex usually occurred only in the 60–120 Hz range (Fig.13C). In this case, cortical cells either oscillated at the same frequency as retinal ganglion cells or did not oscillate at all (notice the distinct clusters on the x-axes in both plots of Fig. 13C).
Fig. 13.

Comparison of oscillation frequency at the two sites of recording pairs exhibiting synchronous oscillations.A, Retina–LGN. B, LGN–cortex.Top plot, LGN–A17; bottom plot, LGN–A18. C, Retina–cortex. Top plot, Retina–A17; bottom plot, retina–A18. Oscillation frequencies at the compared sites are plotted on the x- and y-axis, respectively.
Analysis of phase shifts indicates that synchronization in the 60–120 Hz frequency range is mainly of the feedforward type and frequent for responses to stationary stimuli, whereas a contribution of feedback mechanisms is prevalent in thalamocortical interactions when synchronization occurs on the basis of 30–60 Hz oscillations. In the majority of significant thalamocortical correlations, phase shifts were positive, indicating that the LGN was leading (Fig.14). This was particularly evident for the interactions between the LGN and A18, where synchronization occurred mainly in the 60–120 Hz frequency range. By contrast, for those thalamocortical pairs that synchronized in the 30–60 Hz range and involved mainly A17, phase shifts were close to zero or even negative. This suggests that a corticothalamic feedback mechanism contributes to corticothalamic synchronization when cortical synchronization mechanisms are strongly activated. This interpretation is supported by the finding that the phase angles of thalamocortical correlations were smallest when synchronization occurred on the basis of low-frequency synchronization and when responses were evoked by moving rather than by stationary stimuli (ANOVA; p < 0.05 for LGN–A17 pairs, p = 0.3 for LGN–A18 pairs). Retinocortical and retinothalamic correlograms always exhibited small positive phase shifts of a few milliseconds (retina–A17, mean 4.54 msec; retina–A18, mean 3.93 msec; retina–LGN, 2.60 msec), as expected for a feedforward transmission of retinal oscillatory patterns. For cells recorded at different sites of the same processing level, absolute phase shifts were near zero (A17–A17, mean 2.0 msec; A18–A18, 2.4 msec; LGN–LGN, 1.27 msec; retina–retina, 1.0 msec).
Fig. 14.

Box plot of the phase shift distribution for all recording pairs exhibiting significant synchronization. Conventions are the same as in Figure 12. Both oscillatory and nonoscillatory correlograms are included. Positive phase shifts indicate phase advancement of the first site in a recording pair.
DISCUSSION
Two oscillation frequencies, two synchronizing mechanisms
This study provides direct evidence for coexisting oscillatory synchronizing processes with distinct frequency ranges in the retina, the lateral geniculate nucleus, and the visual cortex. Oscillatory responses were precisely synchronized across neurons of the same processing level, confirming the results of previous studies [Doty and Kimura, 1963; Laufer and Verzeano, 1967; Arnett, 1975; Gray et al., 1989; Ito et al., 1994; Neuenschwander and Singer, 1996(for review, see Singer and Gray, 1995)]. In agreement with the present results, these studies have shown that oscillation frequencies vary over a wide range at different processing levels, but whether the differences in frequencies result from distinct mechanisms or represent a continuum arising from the same underlying process remains a controversial issue (Ghose and Freeman, 1992, 1997; Eckhorn et al., 1993). In the retina and the LGN, oscillatory patterns occur in the range of 60–120 Hz, with a slightly lower average frequency for responses to the offset than for responses to the onset of light stimuli. In the cortex, by contrast, we uncovered two distinct patterns of synchronized oscillatory activity: first, 60–120 Hz oscillations that resembled in frequency and time course the transient subcortical oscillations, and second, low-frequency oscillatory responses in the range of 30–60 Hz that shared all the features of the previously described gamma oscillations of presumed cortical origin (Singer and Gray, 1995).
Feedforward synchronization
Several observations indicate that synchronization in the 60–120 Hz range is generated by retinal mechanisms and then causes feedforward synchronization of cell groups in the LGN and the visual cortex, whereas synchronization at 30–60 Hz is caused by intracortical mechanisms that can synchronize geniculate neurons to this cortical rhythm via corticothalamic projections. Direct evidence for a retinal entrainment of the high-frequency cortical synchronization is provided by the retinocortical correlations. Whenever retinocortical correlograms showed a significant modulation, synchronization occurred in the 60–120 Hz range and with phase lags compatible with feedforward synchronization. This implies that the synchronized retinal oscillations are reliably transmitted along the retinocortical transmission chain and indicates that the summed latency jitter of synaptic transmission must be substantially shorter than the cycle time of the oscillations at both retinogeniculate and geniculocortical synapses. Thus, at least for synchronized retinal input, the time constants for synaptic integration must be substantially shorter than 10 msec. This has two important implications. First, it permits transmission of information about the precise timing of stimuli, which is essential for the segmentation of dynamic patterns (Leonards et al., 1996). Second, it implies that thalamic and cortical neurons can operate with integration times that are short enough to permit the neurons to act as coincidence detectors. Thus, the present results support the hypothesis that cortical cells may be sensitive to variations in both the rate and the synchronicity of synaptic input (for review, see Singer et al., 1997).
In analogy to transmission of signals in synfire chains (Abeles, 1991), the synchronization of retinal discharges might contribute substantially to preserve precise timing along the retinocortical transmission chain. Analysis of intracellular responses of LGN cells to electrical stimulation of the optic chiasm has shown that synchronous EPSPs summate very effectively and evoke spikes in the postsynaptic neuron that are precisely contingent with the arrival of the compound EPSP and show minimal temporal jitter, in contrast to asynchronously arriving EPSPs (Singer, 1973a,b; Singer and Bedworth, 1973). These observations imply that LGN cells must receive input from several ganglion cells, and the same relation must hold for LGN and cortical cells. This is indeed the case for both retinogeniculate (Cleland et al., 1971a,b; Singer et al., 1972; Singer and Bedworth, 1973;Eysel and Pape, 1987) and thalamocortical connections (Ferster and Lindström, 1983; Tanaka, 1983, 1985; Reid and Alonso, 1995).
Our analysis revealed that the entrainment and synchronization of cortical responses by correlated retinal oscillatory activity was considerably more pronounced in area 18 than in area 17. We attribute this to the fact that responses in area 18 are mediated exclusively by retinal afferents of the Y-type, whereas those in area 17 are dominated by input from X-cells (Hoffmann and Stone, 1971; Tretter et al., 1975,Mitzdorf and Singer, 1978; Pasternak et al., 1989; Ferster, 1990a,b). Information about the precise temporal structure of stimuli is transmitted more reliably by the Y- than by the X-pathway, and this difference is preserved along the two retinothalamocortical processing streams (Hochstein and Shapley, 1976; Lemkuhle et al., 1980). In agreement with the hypothesis that synchronization enhances temporal precision, the enhanced temporal reliability of the Y-system could be attributable to the fact that conduction velocities in the Y-pathway are more homogeneous than those in the X-pathway (Hoffmann and Stone, 1971; Cleland et al., 1976; Mitzdorf and Singer, 1977, 1978; So and Shapley, 1979). Thus, the synchronicity among EPSPs arriving from simultaneously discharging ganglion cells is better in Y- than in X-pathways.
It has been postulated that the precise temporal relations among the discharges of spatially distributed ganglion cells may relay information about stimulus continuity (Neuenschwander and Singer, 1996). The present data indicate that these temporal relations are transmitted with high precision to the visual cortex and can therefore influence subsequent synchronization of cortical neurons. An attractive aspect of such a grouping by feedforward synchronization is that it is extremely fast, the relevant information being encoded already in the very early response component.
Intracortical synchronization
The notion that synchronization of cortical responses at 30–60 Hz is caused by intrinsic cortical mechanisms and not by feedforward propagation of synchronous events is suggested by the following observations. First, the frequency distribution of cortical oscillations was bimodal, suggesting two different mechanisms. Second, simultaneous recordings from all three levels of processing indicated clearly that cortical neurons could engage in 30–60 Hz synchronization that was uncorrelated to the simultaneously occurring 60–120 Hz synchronization at the retinal and thalamic levels. Third, when responses were evoked by moving gratings, 30–60 Hz synchronization persisted or appeared de novo at response epochs at which the 60–120 Hz synchronization phenomenon had already faded in the retina and the LGN. Fourth, in the cases where cross-correlograms between thalamic and cortical neurons showed synchronization in the 30–60 Hz frequency range, phase shifts were negative, indicating that the synchronizing mechanism is located in the cortex and locks LGN neurons to the cortical rhythm via corticofugal projections.
Which of the two synchronizing mechanisms dominated the synchronization of cortical neurons depended critically on stimulus conditions. The intracortical synchronizing mechanism dominated whenever stimuli were used that generated sustained cortical responses, as is the case for drifting gratings matching the preferences of the simultaneously recorded cortical neurons.
The retinal mechanism dominated for responses to the onset and offset of stationary stimuli or to moving gratings whose orientation and direction of motion was suboptimal for the activation of the cortical neurons. Ghose and Freeman (1992, 1997) have proposed a model, based on autocorrelation data, in which cortical oscillations are entrained by oscillatory patterning arising from the retina. These authors assume that oscillatory activity in the cortex (below 60 Hz) reflects loose coupling of LGN oscillators and is independent of visual stimulation. Our cross-correlation data agree only in as much as they indicate that feedforward synchronization can actually occur. They disagree with respect to the proposal that the previously described synchronization phenomena in the “40 Hz” range might be of subcortical origin as well. The feedforward synchronization is associated with high-frequency oscillations (60–120 Hz), of retinal origin, transient, and induced mainly by the onset and offset of stimuli, whereas cortical synchronization occurs in a lower frequency range (30–60 Hz), is more sustained, occurs preferentially in response to moving stimuli, and exhibits a more complex dependence on stimulus features than subcortical synchronization.
Because corticofugal projections contribute to the synchronization of geniculate neurons (Sillito et al., 1994), we had expected that periods of strong intracortical synchronization would lead to frequent intrathalamic correlations in the 30–60 Hz range. However, corticofugal control of thalamic firing appeared only strong enough to entrain detectable synchronization between cortical and thalamic neurons but not among thalamic neurons. One reason could be that the grating stimuli used in this study also produced very strong feedforward synchronization of thalamic responses and that these effects could not be overridden by corticofugal influences, especially when the receptive fields were nonoverlapping. Steriade et al. (1996)observed thalamocortical correlations only for directly connected sites. However, this analysis was based on spontaneous field potential activity, and it is unclear to what extent responses also reflected synaptic currents caused by the reciprocal connections. Another possibility is that in our experiments the intracortical synchronization was not sufficiently precise and coherent to induce intrageniculate synchronization because of anesthesia. Synchronization and oscillatory modulation of cortical responses increase drastically during states of brain activation (Steriade, 1968b; Munk et al., 1996).
Functional implications of coexisting synchronizing mechanisms
Retinal synchronizing mechanisms could serve to improve the temporal precision with which responses to temporally structured stimuli are transmitted to the visual cortex. Psychophysical studies indicate that small temporal differences between the onset of identical texture elements can be used for perceptual grouping and implies that information about the precise timing of stimuli is reliably transmitted to the visual cortex and that simultaneously arriving signals are perceptually bound more readily than asynchronous signals (Leonards et al., 1996). The Y-system in the cat and the magnocellular system in primates are both more suitable for transmission of precisely timed signals than the respective X-system in the cat and the parvocellular system in primates (Blake and Camisa, 1977; Maunsell, 1992; Lomber et al., 1996). The entrainment of cortical synchronization by precisely synchronized retinal volleys was more pronounced in area 18 than in area 17, which suggests that information about precise timing is conveyed by feedforward synchronization in processing streams operating with high temporal resolution.
Intracortical synchronizing mechanisms were activated preferentially with moving stimuli for which no precise onset and offset is defined, suggesting that they could be used to group responses according to features other than the temporal structure of the stimulus. Previous studies have indicated that cortical synchronization reflects perceptual grouping criteria such as continuity, proximity, colinearity, and common fate. Synchronization probability was higher for close stimuli, with similar orientation and velocity vectors, than for stimuli that were far apart and had different orientations and velocity vectors (Gray et al., 1989; Engel et al., 1990; Freiwald et al., 1995; Kreiter and Singer, 1996). Thus, the retinal mechanism could influence the synchronization probability of cortical neurons as a function of the external timing and perhaps also the spatial continuity of stimuli, whereas the intracortical synchronization mechanism could serve to group responses according to features that are represented for the first time at the cortical level.
Footnotes
This research was sponsored by the Max-Planck-Gesellschaft. M.C.-B. was supported by a doctoral fellowship from Fundação Gulbenkian and Programa Praxis XXI, Lisbon. We thank Johanna Klon-Lipok for technical support and Suzana Herculano for help in some of the experimental sessions. Thanks to Michael Brecht for suggestions and discussions, and to P. Fries for helping us with the visual stimulus.
Correspondence should be addressed to Dr. W. Singer, Max-Planck-Institut für Hirnforschung, Deutschordenstraβe 46, 60528 Frankfurt am Main, Germany.
REFERENCES
- 1.Abeles M. Corticonics. Neural circuits of the cerebral cortex. Cambridge UP; Cambridge: 1991. [Google Scholar]
- 2.Alonso J-M, Usrey WM, Reid RC. Precisely correlated firing in cells of the lateral geniculate nucleus. Nature. 1996;383:815–819. doi: 10.1038/383815a0. [DOI] [PubMed] [Google Scholar]
- 3.Arnett DW. Correlation analysis of units recorded in the cat dorsal lateral geniculate nucleus. Exp Brain Res. 1975;24:111–130. doi: 10.1007/BF00234058. [DOI] [PubMed] [Google Scholar]
- 4.Blake R, Camisa R. Temporal aspects of spatial vision in cats. Exp Brain Res. 1977;28:325–333. doi: 10.1007/BF00235714. [DOI] [PubMed] [Google Scholar]
- 5.Cleland BG, Dubin MW, Levick WR. Simultaneous recording of input and output of lateral geniculate neurons. Nature. 1971a;231:191–192. doi: 10.1038/newbio231191a0. [DOI] [PubMed] [Google Scholar]
- 6.Cleland BG, Dubin MW, Levick WR. Sustained and transient neurons in the cat’s retina and lateral geniculate nucleus. J Physiol (Lond) 1971b;217:473–496. doi: 10.1113/jphysiol.1971.sp009581. [DOI] [PMC free article] [PubMed] [Google Scholar]
- 7.Cleland BG, Levick WR, Morstyn R, Wagner HG. Lateral geniculate relay of slowly conducting retinal afferents to cat visual cortex. J Physiol (Lond) 1976;255:299–320. doi: 10.1113/jphysiol.1976.sp011281. [DOI] [PMC free article] [PubMed] [Google Scholar]
- 8.Doty RW, Kimura D. Oscillatory potentials in the visual system of cats and monkeys. J Physiol (Lond) 1963;168:205–218. doi: 10.1113/jphysiol.1963.sp007187. [DOI] [PMC free article] [PubMed] [Google Scholar]
- 9.Eckhorn R, Frien A, Bauer R, Woelbern T, Kehr H. High frequency (60–90 Hz) oscillations in primate visual cortex of awake monkey. NeuroReport. 1993;4:243–246. doi: 10.1097/00001756-199303000-00004. [DOI] [PubMed] [Google Scholar]
- 10.Engel AK, König P, Gray CM, Singer W. Stimulus dependent neuronal oscillations in cat visual cortex: intercolumnar interaction as determined by cross-correlation analysis. Eur J Neurosci. 1990;2:588–606. doi: 10.1111/j.1460-9568.1990.tb00449.x. [DOI] [PubMed] [Google Scholar]
- 11.Eysel UT, Pape HC. Lateral excitation in the cat lateral geniculate nucleus. Exp Brain Res. 1987;67:291–298. doi: 10.1007/BF00248550. [DOI] [PubMed] [Google Scholar]
- 12.Ferster D. X- and Y-mediated synaptic potentials in neurons of areas 17 and 18 of cat visual cortex. Vis Neurosci. 1990a;4:115–133. doi: 10.1017/s0952523800002285. [DOI] [PubMed] [Google Scholar]
- 13.Ferster D. X- and Y-mediated current sources in neurons of areas 17 and 18 of cat visual cortex. Vis Neurosci. 1990b;4:135–145. doi: 10.1017/s0952523800002297. [DOI] [PubMed] [Google Scholar]
- 14.Ferster L, Lindström S. An intracellular analysis of geniculocortical connectivity in area 17 of the cat. J Physiol (Lond) 1983;342:181–215. doi: 10.1113/jphysiol.1983.sp014846. [DOI] [PMC free article] [PubMed] [Google Scholar]
- 15.Freiwald WA, Kreiter AK, Singer W. Stimulus-dependent intercolumnar synchronization of single unit responses in cat area 17. NeuroReport. 1995;6:2348–2352. doi: 10.1097/00001756-199511270-00018. [DOI] [PubMed] [Google Scholar]
- 16.Ghose GM, Freeman RD. Oscillatory discharge in the visual system: does it have a functional role? J Neurophysiol. 1992;68:1558–1574. doi: 10.1152/jn.1992.68.5.1558. [DOI] [PubMed] [Google Scholar]
- 17.Ghose GM, Freeman RD. Intracortical connections are not required for oscillatory activity in the visual cortex. Vis Neurosci. 1997;14:963–979. [PubMed] [Google Scholar]
- 18.Gray CM, König P, Engel AK, Singer W. Oscillatory responses in cat visual cortex exhibit inter-columnar synchronization which reflects global stimulus properties. Nature. 1989;338:334–337. doi: 10.1038/338334a0. [DOI] [PubMed] [Google Scholar]
- 19.Hochstein S, Shapley RM. Quantitative analysis of retinal ganglion cell classifications. J Physiol (Lond) 1976;262:237–264. doi: 10.1113/jphysiol.1976.sp011594. [DOI] [PMC free article] [PubMed] [Google Scholar]
- 20.Hoffmann K-P, Stone J. Conduction velocity of afferents to cat visual cortex: a correlation with cortical receptive field properties. Brain Res. 1971;32:460–466. doi: 10.1016/0006-8993(71)90340-4. [DOI] [PubMed] [Google Scholar]
- 21.Ito H, Gray C, Viana Di Prisco G. Can oscillatory activity in the LGN account for the occurrence of synchronous oscillations in the visual cortex? Soc Neurosci Abstr. 1994;20:61.7. [Google Scholar]
- 22.König P. A method for the quantification of synchrony and oscillatory properties of neuronal activity. J Neurosci Methods. 1994;54:31–37. doi: 10.1016/0165-0270(94)90157-0. [DOI] [PubMed] [Google Scholar]
- 23.Kreiter AK, Singer W. Stimulus-dependent synchronization of neuronal responses in the visual cortex of the awake macaque monkey. J Neurosci. 1996;16:2381–2396. doi: 10.1523/JNEUROSCI.16-07-02381.1996. [DOI] [PMC free article] [PubMed] [Google Scholar]
- 24.Laufer M, Verzeano M. Periodic activity in the visual system of the cat. Vision Res. 1967;7:215–229. doi: 10.1016/0042-6989(67)90086-7. [DOI] [PubMed] [Google Scholar]
- 25.Lemkuhle SK, Kratz E, Mangel SC, Sherman SM. Spatial and temporal sensitivity of X- and Y-cells in dorsal lateral geniculate nucleus of the cat. J Neurophysiol. 1980;43:520–541. doi: 10.1152/jn.1980.43.2.520. [DOI] [PubMed] [Google Scholar]
- 26.Leonards U, Singer W, Fahle M. The influence of temporal phase differences on texture segmentation. Vision Res. 1996;36:2689–2697. doi: 10.1016/0042-6989(96)86829-5. [DOI] [PubMed] [Google Scholar]
- 27.Lomber SG, Payne BR, Cornwell P, Long KD. Perceptual and cognitive visual functions of parietal and temporal cortices in the cat. Cereb Cortex. 1996;6:673–695. doi: 10.1093/cercor/6.5.673. [DOI] [PubMed] [Google Scholar]
- 28.Maunsell JHR. Functional visual streams. Curr Opin Neurobiol. 1992;2:506–510. doi: 10.1016/0959-4388(92)90188-q. [DOI] [PubMed] [Google Scholar]
- 29.Mitzdorf U, Singer W. Laminar segregation of afferents to the lateral geniculate nucleus of the cat: an analysis of current source density. J Neurophysiol. 1977;40:1227–1244. doi: 10.1152/jn.1977.40.6.1227. [DOI] [PubMed] [Google Scholar]
- 30.Mitzdorf U, Singer W. Prominent excitatory pathways in the cat visual cortex (A17 and A18): a current source density analysis of electrically evoked potentials. Exp Brain Res. 1978;33:371–394. doi: 10.1007/BF00235560. [DOI] [PubMed] [Google Scholar]
- 31.Munk MHJ, Roelfsema PR, König P, Engel AK, Singer W. Role of reticular activation in the modulation of intracortical synchronization. Science. 1996;272:271–274. doi: 10.1126/science.272.5259.271. [DOI] [PubMed] [Google Scholar]
- 32.Neuenschwander S, Singer W. Long-range synchronization of oscillatory light responses in the cat retina and lateral geniculate nucleus. Nature. 1996;379:728–733. doi: 10.1038/379728a0. [DOI] [PubMed] [Google Scholar]
- 33.Pasternak T, Horn K, Maunsell JHR. Lesions of area 18 in the cat abolish sensitivity to drifting, low spatial frequency targets. Invest Ophthal Vis Sci [Suppl] 1989;30:426. [Google Scholar]
- 34.Peichl L, Wässle H. Size, scatter and coverage of ganglion cell receptive field centres in the cat retina. J Physiol (Lond) 1979;291:117–141. doi: 10.1113/jphysiol.1979.sp012803. [DOI] [PMC free article] [PubMed] [Google Scholar]
- 35.Perkel DH, Gerstein GL, Moore GP. Neuronal spike trains and stochastic point process. II. Simultaneous spike trains. Biophys J. 1967;7:419–440. doi: 10.1016/S0006-3495(67)86597-4. [DOI] [PMC free article] [PubMed] [Google Scholar]
- 36.Press WH, Flannery BP, Teukolsky SA, Vetterling WT. Numerical recipes: the art of scientific computing. Cambridge UP; Cambridge: 1986. [Google Scholar]
- 37.Reid RC, Alonso JM. Specificity of monosynaptic connections from thalamus to visual cortex. Nature. 1995;378:281–284. doi: 10.1038/378281a0. [DOI] [PubMed] [Google Scholar]
- 38.Sillito AM, Jones HE, Gerstein GL, West DC. Feature-linked synchronization of thalamic relay cell firing induced by feedback from the visual cortex. Nature. 1994;369:479–482. doi: 10.1038/369479a0. [DOI] [PubMed] [Google Scholar]
- 39.Singer W. Brain stem stimulation and the hypothesis of presynaptic inhibition in cat lateral geniculate nucleus. Brain Res. 1973a;61:55–68. doi: 10.1016/0006-8993(73)90515-5. [DOI] [PubMed] [Google Scholar]
- 40.Singer W. The effect of mesencephalic reticular stimulation on intracellular potentials of cat lateral geniculate. Brain Res. 1973b;61:35–54. doi: 10.1016/0006-8993(73)90514-3. [DOI] [PubMed] [Google Scholar]
- 41.Singer W, Bedworth N. Inhibitory interaction between X and Y units in the cat lateral geniculate nucleus. Brain Res. 1973;49:291–307. doi: 10.1016/0006-8993(73)90424-1. [DOI] [PubMed] [Google Scholar]
- 42.Singer W, Gray C. Visual feature integration and the temporal correlation hypothesis. Annu Rev Neurosci. 1995;18:555–586. doi: 10.1146/annurev.ne.18.030195.003011. [DOI] [PubMed] [Google Scholar]
- 43.Singer W, Pöppel E, Creutzfeldt O. Inhibitory interaction in the cat’s lateral geniculate nucleus. Exp Brain Res. 1972;14:210–226. doi: 10.1007/BF00234800. [DOI] [PubMed] [Google Scholar]
- 44.Singer W, Engel AK, Kreiter AK, Munk MHJ, Neuenschwander S, Roefselma PR. Neuronal assemblies: necessity, signature and detectability. Trends Cognit Sci. 1997;1:252–261. doi: 10.1016/S1364-6613(97)01079-6. [DOI] [PubMed] [Google Scholar]
- 45.So YT, Shapley R. Spatial properties of X and Y cells in the lateral geniculate nucleus and conduction velocities of their inputs. Exp Brain Res. 1979;36:533–550. doi: 10.1007/BF00238521. [DOI] [PubMed] [Google Scholar]
- 46.Steriade M. The flash-evoked afterdischarge. Brain Res. 1968a;9:169–212. doi: 10.1016/0006-8993(68)90229-1. [DOI] [PubMed] [Google Scholar]
- 47.Steriade M. Reticular potentiation of cortical flash-evoked afterdischarge. Brain Res. 1968b;11:276–280. doi: 10.1016/0006-8993(68)90092-9. [DOI] [PubMed] [Google Scholar]
- 48.Steriade M, Contreras D, Amzica F, Timofeev I. Synchronization of fast (30–40 Hz) spontaneous oscillations in intrathalamic and thalamocortical networks. J Neurosci. 1996;16:2788–2808. doi: 10.1523/JNEUROSCI.16-08-02788.1996. [DOI] [PMC free article] [PubMed] [Google Scholar]
- 49.Tanaka K. Cross-correlation analysis of geniculostriate neuronal relationships in cats. J Neurophysiol. 1983;49:1303–1318. doi: 10.1152/jn.1983.49.6.1303. [DOI] [PubMed] [Google Scholar]
- 50.Tanaka K. Organization of geniculate inputs to visual cortical cells in the cat. Vision Res. 1985;25:357–364. doi: 10.1016/0042-6989(85)90060-4. [DOI] [PubMed] [Google Scholar]
- 51.Tretter F, Cynader M, Singer W. Cat parastriate cortex: a primary or secondary visual area? J Neurophysiol. 1975;38:1080–1098. doi: 10.1152/jn.1975.38.5.1099. [DOI] [PubMed] [Google Scholar]
- 52.Wörgotter F, Funke K. Fine structure analysis of temporal patterns in the light response of cells in the lateral geniculate nucleus of cat. Vis Neurosci. 1995;12:469–484. doi: 10.1017/s0952523800008373. [DOI] [PubMed] [Google Scholar]