

Abstract
To determine how trigeminal brainstem interneurons pattern different forms of rhythmical jaw movements, four types of motor patterns were induced by electrical stimulation within the cortical masticatory areas of rabbits. After these were recorded, animals were paralyzed and fictive motor output was recorded with an extracellular microelectrode in the trigeminal motor nucleus. A second electrode was used to record from interneurons within the lateral part of the parvocellular reticular formation (Rpc-α, n = 28) and γ- subnucleus of the oral nucleus of the spinal trigeminal tract (NVspo-γ, n = 68). Both of these areas contain many interneurons projecting to the trigeminal motor nucleus.
The basic characteristics of the four movement types evoked before paralysis were similar to those seen after the neuromuscular blockade, although cycle duration was significantly decreased for all patterns.
Interneurons showed three types of firing pattern: 54% were inactive, 42% were rhythmically active, and 4% had a tonic firing pattern. Neurons within the first two categories were intermingled in Rpc-α and NVspo-γ: 48% of rhythmic neurons were active during one movement type, 35% were active during two, and 13% were active during three or four patterns.
Most units fired during either the middle of the masseter burst or interburst phases during fictive movements evoked from the left caudal cortex. In contrast, there were no tendencies toward a preferred coupling of interneuron activity to any particular phase of the cycle during stimulation of other cortical sites. It was concluded that the premotoneurons that form the final commands to trigeminal motoneurons are organized into subpopulations according to movement pattern.
Keywords: rhythmical movements, pattern generation, mastication, trigeminal system, brainstem, rabbit
To be effective, motor patterns need to be adapted to the needs of the organism. As a result, the same body parts often participate in several stereotyped behaviors that differ only in the ordering and scaling of commands to the same pools of motoneurons (e.g., walking vs running and chewing on the right vs chewing on the left). The way in which neural circuits generate these different patterns has been investigated in many species, particularly in invertebrates, and evidence has been found that three basic forms of architecture exist: dedicated circuitry, distributed circuitry, and reorganizing circuitry (for review, see Morton and Chiel, 1994). It is probable, however, that most of the circuits controlling complex movements have features of more than one of the basic models.
Dedicated circuits can generate only one pattern, and when they are triggered by a sensory input, they suppress other ongoing behaviors. The circuit that generates wing retraction in the mollusk Clione limacina seems to be an example of this type (Morton and Chiel, 1994). Reorganizing circuits generate different patterns when the effectiveness of synaptic connections between members of the total population of neurons changes. The key feature of this form is that some neurons do not take part in the full repertory of behaviors generated by the whole population. The spinal cord interneurons that pattern scratching in turtles (Berkowitz and Stein, 1994a,b) and swimming and struggling in Xenopus embryos (Soffe, 1993) appear to be examples of this type. Distributed circuitry uses a single population of neurons to pattern all the variations in the pattern of movement. The neurons in the motor cortex of primates that control the muscles of the shoulder seem to perform as a distributed circuit during reaching. Each fires maximally during movement in a particular direction, and the population vector determines the trajectory of the arm (Georgopoulos et al., 1988; Kalaska and Crammond, 1992).
Mastication in mammals is a complex act involving several groups of muscles on both sides of the jaw. The pattern of movement differs from one food to another (Thexton et al., 1980; Weijs and Dantuma, 1981) and from the start of a sequence to the end (Schwartz et al., 1989). Up to this point, little information is available concerning the way in which the various forms of masticatory behaviors are programmed. In this paper, we have examined the behavior of putative trigeminal premotor interneurons within the brainstem of rabbits that are rhythmically active during different types of fictive mastication. We show that approximately half are active in only one of the four distinct patterns that are evoked by cortical stimulation, whereas a smaller number participate in two, three, or four patterns. These results suggest that this part of the masticatory circuitry reorganizes to produce the different patterns of mastication.
Some of this work has been published previously in preliminary form (Westberg et al., 1994).
MATERIALS AND METHODS
Anesthesia and surgery. The experiments were performed on 26 adult male New Zealand white rabbits (2.2–3.5 kg), under a protocol that respects Canadian Medical Research Council guidelines for animal care and was approved by the institutional animal care committee. The animals were first anesthetized with ketamine HCl (40 mg/kg, i.m.). After the trachea had been intubated, all subsequent surgical procedures were performed under halothane (1.5–3.5%) in a mixture of O2 and N2O (1:3). Immediately before the recording session, halothane was gradually replaced by urethane (initial dose, 1 gm/kg, i.v.).
Surgical procedures were similar to those already published (Lund et al., 1984; Olsson et al., 1986b; Donga and Lund, 1991). Briefly, a pair of needle electrodes were inserted into the right inferior alveolar nerve (Alv inf). Pairs of wire electrodes were hooked around the intact digastric (Dig) and the masseter (Mass) nerves on the same side and shielded from the surrounding tissue with dental silicone (Julien and Rossignol, 1982). A small light bulb was attached to the mental symphysis, so that jaw movements could be recorded in the three dimensions with a photodiode system (see Fig. 1A). The animal’s head was fixed in a stereotaxic retention frame. A craniotomy was performed over the brainstem, and the dura was reflected. Exposed brain tissues were kept moist with isotonic saline or Eliot’s solution. Finally, four small openings were drilled in the skull above the ipsilateral and contralateral masticatory areas of the cerebral cortex (see Fig. 1B) (Lund et al., 1984).
Fig. 1.

Illustration of the experimental setup.A, Drawing showing stimulation and recording sites. Different types of jaw movement patterns were evoked by stimulation of four separate zones within the masticatory area of the cerebral cortex and recorded with a photoelectric movement transducer system. After paralysis, one microelectrode placed within the masseter motoneuron pool (Motoneurons) was used to monitor the fictive jaw movement. The interneuron activity (Interneurons) was simultaneously recorded with a second electrode placed within the trigeminal subnuclei caudal to the trigeminal motor nucleus.B, Diagram of the dorsal surface of the cerebral cortex showing stimulation sites and superimposed plots of evoked jaw movements (n = 6), projected onto a frontal plane.Arrows indicate the direction of movement. Note the vertical movement types evoked by repetitive stimulation of the rostral cortical sites (LR-cx and RR-cx) and the lateral displacements of the jaw (right andleft) during movements evoked from the left (LC-cx) and right (RC-cx) caudal cortex.
Medication and animal care. At the end of surgery, a single dose of 3–4 ml of NaHCO3 (0.6 m) was injected via a catheter placed in the right femoral vein to counteract acidosis. Fluid (glucose 5%, NaCl 0.4%, KCl 0.1%) was thereafter supplied continuously at a rate of 3–4 ml/hr throughout the experiment to preserve hydration. Gallamine triethiodide (induction, 10 mg/kg; maintenance, 5 mg · kg−1 · hr−1) was used to paralyze the animal during the main part of the recording period. An adequate level of anesthesia was verified by observation of the electroencephalogram, by heart rate, and by testing withdrawal reflexes when the level of paralysis declined during the course of the experiment. Additional doses of urethane (200–300 mg) were given when required, usually every hour. Body temperature was kept close to 38°C, using a feedback-controlled heating pad, and the circulatory condition of the animal was monitored by electrocardiography. End-tidal PCO2 was kept between 3.5 and 4.5% by artificial ventilation (15 cm3/stroke; rate, 40–50 min).
Data collection. Concentric bipolar electrodes were inserted through each opening in the skull over the sensorimotor cortex. The positions of these electrodes were adjusted until four different rhythmical jaw movement patterns could be evoked by repetitive electrical stimulation (depth below the cortical surface, 1.7–2.5 mm; stimulus parameters, 5–30 V, 0.5 msec pulse duration, 20–50 Hz). Examples of typical electrode locations and associated movement patterns produced from each of these sites are given in Figure1B. The electrodes were fixed with a glass-ionomer cement (Chem fil, Dentsply). The animal was thereafter paralyzed, and two separate glass micropipettes filled with 2m NaCl (tip, 1–4 μm; 1–2.5 MΩ) were inserted into the right side of the brainstem to record neuronal activity extracellularly. The first was placed within the center of the masseter motoneuron pool (NVmt-mass) to monitor multiunit motoneuron activity during fictive motor patterns. The second was used to record from single interneurons in the rostral part of the oral subnucleus of the spinal trigeminal tract (NVspo-γ) and the adjacent parvocellular reticular formation (Rpc-α). The placement of these electrodes was guided by field potential landmarks generated by electrical stimulation of the Alv inf and Mass nerves (Landgren and Olsson, 1976; Westberg and Olsson, 1991). All recording sites were later confirmed in histological sections and defined in relation to the rostral end of the trigeminal motor nucleus (Meessen and Olszewski, 1949). Reference electrodes were attached to skin or neck muscles. Single interneurons were sought, and their responses to low-threshold mechanical stimulation of the face, to single-pulse stimulation of peripheral nerves (pulse duration, 0.2 msec; 0.5 Hz; 1–10 times threshold (T) for evoking monosynaptic responses in the trigeminal tract), and to short pulse trains (three pulses; pulse duration, 0.2 msec; 300–500 Hz) applied through each of the cortical electrodes were recorded. The behavior of the recorded interneuron during various forms of fictive mastication was investigated thereafter. Neuronal signals were amplified, filtered (30 Hz to 3 kHz), viewed on a storage oscilloscope, and recorded on tape (Honeywell 101) for offline analysis (see below).
Data analysis. Selected data from the tape were digitized at 10 kHz. In the first stage of the analysis, interneuron spikes were distinguished and time-stamped in the data set using previously described triggering algorithms (Edin et al., 1988). The onset and offset of masseter motoneuron bursts were marked in a full wave rectified [root mean square (RMS), time window 10 msec] transformation of the raw signal (see Fig. 5Aa) (Westberg et al., 1997). A fictive movement cycle was defined from the onset of one motoneuron burst to the beginning of the next one. Cycles 5–25 from each movement sequence were used for further analysis to obtain comparable data sets. Early and late cycles were omitted because these differ systematically from those seen during the middle of the masticatory sequence (Schwartz et al., 1989).
Fig. 5.

Example of an interneuron that was rhythmically active during two forms of fictive mastication. A, Masseter motoneuron activities and interneuron firing during fictive mastication evoked by train stimulation (0.5 msec, 40 Hz) applied to the LC-cx (a) andRC-cx (b). The RMSsignal was used to outline the motoneuron burst period. Thehorizontal line indicates the highest level of the interburst activity (Aa). The masseter motoneuron burst phase was defined as the time during which the activity was above the peak of the interburst level. The left parts show recordings taken halfway through the movement sequence. Data obtained from the end of the masticatory sequence after the cessation of the cortical stimulation are shown to the right. B, Phase histograms and descriptive circular representation of the interneuron firing. Radius = 200 Hz and a vector length of 1.0. For additional details, see Figure 4.
In the second part of the analysis, the method of circular statistics (Batschelet, 1981; Drew and Doucet, 1991; Berkowitz and Stein, 1994a,b;Zar, 1996) was used to portray the pattern of interneuronal activity during the cycle. Each cycle was divided into two equal parts, the masseter active (0–180°) and the masseter inactive periods (180–360°). This method of analysis has the advantage that the phase of interneuronal firing in relation to the motor output is clearly represented even when the relative lengths of the phases change during different forms of movements (Berkowitz and Stein, 1994a,b). Each cycle was divided into 80 bins of 4.5° binwidth. Mean firing frequency of the interneuron within each bin was determined, and phase histograms were constructed on data sets generated during 20 cycles for each movement type. Each bin was then treated as a vector, and a resultant vector was calculated trigonometrically. Firing patterns were represented by the mean vector angle (φ) and its angular deviation (s) and by the concentration (r = mean vector length) of the activity within the normalized cycle. A value ofr = 0 indicates that the unit is tonically firing, whereas r = 1.0 indicates that all spikes fall into one bin (Drew and Doucet, 1991).
The degree of temporal coupling between cortical pulses used to evoke fictive mastication and interneuronal spikes was evaluated by constructing post-stimulus time histograms based on data from selected sequences of fictive mastication (cycles 5–25). These were then converted into circular representations and treated mathematically in the same way as described above.
Statistical analysis. Numerical values are expressed as mean + SD. Differences between mean values were evaluated statistically using Student’s t test or one-way ANOVA and Tukey’s honesty significant difference (HSD) tests. The χ2 and Fisher’s exact probability tests were used to evaluate simple interactions. Mardia–Watson–Wheeler and Rayleigh tests were used for comparisons of vector data (Batschelet, 1981; Zar, 1996). Circular representations that had diametrically bimodal distributions were statistically analyzed after a procedure involving doubling of vector angles according to the method described by Zar (1996). Differences were considered to be significant when probabilities of α type errors were <0.05. When multiplet tests were applied to the same variable, overall α error probabilities were kept <0.05 by reducing the individual ttest significance level according to the Bonferroni procedure (α′ ≈ α/n).
Histology. At the end of the experiment, the animals were killed with an overdose of the anesthetic and perfused with isotonic saline, followed by 4% buffered formalin, pH 7.4. Each brain was blocked parallel to the recording tracks, removed, and stored in 10% sucrose fixative for 4–7 d. The brain tissue was then cryosectioned at 20 μm. Recording sites were marked on drawings of the brainstem made with a camera lucida and named according to the atlas of Meessen and Olszewski (1949).
RESULTS
Effects of paralysis on motor patterns
The effects of paralysis on the motor output were studied in 19 animals. The four movement types evoked in these animals before paralysis were all similar in shape to the ones illustrated in Figure1B, although the absolute amplitudes of the jaw displacements in the vertical and lateral dimensions varied between the animals. Movement produced by stimulation of the left (LC-cx) and right (RC-cx) caudal areas of the masticatory cortex were characterized by a swing away from the side of stimulation during closing (Fig. 1B). Movements evoked from the rostral cortex (LR-cx/RR-cx) were made mainly in the vertical plane and showed little dependence on the side of stimulation. Motor output data from these two movement types were therefore pooled together during the analysis described below.
After paralysis there was a general decrease in mean cycle duration (Table 1). This effect was significant during all three forms of fictive movements. Some of the differences in the patterns of mastication were preserved in the fictive movements. Each of the LC-cx and RC-cx patterns after paralysis had longer cycles and burst phases, and greater burst areas, than the pooled rostral patterns (Table 2). Although there were no significant differences between LC-cx and RC-cx fictive movements in the overall analyses, these were seen within individual animals (see Figs. 5, 6).
Table 1.
Cycle durations recorded before and after paralysis during cortically evoked mastication in 19 rabbits
| Movement type | n | Before paralysis mean cycle duration (SD)1-a | After paralysis mean cycle duration (SD) | Mean difference (SD) | p1-b |
|---|---|---|---|---|---|
| All types | 47 | 307.8 (57.0) | 274.9 (32.9) | −32.9 (47.1) | <0.001 |
| LC-cx | 19 | 324.5 (71.8) | 284.7 (25.5) | −39.7 (58.4) | <0.01 |
| RC-cx | 17 | 306.9 (44.8) | 286.2 (32.9) | −20.0 (39.1) | <0.05 |
| LR-cx/RR-cx | 11 | 280.3 (32.6) | 240.3 (19.5) | −39.9 (35.0) | <0.01 |
Cycle duration in milliseconds.
Paired t test.
Table 2.
Differences in motor output characteristics between various forms of fictive mastication
| Parameter | n | LC-cx–RC-cx | n | LC-cx–Rost-cx | n | RC-cx–Rost-cx |
|---|---|---|---|---|---|---|
| Cycle duration (msec) | 15 | 0.5 (32.2) | 11 | 33.7 (34.9)* | 10 | 38.5 (34.7)* |
| Burst duration (msec) | 15 | −13.6 (33.1) | 11 | 13.6 (14.5)* | 10 | 37.8 (37.1)* |
| Interburst duration (msec) | 15 | 14.2 (34.6) | 11 | 20.2 (37.1) | 10 | 0.6 (24.0) |
| Burst area (μV/sec) | 15 | 0.26 (1.1) | 11 | 1.8 (1.6)* | 10 | 1.8 (1.4)* |
Paired t test; *indicates significance.
Fig. 6.

A, Recordings from a rhythmically active interneuron during fictive mastication evoked from three separate sites within the sensorimotor cortex. B, Circular plots of mean unitary firing during each form of movement. Radius = 350 Hz; vector length, 1.0.
Properties of interneurons
Location
Extracellular recordings were made from 96 interneurons that had inputs from the trigeminal nerve and/or fired during cortical stimulation. Figure 2 shows the location of cells that were inactive (n = 52) or had a firing that was modulated (i.e., rhythmical; n = 40) or tonic (n = 4) during fictive mastication. Both modulated and inactive interneurons were found scattered throughout the entire dorsoventral and mediolateral extent of the lateral brainstem from the caudal region of NVmt to the level of the rostral limit of the facial nucleus. Those found closest to NVmt (n = 28) were all recorded in the lateral part of the parvocellular reticular formation (Fig. 2B, Rpc-α). The remaining 68 were all located within the NVspo-γ (Fig. 2C,D). Modulated and inactive neurons were intermingled and appeared in approximately equal proportions within Rpc-α (modulated = 11/28, 41%) and NVspo-γ (modulated = 29/68, 43%). Three cells with a tonic firing pattern during fictive mastication were found in Rpc-α and one was found in NVspo-γ. Note that one cell in Figure 2B fired tonically during one fictive pattern and phasically in another. This cell is illustrated in Figure 4.
Fig. 2.

Illustration of distribution, location, and receptive fields of the recorded interneurons. A, Histogram showing the number of cells that were inactive, rhythmical, or tonic during fictive mastication (see key in figure).B–D, Composite maps showing the neuron distribution. Each diagram has been drawn from histological sections obtained in one of the animals. The number above each section indicates its position relative to the rostral end of the trigeminal motor nucleus (see A). The property of each neuron is indicated (key in A). E, Intraoral views of the mandible and the tongue showing three examples of locations and sizes of receptive fields (shaded areasindicated by arrows). Most neurons had small receptive fields located in the anterior part of the oral cavity, either on the tip of the tongue (a) or on the mucosa lingual and lateral to the right incisor tooth (b). A minority had larger receptive fields that extended toward the molar region (c). D, Dorsal;NVmt-dig, digastric subnucleus of the trigeminal motor nucleus; NVsnpr, main sensory trigeminal nucleus;NVspo-β, subnucleus-β of the oral nucleus of the trigeminal tract; M, medial; V, trigeminal tract; VII, facial nerve. See Results for other abbreviations.
Fig. 4.

Example of a rhythmically active neuron during fictive mastication. A, Drawings of sections showing positions at which the interneuron (▪) recording was performed.B, Intraoral receptive field of the recorded interneuron at the tip of the tongue (arrow). C, Top traces show masseter motoneuron activity and interneuron firing evoked by train stimulation (Cx-stim; 0.5 msec, 33 Hz) of the left rostral and left caudal masticatory areas. Phase histogram and descriptive circular representation of the mean interneuron firing frequency averaged over 20 cycles during the LR-cx movement. Thegray-shaded bar and sector mark the length of the masseter burst normalized to half of the cycle (0–180°). Thearrow represents the trigonometrically calculated preferred direction (mean vector angle, φ; s = angular deviation) and concentration (vector length, r) of the interneuron activity. The radius of the circle represents both a spike frequency of 100 Hz and a vector length of 1.0. E, Circular plot of corticoneuronal post-stimulus spike latencies during fictive mastication evoked from the LC-cx.
Receptive fields
We were able to find peripheral receptive fields for about half of the interneurons, and all of these responded to light mechanical stimulation. Seventy-eight percent (36/46) had exclusively intraoral fields, all limited to the mucosa of the mandible, the floor of the mouth, or the anterior part of the tongue. Among these, nine were also activated by pressure applied to the ipsilateral incisor tooth. Six neurons with periodontal inputs were recorded in NVspo-γ and three in Rpc-α. Fifteen percent (7/46) had intraoral and perioral receptive fields, and 6% (3/46) had exclusively extraoral fields. All of the latter were found to be in NVspo-γ. Interneurons recorded in Rpc-α had only intraoral fields. Typical examples of locations and sizes of intraoral receptive fields are illustrated in Figure2E (also see Fig. 4B).
Responses to primary afferent nerve and cortical stimulation
Thresholds and latencies after electrical stimulation of peripheral nerves are given in Table 3. There was a significantly higher proportion of Rpc-α neurons (100%) that received Alv inf inputs than in NVspo-γ (84%) (Fisher’s test,p < 0.05). However, there were no significant differences in Alv inf threshold or latencies between neurons in the two subnuclei (t test, p = 0.6).
Table 3.
Interneuron thresholds and latencies to single-pulse electrical stimulation of primary afferent nerves
| Location | Unit type3-a | Alv inf | Mass | Dig | ||||||||||||
|---|---|---|---|---|---|---|---|---|---|---|---|---|---|---|---|---|
| Response | Threshold Mean (SD) | Latency, msec Mean (SD) | Response | Threshold Mean (SD) | Latency, msec Mean (SD) | Response | Threshold Mean (SD) | Latency, msec Mean (SD) | ||||||||
| n3-b | + | % | n3-b | + | % | n3-b | + | % | ||||||||
| Rpc-α | Modulated | 13 | 13 | 100 | 1.9 (0.7) | 4.2 (2.2) | 2 | 0 | 0 | 0 | ||||||
| Inactive | 15 | 15 | 100 | 1.6 (0.5) | 3.0 (1.1) | 8 | 0 | 0 | 0 | |||||||
| NVspo-γ | Modulated | 30 | 24 | 80 | 1.9 (0.8) | 3.8 (2.6) | 15 | 2 | 13 | 7.3 (2.5) | 8.5 (1.5) | 2 | 1 | 50 | 2.9 | 9.0 |
| Inactive | 36 | 32 | 88 | 1.7 (0.6) | 3.5 (2.6) | 20 | 1 | 5 | 10.0 | 30.0 | 3 | 1 | 33 | 1.3 | 12.0 | |
Modulated, Units that were rhythmically or tonically active during fictive mastication; inactive, units that did not fire during fictive mastication.
Number of tested neurons.
Electrical stimulation of muscle nerves gave responses only in NVspo-γ. An input from the masseter nerve was observed in 9% (n = 3/35) of the neurons tested, and two of five cells responded to stimulation of the digastric nerve. The relative threshold was higher for the masseter nerve than for Alv inf, and the mean latency was longer (t test, p < 0.001). Electrical stimulation of the cortical sites with short pulse trains activated 84% of the Rpc-α (n = 16/19) and 55% (n = 32/58) of the NVspo-γ interneurons. This difference was statistically significant (Fisher’s test,p < 0.05).
Activity patterns during fictive mastication
Among the population of modulated neurons, approximately half (n = 19/40) were active during one movement type, one-third (35%; n = 14/40) were active during two, and six (15%) were active during three forms of fictive movement patterns. One neuron showed rhythmical bursting during all motor patterns, and as already mentioned above, four neurons fired tonically. Examples of activity patterns observed in three of these interneuron categories are given below.
Tonic firing patterns
The four neurons that were categorized as tonic were all active during the LC-cx motor pattern and showed two basic forms of firing: regular (n = 3) and irregular (n = 1). Regular firing began when the cortical stimulation was turned on, and the discharge persisted throughout most of the cortical stimulation period, with no sign of modulation coupled to movement phase. After stimulation, two of these neurons fell silent. One continued to fire spontaneously (Fig. 3A). This neuron, which showed no movement-related coupling according to the Rayleigh test (p > 0.05), tended to fire twice to every pulse during the cortical stimulation (Fig. 3Ab). Both the first and second spike were clearly time-locked to the cortical stimulus, with the earliest response at ∼5 msec and with most spikes occurring from 9–16 msec (Fig. 3B) (r = 0.94; φ = 10.4 msec). The one neuron that fired irregularly did so during stimulation of LC-cx (Fig.4Cb). Spikes were infrequent and loosely time-locked to the cortical pulses (Fig.4E).
Fig. 3.

Example of a tonically active interneuron recorded in Rpc-α, ∼800 μm caudal to NVmt. Aa, Masseter motoneuron activity (NVmt-mass) and interneuron (Neuron) firing during fictive mastication evoked by train stimulation (Cx-stim; 0.5 msec, 40 Hz) of the left caudal masticatory area. Ab, Record to show the robust time-coupling between the cortical stimulus pulses and interneuron action potentials. B, Post-stimulus latency histogram of unit action potentials during the cortical stimulus period. The cortical stimulus pulse occurred at time 0 (binwidth, 1 msec). Eachdot in the circular plot shows the latency of the first spike relative to the start of the stimulus. The trigonometrically calculated preferred latency of the spikes (mean vector angle, φ) and their concentration (mean vector length, r) are indicated by the arrow. These values are also shown above the diagram together with the probability of a response without directionality (i.e., that the spikes are not time-coupled to the preceding cortical pulse). In the analysis, the first millisecond has been discarded because of post-stimulus blanking of the amplifier.
Modulated firing patterns
The same neuron (Fig. 4) fired rhythmically when another cortical site was stimulated, and this response is used to illustrate the data drawn from the 19 interneurons that were rhythmically active during only one type of fictive mastication. The neuron was recorded in the rostral part of Rpc-α and the motor pattern from the center of the masseter motoneuron pool (Fig. 4A). Its low-threshold mechanoreceptive field was located on the tip of the tongue and on the adjacent mucosa (Fig. 4B). It responded to low-threshold (1.5 T) stimulation of Alv inf with a minimum latency of 3.9 msec. During fictive mastication evoked from the LR-cx, only a few masseter motoneurons were active, and the neuron fired short bursts composed of three to four spikes during every cycle (Fig.4Ca). The neuron was silent during RC-cx and RR-cx movements (data not shown).
A quantitative display of the activity in relation to the two phases of the LR-cx fictive movement cycle is given in Figure4D. Firing occurred from the last part of the interburst phase and throughout the masseter burst (shaded bar and sector). The concentration was relatively high (r = 0.57, s = 52.8°), and the mean spike vector angle (φ) was 48.2°. Figure 4E shows latencies of cortically evoked spikes during the LC-cx movement. These were loosely time-locked to the preceding cortical pulse.
Figure 5 illustrates the activity of an interneuron recorded in NVspo-γ that represents the population of cells (n = 14) that was rhythmically active during two motor patterns. It belonged to the small group of modulated neurons (n = 5/40) in our sample for which no receptive field was found and that also failed to respond when tested with electrical stimulation of trigeminal nerve branches. Figure 5Aillustrates activity recorded during fictive movements evoked by stimulation of LC-cx (Fig. 5Aa) and RC-cx (Fig.5Ab). The first three cycles were chosen from the middle of the sequence, and three were chosen from near the end. The two motor patterns differed significantly. During the RC-cx pattern, the cycle, burst, and interburst durations were shorter and the masseter burst area was smaller than in the LC-cx motor pattern (ttests, p < 0.001).
Once fictive mastication began, the interneuron started to fire rhythmically in phase with the masseter motoneuron bursts. An important observation was that its activity continued also after the end of the cortical stimulation (four to five cycles). The neuron continued to fire during the masseter burst in both patterns, although the spike frequency declined in parallel with the gradual fading of the motor activity. These changes are clearly seen in Figure 5A(right panel). Bursting after stimulation in conjunction with fictive mastication was observed in 11 of 17 interneurons (65%). In all cases, the bursts appeared in the same phase as during stimulation. However, detailed data could not be obtained because fictive movements usually stopped three to five cycles after the end of the cortical stimulation.
Averaged data from 20 cycles/movement type is summarized in Figure5B. During the LC-cx pattern (Fig. 5Ba), the mean firing of the interneuron was high and strongly concentrated (r = 0.74) to the middle half of the masseter burst phase. Both frequency and mean number of spikes per cycle decreased substantially in the switch to the RC-cx pattern. The burst was shorter, which is reflected in the greater concentration of firing (r = 0.83 vs 0.74), and in the significant difference (Mardia–Watson–Wheeler test, p < 0.001) in mean vector angles (φ = 87.8 vs 66.8°).
Figure 6 illustrates recordings from one of the seven cells that were rhythmically active during three or four motor patterns. This neuron was recorded in the NVspo-γ. It had no discernible receptive field, but it did respond to Alv inf stimulation (2.9 T) at a latency of 14 msec. Stimulation of LC-cx, RC-cx, and LR-cx caused this neuron to fire rhythmically (Fig.6Aa–Ac). The masseter bursts were robust during the LC-cx and RC-cx motor patterns (Fig. 6Aa,Ab), but only a few spikes were picked up during LR-cx stimulation (Fig.6Ac). The site of stimulation had a significant effect on cycle (p < 0.001), on burst duration (p < 0.001), and on burst area (one-way ANOVA,p < 0.005). Post hoc analysis (Tukey’s HSD test) revealed that all three groups differed with respect to cycle and burst duration (p < 0.001). However, the burst area showed significant differences only when the LR-cx pattern was compared with LC-cx and RC-cx patterns (p < 0.001).
The changes in motor outputs were reflected in the firing of the interneuron (Fig. 6Ba–Bc). The mean number of spikes/cycle was low during RC-cx stimulation but increased significantly during LC-cx and LR-cx fictive movements (mean ± SD = 4.5 ± 1.4 vs 10.9 ± 1.0, vs 18.5 ± 2.4 spikes/cycle). Firing was concentrated in the second half of the masseter burst phase and in the first third of the interburst phase. The mean vector angles during both the LC-cx and LR-cx movement types were significantly different from the RC-cx pattern (Mardia–Watson–Wheeler test, p < 0.05) but not from one another.
Population characteristics
Phase coupling and burst characteristics: relationships to motor patterns
Figure 7 gives a summary of the activity of the whole population during three motor patterns. During the LC-cx motor pattern (Fig. 7Aa), a slightly larger number of neurons were active during the masseter burst (shaded sector,n = 20) than during the interburst phase (n = 16), and vectors had a tendency to be concentrated during the middle of these phases (Rayleigh test, p < 0.001). During other forms of movement, approximately equal numbers of neurons were active during the burst and interburst phases (Fig.7Ab,Ac), and there was no sign that interneuron activity was concentrated in any particular phase of the cycle (Fig.7Ab,Ac). This was also confirmed by Rayleigh tests (p > 0.4); however, the number of samples for LR-cx and RR-cx was small. The histograms in Figure 7Billustrate the distribution of mean vector lengths (r), which varied from 0.1 to 0.98. There was no correlation between mean vector length and mean vector angle, but it is of interest to note that the mean vectors were generally longer for RC-cx and LR-cx/RR-cx patterns than for LC-cx, indicating that firing tended to be more concentrated during RC-cx and LR-cx/RR-cx patterns than during LC-cx stimulation.
Fig. 7.

Distribution of mean vector angles (A) and mean vector lengths (B) observed in the sampled population of rhythmically active interneurons during fictive mastication. Note that cells with short mean vector lengths (r < 0.1;n = 4) were excluded from the sample because they were classified as tonic according to the Rayleigh test (p > 0.05).
The correlation between interneuron mean vector angle values obtained during different movement types is displayed in Figure8. There was a strong positive correlation (r = 0.91, p < 0.001), indicating that most shifts in vector angle that accompanied changes in the motor program were minor. In fact, all except two neurons (Fig. 8,arrows) maintained their preferred direction of firing in the same phase of the motor activity (framed areas), despite the fact that the absolute time of the burst and interburst periods was different between fictive patterns (Fig. 5A). One of these outliers had a response that hovered around the transition from the burst to the interburst phase (angle = 0°). In this case it is probable that the shift from one phase to the other occurred by chance. However, this explanation does not hold for the other neuron, which showed a more dramatic change of its firing. The vector angle coincided with the late part of the burst phase during LC-cx fictive movements and shifted to the end of the interburst phase during the RC-cx-evoked pattern. Both motor patterns were equally robust. Although most units showed relatively small changes in vector angles, more than half of these changes were significant (Mardia–Watson–Wheeler test, p < 0.05). There was no consistent pattern; angles both increased and decreased with changes from LC-cx to the others. However, there was a consistent tendency for interneurons to be more active during LC-cx-type fictive movements than in the others. During LC-cx movements, the number of spikes/cycle varied between 1 and 23. With the change to another pattern, 12 neurons decreased firing by more than two spikes/cycle (vs two that increased), and 10 stopped firing (Fig. 8B).
Fig. 8.
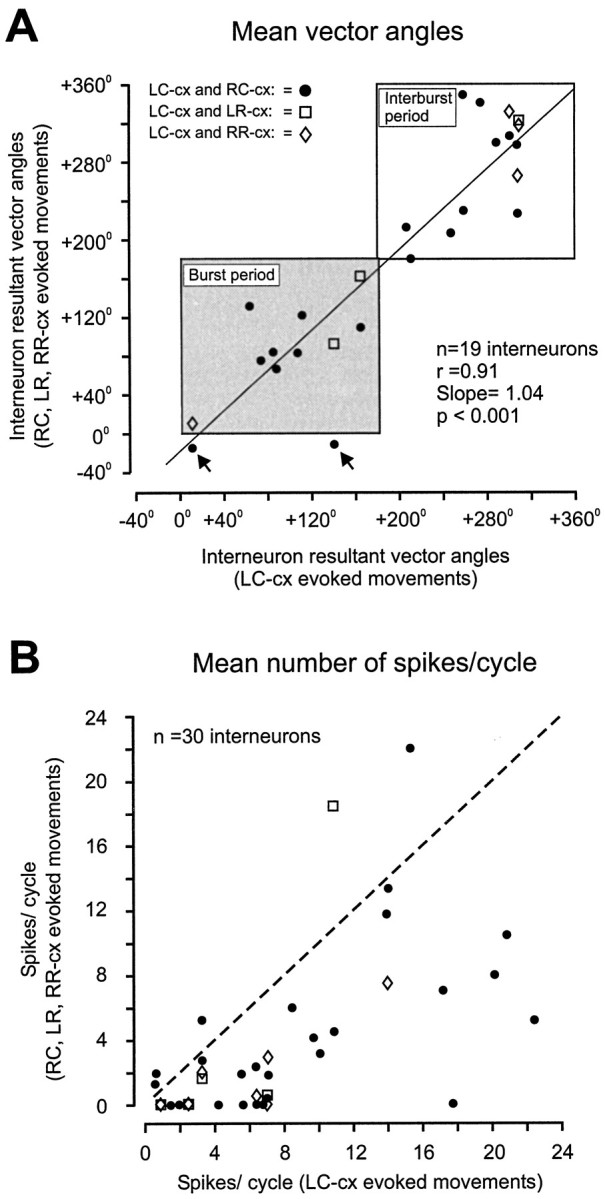
Scatter plots illustrating alternations in unit mean vector angles (A) and mean number of spikes per movement cycle (B) during LC-cx movements (horizontal axis) and RC-cx, LR-cx, and RR-cx movements (vertical axis). Boxed areas inA show periods during which the masseter motoneurons were active (shaded) and inactive (unshaded), respectively. The dotted guide line in B illustrates a hypothetical 1:1 correlation. Key for symbols is given in FigureA.
Contribution of cortical inputs to interneuron bursts
The influence of direct cortical drive on rhythmical activity was investigated by an analysis of the temporal relationships between spikes and the preceding cortical pulses. It was found that the neurons could be divided into three categories, each of which will be described below.
Figure 9 gives an example of rhythmic activity in which almost all action potentials occurred at a fixed latency after the cortical stimulus (Fig. 9Aa,Ab). As a result, the post-spike distribution was unimodal (φ = 13.5 msec) and highly directional (r = 0.96). This is clearly seen in Figure 9, Ab and Ac. In other cases, the spikes were randomly distributed throughout the post-stimulus period (Fig.9Bc, histogram), and the lack of time-locking was confirmed by the circular statistical analysis (Rayleigh test,p = 0.85).
Fig. 9.

Examples from two rhythmically active interneurons (A, B) illustrating relationships between cortical stimulation pulses and neuronal action potentials. a, Motor and interneuron activities during three movement cycles.b, Framed sections in A andB at a shorter time scale. c, Post-stimulus histograms and corresponding circular representations of interneuronal firing during 20 cycles of fictive mastication. Stimulus frequency in A, 33 Hz; B, 40 Hz.
Other neurons showed mixed patterns (Figs. 5Aa,Ab,10). In the example, spikes occurred throughout the whole interstimulus period, but they had a tendency to appear in a bimodal latency distribution after the stimuli during the LC-cx pattern (Fig. 10Ab–Ac). The Rayleigh test confirmed a significant relationship to the cortical shock at a latency of 4–5 msec. During the RC-cx pattern, the interneuron also fired during the first half of the interburst phase as during the LC-cx movement (Fig. 10B). However, burst duration was shorter (Fig. 10Bb), and the spike distribution was completely random in relationship to cortical shocks (Fig.10Bb,Bc) (Rayleigh test, r = 0.08,p = 0.47).
Fig. 10.

Examples of two different post-stimulus coupling patterns recorded in an interneuron during fictive mastication evoked by repetitive stimulation of LC-cx(A) and RC-cx(B). For additional details see Figure 9.
Time-locked firing was most prevalent during the LC-cx motor pattern (50%, n = 18/36), whereas random (n = 12/22, 55%) or mixed (n = 7/22, 32%) post-spike distributions dominated the RC-cx pattern (Fig.11). This difference was found to be significant (χ2 test, p < 0.05). When LR-cx motor patterns were expressed, two neurons had time-locked and three random or mixed post-spike couplings. During RR-cx, only mixed (n = 2) and random (n = 3) distributions were seen.
Fig. 11.

Histogram showing the number of interneurons activated with a time-locked, mixed, or random coupling of the spike to the preceding pulse in the cortical stimulus train. Seekey on figure.
The median latencies of corticotrigeminal inputs were calculated from the post-stimulus time histograms in which spikes clearly followed to the preceding cortical pulse (Fig. 12). The shortest latencies were associated with LC-cx (range, 5.2–13.5 msec) followed by LR-cx (range, 8.7–8.9 msec) and RC-cx (range, 9.1–14.2 msec). The difference in median latency between LC-cx and RC-cx was statistically significant (Mann–Whitney U test,p = 0.05).
Fig. 12.

Histogram showing latencies of time-locked cortically evoked excitation of Rpc-α and NVspo-γ interneurons during fictive mastication induced by repetitive stimulation of the left and right masticatory corteces. Binwidth, 1 msec. Seekey on figure.
DISCUSSION
Motor patterns
In agreement with earlier studies, stimulation of sites of the caudal cortical masticatory areas produced movements of relatively large vertical amplitude and a lateral swing during closure, whereas activation of rostral sites gave movements that were restricted mainly to the vertical plane (Bremer, 1923; Lund et al., 1984; Morimoto et al., 1989). The former resemble grinding movements on the left or right molar teeth and are characterized by strong phasic activity in the major jaw closing muscles, including the masseters. In contrast, vertical movements are mainly produced by the digastrics (Schwartz et al., 1989). During paralysis it was shown that there were some significant differences in mean parameters between the fictive motor patterns recorded from the masseter motoneuron pool. In individual animals, e.g., Figure 6, the differences in motoneuron bursts were very clear. This suggests that the basic forms of masticatory motor activity are centrally patterned. Similarly, patterns resembling locomotion, scratching, and paw shaking can be generated in the spinal cord in the absence of feedback (Rossignol, 1996). However, we did observe a general increase in masticatory frequency after paralysis, indicating that the rhythm generator was working with a higher repetition rate when completely isolated from movement-related sensory feedback. Similar results were reported before by Jüch and collaborators (1985), although Nakamura et al. (1976) reported a small but unmeasured decrease in the cat.
Location and identity of recorded neurons
The sampled neurons were all found in Rpc-α and NVspo-γ. Most neurons in these nuclei have trigeminal inputs, and many had small mechanosensitive receptive fields within and around the mouth, as shown in earlier studies of rabbits and other species (Eisenman et al., 1963;Olsson et al., 1986a; Shigenaga et al., 1986; Donga and Lund, 1991).
Many were likely to have been last-order trigeminal interneurons, because previous investigations in the rat, guinea pig, and cat have demonstrated that large numbers of neurons in these nuclei project to ipsilateral or contralateral NVmt (Mizuno et al., 1978; Landgren et al., 1986; Appenteng et al., 1987, 1990; Donga and Lund, 1991; Olsson and Westberg, 1991; Yoshida et al., 1994; Turman and Chandler, 1994a,b;Westberg et al., 1995).
In the rabbit, Donga and Lund (1991) recorded from neurons in Rpc-α and NVspo-γ that responded to antidromic stimulation of the contralateral NVmt. Like us, they found that somewhat fewer than half (45 vs 42% in our study) were rhythmically modulated during fictive mastication and that very few fired tonically (<5%). In both studies, modulated and nonmodulated neurons were intermingled. In the guinea pig, Inoue et al. (1994) reported similar results, although they found a larger proportion of rhythmically active neurons.
Do Rpc-α and NVspo-γ neurons play different roles in mastication?
Our results showed one significant functional difference between neurons in the two nuclei. Although most neurons in Rpc-α have cortical inputs, these were less frequent in NVspo-γ. This suggests that Rpc-α may have a greater role in the control of the centrally generated components of mastication than NVspo-γ. However, the latter may be more important for the integration of sensory feedback, particularly from muscles and periodontal receptors. Muscle inputs are rare in Rpc-α (Olsson et al., 1986a), but much more common in NVspo-γ (Westberg and Olsson, 1991). In our study, all neurons that responded to stimulation of muscle nerves (5/40 tested) were in NVspo-γ. Olsson et al. (1988) also found that periodontal inputs were more common in NVspo-γ than in Rpc-α. In our study, six of the nine periodontal neurons were found in NVspo-γ.
The pattern-generating network
Nozaki and collaborators (1986a,b) were the first to propose that corticobulbar axons tonically excite a group of neurons in the medioventral bulbar reticular formation (RF) that includes the rostral pole of N reticularis gigantocellularis (Rgc). These neurons are thought to activate another group lying more dorsally in the same region. In the original model, the latter group, which fires rhythmically during fictive mastication, were the premotoneurons that controlled trigeminal motoneurons (Nozaki et al., 1986b). However, projections from this area to NVmt are very sparse (Travers and Norgren, 1983; Landgren et al., 1986), so a relay in caudal N reticularis parvocellularis was added (Nozaki et al., 1993; Nakamura and Katakura, 1995). Although neurons in these areas do project to NVmt (Nozaki et al., 1993; Li et al., 1995), this group cannot be essential, because sectioning the medulla rostral to it does not abolish the masticatory pattern (Chandler and Tal, 1986; Nozaki et al., 1986a; Kogo et al., 1996).
In the original model (Nozaki et al., 1986a,b) and its derivative (Nakamura and Katakura, 1995), it was assumed that cortical inputs activate only the ventral midline RF group. However, we showed that many neurons in Rpc-α and NVspo-γ received direct inputs from one or more cortical stimulation sites. Stimulus-bound activation was most apparent when movements were evoked from the caudal site in the contralateral cortex. This is clearly in agreement with earlier reports that the sensorimotor cortex projects with a contralateral predominance to the lateral brainstem, including the regions surrounding NVmt (Torvik, 1956; Haartsen, 1962; Yasui et al., 1985; Donga and Lund, 1991; Inoue et al., 1992; Enomoto et al., 1995). However, the presence of cortical inputs is not essential for participation in burst generation, as was once suggested (Chandler and Goldberg, 1982), because ∼50% of the rhythmical neurons in our sample had no short-latency cortical inputs. Furthermore, some neurons that were directly excited by cortical shocks during one pattern of mastication did not respond at short latency during another, although they fired rhythmically. An almost identical proportion (45%) of short-latency cortical inputs was reported by Donga and Lund (1991). However, in the guinea pig, Inoue et al. (1994) found that most cells (84%) were time-locked to the cortical stimulus. This difference is probably related to the fact that only inputs from the contralateral cortex were examined in the latter study (see above).
Obviously, the fact that neurons in all parts of the cental pattern generator (CPG) have direct inputs from the sensorimotor cortex is not compatible with a model in which a tonic input from the cortex to a group of neurons in Rgc is transformed into the burst pattern observed in the present study (Lund, 1991; Nakamura and Katakura, 1995;Scott et al., 1997). Instead it appears that tonic drive from masticatory cortex is activating all levels of the CPG.
How many burst generators does the masticatory CPG need?
Jaw closing motoneurons undergo hyperpolarization during jaw opening, but opener motoneurons are not inhibited during jaw closure (Goldberg and Chandler, 1981; Kubo et al., 1981). Therefore, to produce rhythmical opening and closing of the jaw with no lateral movements, only three types of command are necessary. These are (1) inhibition of jaw closer motoneurons during opening, (2) excitation of jaw opener motoneurons concurrently, and (3) excitation of jaw closer motoneurons. The simplest model of the burst-generating stage of the CPG therefore requires two groups of premotoneurons (inhibitory and excitatory) to fire during jaw opening and another group of excitatory interneurons to fire during jaw closure. This is probably the reason that Inoue et al. (1994) grouped rhythmically active neurons into only jaw opener-related and closer-related types.
Clearly, the simple opening–closing pattern of mastication requires a modification to produce movements to the left or right during jaw closure. This could be brought about by changes in the coupling between left and right side-burst generators, along the lines suggested byGrillner (1981) for locomotion. In the case of mastication, lateral movements of the jaw during closure could be achieved simply by varying the phase relationship between jaw closing burst generators on the left and right. However, it is very unlikely that the masticatory system has so few burst generators.
The major jaw closing muscles do not function as a single group; even individual muscles appear to need more than one burst generator. For instance, masseter muscle motor units tend to be small and may be confined within one of many anatomically distinct compartments (Stålberg and Eriksson, 1987; Herring et al., 1989; McMillan and Hannam, 1992; Weijs et al., 1993; Kwa et al., 1995). Furthermore, individual anatomical compartments can be controlled independently. For example, when food is being crushed on the left, EMG activity begins in the deep posterior parts of the left muscle and spreads progressively to the superficial layers. On the right side, the pattern is reversed (Weijs and Dantuma, 1981). This suggests that premotoneurons are not grouped into a few burst generators that are distinguishable by the phase in which they are active, and this is clearly in line with our finding that mean vector angles were distributed throughout the cycle. This being said, there did appear to be a tendency for vectors to be concentrated in the middle of the opening and closing phases, when the drive potentials to opener and closer motoneurons peak (Gurahian et al., 1989).
Conclusions
Our results suggest that premotoneurons in Rpc-α and NVspo-γ form a population that reorganizes to bring about changes in motoneuron firing. Reorganization includes the addition and subtraction of members of the population, as well as changes in firing frequency and shifts in the phase of maximal activity of individual members. It is clear from our results that the patterns that we were studying were not produced by four dedicated circuits. On the other hand, very few participated in more than two patterns, so at least this part of the CPG is not organized as a classic distributed circuit.
Footnotes
This work was supported by a Group Grant from the Canadian Medical Research Council and Swedish Medical Research Council (B93-04X-00045-29A; K93-24P-10133-02A), the Swedish Dental Society, the Faculty of Odontology, University of Umeå, Västerbottens läns landsting, and Glaxo-France.We thank Sylvie Lepage for her technical assistance and Christian Valiquette for his help with the data analysis.
Correspondence should be addressed to K.-G. Westberg, Department of Physiology, Umeå University, S-901 87 Umeå, Sweden.
REFERENCES
- 1.Appenteng K, Girdlestone D. Transneuronal transport of wheat-germ agglutinin-conjugated horseradish peroxidase into trigeminal interneurones of the cat. J Comp Neurol. 1987;258:387–393. doi: 10.1002/cne.902580307. [DOI] [PubMed] [Google Scholar]
- 2.Appenteng K, Conyers L, Curtis J, Moore J. Monosynaptic connections of single V interneurones to the contralateral V motor nucleus in anaesthetized rats. Brain Res. 1990;514:128–130. doi: 10.1016/0006-8993(90)90443-f. [DOI] [PubMed] [Google Scholar]
- 3.Batschelet E. Circular statistics in biology. Academic; New York: 1981. [Google Scholar]
- 4.Berkowitz A, Stein PSG. Activity of descending propriospinal axons in the turtle hindlimb enlargement during two forms of fictive scratching: broad tuning to regions of the body surface. J Neurosci. 1994a;14:5089–5104. doi: 10.1523/JNEUROSCI.14-08-05089.1994. [DOI] [PMC free article] [PubMed] [Google Scholar]
- 5.Berkowitz A, Stein PSG. Activity of descending propriospinal axons in the turtle hindlimb enlargement during two forms of fictive scratching: phase analyses. J Neurosci. 1994b;14:5105–5119. doi: 10.1523/JNEUROSCI.14-08-05105.1994. [DOI] [PMC free article] [PubMed] [Google Scholar]
- 6.Bremer F. Physiologie nervuse de la mastication chez le chat et le lapin. Réflexes de mastication. Réponses masticatrices corticales et centre cortical du gout. Arch Int Physiol. 1923;21:308–352. [Google Scholar]
- 7.Chandler SH, Goldberg LJ. Intracellular analysis of synaptic mechanisms controlling spontaneous and cortically induced rhythmical jaw movements in the guinea pig. J Neurophysiol. 1982;48:126–137. doi: 10.1152/jn.1982.48.1.126. [DOI] [PubMed] [Google Scholar]
- 8.Chandler SH, Tal M. The effects of brain stem transections on the neuronal networks responsible for rhythmical jaw muscle activity in the guinea pig. J Neurosci. 1986;6:1831–1842. doi: 10.1523/JNEUROSCI.06-06-01831.1986. [DOI] [PMC free article] [PubMed] [Google Scholar]
- 9.Donga R, Lund JP. Discharge patterns of trigeminal commissural last-order interneurons during fictive mastication in the rabbit. J Neurophysiol. 1991;66:1564–1578. doi: 10.1152/jn.1991.66.5.1564. [DOI] [PubMed] [Google Scholar]
- 10.Drew T, Doucet S. Application of circular statistics to the study of neuronal discharge during locomotion. J Neurosci Methods. 1991;38:171–181. doi: 10.1016/0165-0270(91)90167-x. [DOI] [PubMed] [Google Scholar]
- 11.Edin BB, Bäckström AP, Bäckström LO. Single unit retrieval in microneurography: a microprocessor-based device controlled by an operator. J Neurosci Methods. 1988;24:137–144. doi: 10.1016/0165-0270(88)90057-x. [DOI] [PubMed] [Google Scholar]
- 12.Eisenman J, Landgren S, Novin D. Functional organization in the main sensory trigeminal nucleus and the rostral subdivision of the nucleus of the spinal trigeminal tract. Acta Physiol Scand. 1963;59[Suppl 214]:1–44. [PubMed] [Google Scholar]
- 13.Enomoto S, Kohase H, Nakamura Y. Dual brain stem projection from the cortical masticatory area in guinea-pig. NeuroReport. 1995;6:1573–1577. doi: 10.1097/00001756-199507310-00027. [DOI] [PubMed] [Google Scholar]
- 14.Georgopoulos AP, Kettner RE, Schwartz AB. Primate motor cortex and free arm movements to visual targets in three-dimensional space. II. Coding of the direction of movement by a neuronal population. J Neurosci. 1988;8:2928–2937. doi: 10.1523/JNEUROSCI.08-08-02928.1988. [DOI] [PMC free article] [PubMed] [Google Scholar]
- 15.Goldberg LJ, Chandler SH. Evidence for pattern generator control of the effects of spindle afferent input during rhythmical jaw movements. Can J Physiol Pharmacol. 1981;59:707–712. doi: 10.1139/y81-107. [DOI] [PubMed] [Google Scholar]
- 16.Grillner S. Control of locomotion in bipeds, tetrapods and fish. In: Brooks VB, editor. Handbook of physiology. The nervous system, motor control. Am Physiol Soc; Bethesda, MD: 1981. pp. 1179–1236. [Google Scholar]
- 17.Gurahian S, Chandler S, Goldberg LJ. Intracellular analysis of trigeminal motoneuron rhythmical activity during stimulation of pontomedullary reticular formation in anaesthetized guinea pig. J Neurophysiol. 1989;62:1225–1236. doi: 10.1152/jn.1989.62.6.1225. [DOI] [PubMed] [Google Scholar]
- 18.Haartsen AB (1962) Cortical projections to mesencephalon, pons, medulla oblongata and spinal cord. An experimental study in the goat and the rabbit. PhD thesis, University of Leiden.
- 19.Herring SW, Wineski LE, Anapol FC. Neural organization of the masseter muscle in the pig. J Comp Neurol. 1989;280:563–576. doi: 10.1002/cne.902800407. [DOI] [PubMed] [Google Scholar]
- 20.Inoue T, Masuda Y, Nagashima T, Yoshikawa K, Morimoto T. Properties of rhythmically active reticular neurons around the trigeminal motor nucleus during fictive mastication in the rat. Neurosci Res. 1992;14:275–294. doi: 10.1016/0168-0102(92)90072-k. [DOI] [PubMed] [Google Scholar]
- 21.Inoue T, Chandler SH, Goldberg LJ. Neuropharmacological mechanisms underlying rhythmical discharges in trigeminal interneurons during fictive mastication. J Neurophysiol. 1994;71:2061–2073. doi: 10.1152/jn.1994.71.6.2061. [DOI] [PubMed] [Google Scholar]
- 22.Jüch PJW, van Willigen JD, Broekhuijsen ML, Ballintijn CM. Peripheral influences on the central pattern-rhythm generator for tongue movement in the rat. Arch Oral Biol. 1985;30:415–421. doi: 10.1016/0003-9969(85)90069-x. [DOI] [PubMed] [Google Scholar]
- 23.Julien C, Rossignol S. Electroneurographic recordings with polymer cuff electrodes in paralyzed cats. J Neurosci Methods. 1982;5:267–272. doi: 10.1016/0165-0270(82)90078-4. [DOI] [PubMed] [Google Scholar]
- 24.Kalaska JF, Crammond DJ. Cerebral cortical mechanisms of reaching movements. Science. 1992;255:1517–1523. doi: 10.1126/science.1549781. [DOI] [PubMed] [Google Scholar]
- 25.Kogo M, Funk GD, Chandler SH. Rhythmical oral-motor activity recorded in an in vitro brain stem preparation. Somatosens Mot Res. 1996;13:39–48. doi: 10.3109/08990229609028910. [DOI] [PubMed] [Google Scholar]
- 26.Kubo Y, Enomoto S, Nakamura Y. Synaptic basis of orbital cortically induced rhythmical masticatory activity of trigeminal motoneurons in immobilized cats. Brain Res. 1981;2309:97–110. doi: 10.1016/0006-8993(81)90394-2. [DOI] [PubMed] [Google Scholar]
- 27.Kwa SHS, Korfage JAM, Weijs WA. Function-dependent anatomical parameters of rabbit masseter motor units. J Dent Res. 1995;74:1649–1657. doi: 10.1177/00220345950740100501. [DOI] [PubMed] [Google Scholar]
- 28.Landgren S, Olsson KÅ. Localization of evoked potentials in the digastric, masseteric, supra- and intertrigeminal subnuclei of the cat. Exp Brain Res. 1976;26:299–318. doi: 10.1007/BF00234934. [DOI] [PubMed] [Google Scholar]
- 29.Landgren S, Olsson KÅ, Westberg K-G. Bulbar neurones with axonal projections to the trigeminal motor nucleus in the cat. Exp Brain Res. 1986;65:98–111. doi: 10.1007/BF00243833. [DOI] [PubMed] [Google Scholar]
- 30.Li Y-Q, Takada M, Kaneko T, Mizuno N. Premotor neurons for trigeminal motor nucleus neurons innervating the jaw-closing and jaw-opening muscles: differential distribution in the lower brain stem of the rabbit. J Comp Neurol. 1995;356:563–579. doi: 10.1002/cne.903560407. [DOI] [PubMed] [Google Scholar]
- 31.Lund JP. Mastication and its control by the brain stem. Crit Rev Oral Biol Med. 1991;2:33–64. doi: 10.1177/10454411910020010401. [DOI] [PubMed] [Google Scholar]
- 32.Lund JP, Sasamoto K, Murakami T, Olsson KÅ. Analysis of rhythmical jaw movements produced by electrical stimulation of motor-sensory cortex of rabbits. J Neurophysiol. 1984;52:1014–1029. doi: 10.1152/jn.1984.52.6.1014. [DOI] [PubMed] [Google Scholar]
- 33.McMillan AS, Hannam AG. Task dependence of human masseter motor unit reflex behaviour. Exp Brain Res. 1992;88:443–446. doi: 10.1007/BF02259119. [DOI] [PubMed] [Google Scholar]
- 34.Meessen H, Olszewski J. Cytoarchitectonisher Atlas des Rautenhirns des Kaninchens. Karger; Basel: 1949. [Google Scholar]
- 35.Mizuno N, Nomura S, Itoh K, Nakamura Y, Konishi A. Commissural interneurons for masticatory motoneurons: a light and electron microscope study using the horseradish peroxidase tracer technique. Exp Neurol. 1978;59:254–262. doi: 10.1016/0014-4886(78)90154-1. [DOI] [PubMed] [Google Scholar]
- 36.Morimoto T, Inoue T, Masuda Y, Nagashima T. Sensory components facilitating jaw-closing muscle activities in the rabbit. Exp Brain Res. 1989;76:424–440. doi: 10.1007/BF00247900. [DOI] [PubMed] [Google Scholar]
- 37.Morton DW, Chiel HJ. Neural architectures for adaptive behavior. Trends Neurosci. 1994;17:413–420. doi: 10.1016/0166-2236(94)90015-9. [DOI] [PubMed] [Google Scholar]
- 38.Nakamura Y, Katakura N. Generation of masticatory rhythm in the brainstem. Neurosci Res. 1995;23:1–19. [PubMed] [Google Scholar]
- 39.Nakamura Y, Kubo Y, Nozaki S, Takatori M. Cortically induced masticatory rhythm and its modification by tonic peripheral inputs in immobilized cats. Bull Tokyo Dent Univ. 1976;23:101–107. [PubMed] [Google Scholar]
- 40.Nozaki S, Iriki A, Nakamura Y. Localization of central rhythm generator involved in cortically induced rhythmical masticatory jaw-opening movement in the guinea pig. J Neurophysiol. 1986a;55:806–825. doi: 10.1152/jn.1986.55.4.806. [DOI] [PubMed] [Google Scholar]
- 41.Nozaki S, Iriki A, Nakamura Y. Role of corticobulbar projection neurons in cortically induced rhythmical masticatory jaw-opening movement in the guinea pig. J Neurophysiol. 1986b;55:826–845. doi: 10.1152/jn.1986.55.4.826. [DOI] [PubMed] [Google Scholar]
- 42.Nozaki S, Iriki A, Nakamura Y. Trigeminal premotor neurons in the bulbar reticular formation participating in induction of rhythmical activity of trigeminal motoneurons by repetitive stimulation of the cerebral cortex in the guinea pig. J Neurophysiol. 1993;69:595–608. doi: 10.1152/jn.1993.69.2.595. [DOI] [PubMed] [Google Scholar]
- 43.Olsson KÅ, Westberg K-G. Integration in trigeminal premotor interneurones in the cat. 2. Functional characteristics of neurones in the subnucleus-γ of the oral nucleus of the spinal trigeminal tract with a projection to the digastric motoneurone subnucleus. Exp Brain Res. 1991;84:115–124. doi: 10.1007/BF00231766. [DOI] [PubMed] [Google Scholar]
- 44.Olsson KÅ, Landgren S, Westberg K-G. Location of, and convergence on, the interneurone in the disynaptic path from the coronal gyrus of the cerebral cortex to the trigeminal motoneurones in the cat. Exp Brain Res. 1986a;65:83–97. doi: 10.1007/BF00243832. [DOI] [PubMed] [Google Scholar]
- 45.Olsson KÅ, Sasamoto K, Lund JP. Modulation of transmission in rostral trigeminal sensory nuclei during chewing. J Neurophysiol. 1986b;55:56–75. doi: 10.1152/jn.1986.55.1.56. [DOI] [PubMed] [Google Scholar]
- 46.Olsson KÅ, Lund JP, Valiquette C, Veilleux D. Activity during mastication of periodontal mechanosensitive neurons of the trigeminal subnucleus oralis of the rabbit. J Neurophysiol. 1988;59:341–357. doi: 10.1152/jn.1988.59.2.341. [DOI] [PubMed] [Google Scholar]
- 47.Rossignol S. Neural control of stereotypic limb movements. In: Rowell LB, Shepherd JT, editors. Handbook of physiology, Section 12. Am Physiol Soc; New York: 1996. pp. 173–216. [Google Scholar]
- 48.Schwartz G, Enomoto S, Valiquette C, Lund JP. Mastication in the rabbit: a description of movement and muscle activity. J Neurophysiol. 1989;62:273–287. doi: 10.1152/jn.1989.62.1.273. [DOI] [PubMed] [Google Scholar]
- 49.Scott G, Westberg K-G, Olsson KÅ, Lund JP. Role of medial pontobulbar reticular formation neurones in patterning mastication. J Dent Res. 1997;76:124. [Google Scholar]
- 50.Shigenaga Y, Okamoto T, Nishimori T, Suemune S, Nasution ID, Chen IC, Tsuru K, Yoshida A, Tabuchi K, Hosoi M, Tsuru H. Oral and facial representation in the trigeminal principal and rostral spinal nuclei of the cat. J Comp Neurol. 1986;244:1–18. doi: 10.1002/cne.902440102. [DOI] [PubMed] [Google Scholar]
- 51.Soffe SR. Two distinct rhythmic motor patterns are driven by common premotor and motor neurons in a simple vertebrate spinal cord. J Neurosci. 1993;13:4456–4469. doi: 10.1523/JNEUROSCI.13-10-04456.1993. [DOI] [PMC free article] [PubMed] [Google Scholar]
- 52.Stålberg E, Eriksson PO. A scanning electromyographic study of the topography of human masseter single motor units. Arch Oral Biol. 1987;32:793–797. doi: 10.1016/0003-9969(87)90005-7. [DOI] [PubMed] [Google Scholar]
- 53.Thexton AJ, Hiiemae KM, Crompton AW. Food consistency and bite size as regulators of jaw movement during feeding in the cat. J Neurophysiol. 1980;44:456–474. doi: 10.1152/jn.1980.44.3.456. [DOI] [PubMed] [Google Scholar]
- 54.Torvik A. Afferent connections to the sensory trigeminal nuclei, the nucleus of the solitary tract and adjacent structures. J Comp Neurol. 1956;106:51–142. doi: 10.1002/cne.901060104. [DOI] [PubMed] [Google Scholar]
- 55.Travers JB, Norgren R. Afferent projections to the oral motor nuclei in the rat. J Comp Neurol. 1983;220:280–298. doi: 10.1002/cne.902200303. [DOI] [PubMed] [Google Scholar]
- 56.Turman JE, Chandler SH. Immunohistochemical localization of glutamante and glutaminase in guinea pig trigeminal premotoneurons. Brain Res. 1994a;634:49–61. doi: 10.1016/0006-8993(94)90257-7. [DOI] [PubMed] [Google Scholar]
- 57.Turman JE, Chandler SH. Immunohistochemical evidence for GABA and glycine-containing trigeminal premotoneurons in the guinea pig. Synapse. 1994b;18:7–20. doi: 10.1002/syn.890180103. [DOI] [PubMed] [Google Scholar]
- 58.Weijs WA, Dantuma R. Functional anatomy of the masticatory apparatus in the rabbit (Oryctolagus cuniculus L.). Neth J Zool. 1981;31:99–147. [Google Scholar]
- 59.Weijs WA, Juch PJW, Kwa SHS, Korfage JAM. Motor unit territories and fiber types in rabbit masseter muscle. J Dent Res. 1993;72:1491–1498. doi: 10.1177/00220345930720110601. [DOI] [PubMed] [Google Scholar]
- 60.Westberg K-G, Olsson KÅ. Integration in trigeminal premotor interneurones in the cat. 1. Functional characteristics of neurones in the subnucleus-γ of the oral nucleus of the spinal trigeminal tract. Exp Brain Res. 1991;84:1102–114. doi: 10.1007/BF00231765. [DOI] [PubMed] [Google Scholar]
- 61.Westberg K-G, Clavelou P, Valiquette C, Lepage S, Lund JP, Jasper HH. Evidence for functional partitioning within the masticatory pattern generator network. Soc Neurosci Abstr. 1994;781:1. [Google Scholar]
- 62.Westberg K-G, Sandström G, Olsson KÅ. Integration in trigeminal premotor interneurones in the cat. 3. Input characteristics and synaptic actions of neurones in subnucleus-γ of the oral nucleus of the spinal trigeminal tract with a projection to the masseteric motoneurone subnucleus. Exp Brain Res. 1995;104:449–461. doi: 10.1007/BF00231979. [DOI] [PubMed] [Google Scholar]
- 63.Westberg K-G, Clavelou P, Schwartz G, Lund JP. Effects of chemical stimulation of masseter muscle nociceptors on trigeminal motoneuron and interneuron activities during fictive mastication in the rabbit. Pain. 1997;73:295–308. doi: 10.1016/S0304-3959(97)00103-6. [DOI] [PubMed] [Google Scholar]
- 64.Yasui Y, Itoh K, Mitani A, Takada M, Mizuno N. Cerebral cortical projections to the reticular regions around the trigeminal motor nucleus in the cat. J Comp Neurol. 1985;241:348–356. doi: 10.1002/cne.902410308. [DOI] [PubMed] [Google Scholar]
- 65.Yoshida A, Yasuda K, Dostrovsky JO, Bae YC, Takemura M, Shigenaga Y, Sessle BJ. Two major types of premotoneurons in the feline trigeminal nucleus oralis as demonstrated by intracellular staining with horseradish peroxidase. J Comp Neurol. 1994;346:1–20. doi: 10.1002/cne.903470403. [DOI] [PubMed] [Google Scholar]
- 66.Zar JH. Biostatistical analysis. Prentice-Hall; New Jersey: 1996. [Google Scholar]