

Abstract
By affecting the activity of the adaptation motor, Ca2+ entering a hair bundle through mechanoelectrical transduction channels regulates the sensitivity of the bundle to stimulation. For adaptation to set the position of mechanosensitivity of the bundle accurately, the free Ca2+ concentration in stereocilia must be tightly controlled. To define the roles of Ca2+-regulatory mechanisms and thus the factors influencing adaptation motor activity, we used confocal microscopy to detect Ca2+ entry into and clearance from individual stereocilia of hair cells dialyzed with the Ca2+ indicator fluo-3. We also developed a model of stereociliary Ca2+ homeostasis that incorporates four regulatory mechanisms: Ca2+clearance from the bundle by free diffusion in one dimension, Ca2+ extrusion by pumps, Ca2+binding to fixed stereociliary buffers, and Ca2+binding to mobile buffers. To test the success of the model, we compared the predicted profiles of fluo-3 fluorescence during the response to mechanical stimulation with the fluorescence patterns measured in individual stereocilia. The results indicate that all four of the Ca2+ regulatory mechanisms must be included in the model to account for the observed rate of clearance of the ion from the hair bundle. The best fit of the model suggests that a free Ca2+ concentration of a few micromolar is attained near the adaptation motor after transduction-channel opening. The free Ca2+ concentration substantially rises only in the upper portion of the stereocilium and quickly falls toward the resting level as adaptation proceeds.
Keywords: auditory system, bullfrog, Ca2+-ATPase, Ca2+ buffer, hair bundle, mechanoelectrical transduction, vestibular system
Vertebrate hair cells activate neurons in response to mechanical stimuli such as sound and acceleration. Mechanoelectrical transduction occurs in the hair bundle, which comprises stepped ranks of actin-filled stereocilia and usually includes one true cilium, the kinocilium (Lewis et al., 1985). Mechanically gated channels located within 1 μm of the stereociliary tips (Jaramillo and Hudspeth, 1991; Lumpkin and Hudspeth, 1995) mediate transduction.
The prevailing model of mechanoelectrical transduction (for review, seeHudspeth, 1989; Gillespie, 1995) posits that the open probability of the channels is controlled by elastic gating springs, which are likely the tip links that connect neighboring stereocilia (Pickles et al., 1984; Assad et al., 1991). Each tip link is attached to a few transduction channels (Holton and Hudspeth, 1986; Howard and Hudspeth, 1988), perhaps just one or two (Denk et al., 1995; Ricci and Fettiplace, 1997). Positive displacement of a hair bundle, toward its tall edge, increases tip-link tension and opens these channels. The influx of cations, mostly K+ but also Ca2+ and Na+, depolarizes the plasma membrane of the hair cell, leading to increased synaptic transmission at the basolateral surface of the cell (for review, seeHoward et al., 1988). Negative bundle displacement reduces tip-link tension, allowing closure of the transduction channels that are open at rest (Corey and Hudspeth, 1983a; Crawford et al., 1991; Shepherd and Corey, 1994).
Like other sensory receptors, hair cells adjust their sensitivity to stimulation (for review, see Hudspeth and Gillespie, 1994; Gillespie and Corey, 1997). This adaptive process is mediated by an adaptation motor that is thought to consist of myosin Iβ molecules (Gillespie et al., 1993; Metcalf et al., 1994; Solc et al., 1994) and that regulates tip-link tension and thus transduction- channel open probability by moving along the actin-filled stereociliary core (Howard and Hudspeth, 1987). The activity of the motor is influenced by the free Ca2+ concentration (Eatock et al., 1987; Assad et al., 1989; Crawford et al., 1989, 1991; Hacohen et al., 1989), by tip-link tension (Assad and Corey, 1992), and perhaps by cAMP (Ricci and Fettiplace, 1997). Calmodulin molecules, which serve as myosin Iβ light chains (Reizes et al., 1994), probably confer the Ca2+ sensitivity of the adaptation motor (Walker and Hudspeth, 1996). Because of its critical role in adaptation, the free Ca2+ concentration near the adaptation motor must be determined if the sensitivity of the bundle to stimulation is to be understood.
The stereocilium offers an advantageous system in which to examine the regulation of free Ca2+ concentration in a living cell. Because of the narrow, cylindrical form of a stereocilium, diffusion along its length is well approximated by a one-dimensional model. The transduction channel near the tip of the stereocilium and the soma at its base serve as a Ca2+ point source and a sink, respectively. Furthermore, the stereocilium lacks membrane-bounded organelles that can imbibe Ca2+. Finally, individual stereocilia can be imaged along their lengths with high spatial and temporal resolution. To examine Ca2+ homeostasis in hair bundles, we have used confocal microscopy to collect images of stereocilia filled with the Ca2+ indicator fluo-3 and have fit these responses with a mathematical model of intracellular Ca2+regulation.
MATERIALS AND METHODS
Hair-cell isolation. Experiments were performed at room temperature on hair cells isolated from saccular maculae of the bullfrog Rana catesbeiana. Each internal ear was dissected in oxygenated low-Ca2+ saline solution containing 110 mm Na+, 2 mmK+, 0.1 mm Ca2+, 110 mm Cl−, 3 mmd-glucose, and 5 mm HEPES at pH 7.25. After removal of the tissue overlying the saccular nerve, the ear was incubated for 15 min in the same solution supplemented with 1 mm EGTA and 1 mm MgCl2. Because any leakage of otoconia prevented cellular dissociation, care was taken to preserve the integrity of the otoconial sac through this step. After dissection from the labyrinth, the saccular macula was digested for 20 min with 50 μg·ml−1 subtilisin Carlsberg (protease type XXIV; Sigma, St. Louis, MO) and then for 5 min with 50 μg·ml−1 deoxyribonuclease I (type II; Sigma). After a 5 min recuperation period in low-Ca2+ saline solution, the otolithic membrane was lifted from the hair bundles, and hair cells were dissociated with an eyelash. After the cells had settled onto a concanavalin A-coated coverslip, the medium was replaced with oxygenated standard saline solution containing 110 mmNa+, 2 mm K+, 4 mm Ca2+, 118 mmCl−, 3 mmd-glucose, and 5 mm HEPES at pH 7.25.
Loading hair cells with fluo-3 AM. To retain endogenous mobile Ca2+ buffers in some hair cells, we loaded these hair cells with membrane-permeant fluo-3 AM (Molecular Probes, Eugene, OR). Each day of use, we made a fresh stock solution of 0.23% (w/v) fluo-3 AM and 20% (w/v) Pluronic F-127 in dimethylsulfoxide (DMSO; Molecular Probes). Two fluo-3 AM–loading solutions, which contained <0.4% (v/v) DMSO, were then prepared from the stock: 3.33 μm fluo-3 AM in low-Ca2+ saline solution and 6.67 μmfluo-3 AM in standard saline solution. Two preparative steps were critical for adequately loading hair cells. First, all reagents were brought to room temperature before mixing. Second, the fluo-3 AM stock solution and all fluo-3 AM aqueous solutions were vortexed vigorously for at least 1 min and then sonicated in a bath sonicator for 1 min. To prepare each loading solution, we initially diluted 10 μl of the fluo-3 AM stock solution into 100 μl of the appropriate saline solution, then added saline solution to reach the desired concentration of fluo-3 AM.
To load hair cells with fluo-3 AM, we used low-Ca2+saline solution containing 3.33 μm fluo-3 AM during and after the deoxyribonuclease treatment of the isolation procedure. After cellular isolation, the low-Ca2+ solution with fluo-3 AM was exchanged for standard saline solution containing 6.67 μm fluo-3 AM. After a 15–20 min incubation, this solution was replaced with standard saline solution.
To determine the approximate concentration of de-esterified fluo-3 in cells loaded with fluo-3 AM, we used the Ca2+ionophore A23187 at 2.5 μm (Molecular Probes) in standard saline solution to increase the intracellular Ca2+concentration at the end of each experiment (Kao, 1994). We compared the maximal hair-bundle fluorescence of hair cells treated in this manner with that of cells dialyzed through whole-cell recording pipettes with different concentrations of the pentapotassium salt of fluo-3 (lot number 2641-5; Molecular Probes). Using confocal microscopy, we collected an image of each hair bundle in the focal plane at which the fluorescence was greatest. To quantify the fluorescence, we averaged the intensities of pixels within a region encompassing only the hair bundle. Because images were often acquired at different confocal gain settings, these intensity values were normalized by the gain so that data from multiple cells could be averaged. To normalize an image, we subtracted the background intensity in grayscale units from each intensity value. The resultant value was then divided by the gain of the confocal system expressed on a linear scale. The maximal hair-bundle fluorescence of fluo-3 AM–loaded cells (529 ± 31 arbitrary intensity units; mean ± SE;n = 44) was closely matched by that of cells dialyzed with 0.1 mm fluo-3 (532 ± 72 arbitrary intensity units; n = 14).
Electrophysiological recording. While the membrane potential of each hair cell was held at −70 mV with a voltage-clamp amplifier (EPC-7; List Electronics, Darmstadt, Germany), the transmembrane current was measured by either the tight-seal, whole-cell or the perforated-patch recording technique (Marty and Neher, 1995; Walz, 1995). Before seal formation, the resistances of the recording electrodes were 2.5–4 MΩ. To lower its capacitance, we coated the shank of each recording electrode with beeswax (The Pottery Barn, New York, NY). Two internal solutions were used for whole-cell recordings. The first, which included the pentapotassium salt of fluo-3 at either 0.1 or 0.5 mm, contained 106 mmCs+, 4 mm Na+, 3 mm Mg2+, 106 mmCl−, 2 mm ATP, and 5 mmHEPES at pH 7.26. The second internal solution consisted of 0.2 mm fluo-3, 102 mm Cs+, 4 mm Na+, 1 mmK+, 2 mm Mg2+, 104 mm Cl−, 1 mm ATP, and 5 mm HEPES at pH 7.3. When noted, the second internal solution included 1 mm EGTA, a Ca2+chelator.
For perforated-patch recordings, we dissolved nystatin (Sigma) in DMSO at a concentration of 50 mg/ml each day of use. Recording electrodes were tip-filled for ∼1 sec with an internal solution containing 102 mm Cs+, 3 mmMg2+, 36 mm Cl−, 35 mm SO42−, and 5 mm HEPES at pH 7.28 and then back-filled with the same solution containing 200 μg/ml nystatin. The internal solution contained 0.4% (v/v) DMSO. After a tight seal had formed on the soma of the cell, an access resistance of <20 MΩ was usually achieved in 2–20 min.
To elicit Ca2+ entry through transduction channels, we deflected a hair bundle using a glass micropipette attached by gentle suction to the kinociliary bulb. The pipette was displaced using a piezoelectric stimulator (P-835.10 and P-870; Physik Instrumente, Waldbronn, Germany). To prevent excitation of the mechanical resonance of the stimulator, we filtered the driving signal with an eight-pole Bessel filter whose half-power frequency was set at 0.35–0.50 kHz.
The control signals for the voltage-clamp amplifier, piezoelectric stimulator, and confocal-scanning system were supplied by a computer programmed in LabVIEW (version 3.1; National Instruments Corporation, Austin, TX). Signals were low-pass filtered with an eight-pole Bessel filter set at either 1 or 10 kHz and then were digitized and recorded with the computer system at a sampling frequency of 5 or 30 kHz, respectively. Data filtered at 10 kHz were subsequently filtered digitally at 1 kHz.
Confocal microscopy. As described previously (Lumpkin and Hudspeth, 1995), fluo-3–loaded hair cells were visualized simultaneously through epifluorescence and transmitted differential-interference-contrast optics with a laser-scanning confocal-imaging system (LSM-410UV; Carl Zeiss, Jena, Germany). Hair cells dialyzed with 0.1 or 0.5 mm fluo-3 or those loaded with fluo-3 AM were visualized with a 63×, plan-apochromat, oil-immersion objective lens of numerical aperture 1.4. One response (see Fig. 4C) was instead obtained with a 40×, C-apochromat, water-immersion objective lens of numerical aperture 1.2. Hair cells filled with 0.2 mm fluo-3 were imaged with a 63×, plan-neofluar, oil-immersion objective lens of numerical aperture 1.25. With these lenses, the axial resolution of the confocal system, measured as the distance between half-maximal points on the intensity profile of a 100 nm bead, was ∼0.8 μm. The lateral resolution was 0.4 μm by the same criterion. These values were determined using a pinhole aperture of 22.8 μm (setting 13), which was the same as that used for all experimentation. Given the lateral resolution of the microscope and the stereociliary spacing, the stereocilia above and below the plane of focus usually contributed little to the fluorescence signal of a hair bundle (Lumpkin and Hudspeth, 1995).
Fig. 4.

Best fits to fluorescence data from stereocilia under different mobile-buffering conditions. A, In a cell dialyzed with 0.2 mm fluo-3 and 1 mm EGTA, the predicted fluorescence traces (solid line) fit well the experimental fluorescence intensities (squares) in four compartments; only compartments 2, which contained the transduction channel in the model, and 6 are shown. The parameter values used in calculating this fit were L = 4.27 μm, sensitivity = 731, iREST = −6 pA, iMAX = −133 pA,iADAPT = −10 pA, τPOS = 10 msec, τNEG = 100 msec, and CaSOMA = 0.085 μm. B, In a cell dialyzed with 0.5 mm fluo-3, the model adequately predicted the baseline, rise, and fall of the fluorescence signal in four compartments but slightly underestimated the peak fluorescence in compartment 2, which contained the transduction channel. The parameter values used in calculating this fit were L = 4.17 μm, sensitivity = 497, iREST = −4 pA,iMAX = −108 pA,iADAPT = −10 pA, τPOS = 20 msec, τNEG = 30 msec, and CaSOMA = 0.019 μm. C, The model also performed well in fitting the responses from another cell filled with 0.5 mmfluo-3 but with single transduction channels situated in both compartments 1 and 2. The parameter values used in calculating this fit were L = 4.37 μm, sensitivity = 185,iREST = −4 pA,iMAX = −160 pA,iADAPT = −20 pA, τPOS = 7 msec, τNEG = 20 msec, and CaSOMA = 0.079 μm.
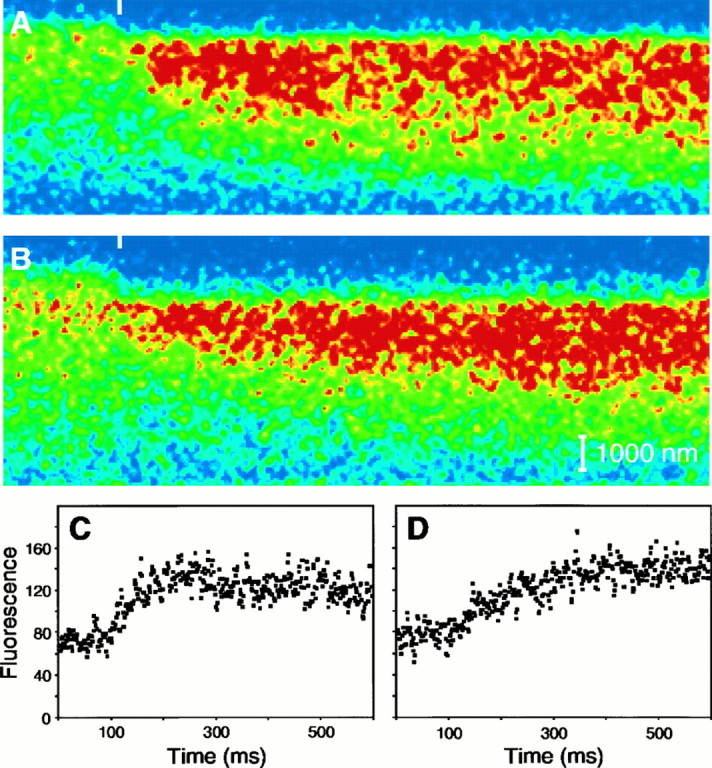
The line-scan mode of the confocal microscope was used to follow fluorescence changes in individual stereocilia. We first collected frame-scan images of each hair cell to determine the best focal plane and confocal-system gain setting for imaging. We chose a focal plane in which a stereocilium containing an active transduction channel could be imaged along its entire extent. To locate stereocilia containing active transduction channels, we looked for tip blushes or heightened fluorescence near stereociliary tips caused by transduction channel opening at rest (Lumpkin and Hudspeth, 1995). In most cases, fewer than half of the stereocilia contained active channels. After such a stereocilium had been identified, a transect along its length and into the soma was specified by means of the confocal system’s software (see Fig. 1A). For collection of a line-scan image, a diffraction-limited spot of illumination was repeatedly swept along the entire length of the transect at 1.4 msec intervals; 2.8 sec of data were typically collected for each line-scan image. During image acquisition, the hair bundle was displaced 200 nm for 100 msec to open transduction channels and to allow Ca2+ influx. When the transect was properly positioned, the same stereocilium was scanned before, during, and after the hair-bundle deflection. Unless noted, the images included in this study represent the first or second line-scan image acquired from each stereocilium, which was usually collected 100–200 sec after the onset of whole-cell recording.
Fig. 1.

Line-scan protocol. A, A merged differential-interference-contrast and fluorescence image portrays the undisturbed hair bundle of a hair cell dialyzed with 0.2 mmfluo-3. The diagonal white line marks the transect of illumination during line-scan imaging. The stimulus micropipette attached to the kinociliary bulb (upper right) was used to deflect the hair bundle. B, In this fluorescence line-scan image, the ordinate represents distance from above the stereociliary tip (top) to the cuticular plate (bottom); time increases to the rightalong the abscissa. The colors of individual pixels depict fluo-3 fluorescence intensity; the 128-color scale ranges fromblue, which corresponds to 3 grayscale units, tored, which corresponds to 130–234 grayscale units. During line-scan imaging, a hair-bundle deflection elicited Ca2+ influx, which was visualized as increased fluorescence intensity in the top half of the stereocilium. The 200 nm, 100 msec positive displacement pulse, indicated in temporal register with the 500 msec line-scan image, elicited a peak whole-cell response of −108 pA (see Fig. 4B). The stereocilium was divided into nine compartments, four of which are indicated by theboxes overlying the line-scan image. C, To compare the fluorescence data with a model of Ca2+ homeostasis, we generated plots of fluorescence intensity versus time for compartments 2, 4, 6, and 8 (C2–C8) by averaging for each time point the intensities of the pixels within the respective compartments. Fluorescence intensity was measured on a scale of 256 grayscale units. Five hundred milliseconds of data are plotted; the displacement began at 100 msec.
When recording from fluo-3 AM–loaded hair cells and the associated control cells, we typically delivered 300 nm, 500 msec hair-bundle deflections. Instead of imaging single stereocilia along their lengths, we usually detected transduction in multiple stereocilia simultaneously by scanning nearly perpendicular to their long axes (see Fig.6A). To do so, we set the transect of illumination within 1 μm of the tip of the shortest stereocilium, at an angle of <12° with respect to the top of the cuticular plate. In such line-scan images, each stereocilium in the optical slice was scanned at a slightly different distance from its tip. As a result, the fluorescence increase during stimulation was first observable in short stereocilia and then in successively taller ones (Denk et al., 1995).
Fig. 6.

Immobilization of fluo-3 in a hair bundle after repeated line-scan imaging. A, In a fluorescence image of the unstimulated hair bundle of a cell dialyzed with 0.5 mm fluo-3, the horizontal white line marks the transect of illumination during line-scan imaging. Note the tip blushes in the shortest and second tallest stereocilia in this optical section. B, After the acquisition of nine line-scan images, a stripe of increased fluorescence intensity betrayed the position of line-scan imaging. The enhanced fluorescence persisted even after cell death, suggesting that fluo-3 had been permanently immobilized in the stereocilia. The gain of the confocal system forA was fivefold that for B.
Image processing. Fluorescence and differential-interference-contrast images were merged into a single image (see Fig. 1A) with Photoshop (version 3.0; Adobe Systems, Mountain View, CA). All other image processing and analysis were accomplished by use of NIH Image (version 1.59; National Institutes of Health, Bethesda, MD). Before processing, images were smoothed with a three-by-three filter, which introduced a spread in the time domain of <0.5 msec. The images (see Figs. 1, 6, 7) were contrast-enhanced for optimal reproduction during publication.
Fig. 7.
Effect of endogenous Ca2+buffers on experimental fluorescence profiles. A,B, In line-scan images of individual stereocilia, increased fluorescence during hair-bundle deflection spread faster in a cell dialyzed with 0.1 mm fluo-3 through a recording pipette (A) than in a cell loaded with a comparable amount of fluo-3 AM (B). The beginning of a 500 msec hair-bundle deflection is indicated by the white tick marks at the top of A andB. The line-scan image in A was the fourth obtained from one stereocilium, whereas that in Bwas the second from another. The 128-color scale extends fromblue, which corresponds to 4 grayscale units, tored, which corresponds to 60–135 grayscale units. The scale bar in B also applies to A.C, D, To quantify the time course of mechanically stimulated fluorescence increases, we plotted normalized intensity versus time for hair bundles imaged nearly perpendicular to the long axes of the stereocilia; fluorescence was expressed in arbitrary intensity units. C, For a different cell dialyzed with 0.1 mm fluo-3, the rise time of the plot to half-maximal fluorescence t1/2 was 25 msec.D, Although the magnitude of the fluorescence increase was similar in a fluo-3 AM–loaded hair cell, thet1/2 of the fluorescence increase was 95 msec. The 500 msec hair-bundle deflections began at 100 msec inC and D.
Fluorescence intensity is plotted on one of three scales in this paper. For some plots (see Figs. 1, 3-5) and images (see Fig. 6), fluorescence is displayed on a scale of 256 grayscale units corresponding to the output of the eight-bit detector of the confocal system. Other images (see Figs. 1, 7) are displayed on a color scale with 128 units ranging from blue to red. Other fluorescence plots (see Fig. 7C,D) were normalized by the gain setting of the confocal system so that the fluorescence intensities could be compared directly; a scale of 200 arbitrary intensity units is used.
Fig. 3.
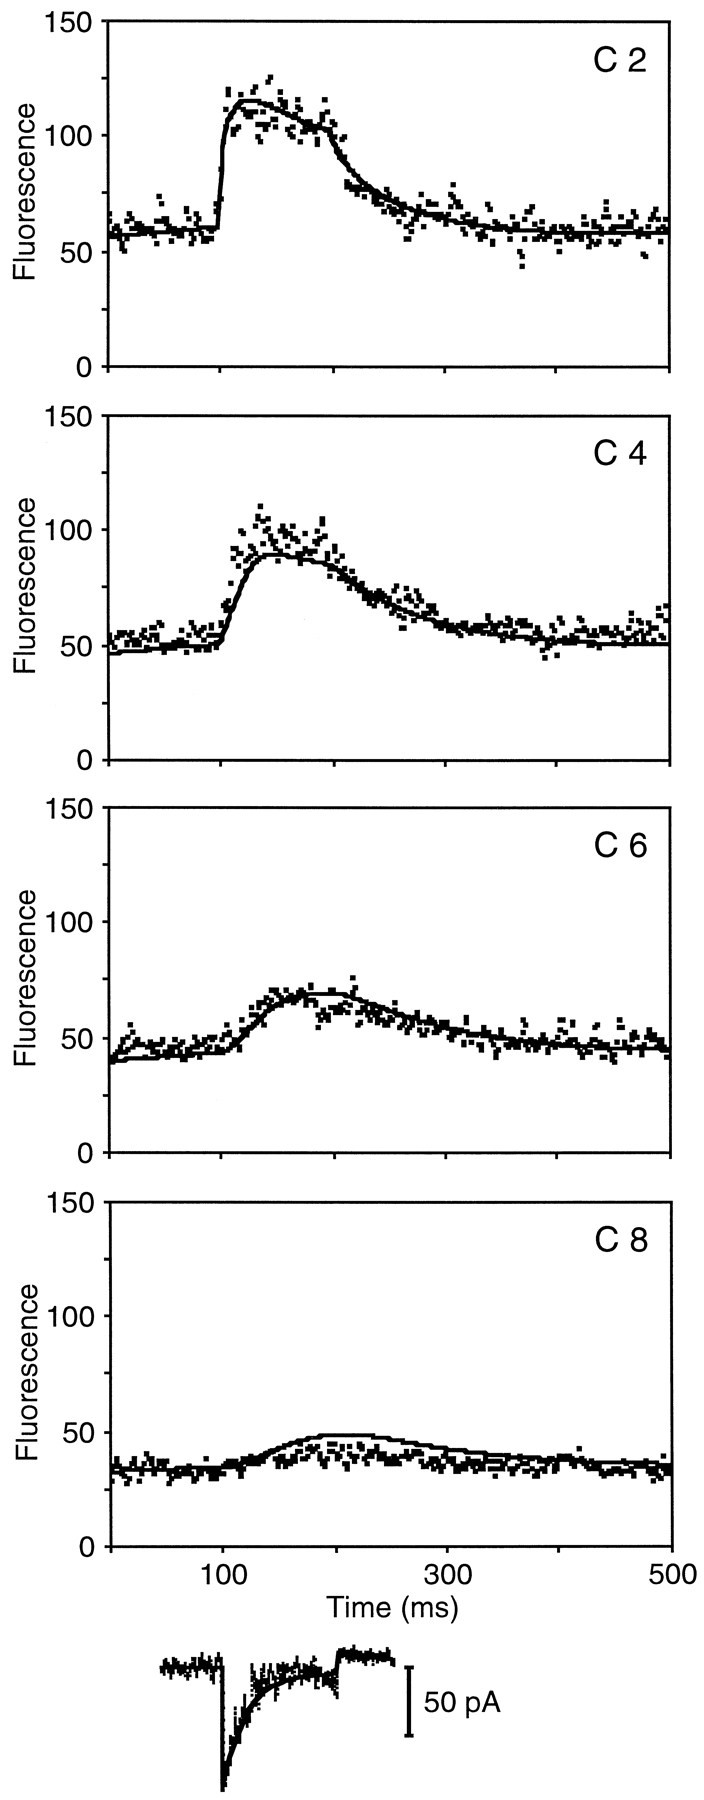
Comparison of experimental fluorescence data and the predicted fluorescence profiles of the model. In this and subsequent comparisons, a 200 nm hair-bundle deflection began at 100 msec and ended at 200 msec. Below the fluorescence data are shown the whole-cell current response recorded during the displacement (thin trace) and a fit (superimposed thick line) that includes the estimated transduction and Ca2+pump currents. The estimated transduction current was used to specify the transduction-channel open probability in the model. In a hair cell dialyzed with 0.2 mm fluo-3, the experimental fluo-3 fluorescence (squares) in compartment 2 doubled within 10 msec of hair-bundle deflection; the peak intensities and rates of increase in compartments 4–8 were progressively lower. As adaptation proceeded, the fluorescence in compartments 2 and 4 fell slightly. After the deflection ended, the fluorescence in all compartments returned to baseline within 200 msec. For the best fit of the model to these data, the predicted fluorescence profiles (solid lines) fit the baseline fluorescence and the rise and fall of fluorescence in four compartments; the peak fluorescence was slightly underestimated in compartment 4, however, and overestimated in compartment 8. The squared error for this fit was 6 square units; the parameter values used are listed in Table 1. The timescale for compartment 8 applies to all compartments.
Fig. 5.

Effects of removing Ca2+ pumps or fixed buffers from the model. The experimental data (squares) are the same as that shown in Figure 3.A, When Ca2+ pumps were removed from the model, the best attainable fit (solid line) underestimated the peak fluorescence in compartment 2, and the time course of the fall of the predicted fluorescence trace was slower than that of the experimental data. In the lower half of the stereocilium, including compartment 6, the peak fluorescence was overestimated. The squared error for this fit was 24 square units. The parameter values used in calculating this fit were the same as those listed in Table 1, except that pump density = 0 μm−2 and sensitivity = 332. B, When the fixed buffer was removed from the model, the fit overestimated the peak fluorescence in compartments without the transduction channel, and the rise and fall of the predicted fluorescence traces were faster than that observed experimentally. The squared error for this fit was 44 square units. The parameter values used in calculating this fit were the same as those listed in Table 1, except that [F]TOTAL = 0 mm and sensitivity = 447.
To constrain the Ca2+-regulation model, we first determined the length of each stereocilium from the line-scan image. After plotting average intensity versus distance for the data collected during hair-bundle deflection, we defined the tip of the stereocilium as the distal point at which the maximal fluorescence intensity fell by one-half. The lengths of the stereocilia used in this investigation ranged from 4.11 to 6.08 μm and averaged 4.74 μm.
After its length had been quantified, each stereocilium was divided into compartments for comparison with the Ca2+-regulation model. The bottom two compartments, each of which was 0.5 μm in length, represented the taper. The remainder of the stereocilium was ordinarily divided into seven equal compartments, each of which was ∼0.5 μm in length. For four compartments, the pixels within each compartment at each time point were averaged to yield plots of fluorescence intensity versus time.
To quantify the time course of the fluorescence change in an image from a line scan oriented nearly perpendicular to the long axis of a stereocilium, we constructed a plot of intensity versus time by averaging the intensity of all pixels representing the hair bundle along the transect of illumination. The plot was normalized by the gain of the confocal system, after which the rise time to half-maximal fluorescence was determined. This rise time was related to the rate of fluorescence spread down the individual stereocilia.
RESULTS
Detection of Ca2+ influx in individual stereocilia
To characterize Ca2+ homeostasis in the hair bundle, we used laser-scanning confocal microscopy to detect changes in Ca2+ concentration in individual stereocilia of hair cells dialyzed with fluo-3. After a stereocilium containing an active transduction channel had been identified (Fig.1A), the confocal system repeatedly scanned the length of the stereocilium. During the acquisition of the line-scan image, the hair bundle was deflected to elicit Ca2+ entry through transduction channels (Fig. 1B); the resulting whole-cell current response was also recorded. This Ca2+ influx was accompanied by an increase in fluo-3 fluorescence intensity that began near the tip of the stereocilium (Lumpkin and Hudspeth, 1995) and progressed approximately halfway down its length. After the 100 msec bundle deflection ended, the fluorescence quickly approached its baseline level.
We analyzed the time course of the fluorescence change accompanying mechanoelectrical transduction by dividing the stereocilium into nine compartments and plotting the fluorescence intensity versus time for compartments 2, 4, 6, and 8 (Fig. 1C). In compartment 2, which was near the stereociliary tip, the fluorescence intensity tripled within milliseconds of the onset of the hair-bundle displacement and then began to fall as adaptation proceeded. By contrast, both the magnitude and rate of the intensity increase were lower in compartments located closer to the base of the stereocilium, confirming that the site of Ca2+ entry was situated near the stereociliary tip (Hudspeth, 1982; Jaramillo and Hudspeth, 1991; Denk et al., 1995; Lumpkin and Hudspeth, 1995). In all compartments with detectable fluorescence increases, the intensity returned to its resting level within 200 msec of the end of the positive displacement.
A model of stereociliary Ca2+ homeostasis
To represent the cellular mechanisms determining the time course of Ca2+ influx and efflux in stereocilia, we constructed a one-dimensional computational model of Ca2+ homeostasis that included five processes that might affect the free Ca2+ concentration of the stereocilium (Fig. 2): Ca2+ influx through transduction channels, simple diffusion, extrusion by Ca2+ pumps, buffering by a fixed Ca2+ buffer F, and buffered diffusion in conjunction with an indicator I and a mobile Ca2+buffer B. The components, simplifying assumptions, and implementation of the model are discussed in the ; the parameters of the model and representative values are listed in Table1.
Fig. 2.

Model of Ca2+ regulation in a stereocilium. In the one-dimensional diffusion model of Ca2+ homeostasis, the shaft of the stereocilium comprised seven compartments (compartments 1–7), whereas the taper was represented by two 0.5 μm compartments (compartments 8 and 9). For the stereocilia included in this study, the first seven compartments were also ∼0.5 μm in length. The soma was represented as a single compartment in which the concentrations of free Ca2+and of mobile buffers were held constant. Ca2+entered through a transduction channel located in compartment 1 or 2. Ca2+ could be removed from the stereocilium by simple diffusion down its concentration gradient, extrusion by Ca2+ pumps, or buffered diffusion complexed to either fluo-3 or EGTA. Alternatively, Ca2+ could bind to a fixed stereociliary buffer. For each compartment, such as compartment 2 in the figure, these various processes were represented by seven differential equations.
Table 1.
Model parameters and typical values
| Parameter | Definition | Value | Reference |
|---|---|---|---|
| n | Number of compartments in a stereocilium | 9 | |
| sensitivity* | Gain of the confocal system | 518 | |
| dark signal† | Intensity value of a confocal image collected without illumination | 18 | |
| fluo-3 ratio§ | Fluorescence ratio of free to Ca2+-bound fluo-3 | 0.029 | |
| tSTIM† | Duration of stimulus | 100 msec | |
| iREST† | Resting whole-cell transduction current | −9 pA | |
| iMAX† | Peak whole-cell transduction current | −105 pA | |
| iADAPT† | Whole-cell transduction current adaptation plateau | −15 pA | |
| τPOS† | Time constant of exponential adaptation during the positive deflection | 20 msec | |
| τNEG† | Time constant of exponential adaptation after the positive deflection | 200 msec | |
| γ§ | Single-channel conductance | 100 pS | Crawford et al., 1991 |
| fCa§ | Fraction of transduction current borne by Ca2+ | 0.23 | Lumpkin et al., 1997 |
| channelC1* | Number of channels in compartment 1 | 0 | |
| channelC2¶ | Number of channels in compartment 2 | 1 | |
| VM§ | Membrane holding potential | −70 mV | |
| ER§ | Reversal potential of transduction current | 0 mV | Corey and Hudspeth, 1979 |
| L† | Length of the stereocilium | 4.11 μm | |
| diameter§ | Diameter of the stereocilium | 0.45 μm | Jacobs and Hudspeth, 1990 |
| LTAPER§ | Length of the stereociliary taper | 1 μm | Jacobs and Hudspeth, 1990 |
| diameterTAPER§ | Diameter of the stereociliary taper | 0.18 μm | |
| CaSOMA* | Somatic free Ca2+ concentration | 0.048 μm | |
| [I]TOTAL† | Total concentration of indicator (fluo-3) | 0.2 mm | |
| kON,I§ | ON rate for Ca2+ binding to indicator (fluo-3) | 1.375·109m−1·sec−1 | Eberhard and Erne, 1989 |
| kOFF,I§ | OFF rate for Ca2+ binding to indicator (fluo-3) | 550 sec−1 | Eberhard and Erne, 1989 |
| [B]TOTAL† | Total concentration of mobile buffer (EGTA) | 0 mm | |
| kON,B | ON rate for Ca2+binding to mobile buffer (EGTA) | 1.5·106m−1·sec−1 | Smith et al., 1984 |
| [F]TOTAL¶ | Total concentration of fixed buffer | 0.61 mm | |
| kON,F¶ | ON rate for Ca2+ binding to fixed buffer | 1.375·109m−1·sec−1 | |
| kOFF,B§ | OFF rate for Ca2+ binding to mobile buffer (EGTA) | 0.3 sec−1 | Smith et al., 1984 |
| kOFF,F¶ | OFF rate for Ca2+ binding to fixed buffer | 283 sec−1 | |
| DCa§ | Diffusion coefficient of Ca2+ in water | 8.0·10−10m2·sec−1 | Vanysek, 1996 |
| DI§ | Diffusion coefficient of free and Ca2+-bound indicator (fluo-3) | 1.2·10−10m2·sec−1 | Hall et al., 1997 |
| DB¶ | Diffusion coefficient of free and Ca2+-bound mobile buffer (EGTA) | 1.2·10−10m2·sec−1 | |
| KM§ | Michaelis constant for a Ca2+ pump molecule | 0.5 μm | Carafoli and Stauffer, 1994 |
| νMAX§ | Turnover number of a Ca2+ pump molecule | 100 sec−1 | Kubitscheck et al., 1995; Yamoah et al., 1998 |
| pump density§ | Average density of Ca2+pump molecules | 2000 μm−2 | Yamoah et al., 1998 |
* Free parameter that was varied for each cell.
§ Constrained parameter that was held constant for all cells.
Constrained parameter that was measured for each cell.
¶ Free parameter that was held constant for all cells.
The model describes Ca2+ homeostasis in the individual stereocilium, which is divided lengthwise into nine compartments. Ca2+ ions enter the model stereocilium through one or two transduction channels, which can be located at the stereociliary tip (compartment 1), ∼1 μm from the tip (compartment 2), or both. At its base, the stereocilium is continuous with the soma of the hair cell, into or from which Ca2+, indicator, and mobile buffer can diffuse.
Fitting fluorescence data with the model
To determine whether our model adequately describes Ca2+ regulation in a stereocilium, we compared the predicted fluorescence profiles of the model for a given whole-cell current response with fluorescence data collected from a stereocilium during the acquisition of that response. For each stereocilium, the fits for compartments 2, 4, 6, and 8 were evaluated; to conserve space, we display fewer compartments in most figures. To determine the adequacy of the fit, we compared the output of the model with the fluorescence data and calculated a squared error for each compartment. Using the model, we successfully fit eight images collected from seven cells as described below. Although images were collected from hundreds of stereocilia, most were not suitable for fitting either because of a low signal-to-noise ratio in the fluorescence data or the whole-cell current response or because multiple stereocilia contributed to the fluorescence signal in the line-scan image.
For a cell dialyzed with 0.2 mm fluo-3 (Fig.3), reasonable fits to four compartments were obtained with the parameter values listed in Table 1. By changing those parameter values that were measured for each cell, as well as the sensitivity of the confocal system and the somatic Ca2+ concentration (CaSOMA), model solutions with a similar goodness of fit for four compartments could be obtained for stereocilia from three other cells: one filled with 0.2 mm fluo-3 and 1 mm EGTA (Fig.4A) and two filled with 0.5 mm fluo-3 (Fig. 4B; data not shown). A second response from the cell shown in Figure 4Bwas also well fit by the model.
With one exception, all stereocilia were fit with only one transduction channel, which was situated in compartment 2. In a fifth cell, which was filled with 0.5 mm fluo-3, a better fit was achieved with one channel each in compartments 1 and 2 (Fig. 4C).
The summed squared error for the best fits to these five cells, which were determined with identical extrusion and fixed-buffering conditions, was 83 square units.
Effect of Ca2+ pumps
Because the ionic composition of endolymph, which bathes the hair bundle in vivo, resembles that of cytoplasm, no obvious ionic gradient is available to drive extrusion of Ca2+ from the hair bundle through a secondary active transporter. Extrusion may instead be mediated by plasma membrane Ca2+-ATPases, or Ca2+ pumps, which occur in stereocilia (Crouch and Schulte, 1995; Apicella et al., 1997; Yamoah et al., 1998). In hair cells from the bullfrog’s sacculus, these Ca2+ pumps extrude detectable amounts of Ca2+, and disruption of their pumping cycle impedes the ability of a hair cell to clear Ca2+ that enters stereocilia through transduction channels (Yamoah et al., 1998).
When Ca2+ pumps were removed from the model, the best fits to the experimental data consistently peaked in the top portion of the stereocilium at intensities lower than that observed experimentally (Fig. 5A). In the lower half of the stereocilium, however, the model without pumps overestimated the peak fluorescence. In addition, the decline in predicted fluorescence after stimulation was slower than that of the experimental data in all compartments. When the sensitivity was adjusted so that the peaks in the top compartments were well fit, the baselines were overestimated in all compartments. The most straightforward interpretation of these results is that the resting stereociliary free Ca2+ concentration predicted by the model in the absence of Ca2+ pumps exceeded that demonstrated by the experimental data.
To determine whether Ca2+ pumps were required to fit the experimental fluorescence data adequately, we set the density of Ca2+ pumps to zero and then found the best fits for the five stereocilia described above. To achieve the best fit, we varied the concentration and the OFF rate of the fixed buffer F for all cells simultaneously; the optimal conditions included a fixed buffer whose concentration was 0.59 mm and whose OFF rate constant was 277 sec−1. In addition, we independently varied the sensitivity and somatic Ca2+ concentration for each cell. For the five cells under consideration, the summed squared error without Ca2+ pumps was 110 square units.
Effect of fixed buffer
A considerable amount of fixed Ca2+ buffer also had to be included in the model to fit the experimental fluorescence profiles adequately. When fixed buffer was removed, the model substantially overestimated the peak fluorescence values in the lower half of the stereocilium (Fig. 5B). Furthermore, the time courses of the rise to peak and return to baseline of the predicted fluorescence trace were much faster than those of the experimental data.
Although this fixed buffer might comprise several endogenous proteins, we chose for simplicity to represent it as a single Ca2+-binding species. To determine the fixed buffer concentration and the binding constants that best fit the fluorescence patterns of five stereocilia, we set the ON rate of the fixed buffer equal to that of fluo-3 and varied the OFF rate and the concentration. For each cell, we also varied the sensitivity of the confocal system and the somatic Ca2+ concentration independently. We found that the best fit for all five cells was achieved with a fixed buffer concentration of 0.61 mm and an OFF rate of 283 sec−1. The same goodness of fit could not be achieved by setting the OFF rate of the fixed buffer equal to that of fluo-3 and varying the ON rate and concentration. Furthermore, adequate fits were not achieved by removing fixed buffers and allowing the turnover rate of the Ca2+ pumps to vary. The summed squared error for the best fit without a fixed buffer in five cells was 132 square units.
We noticed that fluo-3 sometimes became immobilized in the cell at the position of line-scan imaging (Fig. 6), perhaps because of photocross-linking. Throughout the study, we attempted to minimize this effect by attenuating the laser to the lowest irradiance compatible with adequate fluorescence signals. Furthermore, we did not analyze images in which fluo-3 immobilization was apparent. We nevertheless found that the first line-scan images collected were better fit with a lower fixed-buffer concentration than that required to fit fluorescence data collected after repeated line-scan imaging (data not shown); local fluo-3 immobilization may therefore have been a source of fixed buffer.
When the fixed buffer concentration was allowed to vary, a sixth and seventh cell, both of which had been imaged repeatedly, could be fit; a cell dialyzed with 0.1 mm fluo-3 was fit with 1.39 mm fixed buffer, whereas a cell filled with 0.2 mm fluo-3 and 1 mm EGTA was fit with 2.2 mm fixed buffer.
Effect of endogenous mobile Ca2+ buffer
Mobile Ca2+ buffers play an important role in clearing Ca2+ that enters through voltage-gated Ca2+ channels at the presynaptic active zone of a hair cell (Roberts, 1993, 1994; Issa and Hudspeth, 1994, 1996; Tucker and Fettiplace, 1995, 1996; Hall et al., 1997). Because they are washed out of cells in the whole-cell recording configuration, the mobile Ca2+ buffers of a hair cell probably had little effect on the time course of fluorescence changes we observed. To determine whether endogenous mobile buffers could influence the profile of fluo-3 fluorescence in the hair bundle, we therefore compared images of cells loaded with membrane-permeant fluo-3 AM with those of cells loaded with fluo-3 through whole-cell pipettes. During positive bundle deflections, the spread of increased fluorescence down individual stereocilia was usually faster in cells loaded with fluo-3 through a whole-cell pipette (n = 3; Fig.7A) than in cells loaded with fluo-3 AM (n = 4; Fig. 7B).
Although the magnitudes of mechanically stimulated fluorescence changes in hair cells loaded with fluo-3 AM were similar to those in cells studied by whole-cell recording, tip blushes were not often apparent in fluo-3 AM–loaded cells. This made the identification of stereocilia with active transduction channels very difficult. To circumvent the need to detect tip blushes, we simultaneously imaged changes in the fluorescence of several stereocilia and determined the rise times to half-maximal fluorescence (t1/2) during bundle deflection. For cells loaded with 0.1 mm fluo-3 through recording pipettes, the t1/2 during positive bundle deflection averaged 22 ± 3 msec (mean ± SE;n = 4; Fig. 7C). By contrast, the value for fluo-AM–loaded cells, 82 ± 8 msec (n = 13), was significantly greater (p = 6·10−6; two-tailed Student’s t test; Fig. 7D).
Because the endogenous mobile buffers dramatically slowed the spread of fluorescence in these stereocilia, they probably contributed to the regulation of free Ca2+ concentration. To determine whether the Ca2+-buffering environment significantly affected adaptation, we compared the adaptation time constants measured in perforated-patch and whole-cell recordings. For positive deflections of 150–250 nm, the mean adaptation time constant measured in the perforated-patch configuration was 25 ± 5 msec (n= 6). This value was not significantly different from that determined for cells in the whole-cell configuration (20 ± 3 msec;n = 8; p = 0.44).
Estimated Ca2+-pump current
A transduction-dependent outward current associated with Ca2+ extrusion has been measured from bullfrog saccular hair cells (Yamoah et al., 1998). This current may arise from the electrogenic exchange of one H+ for one Ca2+ during each pumping cycle (Hao et al., 1994). After fitting the experimental data, we used the model to estimate the amount of Ca2+ extruded from the hair bundle by Ca2+ pumps. For a cell filled with 0.2 mm fluo-3, hair-bundle Ca2+ pumps were calculated to produce ∼1.3 pA of outward current during stimulation, which decayed with a time constant of 75 msec at the conclusion of a positive bundle deflection (Fig. 8). This Ca2+-pump current lies in the range of those determined from whole-cell recordings (Yamoah et al., 1998). The pump current estimated to flow during and after the displacement corresponded to the extrusion of approximately three-quarters of the Ca2+ that entered through the transduction channel during the bundle deflection.
Fig. 8.
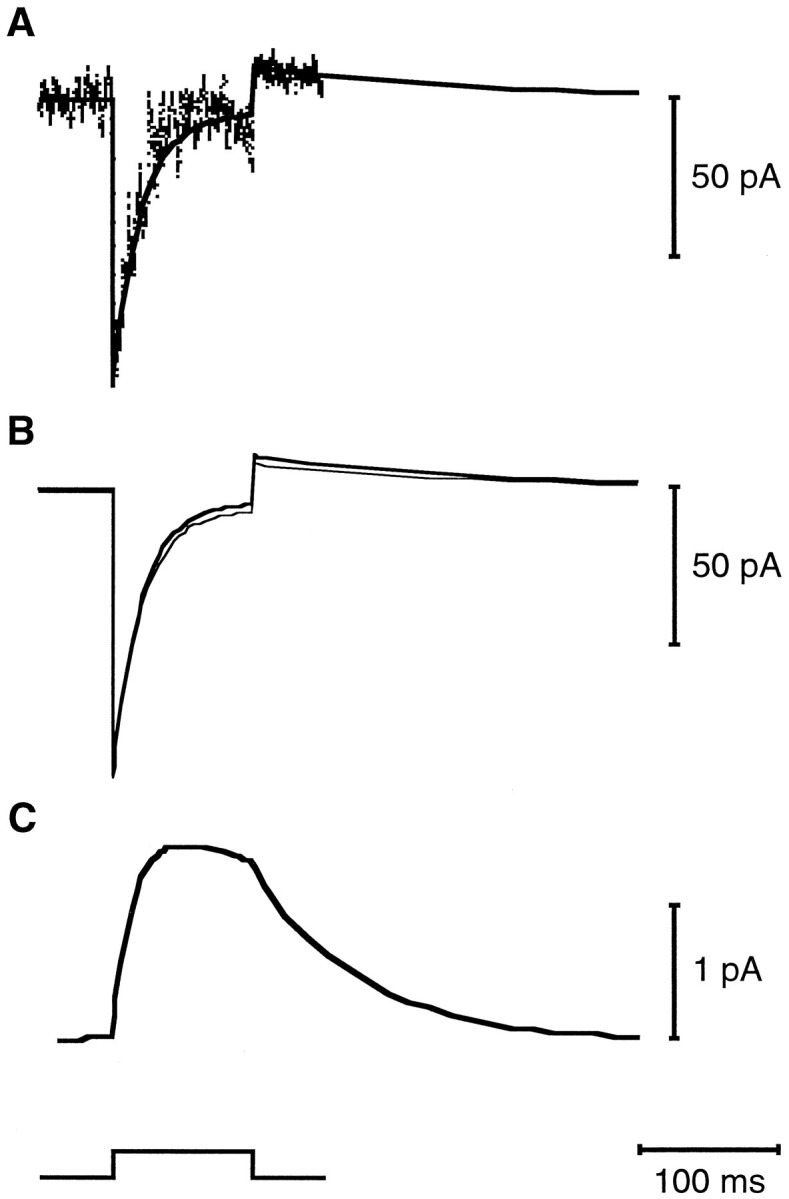
Estimated Ca2+-pump current in the hair bundle. A, The experimentally measured whole-cell current (thin trace) was fit by the estimated whole-cell current response (thick line).B, The estimated whole-cell response (thick line) in turn represented the sum of the calculated transduction current (thin line) and the estimated Ca2+-pump current, which is shown on a different current scale in C. The 200 nm, 100 msec hair-bundle deflection is indicated below C. The parameter values used in calculating this fit are listed in Table 1, and the fluorescence plots for this response are shown in Figure 3.
Estimated free Ca2+ concentration
The model was also used to estimate the free Ca2+ concentration in compartments containing transduction channels. For a cell filled with 0.2 mm fluo-3 (Fig. 9A), the shape of the calculated change in free Ca2+ concentration in compartment 2 mimicked that of adaptation, suggesting that Ca2+ ions are quickly captured by buffers and Ca2+ pumps in the stereocilium. In a cell loaded with 0.5 mm fluo-3 (Fig. 9B), the magnitude and rate of change in the estimated free Ca2+concentration were lower than that for the cell loaded with 0.2 mm fluo-3, a difference consistent with the distinct Ca2+-buffering capacities of the cells. Although the total buffering capacity was higher in a cell filled with 0.2 mm fluo-3 and 1 mm EGTA than in one filled with 0.5 mm fluo-3, the calculated change in fluorescence was faster in the former (Fig. 9C), presumably because of the low ON rate of EGTA. In cells for which reasonable fits were achieved, the peak estimated free Ca2+ concentrations in the compartments containing transduction channels ranged from 0.44 to 25 μm and averaged 6.5 μm.
Fig. 9.
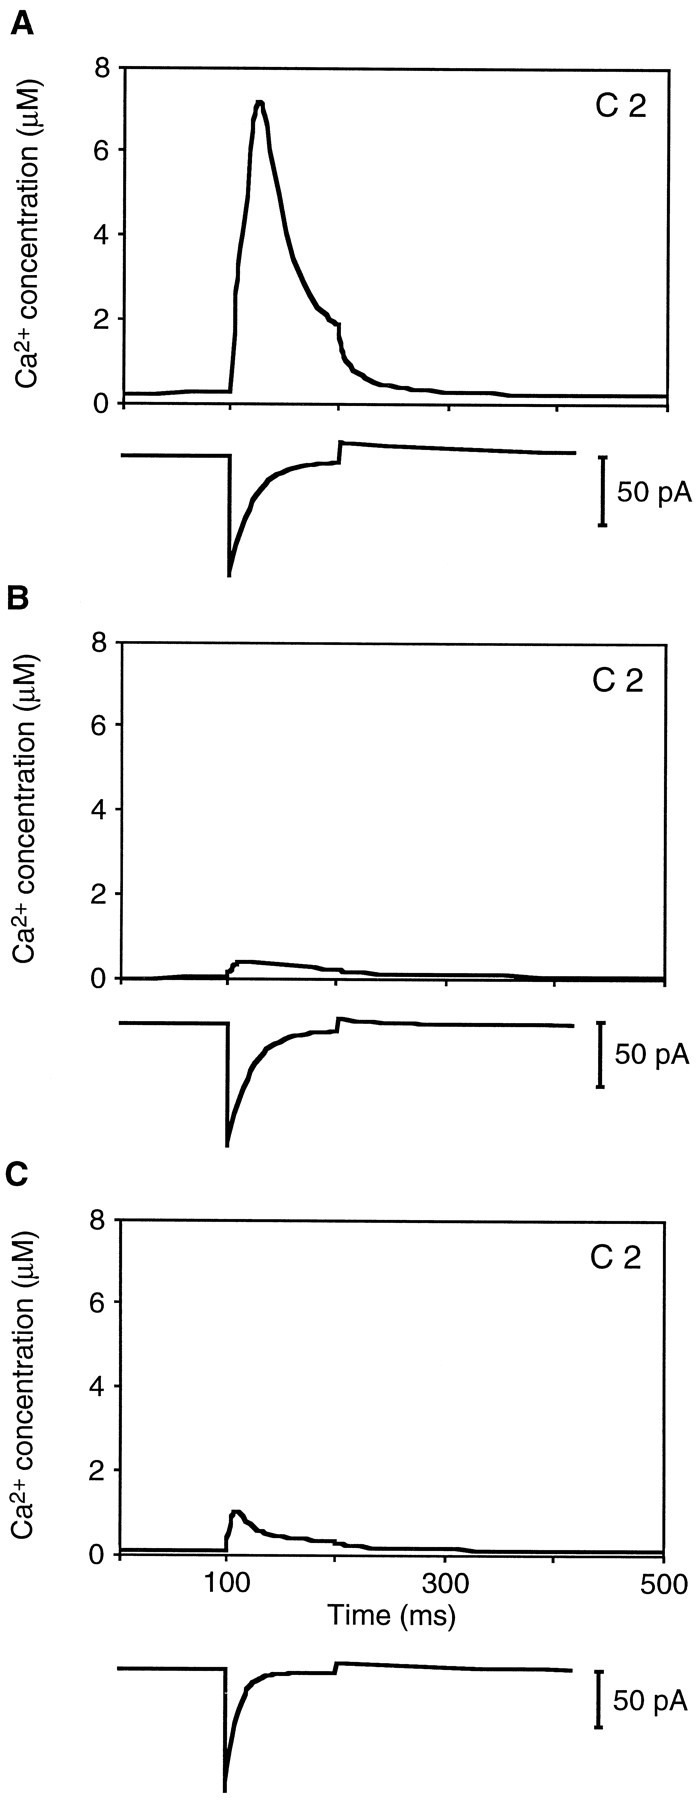
Estimated free Ca2+concentration in stereocilia. All panels display the predicted responses for compartment 2, which contained the transduction channel.A, For a cell filled with 0.2 mm fluo-3, the estimated free Ca2+ concentration rose from a resting level of ∼0.31 μm to a peak of 7.4 μm within 25 msec of hair-bundle deflection. The predicted fluorescence profiles for this solution of the model are shown in Figure 3. B, In a cell loaded with 0.5 mm fluo-3, the calculated concentration rose from 0.06 to 0.44 μm during mechanical stimulation. The predicted fluorescence profiles in compartments 2 and 6 for this model solution are shown in Figure 4B. C, In a cell loaded with 0.2 mm fluo-3 and 1 mm EGTA, the free Ca2+ concentration in compartment 2 was predicted to rise from 0.16 to 1.1 μm during this positive deflection. The predicted fluorescence profiles in compartments 2 and 6 for this model solution are shown in Figure4A.
Despite the variation in the calculated peak free Ca2+ concentrations, the positive adaptation time constants for these cells were similar. For example, the peak estimated free Ca2+ concentration in compartment 2 was 17 times as high in Figure 9A as in Figure 9B. The adaptation time constant for both cells, however, was 20 msec.
Although the fluo-3 fluorescence intensity may increase along the entire stereocilium (Fig.10A), our model predicted that, for the hair-bundle displacements used in this study, the increased free Ca2+ concentration was tightly restricted to the upper portion of the stereocilium. For a cell filled with 0.2 mm fluo-3 and bathed in standard saline solution, the estimated free Ca2+ concentration was elevated only in the top half of the stereocilium at the peak of the response (Fig. 10B). At the end of the bundle deflection (Fig.10, solid lines), the estimated free Ca2+concentration decreased dramatically, whereas the predicted fluorescence intensity remained high.
Fig. 10.
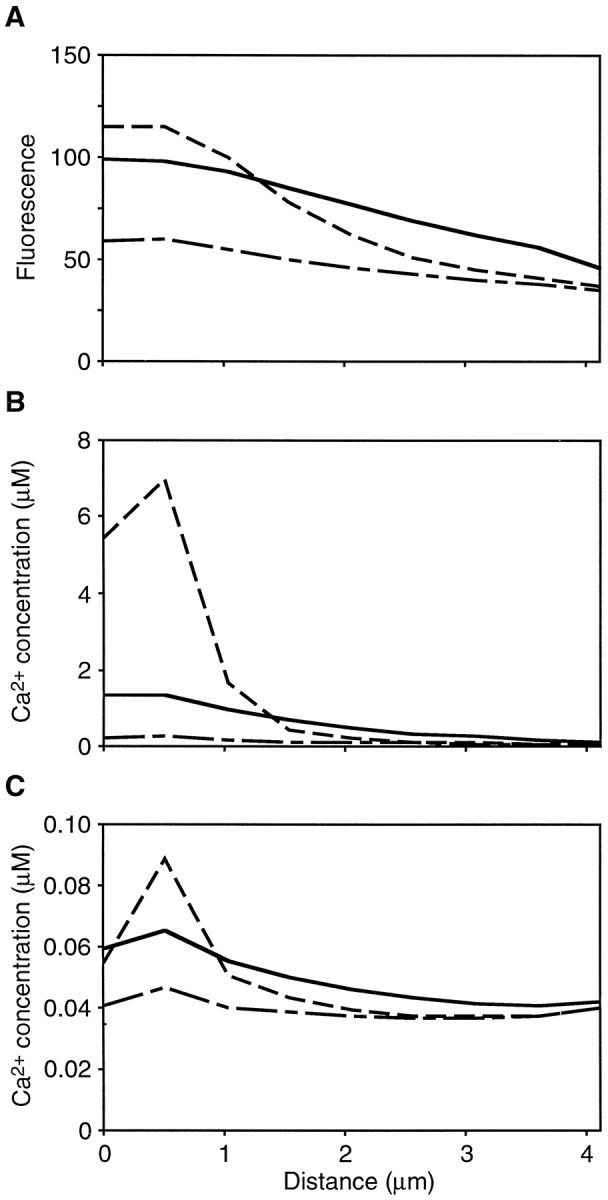
Predicted spatial restriction of free Ca2+. A, For the response shown in Figure 3 from a cell loaded with 0.2 mm fluo-3, the predicted fluorescence intensity before bundle deflection (line with long and short dashes) was slightly higher at the stereociliary tip (x = 0 μm) than at the base (x = 4.11 μm). The predicted fluorescence more than doubled near the tip 20 msec after deflection (dashed line). At the end of the 100 msec deflection, the predicted increase in fluorescence intensity had propagated toward the stereociliary base (solid line). B, The free Ca2+ concentration calculated for the response in A increased significantly only in the top half of the stereocilium 20 msec after deflection. By the end of the deflection, the estimated free Ca2+ concentration dropped precipitously. C, Under endolymph-like ionic conditions, the free Ca2+ concentration was estimated to increase from 0.05 to 0.09 μm in the compartment containing the channel. As in standard saline solution, the change in free Ca2+ concentration was tightly localized to the top portion of the stereocilium. Note that the calculated free Ca2+ concentration in the middle of the stereocilium was lower than that at the base. The parameter values listed in Table 1were used in calculating this fit, except thatfCa = 0.03 andVM = −60 mV. The line symbols in B and C are described in A.
Hair bundles in vivo are bathed in endolymph, which contains only 260 μm Ca2+ in the bullfrog’s sacculus (Corey and Hudspeth, 1983b), 65 μm in the turtle’s cochlea (Crawford et al., 1991), and 30 μm in the guinea pig’s cochlea (Bosher and Warren, 1978). For the bullfrog’s saccular hair cells in the presence of an endolymph-like solution, the fraction of the total transduction current carried by Ca2+ is estimated at 0.03 (Lumpkin et al., 1997). Furthermore, the resting membrane potential of the cells, approximately −60 mV (Hudspeth and Corey, 1977; Corey and Hudspeth, 1983a), is slightly more positive than is the holding potential used in the present study. Under these in vivo conditions, the free Ca2+ concentration in compartment 2 for the response in Figure 3 was estimated to peak at only 0.09 μm (Fig.10C).
The magnitude of transduction currents recorded from isolated hair cells indicates that these cells average fewer than one transduction channel per stereocilium. In vivo, however, a stereocilium may contain more than one active transduction channel (Holton and Hudspeth, 1986; Howard and Hudspeth, 1988; Denk et al., 1995). To ascertain the effect of two active channels on the estimated free Ca2+ concentration, we ran the model with the parameter values listed in Table 1, except that one channel was positioned in compartment 1 and a second was included in compartment 2. For the transduction current response in Figure 3, the estimated peak free Ca2+ concentrations in compartments 1 and 2 exceeded 130 μm under experimental ionic conditions and peaked at ∼0.15 μm under in vivo conditions. That a twofold change in Ca2+ influx caused a 16-fold increase in estimated free Ca2+concentration in vitro suggests that the Ca2+-regulatory mechanisms near the stereociliary tip would be saturated by the Ca2+ influx through two channels. Because doubling the Ca2+ influx underin vivo conditions increased the estimated free Ca2+ concentration by less than a factor of two, our results indicate that the Ca2+ regulatory mechanisms are poised to control the free Ca2+ concentrationin vivo. Consistent with this suggestion, modeling indicated that, in the presence of only one transduction channel and underin vivo conditions, approximately one-third of the total fixed buffer was bound to Ca2+ in compartment 2 at the peak of the response. Furthermore, Ca2+ pumps were again estimated to extrude three-quarters of the Ca2+ that entered through the transduction channel during stimulation.
DISCUSSION
This study represents the first attempt to our knowledge at providing a model of Ca2+ homeostasis in the stereocilium, the site of sensory transduction in the hair cell. Because of its structure, a stereocilium provides a relatively simple system in which to study Ca2+ regulation, which is far more complicated in most other intracellular contexts. In the present experimental circumstances, each stereocilium usually has but one active transduction channel. Moreover, the Ca2+that enters during mechanical stimulation moves within a femtoliter volume that is devoid of membrane-bounded organelles. By comparing the output of the Ca2+ regulation model with high-resolution experimental data, we have found that the control of free Ca2+ concentration in a stereocilium nonetheless involves multiple regulatory mechanisms that together tightly restrict stimulus-induced changes in free Ca2+ concentration both spatially and temporally. Because Ca2+ provides a signal that controls adaptation of the mechanoelectrical transduction process, this regulation is critical for the operation of the hair cell. In addition, rapid removal of free Ca2+ may be required to reprime the capacity of the hair bundle for mechanical amplification powered by the transmembrane Ca2+ gradient (for review, see Hudspeth, 1997).
Ca2+ extrusion from stereocilia
Plasma membrane Ca2+-ATPase molecules, which are found at high density in the stereociliary membrane (Crouch and Schulte, 1995; Apicella et al., 1997; Yamoah et al., 1998), provide the only known Ca2+-extrusion mechanism in the hair bundle. Our results indicate that these pumps play a critical role in setting both the resting and the peak free Ca2+concentrations in the stereocilium. In fact, our model suggests that pumps in vivo reduce the resting free Ca2+ concentration in a stereocilium below that in the soma (Fig. 10C). The extrusion of Ca2+ by this means should result in a constant translocation of the ion from the soma into the endolymphatic space (Yamoah et al., 1998).
Fixed Ca2+ buffers in stereocilia
This study indicates that fixed Ca2+ buffers play an important role in spatially restricting the spread of free Ca2+ during mechanoelectrical transduction. In doing so, fixed buffers increase the period during which the total Ca2+ concentration is elevated in the stereocilium after transduction-channel opening. By increasing the chance that a Ca2+ ion entering through a transduction channel would be extruded across the apical rather than the basolateral surface of the hair cell, this effect could augment an extracellular Ca2+ gradient near the hair bundle resulting from Ca2+-pump activity (Yamoah et al., 1998).
Some of the fixed buffer we observed was likely to have been immobilized fluo-3. Because substantial fixed buffer was required to fit the first line-scan image collected from each stereocilium, however, we believe that endogenous molecules also contributed. The stereociliary cytoskeleton includes such potential fixed Ca2+ buffers as actin (DeRosier et al., 1980) and fimbrin (Flock et al., 1982; de Arruda et al., 1990); the divalent cation-binding site of the former may, however, be predominantly occupied in vivo by Mg2+ (for review, seeEstes et al., 1992). Calmodulin, half of which is immobilized in the hair bundle (Walker et al., 1993), also may contribute to the fixed-buffering capacity of the stereocilium.
Mobile Ca2+ buffers in stereocilia
In cells loaded with fluo-3 AM, the spread of fluorescence within stereocilia was slowed compared with that in cells dialyzed through recording pipettes with an equivalent concentration of fluo-3. This difference indicates that mobile Ca2+ buffers are normally present in stereocilia but diffuse from hair cells in the whole-cell recording configuration. Furthermore, because these buffers significantly competed with 0.1 mm fluo-3 for the binding of free Ca2+, the endogenous mobile-buffering capacity of stereocilia may be substantial. Preliminary evidence suggests oncomodulin, or β-parvalbumin, as a candidate mobile Ca2+ buffer in some hair cells (Henzl et al., 1997; S. Heller and A. J. Hudspeth, unpublished observations). This cytoplasmic protein contains two Ca2+-binding sites with dissociation constants of ∼0.01 and 1 μm (for review, see Pauls et al., 1996).
In hair cells from the frog’s sacculus and the turtle’s cochlea, the capacity of the somatic mobile Ca2+ buffer is similar to that of 1 mm BAPTA (Roberts, 1993; Tucker and Fettiplace, 1996). The abolition of adaptation in hair cells filled with 1 mm BAPTA and bathed in an endolymph-like solution led to the suggestion that, to promote adaptation in vivo, stereocilia maintain a low Ca2+-buffering capacity (Ricci and Fettiplace, 1997). By contrast, the time lag between a change in extracellular Ca2+ concentration and a corresponding alteration in adaptation kinetics suggests that Ca2+ buffers are present in the chicken’s stereocilia (Kimitsuki and Ohmori, 1992). Although our results do not exclude the possibility that the buffering capacity of the soma and that of the stereocilia are distinct, they do indicate that hair bundles from the bullfrog’s sacculus contain significant amounts of both fixed and mobile buffers. This conclusion is buttressed by the immunohistochemical detection of mobile Ca2+ buffers in the stereocilia of hair cells from the bullfrog’s sacculus and utriculus (Baird et al., 1997).
Free Ca2+ concentration at the adaptation motor
Like most other experiments on isolated hair cells, the present investigation was conducted in a medium containing an elevated Ca2+ concentration. Because the influx of Ca2+ through an open transduction channel is reduced in the low-Ca2+ environment of endolymph, the Ca2+ concentrations achieved in stereociliary tips must be lower in vivo than are those estimated here. Despite the substantial Ca2+-buffering capacity of bullfrog saccular hair bundles, adaptation has nonetheless been observed bothin vivo (Eatock et al., 1987) and in vitro in an ionic environment similar to endolymph (Corey and Hudspeth, 1983a). This result implies that the Ca2+ sensor of the adaptation motor can respond to small changes in free Ca2+ concentration.
The present results provide an estimate under experimental conditions of the free Ca2+ concentration near stereociliary tips, where transduction channels and adaptation motors reside. To appreciate the effect of Ca2+ on the adaptation motor in vivo, however, one must consider two additional factors that lie beyond the temporal and spatial resolution achieved in this study. The first is the stochastic nature of channel opening. We have modeled the flow of Ca2+ through a transduction channel as a continuous process whose magnitude varies with the channel open probability. In reality, however, each transduction channel continually clatters between its open and closed states. With a resting open probability of 0.2, for example, the average open time is ∼500 μsec and the closed time is 2000 μsec (Corey and Hudspeth, 1983b;Holton and Hudspeth, 1986; Crawford et al., 1991). It follows that the adaptation motor is subjected not to a smoothly changing concentration of Ca2+ but rather to a staccato rhythm of Ca2+ pulses that reflect channel flickering.
The other consideration is that, as evidenced by the latency of adaptation (Assad et al., 1989) and the effect of exogenous Ca2+ buffers (Crawford et al., 1989), the Ca2+ sensor of the adaptation motor is located only tens of nanometers from the transduction channel (for review, see Lenzi and Roberts, 1994). Within that distance of a channel, our assumption that the free Ca2+ concentration is identical throughout a stereociliary compartment fails on three grounds. First, very near a point-like source, diffusion produces a much steeper concentration gradient than that modeled here. Next, the influx of Ca2+ results in a concentration close to the channel that exceeds the local buffering capacity. Finally, the finite rate of binding implies that the free Ca2+ near a channel is not at an equilibrium with the buffers. If we assume that the mobile- and fixed-buffering capacities are 1 and 0.6 mm, respectively, and that the ON rates of these buffers are diffusion-limited, then the mean time to capture for an entering Ca2+ ion (Roberts, 1993) is ∼0.5 μsec, and the mean distance to capture is 50 nm. If the Ca2+sensor of the adaptation motor is situated within that distance of the transduction channel, as now seems likely (for review, see Hudspeth and Gillespie, 1994; Gillespie and Corey, 1997), Ca2+buffers can play only a limited role in attenuating the free Ca2+ concentration there. The contribution to the free Ca2+ concentration at the adaptation motor from transduction-channel opening can therefore be estimated from the time-dependent solution of Fick’s second law for diffusion from a point source into a hemi-infinite space [Berg (1993), his Equation 2.12]:
| Equation 1 |
Here fCa is the fraction of the total transduction current carried by Ca2+, γ is the single-channel conductance, VM is the holding potential of the cell, ER is the reversal potential for the transduction current, z is the valence of Ca2+, F is the Faraday constant, DCa is the diffusion coefficient of Ca2+, and r is the distance from the channel to the motor; erfc denotes the complement of the error function.
The consequence of these factors is that the Ca2+concentration experienced by the adaptation motor has two components. When a transduction channel is open for tens of microseconds, the free Ca2+ concentration at the motor is dominated by the local Ca2+ influx. For a cell bathed in standard saline solution and with the parameter values of Table 1, the Ca2+ concentration calculated with Equation 1requires <30 μsec after channel opening to attain 80% of the calculated steady-state level of 33 μm. In the presence of endolymph, the corresponding estimated concentration is 4 μm. The adaptation motor is also exposed to Ca2+ from past channel activity, however, as reflected in the smaller but longer-lasting elevations in concentration throughout the upper stereociliary compartments (Figs. 9, 10). To increase the responsiveness of hair cells tuned to high frequencies, these smaller rises in Ca2+ concentration could be abbreviated by increasing the number or turnover rate of the Ca2+ pumps or the concentration of mobile Ca2+ buffer in the stereocilium.
The free Ca2+ concentrations estimated above lie in the range in which the binding of calmodulin is sensitive (for review, see Cox et al., 1988) and in which the myosin-ATPase activity of the hair bundle is modulated (Burlacu et al., 1997). The Ca2+ concentration at the adaptation motor is presumably time-averaged by the binding of the ion to and the unbinding of the ion from the calmodulin light chains associated with each myosin molecule; the mechanical response of each myosin molecule in turn reflects the binding status of these calmodulin molecules. Finally, the adaptive response of a hair cell is smoothed by the participation of dozens of myosin molecules at each adaptation motor and by the presence of dozens of motors in a hair bundle.
This section details the model of stereociliary Ca2+ regulation.
Components of the model
Geometrical considerations
A stereocilium was modeled as a right circular cylinder, oriented with the stereociliary tip at x = 0 and the soma atx = L, the measured length of the stereocilium (Fig. 2). The stereociliary shaft was divided inton − 2 discrete compartments of equal length; two additional compartments represented the taper at the stereociliary insertion. In most simulations, a value of n = 9 was used; the length of each compartment was therefore ∼0.5 μm, or slightly more than the stereociliary diameter of 0.45 μm (Jacobs and Hudspeth, 1990).
The effect of the stereociliary taper was accommodated by adding two compartments, each 0.5 μm long, consisting of a pair of cylinders of successively smaller diameters than those used for the remainder of the stereocilium. These diameters were adjusted so that the volume of each compartment equaled that of the frustum corresponding to that segment of the stereociliary taper. We examined transmission electron micrographs of bullfrog saccular hair bundles, and on the assumption that the stereociliary insertion shrinks in diameter during electron microscopic preparation to the same extent that the stereociliary shaft shrinks, we estimated the diameter of the insertion in vivoto be 0.18 ± 0.03 μm (mean ± SE; n = 11). The diameters of the two taper compartments were accordingly 0.38 and 0.25 μm. In the calculation of fluxes between compartments, the surface areas between adjoining compartments of differing diameter were approximated by the geometrical means of the two relevant areas.
Although large, protracted stimuli can demonstrably increase the Ca2+ concentration in the soma of a hair cell (Ohmori, 1988; Lumpkin and Hudspeth, 1995), the brief stimuli used in the present experiments had a negligible effect there. We accordingly modeled the soma as a single, homogeneous compartment adjacent to thenth compartment and assumed that the somatic Ca2+ concentration CaSOMA remained constant at a specified level. We also fixed the total concentrations of indicator and mobile buffer in the soma at their concentrations in the recording pipette and assumed that both species were at equilibrium in their binding to the specified somatic Ca2+concentration.
Ca2+ influx
The mechanoelectrical transduction channels generally carried a significant transduction current, iREST, before the onset of a stimulus. In response to a positive stimulus pulse, the whole-cell current response peaked rapidly and then adapted almost exponentially to a plateau level; at the end of such a stimulus, the receptor current fell to zero (Eatock et al., 1987). To represent the response of a cell during a deflection beginning att = 0, we fit the channel open probabilitypO with the relation:
| Equation A1 |
in which iADAPT is the asymptotic transduction current after adaptation, iMAX is the peak transduction current, and τPOS is the time constant of adaptation. The recovery of the resting open probability after a stimulus of duration tSTIM was fit with a second exponential relation characterized by the time constant τNEG:
| Equation A2 |
For the one cell whose transduction current after positive stimulation was not well fit by a single-exponential function (Fig. 4C), we set pO = 1 for 0 msec ≤ t ≤ 5 msec and then used Equation EA1 with a time lag of 5 msec and Equation EA2 to calculatepO for the remainder of the response.
In the intact sensory epithelium of the bullfrog’s sacculus, a hair cell with ∼60 stereocilia possesses 40–90 active transduction channels (Holton and Hudspeth, 1986; Howard and Hudspeth, 1988; Denk et al., 1995); as a result of damage during isolation, solitary hair cells such as those used in the present work have fewer. Because we wished to consider Ca2+ homeostasis in individual stereocilia, we estimated the influx of the ion through individual transduction channels. Because these channels are located within 1 μm of the stereociliary tip (Jaramillo and Hudspeth, 1991; Denk et al., 1995;Lumpkin and Hudspeth, 1995), we included in the model the capacity to situate them in the first or second compartment of a stereocilium, or in both. We assigned each channel a conductance, γ, of 100 pS (Crawford et al., 1991; Denk et al., 1995; Géléoc et al., 1997). The time course of the current through the channel was specified by the open probability defined above. For each compartment containing a transduction channel, the rate of change in Ca2+concentration, [Ca2+], attributable to influx through each transduction channel was then:
| Equation A3 |
in which Qn is the volume of the nth compartment.
Diffusion
By Fick’s second law, the rate at which the Ca2+ concentration [Ca2+] changes with time as a result of diffusion is:
| Equation A4 |
in which DCa is the diffusion coefficient of the ion. This partial differential equation was approximated by breaking the spatial coordinate into n discrete compartments of length Δx; the rate of change of the Ca2+ concentration in the nth compartment was then evaluated as:
| Equation A5 |
in which An − 1/nand An/n + 1 are the cross-sectional areas between the successive compartments indicated. For computations involving the nth compartment, the soma represented the (n + 1)th compartment; the cross-sectional area of the nth compartment was therefore used to calculate flux between the nth compartment and the soma in all differential equations. The concentration of free Ca2+ decreased along the positive x-axis from the site of Ca2+ entry to the soma.
Extrusion
Although some kinetic parameter values have not been estimated for the plasma-membrane Ca2+ pumps of the hair cell, they have been defined for erythrocyte pumps (for review, see Carafoli and Stauffer, 1994; Kubitscheck et al., 1995). Because Ca2+ pumps from these two cell types are recognized by a common antibody and because both bind calmodulin (Yamoah et al., 1998), we assumed that they share similar kinetics.
To describe extrusion of Ca2+ by Ca2+ pumps, we used an equilibrium formulation; the pumping rate of each Ca2+ pump molecule, νPUMP, was regarded as following Michaelis–Menten kinetics. For each compartment, the rate of change in Ca2+ concentration as a result of pump activity was therefore:
| Equation A6 |
in which ψn is the density of pump molecules in the plasmalemmal area Sn of the compartment, NA is Avogadro’s number, νMAX is the maximal turnover rate of an active Ca2+ pump molecule, and KM is its Michaelis constant.
We used this simplified Michaelis–Menten formulation for two reasons. First, values for the detailed kinetic parameters have yet to be reported for any plasma-membrane Ca2+ pump, let alone for that found in hair cells. Although it is therefore not realistic to provide more detailed, time-dependent equations for pumping, estimates are in hand for the values of the lumped parameters of the Michaelis–Menten formulation, the turnover number and Michaelis constant (Carafoli and Stauffer, 1994; Kubitscheck et al., 1995; Yamoah et al., 1998).
The second justification for the Michaelis–Menten formulation is that it is likely to prove a sound approximation. The key assumption in our formulation is that the rate at which Ca2+ is extruded at any time accurately reflects the then-prevailing free Ca2+ concentration in a stereocilium. If the binding of Ca2+ at the pump is diffusion-limited,kON ≈ 109m−1·sec−1, the Michaelis constant of 500 nm therefore implies thatkOFF ≈ 500 sec−1. It follows that the activity of the pump should reflect the free Ca2+ concentration with a temporal delay of only 2 msec or so, a small lag compared with the time course over which the Ca2+ concentration changes.
The average density of Ca2+-pump molecules in the stereociliary membrane was fixed at 2000 μm−2. Immunocytochemical labeling indicates, however, that Ca2+-pump molecules are concentrated at stereociliary tips (Apicella et al., 1997; Yamoah et al., 1998). This factor was accommodated by setting the density in the first compartment at 150% that in compartments along the upper stereociliary shaft. Because the first compartment is also endowed with the extra membrane at the end of the stereocilium, that compartment contained ∼180% as many pump molecules as the subsequent ones.
Assuming that a Ca2+-pump exchanges one H+ for one Ca2+ during each pumping cycle, our model estimated the current resulting from Ca2+-pump activity in a single stereocilium. To calculate the Ca2+-pump current for the entire hair bundle, we had to estimate the number of active stereocilia in each bundle. To do so, we divided iPEAK by −250 pA, which was the expected transduction current for the half-maximal stimuli used in this study if all of the transduction channels had been functional. Note that somatic Ca2+ pumps did not contribute to this estimated current. The hair-bundle pump current and the fit to the transduction current were summed; the resulting predicted whole-cell response is displayed for each cell.
Buffering
Within each compartment, Ca2+ buffering was represented by the binding of Ca2+ to and the unbinding of Ca2+ from three potential targets: a mobile Ca2+ indicator, I (fluo-3); a second, nonfluorescent mobile Ca2+ buffer, B (EGTA); and a fixed Ca2+ buffer, F. In each case, the stoichiometry of Ca2+ binding was one-to-one. The indicator and mobile buffer were assigned diffusion coefficientsDI and DB, respectively, which were assumed to be identical for their free and Ca2+-bound forms. In the soma of Rana pipiens hair cells, the diffusion coefficient of mobile fluo-3 is 1.8·10−10m2·sec−1. Because approximately one-third of the indicator is immobilized (Hall et al., 1997), however, we set DI to 1.2·10−10m2·sec−1. Models in whichDI was lowered and those in which a fraction of the total indicator was immobilized gave similar results (data not shown).
The diffusion coefficient of EGTA was set equal toDI. In each compartment, the diffusion of both the Ca2+-bound and the free form of each species was independently described by relations similar to that in EquationEA5.
Equilibrium conditions were not assumed. In the instance of the Ca2+ indicator, for example:
| Equation A7 |
from which it follows that, for each compartment:
| Equation A8 |
Similar relations described Ca2+ binding to the mobile and fixed Ca2+ buffers in each compartment.
Representative equations
The section above is meant to justify the various terms in the model equations. For completeness and ease of computation, we provide below representative relations from each of the seven families. Each family in turn comprises n equations corresponding to the number of compartments used in the simulation. In most simulations, nine compartments were used, so n represented integers from one to nine. Except where noted, the symbols are defined in the preceding section.
The concentration of Ca2+ in each compartment is controlled by the effects of diffusion, pumping, and binding to indicator, mobile buffer, and fixed buffer:
| Equation A9 |
Here NT,n is the number of active transduction channels in the compartment. The first term, which describes Ca2+ entry through transduction channels, applies only in compartments that encompass such channels.
The concentrations of free and bound indicator are set by diffusion and by binding relations:
| Equation A10 |
| Equation A11 |
An analogous set of equations governs the concentrations of free and bound mobile buffer:
| Equation A12 |
| Equation A13 |
Finally, the concentrations of free and bound fixed buffer depend exclusively on the binding and unbinding of Ca2+:
| Equation A14 |
| Equation A15 |
Simplifying assumptions in the model
To describe Ca2+ homeostasis in the stereocilium, we made several simplifying assumptions that could have affected the quantitative results derived from modeling. We provide below the rationales for these assumptions and estimates of their potential impacts on our numerical results.
Diffusional exchange with recording pipettes
Because diffusional exchange of pipette and cytoplasmic constituents is somewhat limited (Pusch and Neher, 1988), the concentrations of fluo-3 and EGTA specified in the model may have been overestimates. Furthermore, limited diffusional exchange implies that endogenous mobile buffers, which are not explicitly included in the model, could have influenced Ca2+ homeostasis in these experiments as described for the presynaptic active zone of the hair cell (Hall et al., 1997). For example, the apparent accumulation of fixed buffer that we observed could have been attributable in part to the progressive loss of endogenous mobile buffers that competed in Ca2+ binding with stereociliary fixed buffers.
Representation of transduction-channel permeation and gating
To simplify the representation of Ca2+ influx in the model, we made two assumptions that might have affected the quantitative results. First, to estimate the fraction of transduction current carried by Ca2+,fCa, we assumed that ions traversing the pore of the channel do not influence the movement of one another. Because ions do interact within the pore (Lumpkin et al., 1997) and because the channel is Ca2+-selective (Corey and Hudspeth, 1979; Ohmori, 1985; Jørgensen and Kroese, 1994, 1995), our value for this parameter is likely to be an underestimate. Second, we ignored the stochastic nature of ion-channel opening and specified Ca2+ entry as a continuous process whose magnitude varies with the channel open probability. Given that each stereocilium contains only one or two channels, more accurate fits to the imaging data might have been achieved by simulating the flickering of a transduction channel based on its estimated open probability. Our line-scan images of stereociliary tips in fact displayed rapid fluctuations in fluorescence intensity (data not shown) that might have reflected the flickering of transduction channels.
To the extent that these assumptions and those mentioned in the previous paragraph introduced errors, they should have led to underestimation of the Ca2+ influx and the stereociliary buffering capacity.
Diffusion through the stereociliary cytoskeleton
We assumed that the entire cytoplasmic volume of the stereocilium is accessible to the diffusion of Ca2+ and mobile buffers. Because a stereocilium from the bullfrog’s sacculus contains ∼600 actin microfilaments (Jacobs and Hudspeth, 1990), however, the accessible cytoplasmic volume is lower. The accessible stereociliary volume is limited further by the amount of water that is ordered by intracellular proteins, a value that is highly debated in the literature (for review, see Franks, 1993; Luby-Phelps, 1998). To estimate the fraction of stereociliary volume occupied by actin and its associated water, we used three calculations. In these calculations, we considered the cylindrical shaft of a typical saccular stereocilium with a length of 5 μm and a diameter of 0.45 μm (Jacobs and Hudspeth, 1990); the internal volume of the stereocilium is thus 800 al.
The volume of actin in a stereocilium may first be estimated by assuming that each actin microfilament is a solid cylinder with a diameter of 9.5 nm (Milligan et al., 1990). In this case, the volume of actin in the stereocilium is estimated to be 210 al or 26% of the stereociliary volume. Because a microfilament is a double-stranded helix, not a solid cylinder, this value is an overestimate of the volume of actin.
The volume of actin may also be estimated from the mass of stereociliary actin and its partial specific volume, ACTIN, which is the volume of water displaced by 1 gm of solute. One reservation about this estimate is that the partial specific volume of actin in cytoplasm may not equal that measured in water. For G-actin·ADP, ACTINis 0.732 ml·gm−1 (Smith, 1970). Because the partial specific volume of a protein is determined primarily by its amino-acid content (Creighton, 1993), ACTIN of an F-actin monomer should be very similar.
The mass of actin in a stereocilium may be estimated from the length of the cytoskeletal microfilaments, which is 3 mm in the stereocilium under consideration. A single twist of a microfilament helix, which contains 26 actin monomers, is 72 nm in length; the relative molecular mass of each monomer is 42 kDa (Bremer and Aebi, 1992). The mass of actin in a stereocilium is thus 76 fg. The volume of actin in the stereocilium is therefore estimated at 56 al, which represents 7% of the total stereociliary volume.
To estimate the maximum volume of water that may be ordered by stereociliary actin, we used the frictional coefficientf/f0, which is an index of the shape and hydration state of macromolecules. For G-actin·GDP,f/f0 is 1.575 (Smith, 1970). On the assumption that an actin monomer is a perfect sphere, the maximum hydration δ of actin may be estimated (Tanford, 1961):
| Equation A16 |
in which WATER is the specific volume of water (1.0 ml/gm). The maximum hydration of actin is therefore 2.1 gm of H2O per gram of actin, and the volume of this water of hydration is 160 al. Hydrated actin is thus estimated to occupy <27% of the total stereociliary volume.
For two reasons, this calculation yields an overestimate of the volume of water associated with stereociliary actin. First, the crystal structure of an actin monomer shows that it is not a perfect sphere as we have assumed (Bremer and Aebi, 1992). Because its shape contributes to the measured value of f/f0, the actin monomer must be less hydrated than we have estimated with this calculation. Second, because actin molecules in a microfilament associate with each other and with acting-binding proteins, the surface area of a monomer that is exposed to hydration, and thus the degree of hydration, must be less in F-actin than in G-actin.
To determine the impact of a reduced stereociliary volume on the output of our Ca2+ regulation model, we fit the experimental data set shown in Figure 3 with a model in which the stereociliary volume was reduced by 27%. A fit similar to that shown in Figure 3 was obtained by changing the fixed buffer concentration to 0.9 μm and the sensitivity to 458; all other parameter values remained as listed in Table 1. When the stereociliary volume was adjusted, the free Ca2+ concentration in compartment 2 was estimated to peak at 20 μm. Neither the time course of the change in free Ca2+ concentration nor the estimated free Ca2+ concentration in the lower half of the stereocilium was noticeably changed by the altered stereociliary volume. The effect of ignoring the volume of hydrated actin in our calculations was therefore to underestimate slightly the concentration of fixed buffer in the stereocilium and the free Ca2+ concentration in the upper half of the stereocilium. Because we used the maximum possible volume of hydrated actin in these calculations, the actual impact of the stereociliary actin volume on the results of our model is less than that estimated here.
Electrodiffusion
The flow of transduction current down a stereocilium produces a voltage drop that could drive Ca2+ toward the soma. The potential importance of this electrodiffusive effect may be assessed by considering the steady-state profile of Ca2+ concentration in the presence of an ionic fluxJ with an average velocity ν. When Fick’s laws are modified to accommodate this effect [Berg (1993), his Equations 4.4–4.5] and when Ca2+ buffers are in equilibrium with the local Ca2+ concentration, it may be shown that the Ca2+ concentration at a distancex from an open channel at the stereociliary tip is:
| Equation A17 |
From the formulation of Ohm’s Law in terms of mobility [Hille (1992), his Equation 10-6]:
| Equation A18 |
in which z is the valence of the ion, u is the electrical mobility of an unbuffered ion, and ΔV is the potential difference along a stereocilium of length L. The average ionic velocity is related to the diffusion constant by the Nernst–Einstein relation [Hille (1992), his Equation 10-7]:
| Equation A19 |
in which k is the Boltzmann constant, T is the temperature, and e is the charge of the electron. Equating the mobility in these expressions, substituting into the expression for Ca2+ concentration, and solving, we find that:
| Equation A20 |
in which the space constant of the Ca2+-concentration profile λ is given by:
| Equation A21 |
This solution may be compared with that obtained for unidimensional diffusion from a source to a sink in the absence of an electric field [Berg (1993), his Fig. 2.2]:
| Equation A22 |
As would be expected, the qualitative effect of electrophoresis is to oppose the movement of somatic Ca2+ into the stereocilium and to decrease the contribution of Ca2+ influx through transduction channels to the stereociliary Ca2+ concentration.
The quantitative importance of electrophoresis reflects the ratio of the thermal to the electrical energy imparted to a migrating ion. This, in turn, depends critically on the electrical field within the stereocilium. Consider a stereocilium 0.45 μm in diameter, with 73% of its volume occupied by a solution similar to 120 mm KCl and with a conductivity near 1.5 S·m−1 (Kaye and Laby, 1986; Lide, 1996); this process has a resistance per unit length of 5.7 TΩ·m−1. The opening of a single transduction channel yields a longitudinal current of ∼7 pA, which in turn produces a field of 40 V/m. Substitution into Equation EA21 indicates that the space constant is 320 μm, or over 50-fold the length of a stereocilium; the exponential terms in Equation EA20 accordingly deviate from unity by <2%, and the second right-hand term in Equation EA20differs from that in Equation EA22 by under 1%. At least in the steady state, then, the electrical field has little effect on the distribution of Ca2+ along a stereocilium; even if several transduction channels were simultaneously open, the effect of electrodiffusion on Ca2+ movement would be negligible. For transient responses such as those in the experimental work reported here, in which the electrophoretic effect declines as channels close, the effect of electrodiffusion should be still smaller.
Optical sampling
The line-scan images of fluorescence signals inevitably included blurring characterized by the point-spread function of the objective lens. To determine whether blurring along the length of the stereocilium was of importance in our consideration of longitudinal movements of Ca2+ and its buffers, we convolved the predictions of the model of longitudinal fluorescence profiles with a unidimensional representation of the point-spread function, a Gaussian whose full width at half-maximum was 0.4 μm. Even for the calculated responses with the steepest longitudinal gradients in fluorescence (e.g., Fig. 10A), the convolution had a negligible effect along most of the stereocilium. The only noticeable distortion occurred at the distal stereociliary tip, where the abrupt end in the model was converted by convolution to a sigmoidal fluorescence profile. For this reason, compartment 1, which represented the stereociliary tip, was not analyzed in comparisons of experimental and model results. Because the impact of optical sampling was so slight, we did not otherwise correct the predictions of the model for the effects of optical sampling.
Implementation of the model
Calculation of predicted fluorescence signals
To fit experimental fluorescence data with the Ca2+-regulation model, we calculated the fluorescence signal resulting from Ca2+-bound and -unbound fluo-3 in the stereocilium. In addition to the concentration of each species, three factors were considered in calculating the predicted fluorescence traces.
Control experiments confirmed that the confocal microscope was linear in its response to fluorescence (data not shown). For that reason, the output of the confocal system, in grayscale units, was assumed to be related to the concentration of Ca2+-bound indicator by a multiplicative constant, the sensitivity.
The fluorescence ratio of free to Ca2+-bound fluo-3 was required to calculate fluorescence responses. To determine this value in vitro, we used the same line-scan protocol as that used for our experiments to measure the fluorescence of 0.5 mm fluo-3 in the presence of either 10 mmbis(2-aminophenoxy)ethane-N,N,N′,N′-tetra-acetic acid (BAPTA) or 11 mm CaCl2. Under these conditions, unliganded fluo-3 had a fluorescence yield 2.9% that of the Ca2+-bound form.
Although the background fluorescence intensity of a stereocilium was negligible, the calculated fluorescence response included the baseline intensity of an image, caused by instrument noise, that can be measured in the absence of sample illumination (Webb and Dorey, 1995). In most images, this dark signal contributed 5 grayscale units. In a few cases, however, the black level control of the microscope was set slightly higher and the dark signal contributed 18 grayscale units.
Model calculations
The complete model for n stereociliary compartments, usually nine, was represented by a family of 7n linear, first-order, ordinary differential equations, examples of which are shown in the Representative equations section. A copy of the model program is available on request.
From the total concentrations of indicator, mobile buffer, and fixed buffer in the soma and the estimated somatic free Ca2+ concentration, we calculated the equilibrium concentrations of the free and bound species of each buffer. The results were used as starting values for the respective parameters in all compartments of the model. The starting value for the Ca2+ concentration in each compartment was the estimated somatic free Ca2+ concentration.
The sets of seven simultaneous equations for all ncompartments were solved with Mathematica (version 2.2.2; Wolfram Research Inc., Champaign, IL) by an iterative, numerical procedure. On a Macintosh computer (PM G3, PM 8600/300, or PM 9500/132; Apple Computer, Cupertino, CA), the computation time required to solve the equations for a single, nine-compartment stereocilium was 1–5 min; the optimization procedure described below took as long as 3 d to reach a solution.
We performed several tests to confirm the internal consistency of the model. In agreement with an explicit analytical solution, the model yielded a linear concentration gradient along a stereocilium in the instance of a steady Ca2+ source at the stereociliary tip and in the absence of Ca2+ pumps. The total amount of Ca2+ calculated to diffuse from a stereocilium into the soma or to be extruded by pumps was found to be equal within 6% to that entering through transduction channels. Increasing the number of stereociliary compartments from 9 to as many as 23 did not appreciably alter the results of the model. Finally, the validity of our representation of the stereociliary taper was confirmed by demonstrating in a simplified model that the free diffusion of Ca2+ through the taper was similar in our two-compartment rendition of the taper to that calculated with a 43-compartment representation.
To determine the goodness of fit of the model to experimental data, we compared the predicted fluorescence traces point-by-point with data imported into Mathematica; the squared errors for compartments 2, 4, 6, and 8 were then calculated. After a reasonable fit had been achieved for each stereocilium, the model was refined for five stereocilia simultaneously by use of an optimization routine that minimized the summed squared error.
The graphical output of Mathematica provided preliminary figures, which were prepared for publication with Canvas (version 3.5 or 5.0.2; Deneba Software, Miami, FL).
Parameter values
Parameter values were obtained in one of four ways (see Table 1). First, many values, such as the Ca2+-binding constants for fluo-3, were taken from the literature. Second, the values of some parameters were measured for each stereocilium to be fit. These parameters included the length of the stereocilium, the concentrations of fluo-3 and EGTA in the internal solution, and the whole-cell response before, during, and after hair-bundle deflection. Third, the values of some free parameters, including the concentration and binding constants of the fixed buffer, were chosen to achieve the best fit to the data derived from multiple stereocilia. Finally, three free parameters were varied for each stereocilium to refine its fit: the sensitivity of the confocal system, the number of transduction channels in the first compartment, and the somatic Ca2+ concentration, which was allowed to vary between 0.015 and 0.70 μm. A total of eight free parameters was included in the model.
Table 1 provides a list of parameter values for a typical experiment. These specific values were used in calculating the responses for Figure3. For all other fits, the parameter values that differed from those in Table 1, excepting the dark signal, are provided in the figure legends.
Footnotes
This investigation was supported by National Institutes of Health Grant DC00241 and by a Howard Hughes Medical Institute predoctoral fellowship to E.A.L. A.J.H. is an Investigator of Howard Hughes Medical Institute. We thank Mr. Y. Choe for assistance with Mathematica programming, Dr. J. Phelps and Mr. C. McKinney for LabVIEW programming, Drs. J. Albanesi, K. Luby-Phelps, and V. Markin for discussions, and Dr. C. Chabbert for a fluo-3 AM–loading protocol. Drs. J. Howard, F. Jaramillo, and S. Simon and the members of our research group provided valuable comments on this manuscript.
Correspondence should be addressed to Dr. A. J. Hudspeth, Howard Hughes Medical Institute and Laboratory of Sensory Neuroscience, Box 314, The Rockefeller University, 1230 York Avenue, New York, NY 10021-6399.
Dr. Lumpkin’s present address: Department of Physiology and Biophysics, Box 357290, University of Washington School of Medicine, Seattle, WA 98195-7290.
REFERENCES
- 1.Apicella S, Chen S, Bing R, Penniston JT, Llinás R, Hillman DE. Plasmalemmal ATPase calcium pump localizes to inner and outer hair bundles. Neuroscience. 1997;79:1145–1151. doi: 10.1016/s0306-4522(97)00035-3. [DOI] [PubMed] [Google Scholar]
- 2.Assad JA, Corey DP. An active motor model for adaptation by vertebrate hair cells. J Neurosci. 1992;12:3291–3309. doi: 10.1523/JNEUROSCI.12-09-03291.1992. [DOI] [PMC free article] [PubMed] [Google Scholar]
- 3.Assad JA, Hacohen N, Corey DP. Voltage dependence of adaptation and active bundle movement in bullfrog saccular hair cells. Proc Natl Acad Sci USA. 1989;86:2918–2922. doi: 10.1073/pnas.86.8.2918. [DOI] [PMC free article] [PubMed] [Google Scholar]
- 4.Assad JA, Shepherd GMG, Corey DP. Tip-link integrity and mechanical transduction in vertebrate hair cells. Neuron. 1991;7:985–994. doi: 10.1016/0896-6273(91)90343-x. [DOI] [PubMed] [Google Scholar]
- 5.Baird RA, Steyger PS, Schuff NR. Intracellular distributions and putative functions of calcium-binding proteins in the bullfrog vestibular otolith organs. Hear Res. 1997;103:85–100. doi: 10.1016/s0378-5955(96)00167-0. [DOI] [PubMed] [Google Scholar]
- 6.Berg HC. Random walks in biology, Expanded edition. Princeton UP; Princeton, NJ: 1993. [Google Scholar]
- 7.Bosher SK, Warren RL. Very low calcium content of cochlear endolymph, an extracellular fluid. Nature. 1978;273:377–378. doi: 10.1038/273377a0. [DOI] [PubMed] [Google Scholar]
- 8.Bremer A, Aebi U. The structure of the F-actin filament and the actin molecule. Curr Opin Cell Biol. 1992;4:20–26. doi: 10.1016/0955-0674(92)90054-g. [DOI] [PubMed] [Google Scholar]
- 9.Burlacu S, Tap WD, Lumpkin EA, Hudspeth AJ. ATPase activity of myosin in hair bundles of the bullfrog’s sacculus. Biophys J. 1997;72:263–271. doi: 10.1016/S0006-3495(97)78665-X. [DOI] [PMC free article] [PubMed] [Google Scholar]
- 10.Carafoli E, Stauffer T. The plasma membrane calcium pump: functional domains, regulation of the activity, and tissue specificity of isoform expression. J Neurobiol. 1994;25:312–324. doi: 10.1002/neu.480250311. [DOI] [PubMed] [Google Scholar]
- 11.Corey DP, Hudspeth AJ. Ionic basis of the receptor potential in a vertebrate hair cell. Nature. 1979;281:675–677. doi: 10.1038/281675a0. [DOI] [PubMed] [Google Scholar]
- 12.Corey DP, Hudspeth AJ. Analysis of the microphonic potential of the bullfrog sacculus. J Neurosci. 1983a;3:942–961. doi: 10.1523/JNEUROSCI.03-05-00942.1983. [DOI] [PMC free article] [PubMed] [Google Scholar]
- 13.Corey DP, Hudspeth AJ. Kinetics of the receptor current in bullfrog saccular hair cells. J Neurosci. 1983b;3:962–976. doi: 10.1523/JNEUROSCI.03-05-00962.1983. [DOI] [PMC free article] [PubMed] [Google Scholar]
- 14.Cox JA, Comte M, Mamar-Bachi A, Milos M, Schaer J-J. Cation binding to calmodulin and relation to function. In: Gerday C, Gilles R, Bolis L, editors. Calcium and calcium-binding proteins. Springer; Berlin: 1988. pp. 141–162. [Google Scholar]
- 15.Crawford AC, Evans MG, Fettiplace R. Activation and adaptation of transducer currents in turtle hair cells. J Physiol (Lond) 1989;419:405–434. doi: 10.1113/jphysiol.1989.sp017878. [DOI] [PMC free article] [PubMed] [Google Scholar]
- 16.Crawford AC, Evans MG, Fettiplace R. The actions of calcium on the mechano-electrical transducer current of turtle hair cells. J Physiol (Lond) 1991;434:369–398. doi: 10.1113/jphysiol.1991.sp018475. [DOI] [PMC free article] [PubMed] [Google Scholar]
- 17.Creighton TE. In: Proteins: structures and molecular properties, 2nd edition, pp 267–268. Freeman; New York: 1993. [Google Scholar]
- 18.Crouch JJ, Schulte BA. Expression of plasma membrane Ca-ATPase in the adult and developing gerbil cochlea. Hear Res. 1995;92:112–119. doi: 10.1016/0378-5955(95)00201-4. [DOI] [PubMed] [Google Scholar]
- 19.de Arruda MV, Watson S, Lin CS, Leavitt J, Matsudaira P. Fimbrin is a homologue of the cytoplasmic phosphoprotein plastin and has domains homologous with calmodulin and actin gelation proteins. J Cell Biol. 1990;111:1069–1079. doi: 10.1083/jcb.111.3.1069. [DOI] [PMC free article] [PubMed] [Google Scholar]
- 20.Denk W, Holt JR, Shepherd GMG, Corey DP. Calcium imaging of single stereocilia in hair cells: localization of transduction channels at both ends of tip links. Neuron. 1995;15:1311–1321. doi: 10.1016/0896-6273(95)90010-1. [DOI] [PubMed] [Google Scholar]
- 21.DeRosier DJ, Tilney LG, Egelman E. Actin in the inner ear: the remarkable structure of the stereocilium. Nature. 1980;287:291–296. doi: 10.1038/287291a0. [DOI] [PubMed] [Google Scholar]
- 22.Eatock RA, Corey DP, Hudspeth AJ. Adaptation of mechanoelectrical transduction in hair cells of the bullfrog’s sacculus. J Neurosci. 1987;7:2821–2836. doi: 10.1523/JNEUROSCI.07-09-02821.1987. [DOI] [PMC free article] [PubMed] [Google Scholar]
- 23.Eberhard M, Erne P. Kinetics of calcium binding to fluo-3 determined by stopped-flow fluorescence. Biochem Biophys Res Commun. 1989;163:309–314. doi: 10.1016/0006-291x(89)92136-0. [DOI] [PubMed] [Google Scholar]
- 24.Estes JE, Selden LA, Kinosian HJ, Gershman LC. Tightly-bound divalent cation of actin. J Muscle Res Cell Motil. 1992;13:272–284. doi: 10.1007/BF01766455. [DOI] [PubMed] [Google Scholar]
- 25.Flock Å, Bretscher A, Weber K. Immunohistochemical localization of several cytoskeletal proteins in inner ear sensory and supporting cells. Hear Res. 1982;6:75–89. doi: 10.1016/0378-5955(82)90082-x. [DOI] [PubMed] [Google Scholar]
- 26.Franks F. Protein hydration. In: Franks F, editor. Protein biotechnology: isolation, characterization, and stabilization. Humana; Totowa, NJ: 1993. pp. 437–465. [Google Scholar]
- 27.Géléoc GSG, Lennan GWT, Richardson GP, Kros CJ. A quantitative comparison of mechanoelectrical transduction in vestibular and auditory hair cells of neonatal mice. Proc R Soc Lond [Biol] 1997;264:611–621. doi: 10.1098/rspb.1997.0087. [DOI] [PMC free article] [PubMed] [Google Scholar]
- 28.Gillespie PG. Molecular machinery of auditory and vestibular transduction. Curr Opin Neurobiol. 1995;5:449–455. doi: 10.1016/0959-4388(95)80004-2. [DOI] [PubMed] [Google Scholar]
- 29.Gillespie PG, Corey DP. Myosin and adaptation by hair cells. Neuron. 1997;19:955–958. doi: 10.1016/s0896-6273(00)80387-6. [DOI] [PubMed] [Google Scholar]
- 30.Gillespie PG, Wagner MC, Hudspeth AJ. Identification of a 120 kDa hair-bundle myosin located near stereociliary tips. Neuron. 1993;11:581–594. doi: 10.1016/0896-6273(93)90071-x. [DOI] [PubMed] [Google Scholar]
- 31.Hacohen N, Assad JA, Smith WJ, Corey DP. Regulation of tension on hair-cell transduction channels: displacement and calcium dependence. J Neurosci. 1989;9:3988–3997. doi: 10.1523/JNEUROSCI.09-11-03988.1989. [DOI] [PMC free article] [PubMed] [Google Scholar]
- 32.Hall JD, Betarbet S, Jaramillo F. Endogenous buffers limit the spread of free calcium in hair cells. Biophys J. 1997;73:1243–1252. doi: 10.1016/S0006-3495(97)78157-8. [DOI] [PMC free article] [PubMed] [Google Scholar]
- 33.Hao L, Rigaud JL, Inesi G. Ca2+/H+ countertransport and electrogenicity in proteoliposomes containing erythrocyte plasma membrane Ca-ATPase and exogenous lipids. J Biol Chem. 1994;269:14268–14275. [PubMed] [Google Scholar]
- 34.Henzl MT, Shibasaki O, Comegys TH, Thalmann I, Thalmann R. Oncomodulin is abundant in the organ of Corti. Hear Res. 1997;106:105–111. doi: 10.1016/s0378-5955(97)00005-1. [DOI] [PubMed] [Google Scholar]
- 35.Hille B. Ionic channels of excitable membranes, 2nd edition. Sinauer; Sunderland, MA: 1992. [Google Scholar]
- 36.Holton T, Hudspeth AJ. The transduction channel of hair cells from the bull-frog characterized by noise analysis. J Physiol (Lond) 1986;375:195–227. doi: 10.1113/jphysiol.1986.sp016113. [DOI] [PMC free article] [PubMed] [Google Scholar]
- 37.Howard J, Hudspeth AJ. Mechanical relaxation of the hair bundle mediates adaptation in mechanoelectrical transduction by the bullfrog’s saccular hair cell. Proc Natl Acad Sci USA. 1987;84:3064–3068. doi: 10.1073/pnas.84.9.3064. [DOI] [PMC free article] [PubMed] [Google Scholar]
- 38.Howard J, Hudspeth AJ. Compliance of the hair bundle associated with gating of mechanoelectrical transduction channels in the bullfrog’s saccular hair cell. Neuron. 1988;1:189–199. doi: 10.1016/0896-6273(88)90139-0. [DOI] [PubMed] [Google Scholar]
- 39.Howard J, Roberts WM, Hudspeth AJ. Mechanoelectrical transduction by hair cells. Annu Rev Biophys Biophys Chem. 1988;17:99–124. doi: 10.1146/annurev.bb.17.060188.000531. [DOI] [PubMed] [Google Scholar]
- 40.Hudspeth AJ. Extracellular current flow and the site of transduction by vertebrate hair cells. J Neurosci. 1982;2:1–10. doi: 10.1523/JNEUROSCI.02-01-00001.1982. [DOI] [PMC free article] [PubMed] [Google Scholar]
- 41.Hudspeth AJ. How the ear’s works work. Nature. 1989;341:397–404. doi: 10.1038/341397a0. [DOI] [PubMed] [Google Scholar]
- 42.Hudspeth AJ. Mechanical amplification of stimuli by hair cells. Curr Opin Neurobiol. 1997;7:480–486. doi: 10.1016/s0959-4388(97)80026-8. [DOI] [PubMed] [Google Scholar]
- 43.Hudspeth AJ, Corey DP. Sensitivity, polarity, and conductance change in the response of vertebrate hair cells to controlled mechanical stimuli. Proc Natl Acad Sci USA. 1977;74:2407–2411. doi: 10.1073/pnas.74.6.2407. [DOI] [PMC free article] [PubMed] [Google Scholar]
- 44.Hudspeth AJ, Gillespie PG. Pulling strings to tune transduction: adaptation by hair cells. Neuron. 1994;12:1–9. doi: 10.1016/0896-6273(94)90147-3. [DOI] [PubMed] [Google Scholar]
- 45.Issa NP, Hudspeth AJ. Clustering of Ca2+ channels and Ca2+-activated K+ channels at fluorescently labeled presynaptic active zones of hair cells. Proc Natl Acad Sci USA. 1994;91:7578–7582. doi: 10.1073/pnas.91.16.7578. [DOI] [PMC free article] [PubMed] [Google Scholar]
- 46.Issa NP, Hudspeth AJ. The entry and clearance of Ca2+ at individual presynaptic active zones of hair cells from the bullfrog’s sacculus. Proc Natl Acad Sci USA. 1996;93:9527–9532. doi: 10.1073/pnas.93.18.9527. [DOI] [PMC free article] [PubMed] [Google Scholar]
- 47.Jacobs RA, Hudspeth AJ. Ultrastructural correlates of mechanoelectrical transduction in hair cells of the bullfrog’s internal ear. Cold Spring Harb Symp Quant Biol. 1990;55:547–561. doi: 10.1101/sqb.1990.055.01.053. [DOI] [PubMed] [Google Scholar]
- 48.Jaramillo F, Hudspeth AJ. Localization of the hair cell’s transduction channels at the hair bundle’s top by iontophoretic application of a channel blocker. Neuron. 1991;7:409–420. doi: 10.1016/0896-6273(91)90293-9. [DOI] [PubMed] [Google Scholar]
- 49.Jørgensen F, Kroese ABA. Ionic selectivity of the mechano-electrical transduction channels in the hair cells of the frog sacculus. Acta Physiol Scand. 1994;151:7–16. doi: 10.1111/j.1748-1716.1994.tb09716.x. [DOI] [PubMed] [Google Scholar]
- 50.Jørgensen F, Kroese ABA. Ca selectivity of the transduction channels in the hair cells of the frog sacculus. Acta Physiol Scand. 1995;155:363–376. doi: 10.1111/j.1748-1716.1995.tb09986.x. [DOI] [PubMed] [Google Scholar]
- 51.Kao JP. Practical aspects of measuring [Ca2+] with fluorescent indicators. Methods Cell Biol. 1994;40:155–181. doi: 10.1016/s0091-679x(08)61114-0. [DOI] [PubMed] [Google Scholar]
- 52.Kaye CWC, Laby TH. In: Tables of physical and chemical constants and some mathematical functions, 15th edition, p 247. Longman; London: 1986. [Google Scholar]
- 53.Kimitsuki T, Ohmori H. The effect of caged calcium release on the adaptation of the transduction current in chick hair cells. J Physiol (Lond) 1992;458:27–40. doi: 10.1113/jphysiol.1992.sp019404. [DOI] [PMC free article] [PubMed] [Google Scholar]
- 54.Kubitscheck U, Pratsch L, Passow H, Peters R. Calcium pump kinetics determined in single erythrocyte ghosts by microphotolysis and confocal imaging. Biophys J. 1995;69:30–41. doi: 10.1016/S0006-3495(95)79875-7. [DOI] [PMC free article] [PubMed] [Google Scholar]
- 55.Lenzi D, Roberts WM. Calcium signalling in hair cells: multiple roles in a compact cell. Curr Opin Neurobiol. 1994;4:496–502. doi: 10.1016/0959-4388(94)90049-3. [DOI] [PubMed] [Google Scholar]
- 56.Lewis ER, Leverenz EL, Bialek WS. In: The vertebrate inner ear, pp 13–94. CRC; Boca Raton, FL: 1985. [Google Scholar]
- 57.Lide DR. In: CRC handbook of chemistry and physics, 77th edition (Lide DR, ed), p 5-94. CRC; Boca Raton, FL: 1996. [Google Scholar]
- 58.Luby-Phelps K (1998) In vitro vs. in vivo: do the assumptions of reductionist biology apply in the cell interior? Int Rev Cytol, in press.
- 59.Lumpkin EA, Hudspeth AJ. Detection of Ca2+ entry through mechanosensitive channels localizes the site of mechanoelectrical transduction in hair cells. Proc Natl Acad Sci USA. 1995;92:10297–10301. doi: 10.1073/pnas.92.22.10297. [DOI] [PMC free article] [PubMed] [Google Scholar]
- 60.Lumpkin EA, Marquis RE, Hudspeth AJ. The selectivity of the hair cell’s mechanoelectrical-transduction channel promotes Ca2+ flux at low Ca2+ concentrations. Proc Natl Acad Sci USA. 1997;94:10997–11002. doi: 10.1073/pnas.94.20.10997. [DOI] [PMC free article] [PubMed] [Google Scholar]
- 61.Marty A, Neher E. Tight-seal whole-cell recording. In: Sakmann B, Neher E, editors. Single-channel recording, 2nd edition. Plenum; New York: 1995. pp. 31–52. [Google Scholar]
- 62.Metcalf AB, Chelliah Y, Hudspeth AJ. Molecular cloning of a myosin Iβ isozyme that may mediate adaptation by hair cells of the bullfrog’s internal ear. Proc Natl Acad Sci USA. 1994;91:11821–11825. doi: 10.1073/pnas.91.25.11821. [DOI] [PMC free article] [PubMed] [Google Scholar]
- 63.Milligan RA, Whittaker M, Safer D. Molecular structure of F-actin and location of surface binding sites. Nature. 1990;348:217–221. doi: 10.1038/348217a0. [DOI] [PubMed] [Google Scholar]
- 64.Ohmori H. Mechano-electrical transduction currents in isolated vestibular hair cells of the chick. J Physiol (Lond) 1985;359:189–217. doi: 10.1113/jphysiol.1985.sp015581. [DOI] [PMC free article] [PubMed] [Google Scholar]
- 65.Ohmori H. Mechanical stimulation and fura-2 fluorescence in the hair bundle of dissociated hair cells of the chick. J Physiol (Lond) 1988;399:115–137. doi: 10.1113/jphysiol.1988.sp017071. [DOI] [PMC free article] [PubMed] [Google Scholar]
- 66.Pauls TL, Cox JA, Berchtold MW. The Ca2+-binding proteins parvalbumin and oncomodulin and their genes: new structural and functional findings. Biochim Biophys Acta. 1996;1306:39–54. doi: 10.1016/0167-4781(95)00221-9. [DOI] [PubMed] [Google Scholar]
- 67.Pickles JO, Comis SD, Osborne MP. Cross-links between stereocilia in the guinea pig organ of Corti, and their possible relation to sensory transduction. Hear Res. 1984;15:103–112. doi: 10.1016/0378-5955(84)90041-8. [DOI] [PubMed] [Google Scholar]
- 68.Pusch M, Neher E. Rates of diffusional exchange between small cells and a measuring patch pipette. Pflügers Arch. 1988;411:204–211. doi: 10.1007/BF00582316. [DOI] [PubMed] [Google Scholar]
- 69.Reizes O, Barylko B, Li C, Südhof TC, Albanesi JP. Domain structure of a mammalian myosin I. Proc Natl Acad Sci USA. 1994;91:6349–6353. doi: 10.1073/pnas.91.14.6349. [DOI] [PMC free article] [PubMed] [Google Scholar]
- 70.Ricci AJ, Fettiplace R. The effects of calcium buffering and cyclic AMP on mechanoelectrical transduction in turtle auditory hair cells. J Physiol (Lond) 1997;501:111–124. doi: 10.1111/j.1469-7793.1997.111bo.x. [DOI] [PMC free article] [PubMed] [Google Scholar]
- 71.Roberts WM. Spatial calcium buffering in saccular hair cells. Nature. 1993;363:74–76. doi: 10.1038/363074a0. [DOI] [PubMed] [Google Scholar]
- 72.Roberts WM. Localization of calcium signals by a mobile calcium buffer in frog saccular hair cells. J Neurosci. 1994;14:3246–3262. doi: 10.1523/JNEUROSCI.14-05-03246.1994. [DOI] [PMC free article] [PubMed] [Google Scholar]
- 73.Shepherd GMG, Corey DP. The extent of adaptation in bullfrog saccular hair cells. J Neurosci. 1994;14:6217–6229. doi: 10.1523/JNEUROSCI.14-10-06217.1994. [DOI] [PMC free article] [PubMed] [Google Scholar]
- 74.Smith MH (1970) Molecular weights of proteins and some other materials including sedimentation, diffusion, and frictional coefficients and partial specific volumes. In: Handbook of biochemistry: selected data for molecular biology, 2nd edition (Sober HA, ed), pp C-3–C-35. Cleveland: Chemical Rubber.
- 75.Smith PD, Liesegang GW, Berger RL, Czerlinski G, Podolsky RJ. A stopped-flow investigation of calcium ion binding by ethylene glycol bis(β-aminoethyl ether)-N,N′-tetraacetic acid. Anal Biochem. 1984;143:188–195. doi: 10.1016/0003-2697(84)90575-x. [DOI] [PubMed] [Google Scholar]
- 76.Solc CK, Derfler BH, Duyk GM, Corey DP. Molecular cloning of myosins from the bullfrog saccular macula: a candidate for the hair cell adaptation motor. Auditory Neurosci. 1994;1:63–75. [Google Scholar]
- 77.Tanford C. In: Physical chemistry of macromolecules, pp 336–364. Wiley; New York: 1961. [Google Scholar]
- 78.Tucker T, Fettiplace R. Confocal imaging of calcium microdomains and calcium extrusion in turtle hair cells. Neuron. 1995;15:1323–1335. doi: 10.1016/0896-6273(95)90011-x. [DOI] [PubMed] [Google Scholar]
- 79.Tucker T, Fettiplace R. Monitoring calcium in turtle hair cells with a calcium-activated potassium channel. J Physiol (Lond) 1996;494:613–626. doi: 10.1113/jphysiol.1996.sp021519. [DOI] [PMC free article] [PubMed] [Google Scholar]
- 80.Vanysek P. Ionic conductivity and diffusion at infinite dilution. In: Lide DR, editor. Handbook of chemistry and physics, 77th edition. CRC; Boca Raton, FL: 1996. pp. 5–98. [Google Scholar]
- 81.Walker RG, Hudspeth AJ. Calmodulin controls adaptation of mechanoelectrical transduction by hair cells of the bullfrog’s sacculus. Proc Natl Acad Sci USA. 1996;93:2203–2207. doi: 10.1073/pnas.93.5.2203. [DOI] [PMC free article] [PubMed] [Google Scholar]
- 82.Walker RG, Hudspeth AJ, Gillespie PG. Calmodulin and calmodulin-binding proteins in hair bundles. Proc Natl Acad Sci USA. 1993;90:2807–2811. doi: 10.1073/pnas.90.7.2807. [DOI] [PMC free article] [PubMed] [Google Scholar]
- 83.Walz W. Perforated patch-clamp technique. Neuromethods. 1995;26:155–171. [Google Scholar]
- 84.Webb RA, Dorey CK. The pixelated image. In: Pawley JB, editor. Handbook of biological confocal microscopy, 2nd edition. Plenum; New York: 1995. pp. 62–63. [Google Scholar]
- 85.Yamoah EN, Lumpkin EA, Dumont RA, Smith PJS, Hudspeth AJ, Gillespie PG. Plasma-membrane Ca2+-ATPase extrudes Ca2+ from hair-cell stereocilia. J Neurosci. 1998;18:610–624. doi: 10.1523/JNEUROSCI.18-02-00610.1998. [DOI] [PMC free article] [PubMed] [Google Scholar]