

Abstract
Glucocorticoid receptors (GRs) are glucocorticoid-activated transcription factors that modulate expression of a variety of neuronal genes. Appropriate control of GR expression is therefore critical for maintenance of cellular and organismic homeostasis. The present study assessed glucocorticoid regulation of the GR at the gene, mRNA, and protein level. Removal of circulating glucocorticoids (adrenalectomy) increased GR mRNA expression in CA1 and dentate gyrus (DG). Corticosterone (CORT) replacement normalized GR mRNA expression, whereas high doses slightly decreased GR mRNA in CA1. Parallel increases were observed using a probe complementary to the distal 3′ untranslated region, indicating that mRNA changes were not attributable to selection of alternative polyadenylation site. Expression of a GR intronic sequence was also increased by adrenalectomy, consistent with increased gene transcription. Analysis of regional GR protein expression by immunoautoradiography did not reveal changes in GR protein in pyramidal cell layers; however, increased GR signal was seen in the stratum radiatum, indicating redistribution of GR to the cytosol. Western blot analysis confirmed adrenalectomy-induced increases in hippocampal GR levels. Administration of the mineralocorticoid receptor (MR) antagonist spironolactone increased both GR mRNA and protein in CA1 and DG, consistent with MR-mediated inhibition of GR transcription. However, high-dose CORT treatment did not decrease GR mRNA or protein levels. Chronic stress exposure did not downregulate GR mRNA or protein in hippocampus. The results suggest that the hippocampal GR is subject to heterologous regulation by the MR. In contrast, GR autoregulation is only evident during prolonged exposure to high-circulating glucocorticoid levels.
Keywords: hippocampus, glucocorticoid receptor, mineralocorticoid receptor, mRNA regulation, stress, adrenalectomy, spironolactone
Glucocorticoid receptors (GRs) are the prime mediators of glucocorticoid action in brain. Glucocorticoid signals are transduced by two distinct receptor species: the mineralocorticoid receptor (MR) (or type 1 adrenocorticosteroid receptor) binds endogenous ligand [corticosterone (CORT) in the rat, cortisol in the human] with high affinity (KD = 0.5–1 nm), and is extensively bound at low levels of circulating glucocorticoids. The GR (or type 2 adrenocorticosteroid receptor) has a somewhat lower affinity (5–10 nm) and is extensively bound only during periods of high glucocorticoid release (e.g., during stress) (Reul and deKloet, 1985). On binding hormone, receptor–ligand complexes dimerize and bind to DNA (Drouin et al., 1992). At the DNA level, the ligand–receptor dimers act to modulate transcription of a staggering variety of genes (Herman, 1993). By way of this general genomic effect, glucocorticoids have the capacity to interact with multiple neuronal systems.
One of the prime neuronal targets for glucocorticoid action is the hippocampal formation. This region is known to possess the greatest levels of adrenocorticosteroid receptor binding and mRNA expression in brain (Reul and deKloet, 1985; Aronsson et al., 1988; Arriza et al., 1988; Reul et al., 1989). Within the hippocampus, GRs appear to mediate a variety of functions ranging from information processing to neuronal endangerment. For example, hippocampal GRs likely underlie the deleterious effects of glucocorticoids on learning and memory and long-term potentiation (Diamond and Rose, 1994; Bodnoff et al., 1995). In addition, the hippocampal GR is implicated in negative feedback inhibition of the hypothalamo–pituitary–adrenocortical (HPA) axis (Jacobson and Sapolsky, 1991). Finally, the deleterious effects of glucocorticoids on hippocampal neuronal survival appear to be mediated by the GR. Stress or high doses of exogenous glucocorticoids markedly enhance kainate-induced pyramidal cell death in vivo(Stein-Behrens et al., 1992), and glucocorticoids exacerbate cell death induced by glutamate or metabolic challenge in vitro(Tombaugh et al., 1992; Elliott et al., 1993). Interestingly, hippocampal adrenocorticosteroid receptor binding is downregulated under conditions of glucocorticoid excess, including chronic stress exposure, high-dose glucocorticoid treatment, and age-related glucocorticoid hypersecretion (Sapolsky et al., 1984; Sapolsky and McEwen, 1985; Herman et al., 1995; Makino et al., 1995). These data have fueled the hypothesis that high glucocorticoid levels contribute to cognitive decline and hippocampal cell loss by way of GR-associated signaling (Sapolsky et al., 1986; Brady et al., 1991; Landfield and Eldridge, 1991).
The importance of the GR in regulation of hippocampal function and cell viability mandates a keen understanding of mechanisms controlling cellular GR biosynthesis. Studies to date indicate that the hippocampal GR is upregulated at both the binding and mRNA level by adrenalectomy, suggesting glucocorticoid autoregulation (Tornello et al., 1982; Herman et al., 1989; Reul et al., 1989). Stress and high-dose glucocorticoid treatment appear to downregulate hippocampal GR binding, also consistent with autoregulation (Sapolsky et al., 1984; Sapolsky and McEwen, 1985). However, effects at the mRNA level have been more limited (Herman et al., 1989, 1995; Reul et al., 1989), suggesting the potential for dissociation between mRNA expression and functional receptor expression. In depth in vivo analysis of GR protein regulation has yet to be definitively explored. Furthermore, although glucocorticoids are capable of influencing GR expression, there is no definitive understanding of the respective roles played by MR and GR in this action. The present study is therefore designed to define transcriptional and translational mechanisms underlying glucocorticoid regulation of hippocampal GRs in vivo.
MATERIALS AND METHODS
Subjects
Subjects were male Sprague Dawley rats, weighing between 250 and 300 gm. All rats were maintained on a 12 hr light/dark cycle in an environment with constant temperature and humidity. Animals had access to food and water ad libitum. All animal procedures were performed in accordance with the National Institutes of Health guidelines, using protocols approved by the University of Kentucky Institutional Animal Care and Use Committee.
In vivo protocols
Modulation of circulating glucocorticoid levels. To examine effects of steroid depletion and supplementation on GR RNA expression, groups of adrenalectomized (ADX) and sham-adrenalectomized (SHAM) rats were purchased from Harlan Sprague Dawley (Indianapolis, IN). Four days after arrival (10 d after surgery), rats were divided into four groups, anesthetized with Metofane, and implanted with 80–120 mg steroid-containing pellets. Groups were treated as follows: (1) the SHAM-cholesterol (SHAM-CHOL) group received pellets made of 100% cholesterol, serving as the baseline control group (n = 5); (2) the ADX-CHOL group received pellets made of 100% cholesterol and represented the steroid-depleted group (n = 6); (3) the ADX-corticosterone (ADX-CORT) group received pellets containing 30% corticosterone and 70% CHOL, representing a replacement dose of CORT (n = 6); and (4) the SHAM-CORT group received an 80% CORT pellet, yielding high resting levels of CORT (n = 5). After surgery, ADX-CHOL rats received 0.9% saline to drink. All rats survived for 4 d, at which point they were killed by rapid decapitation between 9:00 and 11:00 A.M. This time point is within the circadian nadir of endogenous CORT secretion and is within the period of stable expression of hippocampal GR and MR mRNAs (Herman et al., 1993). Brains were rapidly removed and frozen in isopentane cooled to −50°C on dry ice and stored at −80°C. Core blood samples were collected on ice, and serum was separated by centrifugation and maintained frozen at −20°C.
Additional groups of rats (n = 4 per group) were processed to assess protein changes in hippocampus by immunoautoradiography and Western blot analysis. Animals were treated identically to those above (killed between 9:00 and 11:00 A.M.). After decapitation, brains were bisected in the sagittal plane and one-half was frozen in isopentane, as noted above. The hippocampus and frontoparietal cortex were dissected from the other half and frozen on dry ice. Serum samples were obtained as above.
Exogenous steroid–steroid receptor antagonist treatment. To assess the effects of CORT and MR blockade on hippocampal GR expression, additional groups received injections twice daily of 50 mg/kg spironolactone (SPIRO) in sesame oil, 5 mg/kg CORT in sesame oil, or sesame oil vehicle (n = 5 per group). The selected dose of spironolactone was based on effective doses reported in previous in vivo studies (Grupp et al., 1985; Semler et al., 1989; Baron et al., 1991). Although effective in blocking the MR, this dose of spironolactone is not reported to cause overt illness or debilitation even with prolonged treatment (Semler et al., 1989). Animals were injected for 3 d, at which point they were processed as above. Animals were killed 4 hr after the last injection (12:00 P.M.). It should be noted that SPIRO-treated rats did not lose weight over the three testing days and were not demonstrably ill, indicating that the results of SPIRO treatment are unlikely to be associated with general sickness.
Chronic intermittent stress regimen. To assess effects of chronic stress on GR function, groups of rats were exposed to a chronic intermittent stress paradigm previously characterized by our laboratory (Herman et al., 1995). This paradigm involves random exposure to a number of different stressors twice daily over a period of 30 d. Stressors used in the experiment included: restraint [1 hr in plastic restraint cages (Plas Labs)], cold exposure (1 hr in a 4°C cold room), cold water swim (10 min in 11–15°C water), warm water swim (20 min in 26–30°C water), vibration [six animals per cage placed on a shaker for 1 hr (1 cycle/sec)], crowding (six rats per cage for 24 hr), and isolation (one animal per cage for 24 hr). Controls consisted of handled rats, which were removed from their home cages, handled briefly, and replaced twice daily, and naive controls. The former control group is designed to control for biological changes associated with opening cages and handling rats for the stress regimen. Six rats were included in each group. All rats were killed between 9:00 and 11:00 A.M. by rapid decapitation on day 31, 16 hr after administration of the last stressor.
Tissue processing
Brains were sectioned at 15 μm on a Bright–Hacker cryostat and thaw-mounted onto Superfrost Plus slides. Slides were maintained at −20°C until processing for in situ hybridization or immunoautoradiography.
Hybridization probes
A summary of the probes used in this experiment is summarized in Figure 1. Assessment of GR RNA regulation was accomplished using probes that specifically recognized: (1) all mature mRNA forms (complementary to bases 2364–2815 of the published rat GR sequence, including the coding region and 3′ untranslated region); (2) the long polyadenylated form of the GR mRNA (complementary to bases 5579–6322, 3′ untranslated region 3′ to the first polyadenylation site); (3) the 5′ coding region of the mRNA (complementary to bases 524–1040, 5′ coding region); and (4) a coding region intron spanning exons 7 and 8 (constructed from an ∼800 bpHindIII-KpnI fragment; courtesy of K. Yamamoto, UCSF). Labeling reactions included 80 μCi [35S]UTP (specific activity 1176 Ci/mmol), 1× SP6 transcription buffer (Boehringer Mannheim, Indianapolis, IN), 15 mm DTT, 200 μm GTP, CTP, and ATP, 40 U of placental RNase inhibitor (40 U/μl) (Boehringer Mannheim), 1 μg linearized plasmid DNA, and 20 U of appropriate RNA polymerase (SP6 or T7, Boehringer Mannheim). Optimal visualization of the GR intron (GRin) sequence was obtained using double-labeled33P probes. In this case, labeling reactions included 60 μCi [33P]UTP, 60 μCi [33P]CTP, 200 μm GTP and ATP, and 10 μm UTP and CTP. Other reagents were added as above. Reactions were incubated at 37°C for 90 min. Subsequently, 12 U of RNase-free DNase I (Boehringer Mannheim) was added to digest the DNA template and, after 5 min at 37°C, the reaction mix was diluted to 100 μl with diethylpyrocarbonate-treated water, and ethanol was precipitated with 7.5 m ammonium acetate.
Fig. 1.

Diagram of the rat GR gene, illustrating regions recognized by GR RNA probes. GR5′ is complementary to exon 2 of the rat GR gene. GR3′A recognizes the distal portion of exon 9 and the proximal 3′ untranslated region.GR3′B complements sequences downstream of the first known polyadenylation site. GRin is complementary to sequences in the coding region intron, flanked by exons 7 and 8 of the GR gene.
Length and specific activity of the exon probes were: GR 3′A, 456 bp, 6.62 × 10⁴ Ci/mmol; GR 3′B, 743 bp, 1.09 × 10⁵ Ci/mmol; and GR 5′, 521 bp, 7.66 × 10⁴ Ci/mmol. The sequence of the intron probe was not presently available; assuming an 800 bp probe with a 50% UTP and CTP content, the labeling conditions would predict a specific activity of ∼4 × 10⁵ Ci/mmol.
In situ hybridization
Tissue sections were removed from the −80°C freezer and fixed for 30 min in 4% buffered paraformaldehyde. Sections were then deproteinated with proteinase K (0.1 μg/ml) for 15 min at 37°C. Slides were rinsed in nanopure water, washed in 0.1 mtriethanolamine, pH 8.0, for 2 min, and then washed for 10 min after addition of 0.25% acetic anhydride. Slides were then rinsed in 2× SSC and dehydrated in graded alcohols. Labeled GR probe was added to a hybridization buffer containing 50% formamide (Amresco) and 20 mm DTT, and 50 μl (1 × 10⁶ cpm) of diluted probe was applied to each slide. Slides were coverslipped, placed in moistened chambers, and incubated overnight at 55°C. After hybridization, coverslips were removed in 2× SSC and rinsed in fresh 2× SSC for 10 min. Slides were treated with RNase A (100 μg/ml) for 30 min at 37°C and transferred to fresh 2× SSC, then rinsed 3× in 0.2× SSC 10 min/wash, followed by a 1 hr wash in 0.2× SSC at 65°C. Slides were dehydrated in graded alcohols, dried at room temperature, and exposed for 14–21 d to Kodak (Eastman Kodak, Rochester, NY) BioMAX film.
Immunoautoradiography
Alternate series of tissue sections from rats processed forin situ hybridization were removed from the −20°C freezer, warmed to room temperature, and ringed with a PAP pen (Research Biochemicals, Natick, MA). Slides were then immersed in a blocking buffer containing a 1:50 dilution of either normal donkey serum or normal goat serum in 10 mm potassium PBS (KPBS), pH 7.2, for 30 min at room temperature. The normal serum corresponded to the species in which the secondary antibody was made (see below). Slides were then placed in humidified chambers, and sections were covered with 500 μl of primary antiserum (BUGR2, 1:4000 dilution or GR57, 1:4000 dilution) in blocking buffer (normal serum diluted 1:50 in KPBS) and incubated overnight at 4°C. After primary antiserum incubation, slides were rinsed three times in 10 mm KPBS and incubated in a secondary antibody solution containing either35S-labeled donkey anti-rabbit IgG (GR57) or35S-labeled donkey anti-mouse IgG (BUGR2), diluted 1:250 in KPBS. After 1 hr of incubation, the secondary antibody was removed, and the sections were washed three times in KPBS and dried under a stream of cold air. Slides were then exposed to x-ray film for 3–5 d.
Immunohistochemical controls included incubation of tissue with blocking buffer substituting for primary antiserum (no primary), and buffer substituting for secondary (no secondary). To determine whether the immunoautoradiography (IAR) procedure affords a linear relationship between autoradiographic detection and amount of radioactive secondary antibody, 1:10–1:50,000 dilutions of35S-labeled donkey anti-mouse IgG or donkey anti-rabbit IgG were immobilized onto nitrocellulose using a standard slot-blot apparatus. The nitrocellulose was then washed several times in KPBS and exposed to x-ray film for 3 d.
Western blot analysis
Frozen hippocampi were individually homogenized in a 50 mm Tris buffer (pH 7.2, 4°C) containing 6 mmMgCl2, 1 mm EDTA, 10% (w/v) sucrose, 1 mm phenylmethylsulfonyl fluoride, 3 mmbenzamidine, 1 mm leupeptin, 1 μg/ml of pepstatin, 1 μg/ml antipain, 1 μg/ml aprotinin, 1 μg/ml soybean trypsin inhibitor, and 1% SDS. The inclusion of SDS in the homogenization buffer ensures that both cytoplasmic and nuclear GR are present in the final supernatant. Homogenates were ultracentrifuged (105,000 × g), and the resulting supernatants from each sample were adjusted to a final protein concentration of 4 mg/ml (DC protein assay; Bio-Rad, Hercules, CA). Supernatants were mixed with Laemmeli’s sample buffer boiled for 5 min. Samples (50 μg) were loaded onto 7.5% bisacrylamide gels and separated by SDS-PAGE. Separate proteins were electrophoretically transferred from gels to nitrocellulose. GR protein was detected on nitrocellulose blots by the monoclonal antibody, BUGR2 (Affinity BioReagents). Immunopositive bands were visualized by a chemiluminescent method (ECL; Amersham, Arlington Heights, IL). The optical density of GR-reactive bands (∼97 kDa) visible on x-ray film were determined densitometrically (see below). Parallel blots revealed that ECL detection produces a linear relationship between amount of blotted protein and chemiluminescent signal, validating its use in the present experiments.
Hormone assays
Plasma samples were collected and stored at −20°C. Plasma CORT was assessed by radioimmunoassay, using a double-antibody kit from ICN Biochemicals (Costa Mesa, CA) (with 125I-labeled CORT used as tracer). All plasma samples for each assay were processed at the same time.
Data analysis
In situ hybridization, immunoautoradiography, and Western blot data were analyzed using NIH Image 1.55 software for Macintosh. Hippocampal subfields were defined according to the rat brain atlas of Paxinos and Watson (1986); measurements were taken from subfield CA1, CA3, dentate gyrus, and frontal cortex. For IAR, additional measurements were taken from the stratum radiatum adjacent CA1. Background signal was sampled over the corpus callosum, and was subtracted from all regions to obtain corrected gray level measures. Gray level measurements of Western blot ECL data and secondary antibody spotted on nitrocellulose were taken in like manner, with background determined over negative regions of the blots.
RESULTS
GR regulation: adrenalectomy–steroid replacement
Localization of GR mRNA (using the GR 3′A probe) in the hippocampus is presented in Figure 2. In agreement with previous reports, there is an obvious increase in GR 3′A signal in subfields CA1, CA3, and dentate gyrus of ADX rats (Fig.2B) relative to control animals (Fig.2A).
Fig. 2.
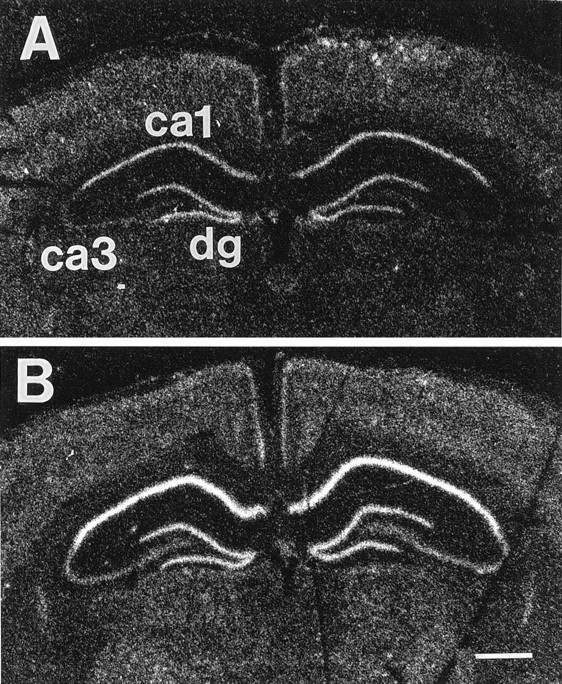
Localization of GR mRNA in hippocampus of sham-adrenalectomized (SHAM) (A) and adrenalectomized (ADX) (B) rats, using the GR3′A probe. Hybridization signal is particularly abundant in CA1 and dentate gyrus (dg) of both sham and ADX rats. Note the increase in signal intensity in CA1 and dg of ADX rats.
Hybridization signal generated by probes directed against the 3′ coding and proximal 3′ untranslated (GR3′A), the distal 3′ untranslated (GR3′B), the 5′ untranslated and coding region (GR5′), and a coding region intron spanning exons 7 and 8 (GRin) (Fig. 1) showed a similar pattern in all subfields. Subfield CA1 showed the highest level of expression of all GR mRNA forms (Fig. 3). Significant levels of expression were also seen in dentate gyrus and, to a lesser extent, CA3. Note that optimal detection of GR intron required cRNA probes labeled with both [33P]UTP and [33P]CTP, indicating that this RNA species is considerably less abundant than any mRNA form. The GR intron signal is distributed to all subfields with equal intensity. Note that despite low abundance, the GR intron signal is clearly specific, as hybridization is seen in extrahippocampal regions known to produce high levels of GR mRNA (parafascicular thalamus, cortex, and paraventricular hypothalamic nucleus). Furthermore, GR intron signal is not evident in sections pretreated with RNase A or in sections incubated with sense-strand probe (data not shown).
Fig. 3.
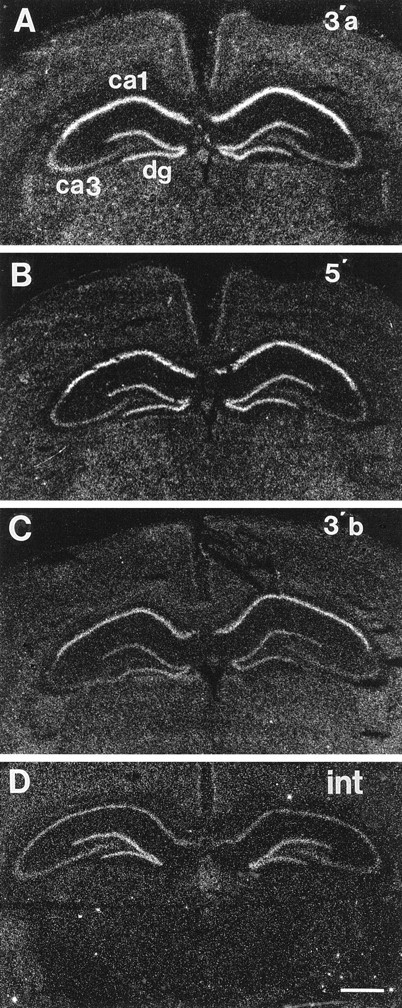
Distribution of GR3′A (A,3′a), GR5′ (B, 5′), GR3′B (C, 3′b), and GRin (D,int) signal in hippocampus. Note that GR3′A, GR5′, and GR3′B all show similar distribution of mRNA, with high hybridization density observed in CA1 and dentate gyrus (dg) and much lower signal intensity in CA3. The GRin probe revealed a much lower intensity signal, which was also concentrated in CA1 and DG.
Analysis of plasma corticosterone levels indicated efficacy of adrenalectomy and CORT treatment (Fig.4A). Plasma CORT levels were at the limit of detection in ADX rats implanted with cholesterol pellets, whereas ADX-CORT-replaced rats showed steady-state levels slightly above that of sham ADX rats (killed in the A.M.). Sham rats receiving high doses of exogenous CORT exhibited plasma CORT levels in the high physiological range (emulating peak values seen during acute stress).
Fig. 4.

Plasma CORT levels after adrenalectomy and steroid treatment (A), chronic intermittent stress (B), and exogenous administration of spironolactone or high-dose corticosterone (C).A, ADX rats implanted with cholesterol pellets (ADX/C) showed mean CORT levels that were at the limit of assay detection (5 ng/ml). Replacement with a 30% CORT (ADX/B) pellet restored circulating CORT to low physiological levels, not significantly different from sham ADX, cholesterol-treated rats (Sham/C). Implantation of 80% CORT pellets to adrenal-intact rats (Sham/B) resulted in high levels of circulating CORT, commensurate with levels seen during acute stress responses. B, Rats subjected to chronic intermittent stress exposure (Str) did not show significant increases in basal CORT relative to handled (Han) or unhandled (Unh) rats (p = 0.07, overall one-way ANOVA). C, Administration of the MR antagonist spironolactone (Spiro) did not affect resting CORT secretion relative to vehicle controls (Oil). In contrast, exogenous CORT treatment for 3 d (Cort) (last injection, 3 hr before death) produced supraphysiological levels of CORT.
The time point used for analysis of GR mRNA expression was selected on the basis of our previous studies, which demonstrated stable elevations in GR mRNA at 10–14 d after adrenalectomy (Patel et al., 1992). Semiquantitative analysis of GR RNA expression revealed significant effects of steroid depletion (Fig. 5). For the GR3′A probe, there was a significant effect of group on signal intensity in subfields CA1 (F(3,18) = 12.21;p < 0.01), CA3 (F(3,18) = 6.00; p < 0.01), and DG (F(3,18) = 4.07; p < 0.05).Post hoc analysis revealed significant differences between ADX-CHOL and all other groups in all subfields examined (p < 0.05, Duncan’s multiple range test). Note that high-dose CORT treatment (SHAM-CORT) did not elicit a decrease in GR mRNA expression in any field.
Fig. 5.

Semiquantitative analysis of in situ hybridization autoradiographs from sham ADX cholesterol-implanted rats (SHAM-C), high-dose B-treated rats (SHAM-B), ADX cholesterol-treated rats (ADX-C), and ADX rats receiving a replacement dose of B (ADX-B). Note that ADX-C rats show a significant increase in expression of all GR species in subfield CA1 (p < 0.05). Expression of mRNA species is increased in dentate gyrus (DG) as well; however, there was no change in expression of GR intron in this region. All adrenalectomy effects were normalized by CORT replacement. Note that high-dose CORT did not downregulate GR mRNA or hnRNA in any region.
Analysis of the GR5′ and GR3′B data revealed a similar pattern. For GR5′, significant effects of group were seen in CA1 (F(3,18) = 13.86; p < 0.01), CA3 (F(3,18) = 9.81; p < 0.01), and DG (F(3,18) = 5.35; p < 0.01). The ADX-CHOL was significantly increased relative to all other groups in all subfields (p < 0.05); however, in CA1 GR5′ expression was decreased in the SHAM-CORT group relative to SHAM-CHOL. For GR3′B, representing expression of only the long polyadenylated GR mRNA, significant effects of group were also seen in CA1 (F(3,18) = 30.10; p < 0.01), CA3 (F(3,18) = 4.78; p < 0.05), and DG (F(3,18) = 7.57; p< 0.05). As above, the ADX-CHOL group was significantly increased relative to all other groups in all subfields (p< 0.05). In subfield CA1, the SHAM-CORT group was significantly decreased relative to SHAM-CHOL and ADX-CORT animals. Note that basal level of expression of GR3′B was generally lower than that seen for GR3′A and GR5′, suggesting a lower abundance.
In contrast to the probe recognizing mRNA species, the GRin probe indicated significant effects of group only in subfield CA1 (F(3,16) = 5.41; p < 0.01). GRin signal was significantly increased in the ADX-CHOL group relative to all others. No changes were seen in CA3 or DG. It should be noted that expression of the GR intron appeared to be higher in DG than CA1, suggesting a differential between rate of GR synthesis and mature GR mRNA expression in this cell population.
Table 1 indicates correlations among signal intensities generated by the four probes in subfield CA1 of the hippocampus. Note that signals representing GR3′A, GR5′, and GR3′B expression were highly intercorrelated (r values = 0.87–0.92), consistent with coordinate regulation of the RNA forms. Significantly, GRin hybridization was positively significantly correlated with that of other variants, although the fit tended to be somewhat poorer than that seen among mRNA forms (r = 0.61–0.71). GR3′A, GR5′, and GR3′B signal intensities were also intercorrelated across subfields CA3 and DG. However, no significant correlation was observed between GR intron and mRNA expression in CA3 and DG, suggesting differential control of GR transcription in these cell layers.
Table 1.
Correlation table for GR hnRNA, mRNA measures
| GR 3′A | GR 5′ | GR 3′B | GR intron | |
|---|---|---|---|---|
| GR 3′A | 1.00 | |||
| GR 5′ | 0.91 | 1.00 | ||
| GR 3′B | 0.92 | 0.87 | 1.00 | |
| GR Intron | 0.67 | 0.61 | 0.70 | 1.00 |
Expression of GR protein was assessed by immunoautoradiography. This technique uses a radiolabeled secondary antibody to detect unlabeled primary antibody molecules that have bound to tissue sections. Assuming equivalent access of protein to antibody across treatment groups, this method generates an autoradiographic signal that is proportional to antigen content. This signal is then used to assess changes in amount of GR protein across treatment groups. The efficacy of this technique as an analytical tool has been established previously for tyrosine hydroxylase (Raisman et al., 1991; Blanchard et al., 1993) and corticotropin-releasing hormone (Herman and Morrison, 1996). Validation of the immunoautoradiographic analysis method for the present application is presented in Figure 6. Use of BUGR2 and GR57 antibodies showed congruent patterns of signal localization. In hippocampus, both antibodies produced labeling primarily in CA1 and DG (Fig.6A,B), consistent with patterns observed using standard immunohistochemistry (Ahima and Harlan, 1990) or in situ hybridization histochemistry (Fig.2A). No labeling was observed when primary antibody was omitted (Fig. 6C), indicating that the observed signal was not attributable to nonspecific binding of radiolabeled secondary antibody. GR signal was also observed in the hypothalamic paraventricular nucleus and in the central nucleus of the amygdala, regions previously shown to express significant levels of GR protein and mRNA (Fuxe et al., 1985; Aronsson et al., 1988; Sousa et al., 1989;Ahima and Harlan, 1990).
Fig. 6.
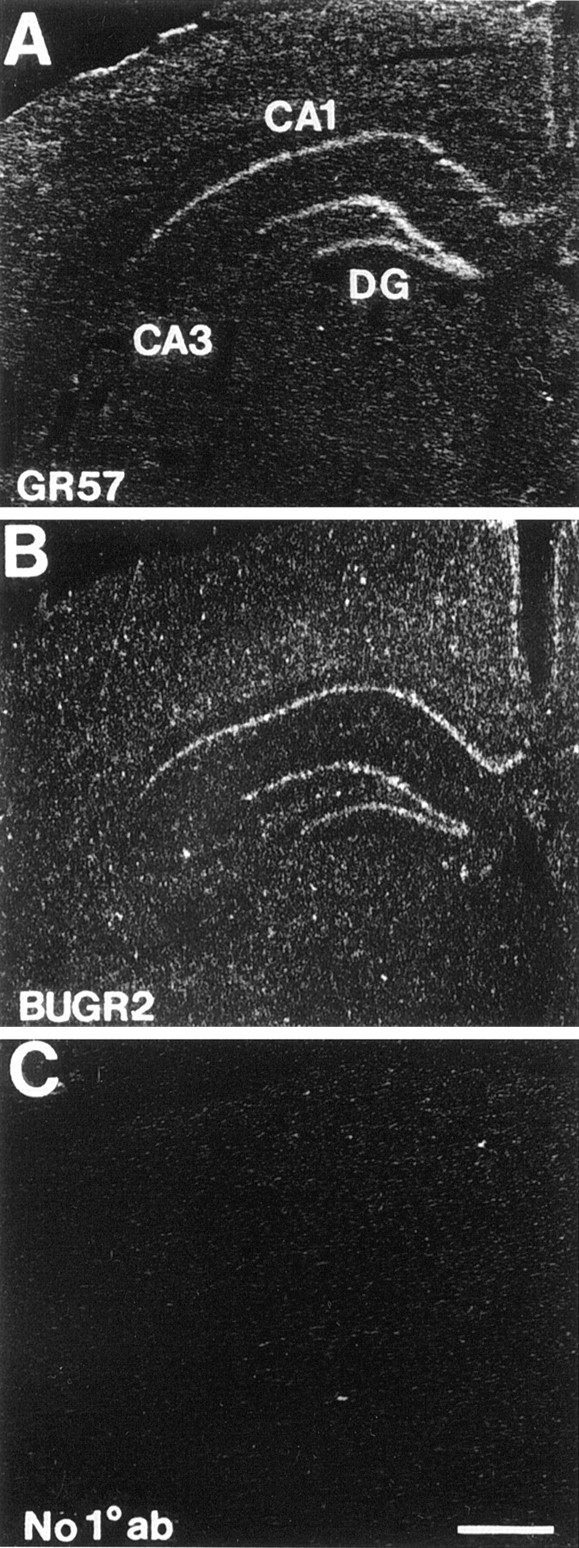
Characterization of immunoautoradiographic detection of GR protein in rat hippocampus. Use of both a rabbit polyclonal antibody (GR57) (A) and a mouse monoclonal antibody (BUGR2) (B) demonstrate equivalent signal distribution, concentrated in subfield CA1 and dentate gyrus (DG). No specific signal was generated on slides incubated with 35S-labeled secondary antibody in the absence of primary antisera (C).
To assess linearity of signal detection for GR immunoautoradiography, sequential dilutions of 35S-labeled secondary antibodies were blotted onto nitrocellulose and exposed to x-ray film for time periods equivalent those used for semiquantitative analyses. The results verify a linear relationship between the dilution of antibody blotted and signal intensity for both antibodies (Fig.7).
Fig. 7.

Standard curves assessing the relationship between concentration of nitrocellulose-immobilized 35S-labeled donkey anti-mouse IgG (top graph) or35S-labeled donkey anti-rabbit IgG (bottom graph) and autoradiographic signal intensity. A sample autoradiograph, obtained from sequential blots of anti-mouse IgG, is presented on the right (image was contrast–brightness-enhanced using Adobe Photoshop 4.0; two incidental blotches outside the radioactive lanes were digitally removed for clarity). Note the linear relationship between amount of blotted antibody and signal intensity exists over a broad range of dilutions, which encompass those corresponding to signal generated in autoradiographic images used for analysis (<60 gray level units).
Immunoautoradiographs of GR57 and BUGR2-generated signals are presented in Figure 8. The distribution of GR immunoreactivity is identical for the two antibodies. Interestingly, adrenalectomy does not appear to noticeably increase GR protein expression in pyramidal cell layers of the hippocampus (Fig. 8, compareA,B,; C,D). However, a significant increase in signal was seen in the stratum radiatum, corresponding to dendrites of CA1 pyramidal cells. These results are consistent with the known increase in cytoplasmic receptors with adrenalectomy, consequent to the inability of the GR to translocate to the nucleus in the absence of ligand.
Fig. 8.
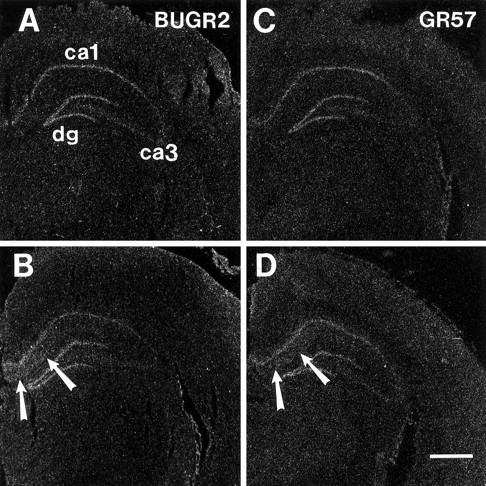
Distribution of GR immunoreactivity in the hippocampus of SHAM (A, C) and ADX (B, D) rats, visualized by immunoautoradiography. In response to adrenalectomy, a significant increase in GR signal is seen in the stratum radiatum using both antibodies. The spread of signal is consistent with accumulation of the GR in cytoplasmic compartments after adrenalectomy.
Semiquantitative analysis verifies that adrenalectomy does not increase GR57 or BUGR2 signal in pyramidal cell layers of the hippocampus or in the dentate gyrus (Fig. 9). However, analysis of BUGR2 immunoreactivity in the stratum radiatum revealed a significant effect of group on detectable signal (Fig.10) (F(3,13) = 3.83; p < 0.05). The main effect of group on GR57 immunoreactivity in stratum radiatum was also statistically significant (F(3,12) = 4.21;p < 0.05). Both antibodies revealed significantly elevated GR immunoreactivity in ADX-CHOL rats relative to intact or CORT-replaced animals (p values < 0.05, Duncan’s multiple range test).
Fig. 9.

Semiquantitative analysis of GR immunoreactivity in the hippocampus (stratum pyramidale and stratum granulosum) of sham ADX cholesterol-implanted rats (SHAM-CHOL), high-dose B-treated rats (SHAM-CORT), ADX cholesterol-treated rats (ADX-CHOL), and ADX rats receiving a replacement dose of B (ADX-CORT). A, Results obtained with the BUGR2 antibody; B, results obtained with the GR57 antibody. Note that no changes in GR protein expression are observed in any subfield.
Fig. 10.

Semiquantitative analysis of GR immunoreactivity in the stratum radiatum of sham ADX cholesterol-implanted rats (S/C), high-dose B-treated rats (S/B), ADX cholesterol-treated rats (A/C), and ADX rats receiving a replacement dose of B (A/B). A, Results obtained with the BUGR2 antibody;B, results obtained with the GR57 antibody. GR immunoreactivity in this region is significantly increased by adrenalectomy, consistent with aggregation of immunoreactivity in dendrites of CA1 pyramidal cells. Adrenalectomy effects are reversed by CORT replacement.
Parallel protein analysis was performed by Western blot analysis, using tissue from the contralateral hippocampus of those processed for histological analysis, above. Results are presented in Figure11. There was a significant effect of group on GR signal in hippocampus (F(3,14) = 8.66; p < 0.01) and cortex (F(3,13) = 16.96; p < 0.01). As was the case for GR mRNA levels and GR protein levels as determined by immunoautoradiography, the overall group effect was the result of significantly greater GR protein levels in hippocampal and cortical extract from ADX cholesterol-treated rats relative to the other three treatment groups (p < 0.05, Duncan’s multiple range test).
Fig. 11.

Western blot analysis of GR immunoreactivity in the hippocampus and cortex of sham ADX cholesterol-implanted rats (SHAM-CHOL, n = 4), high-dose CORT-treated rats (SHAM-CORT,n = 5), ADX cholesterol-treated rats (ADX-CHOL, n = 5), and ADX rats receiving a replacement dose of CORT (ADX-CORT, n = 3–4). In both hippocampus and cortex, GR immunoreactivity was significantly increased in the ADX-CHOL group (a,p < 0.05; b, p < 0.01). Decreases in SHAM-CORT animals did not reach statistical significance.
GR regulation: chronic intermittent stress
Resting plasma CORT levels for chronic intermittent stress, handled, and unhandled groups are indicated in Figure4B. Overall analysis of the variance showed a trend toward an effect of group on basal CORT secretion (F(2,11) = 3.38; p = 0.07). However, it should be noted that the cumulative impact of chronic stress on the HPA axis was evident from a significant effect of stress on adrenal weight (F(2,13) = 8.37;p < 0.05), carried by increases in the stress group relative to both handled and unhandled rats [stress, 15.97 ± 0.84 mg/100 gm of body weight; handled, 12.74 ± 0.41 mg/100 gm of body weight; and unhandled, 13.01 ± 0.46 mg/100 gm of body weight; increases between stressed and both control groups were statistically significant (p values < 0.05, Duncan’s multiple range test)]. Similar results have been observed previously using this paradigm, suggesting that chronic stress does not result in profound elevations in basal CORT secretion, at least at the time of the A.M. circadian trough (Herman et al., 1995; Prewitt and Herman, 1997). Figure 12 illustrates the effects of chronic intermittent stress on GR mRNA expression in hippocampus. Stress did not elicit decreases in GR mRNA expression in any subfield examined, relative to either handled or naive animals. Expression of GR protein was assessed on alternate series from the groups of stress and handled rats noted above, using the GR57 antibody. No significant changes in expression of GR protein were observed in any hippocampal subfield after chronic intermittent stress.
Fig. 12.

Effects of chronic intermittent stress on hippocampal GR mRNA (A, using GR3′A probe) and immunoreactivity (B, using GR57 antibody). No significant effect of stress on either mRNA or protein is observed in any region examined.
GR regulation: acute spironolactone or corticosterone administration
Effects of spironolactone and exogenous CORT on plasma CORT levels are illustrated in Figure 4C. Blockade of the MR with spironolactone did not produce increased basal CORT secretion. In contrast, plasma CORT levels were markedly increased by the CORT-dosing regimen, with the last injection occurring 3 hr before death.
Regulation of GR mRNA expression was assessed after administration of the mineralocorticoid receptor antagonist spironolactone or high-dose corticosterone treatment (Fig. 13). Significant treatment-induced changes in GR mRNA expression (measured using the GR3′A probe) (Fig. 10A) were observed in subfield CA1 (F(2,8) = 10.59; p< 0.01) and in the DG (F(2,8) = 4.35;p = 0.05). The treatment effect approached significance in subfield CA3 (F(2,8) = 3.69;p = 0.07). In CA1 and DG, the GR mRNA expression in the SPIRO group was significantly elevated with respect to vehicle-treated controls. In contrast, CORT administration did not affect GR mRNA expression in any subfield examined. The lack of GR mRNA downregulation in the CORT group is quite intriguing, given that circulating corticosterone values rivaled acute stress responses (∼300 ng/ml) in this group.
Fig. 13.

Effects of spironolactone (SP) and high-dose (5 mg/kg) CORT treatment on hippocampal GR mRNA (A, using GR3′A probe) and immunoreactivity (B, using GR57 antibody). Injection of SP, an MR antagonist, increases GR mRNA in both CA1 and dentate gyrus (DG) by increments comparable to those seen after adrenalectomy (Fig. 4). Increases in GR protein were seen in CA1 as well. Note that high-dose CORT injection did not reduce GR mRNA or protein in any region examined.
Expression of GR protein was assessed in adjacent sections by immunoautoradiography, using the GR57 antibody (Fig.13B). There was a significant effect of group on GR57 immunoreactivity in subfield CA1 (F(2,12) = 4.87; p < 0.05), DG (F(2,12) = 9.73; p < 0.01), and cortex (F(2,12) = 8.07; p < 0.01). In all cases, post hoc analysis revealed significant differences between spironolactone-treated rats and CORT and vehicle-treated groups (p < 0.05, Duncan’s multiple range test).
DISCUSSION
Regulation of GR gene transcription and mRNA expression
The present report supports the hypothesis that hippocampal GR biosynthesis is controlled primarily at the level of transcription. In subfield CA1, glucocorticoid depletion increased expression of all GR RNA forms tested. Adrenalectomy-induced changes in CA1 GR 3′A, GR 3′B, GR5′, and GR intron probe hybridization were of strikingly similar magnitude and were significantly intercorrelated, suggesting a common mechanism of regulation. Changes observed at the mRNA level were reiterated by protein determinations, performed by parallel immunoautoradiographic and Western blot analyses.
The 3′ untranslated domains of mRNAs are known to contain sequences affecting mRNA stability (Nielsen and Shapiro, 1990). The GR possesses two primary polyadenylation sites, generating mature mRNAs of 6.5 and 4.8 kB (Miesfeld et al., 1986). Given the capacity for 3′ sequences downstream of the proximal polyadenylation sites to modulate stability, experiments were conducted to determine whether physiological stimuli alter expression of the various polyadenylated forms of GR mRNA. The GR3′A probe, which recognizes all mRNA forms, and the GR3′B probe, which recognizes the long form of GR mRNA, showed similar responses to adrenalectomy. Thus, it is unlikely that adrenalectomy-induced mRNA changes are attributable to selection of alternative polyadenylation sites.
Previous studies have established quite different hippocampal distributions of GR mRNA using probes complementary to 5′ or 3′ sequences of GR mRNA. Probes complementary to the 5′ portion of the molecule indicate high expression of GR mRNA in CA3, rivaling that seen in CA1 or DG, whereas probes complementary to the 3′ region indicated that CA3 expression is quite a bit lower than CA1 or DG (Whitfield et al., 1990; Herman, 1993). In the present study, there was no evidence for differential GR mRNA expression in CA3 using the GR5′ and GR3′A/GR3′B probes. These data are thus inconsistent with the existence of incomplete or truncated GR transcripts.
Assessment of GR hnRNA was performed by intron-directed in situ hybridization (Herman et al., 1991, 1992; Herman and Watson, 1995). Analysis of adrenalectomy effects on GR intron levels indicated a significant increase with steroid removal, consistent with induction of the GR gene. Notably, the signal generated by the GRin probe was highest in the DG, in contrast to expression of mature mRNA forms, which show greatest signal intensity in CA1 (Fig. 3D). This pattern was also seen for MR intron expression (Herman and Watson, 1995), suggesting that both steroid receptor genes show significantly higher transcription rates in DG granule cells. The lack of concordance with mature mRNA suggests that mRNA splicing, translocation, and degradation may be differentially regulated in pyramidal versus granule cell populations.
The present studies further suggest that hippocampal GR transcription is preferentially affected by MR action in vivo. Rats treated with the MR antagonist spironolactone show increases in GR mRNA expression in CA1 and DG. The magnitude of change in both subfields is similar to that seen after adrenalectomy. These data suggest that the MR tonically inhibits GR biosynthesis in hippocampus, presumably by way of binding to glucocorticoid response elements present in the GR promoter region (Arriza et al., 1988; Rupprecht et al., 1993). Further support for this notion comes from studies showing that treatment of adrenalectomized rats with the selective MR agonist aldosterone attenuates adrenalectomy-induced upregulation of GR, as measured by receptor-binding studies (Miller et al., 1993).
Modulation of GR gene and mRNA expression by way of the GR is less clear-cut. Three days of high-dose CORT does not downregulate GR transcription, despite the generation of extremely high levels of circulating steroids. Similarly, exposure to 30 d of intermittent stress twice daily does not appear to significantly affect GR mRNA expression. However, animals implanted with 80% CORT pellets show significant decreases in GR5′ and GR3′B signal intensity in CA1, suggesting the potential for subfield-specific downregulation of the GR after long-term exposure to high levels of CORT.
The lack of GR downregulation after conditions producing high CORT levels is somewhat perplexing, given in vitro evidence for GR autoregulation (Oakley and Cidlowski, 1993) and evidence for loss of glucocorticoid binding after chronic stress or glucocorticoid administration (Sapolsky et al., 1984; Sapolsky and McEwen, 1985). The former may be reconciled by the interactive nature of the GR in vivo. For example, hippocampal neurons are susceptible to input from numerous neurochemical systems that are capable of affecting gene expression by second- and third-messenger pathways. Effects of CORT on impinging pathways may be sufficient to supercede the direct autoregulatory actions of the GR. In addition, in vitrostudies have typically used dexamethasone as a GR agonist. Dexamethasone predominantly binds to GR; as MR and GR appear to compete for the same response element (Arriza et al., 1987; Trapp et al., 1994), displacement of the MR by dexamethasone-activated GRs may change the valence and/or nature of glucocorticoid action.
The time points selected for use in the present study were designed to assess changes in steady-state GR expression after adrenalectomy or stress. The length of the delay between adrenalectomy or initiation of chronic stress and euthanasia may thus obscure dynamic changes in GR expression occurring over the first several days after onset of HPA drive; in line with this notion, GR mRNA levels have been shown to peak within 2 d of adrenalectomy (Holmes et al., 1995). Thus, it is possible that our failure to observe chronic stress-induced changes in GR regulation may be attributable to a return to prestimulus baseline expression over time.
GR protein expression
Western blot analysis was used to assess GR protein expression in the contralateral hippocampus of brains processed for in situ hybridization and immunoautoradiography (see below). The results indicate excellent agreement between the results of semiquantitative analysis of GR protein blots and the mRNA data, suggesting upregulation of GR protein expression in the hippocampi of ADX rats relative to appropriate controls. These data are consistent with previous binding studies using ADX rats (Tornello et al., 1982). Furthermore, experiments assessing GR protein and binding in parallel show excellent agreement between techniques (Spencer et al., 1994). Thus, these data suggest that transcriptional changes are readily translated into increases in protein expression.
Immunoautoradiography was used to assess regional changes in GR protein after steroid manipulation and stress. Applicability of this technique to the present study was verified by several methods. First, control experiments demonstrate that the signals observed in tissue sections were generated by primary antibody. Second, the relationship between autoradiographic signal and concentration of radiolabeled antibody was verified by immunoblots and shown to be linear across the range of signal intensity used in these studies. Third, both the GR57 and BUGR2 antibodies showed similar patterns of expression and similar effects of experimental treatments, indicating that effects on GR protein were not antibody-specific. In all, the available data indicate that the immunoautoradiographic technique is a suitable and valid method for assessment of GR protein in individual tissue sections.
Densitometric analysis of GR protein expression in the region of hippocampal pyramidal and granule cell bodies did not reveal significant change with adrenalectomy. However, both antibodies indicated a twofold to threefold increase in the dendritic zone of CA1 pyramidal cells in the stratum radiatum, indicative of a shift of immunoreactivity into the cytoplasmic compartment. This observation is consistent with previous observations noting greatly reduced nuclear translocation in ADX rats (Fuxe et al., 1985; Ahima and Harlan, 1990) caused by lack of ligand binding to cytosolic receptors. However, it should be noted that the increase in GR immunoreactivity in the dendritic zone is quite subtle; as noted in Figure 8, the level of GR expression in this region is only a fraction of the intensity seen in cell fields. Thus, changes in cellular immunoreactivity are somewhat discordant with large changes observed with adrenalectomy by RNA analysis, Western blot analysis, or binding (Tornello et al., 1982). Given previous data showing weak immunohistochemical staining of cytosolic GRs in ADX rats, it is possible that the presence of glucocorticoids is required for optimal GR57 and BUGR2 binding to the epitope in tissue sections.
Immunoautoradiography was used to assess changes in GR protein after steroid treatment and chronic intermittent stress. In this case, treatment with spironolactone resulted in a marked increase in GR protein expression in all hippocampal subfields. Changes in GR immunoreactivity were quite similar to those observed by in situ hybridization and suggest transcriptional regulation of GR biosynthesis by the neuronal MR. It should be noted that, unlike the ADX data, no accumulation of GR immunoreactivity was observed in the stratum radiatum. Thus, blockade of the MR is not sufficient to induce morphological changes characteristic of adrenalectomy. As spironolactone-treated rats maintain circulating corticosterone, it is likely that hippocampal GRs are available for ligand binding and are maintained in a configuration suitable for recognition by antibody.
No significant changes in hippocampal GR immunoreactivity were observed after replacement with 80% CORT pellets, twice-daily injections of 5 mg CORT, or 30 d of intermittent stress. These data disagree with previous studies using receptor-binding methods (Sapolsky et al., 1984;Sapolsky and McEwen, 1985; Eldridge et al., 1989). It is possible that this discrepancy may be attributable to differences in CORT dosing or stress intensity. For instance, previous studies used more prolonged CORT injection protocols and quite different stress regimens (Sapolsky et al., 1984; Sapolsky and McEwen, 1985; Eldridge et al., 1989). Indeed, the resistance of GR mRNA or protein levels to exogenous CORT-induced downregulation seen in this study is consistent with a previous study that found that very high steady-state levels of CORT (>300 ng/ml) were required to decrease hippocampal GR-binding levels (Spencer et al., 1991). These data suggest that glucocorticoid downregulation of the GR requires extensive and prolonged exposure to extremely high levels of CORT. The regulatory impact of milder CORT elevation, such as that induced by chronic stress, may be offset by stress-induced changes in other intracellular regulatory pathways capable of interacting with the neuronal GR.
Footnotes
This work was supported by National Institutes of Aging Grants AG12962 (J.P.H., R.S.) and AG10836 (J.P.H.). We thank Mark Dolgas, Dreama Rucker, Xiaohang Wang, and David Morrison for expert technical assistance.
Correspondence should be addressed to Dr. James P. Herman, Department of Anatomy and Neurobiology, University of Kentucky Medical Center, 800 Rose Street, Lexington, KY 40536-0084.
REFERENCES
- 1.Ahima RS, Harlan RE. Charting of type II glucocorticoid receptor-like immunoreactivity in the rat central nervous system. Neuroscience. 1990;39:579–604. doi: 10.1016/0306-4522(90)90244-x. [DOI] [PubMed] [Google Scholar]
- 2.Aronsson M, Fuxe K, Dong Y, Agnati LF, Okret S, Gustafsson J-A. Localization of glucocorticoid receptor mRNA in the male rat brain by in situ hybridization. Proc Natl Acad Sci USA. 1988;85:9331–9335. doi: 10.1073/pnas.85.23.9331. [DOI] [PMC free article] [PubMed] [Google Scholar]
- 3.Arriza JL, Weinberger C, Cerelli G, Glaser TM, Handelin BL, Housman DE, Evans RM. Cloning of the human mineralocorticoid receptor complementary DNA: structural and functional kinship with glucocorticoid receptor. Science. 1987;237:268–275. doi: 10.1126/science.3037703. [DOI] [PubMed] [Google Scholar]
- 4.Arriza JL, Simerly RB, Swanson LW, Evans RM. Neuronal mineralocorticoid receptor as a mediator of glucocorticoid response. Neuron. 1988;1:887–900. doi: 10.1016/0896-6273(88)90136-5. [DOI] [PubMed] [Google Scholar]
- 5.Baron A, Riesselmann A, Fregly MJ. Effect of chronic treatment with clonidine and spironolactone on cold-induced elevation of blood pressure. Pharmacology. 1991;43:173–186. doi: 10.1159/000138844. [DOI] [PubMed] [Google Scholar]
- 6.Blanchard V, Raisman VR, Savasta M, Hirsch E, Javoy AF, Feuerstein C, Agid Y. Cellular quantification of tyrosine hydroxylase in the rat brain by immunoautoradiography. J Neurochem. 1993;61:617–626. doi: 10.1111/j.1471-4159.1993.tb02166.x. [DOI] [PubMed] [Google Scholar]
- 7.Bodnoff SR, Humphreys AG, Lehman JC, Diamond DM, Rose GM, Meaney MJ. Enduring effects of chronic corticosterone treatment on spatial learning, synaptic plasticity, and hippocampal neuropathology in young and mid-aged rats. J Neurosci. 1995;15:61–69. doi: 10.1523/JNEUROSCI.15-01-00061.1995. [DOI] [PMC free article] [PubMed] [Google Scholar]
- 8.Brady LS, Whitfield HJ, Fox RJ, Gold PW, Herkenham M. Long-term antidepressant administration alters corticotropin- releasing hormone, tyrosine hydroxylase, and mineralocorticoid receptor gene expression in rat brain. Therapeutic implications. J Clin Invest. 1991;87:831–837. doi: 10.1172/JCI115086. [DOI] [PMC free article] [PubMed] [Google Scholar]
- 9.Diamond DM, Rose GM. Stress impairs LTP and hippocampal-dependent memory. Ann NY Acad Sci. 1994;746:411–414. doi: 10.1111/j.1749-6632.1994.tb39271.x. [DOI] [PubMed] [Google Scholar]
- 10.Drouin J, Sun YL, Tremblay S, Lavender P, Schmidt TJ, deLean A, Nemer M. Homodimer formation is rate limiting for high affinity binding by the glucocorticoid receptor. Mol Endocrinol. 1992;6:1299–1309. doi: 10.1210/mend.6.8.1406707. [DOI] [PubMed] [Google Scholar]
- 11.Eldridge JC, Brodish A, Kute TE, Landfield PW. Apparent age-related resistance of type 2 hippocampal corticosteroid receptors to down-regulation during chronic escape training. J Neurosci. 1989;9:3237–3242. doi: 10.1523/JNEUROSCI.09-09-03237.1989. [DOI] [PMC free article] [PubMed] [Google Scholar]
- 12.Elliott EM, Mattson MP, Vanderklish P, Lynch G, Chang I, Sapolsky RM. Corticosterone exacerbates kainate-induced alterations in hippocampal tau immunoreactivity and spectrin proteolysis in vivo. J Neurochem. 1993;61:57–67. doi: 10.1111/j.1471-4159.1993.tb03537.x. [DOI] [PubMed] [Google Scholar]
- 13.Fuxe K, Wikstrom AC, Okret S, Agnati LF, Harfstrand A, Yu ZY, Granholm L, Zoli M, Vale W, Gustafsson JA. Mapping of glucocorticoid receptor immunoreactive neurons in the rat tel- and diencephalon using a monoclonal antibody against rat liver glucocorticoid receptor. Endocrinology. 1985;117:1803–1812. doi: 10.1210/endo-117-5-1803. [DOI] [PubMed] [Google Scholar]
- 14.Grupp LA, Elias J, Perlanski E, Stewart RB. Modification of ethanol-induced motor impairment by diet, diuretic, mineralocorticoid, or prostaglandin synthetase inhibitor. Psychopharmacology (Berl) 1985;87:20–24. doi: 10.1007/BF00431771. [DOI] [PubMed] [Google Scholar]
- 15.Herman JP. Regulation of adrenocorticosteroid receptor mRNA expression in the central nervous system. Cell Mol Neurobiol. 1993;13:349–372. doi: 10.1007/BF00711577. [DOI] [PMC free article] [PubMed] [Google Scholar]
- 16.Herman JP, Morrison DG. Immunoautoradiographic and in situ hybridization analysis of corticotropin-releasing hormone biosynthesis in the hypothalamus paraventricular nucleus. J Chem Neuroanat. 1996;11:49–56. doi: 10.1016/0891-0618(96)00124-x. [DOI] [PubMed] [Google Scholar]
- 17.Herman JP, Watson SJ. Stress regulation of mineralocorticoid receptor heteronuclear RNA in rat hippocampus. Brain Res. 1995;677:243–249. doi: 10.1016/0006-8993(95)00152-g. [DOI] [PubMed] [Google Scholar]
- 18.Herman JP, Patel PD, Akil H, Watson SJ. Localization and regulation of glucocorticoid and mineralocorticoid receptor messenger RNAs in the hippocampal formation of the rat. Mol Endocrinol. 1989;3:1886–1894. doi: 10.1210/mend-3-11-1886. [DOI] [PubMed] [Google Scholar]
- 19.Herman JP, Schäfer MK-H, Watson SJ, Sherman TG. In situ hybridization analysis of arginine vasopressin gene transcription using intron-specific probes. Mol Endocrinol. 1991;5:1447–1456. doi: 10.1210/mend-5-10-1447. [DOI] [PubMed] [Google Scholar]
- 20.Herman JP, Schafer MK-H, Thompson RC, Watson SJ. Rapid regulation of CRH gene expression in vivo. Mol Endocrinol. 1992;6:1061–1069. doi: 10.1210/mend.6.7.1324419. [DOI] [PubMed] [Google Scholar]
- 21.Herman JP, Watson SJ, Chao HM, Coirini HM, McEwen BS. Diurnal regulation of glucocorticoid receptor and mineralocorticoid receptor mRNAs in the rat hippocampus. Mol Cell Neurosci. 1993;4:181–190. doi: 10.1006/mcne.1993.1022. [DOI] [PubMed] [Google Scholar]
- 22.Herman JP, Adams D, Prewitt CM. Regulatory changes in neuroendocrine stress-integrative circuitry produced by a variable stress paradigm. Neuroendocrinology. 1995;61:180–190. doi: 10.1159/000126839. [DOI] [PubMed] [Google Scholar]
- 23.Holmes MC, Yau JL, French KL, Seckl JR. The effect of adrenalectomy on 5-hydroxytryptamine and corticosteroid receptor subtype messenger RNA expression in rat hippocampus. Neuroscience. 1995;64:327–337. doi: 10.1016/0306-4522(94)00407-v. [DOI] [PubMed] [Google Scholar]
- 24.Jacobson L, Sapolsky RM. The role of the hippocampus in feedback regulation of the hypothalamo-pituitary-adrenocortical axis. Endocrine Rev. 1991;12:118–134. doi: 10.1210/edrv-12-2-118. [DOI] [PubMed] [Google Scholar]
- 25.Landfield PW, Eldridge JC. The glucocorticoid hypothesis of brain aging and neurodegeneration: recent modifications. Acta Endocrinol. 1991;125:54–64. [PubMed] [Google Scholar]
- 26.Makino S, Smith MA, Gold PW. Increased expression of corticotropin-releasing hormone and vasopressin messenger ribonucleic acid (mRNA) in the hypothalamic paraventricular nucleus during repeated stress: association with reduction in glucocorticoid receptor mRNA levels. Endocrinology. 1995;136:3299–3309. doi: 10.1210/endo.136.8.7628364. [DOI] [PubMed] [Google Scholar]
- 27.Miesfeld R, Rusconi S, Godowski P, Maler BA, Okret S, Wikstrom A-C, Gustafsson J-A, Yamamoto KR. Genetic complementation of a glucocorticoid deficiency by expression of cloned receptor cDNA. Cell. 1986;46:389–399. doi: 10.1016/0092-8674(86)90659-8. [DOI] [PubMed] [Google Scholar]
- 28.Miller AH, Spencer RL, Husain A, Rhee R, McEwen BS, Stein M. Differential expression of type I adrenal steroid receptors in immune tissues is associated with tissue-specific regulation of type II receptors by aldosterone. Endocrinology. 1993;133:2133–2140. doi: 10.1210/endo.133.5.8404663. [DOI] [PubMed] [Google Scholar]
- 29.Nielsen DA, Shapiro DJ. Insights into hormonal control of messenger RNA stability. Mol Endocrinol. 1990;4:953–957. doi: 10.1210/mend-4-7-953. [DOI] [PubMed] [Google Scholar]
- 30.Oakley RH, Cidlowski JA. Homologous down-regulation of the glucocorticoid receptor: the molecular machinery. Crit Rev Eukaryotic Gene Expr. 1993;3:63–88. [PubMed] [Google Scholar]
- 31.Patel PD, Kwak SP, Herman JP, Young EA, Akil H, Watson SJ. Functional heterogeneity of type I and type II corticosteroid receptor expression in rat hippocampus. In: Sheppard KE, Boublik JH, Funder JW, editors. Stress and reproduction. Raven; New York: 1992. pp. 1–17. [Google Scholar]
- 32.Paxinos G, Watson C. The rat brain in stereotaxic coordinates. Academic; New York: 1986. [DOI] [PubMed] [Google Scholar]
- 33.Prewitt CM-F, Herman JP. Hypothalamo-pituitary-adrenocortical regulation following lesions of the central nucleus of the amygdala. Stress. 1997;1:263–279. doi: 10.3109/10253899709013746. [DOI] [PubMed] [Google Scholar]
- 34.Raisman VR, Hirsch E, Javoy AF, Vassort C, Savasta M, Feuerstein C, Thibault J, Agid Y. Quantitative autoradiography of tyrosine hydroxylase immunoreactivity in the rat brain. J Neurochem. 1991;57:1212–1222. doi: 10.1111/j.1471-4159.1991.tb08282.x. [DOI] [PubMed] [Google Scholar]
- 35.Reul JM, deKloet ER. Two receptor systems for corticosterone in rat brain: microdistribution and differential occupation. Endocrinology. 1985;117:2505–2511. doi: 10.1210/endo-117-6-2505. [DOI] [PubMed] [Google Scholar]
- 36.Reul JM, Pearce PT, Funder JW, Krozowski ZS. Type I and type II corticosteroid receptor gene expression in the rat: effect of adrenalectomy and dexamethasone administration. Mol Endocrinol. 1989;3:1674–1680. doi: 10.1210/mend-3-10-1674. [DOI] [PubMed] [Google Scholar]
- 37.Rupprecht R, Arriza JL, Spengler D, Reul JM, Evans RM, Holsboer F, Damm K. Transactivation and synergistic properties of the mineralocorticoid receptor: relationship to the glucocorticoid receptor. Mol Endocrinol. 1993;7:597–603. doi: 10.1210/mend.7.4.8388999. [DOI] [PubMed] [Google Scholar]
- 38.Sapolsky RM, McEwen BS. Down-regulation of neural corticosterone receptors by corticosterone and dexamethasone. Brain Res. 1985;339:161–165. doi: 10.1016/0006-8993(85)90638-9. [DOI] [PubMed] [Google Scholar]
- 39.Sapolsky RM, Krey LC, McEwen BS. Stress down-regulates corticosterone receptors in a site-specific manner in the brain. Endocrinology. 1984;114:287–292. doi: 10.1210/endo-114-1-287. [DOI] [PubMed] [Google Scholar]
- 40.Sapolsky RM, Krey LC, McEwen BS. The neuroendocrinology of stress and aging: the glucocorticoid cascade hypothesis. Endocr Rev. 1986;7:284–301. doi: 10.1210/edrv-7-3-284. [DOI] [PubMed] [Google Scholar]
- 41.Semler DE, Chengelis CP, Radzialowski FM. The effects of chronic ingestion of spironolactone on serum thyrotropin and thyroid hormones in the male rat. Toxicol Appl Pharmacol. 1989;98:263–268. doi: 10.1016/0041-008x(89)90231-7. [DOI] [PubMed] [Google Scholar]
- 42.Sousa RJ, Tannery NH, Lafer EM. In situ hybridization mapping of glucocorticoid receptor messenger ribonucleic acid in rat brain. Mol Endocrinol. 1989;3:481–494. doi: 10.1210/mend-3-3-481. [DOI] [PubMed] [Google Scholar]
- 43.Spencer RL, Miller AH, Stein M, McEwen BS. Corticosterone regulation of type I and type II adrenal steroid receptors in brain, pituitary, and immune tissue. Brain Res. 1991;549:236–246. doi: 10.1016/0006-8993(91)90463-6. [DOI] [PubMed] [Google Scholar]
- 44.Spencer RL, Miller AH, Moday H, McEwen BS. Western blot analysis of cytoplasmic and nuclear type II corticosteroid receptor levels in rat brain. Soc Neurosci Abstr. 1994;20:938. [Google Scholar]
- 45.Stein-Behrens B, Elliott EM, Miller CA, Schilling JW, Newcombe R, Sapolsky RM. Glucocorticoids exacerbate kainic acid-induced extracellular accumulation of excitatory amino acids in the rat hippocampus. J Neurochem. 1992;58:1730–1735. doi: 10.1111/j.1471-4159.1992.tb10047.x. [DOI] [PubMed] [Google Scholar]
- 46.Tombaugh GC, Yang SH, Swanson RA, Sapolsky RM. Glucocorticoids exacerbate hypoxic and hypoglycemic hippocampal injury in vitro: biochemical correlates and a role for astrocytes. J Neurochem. 1992;59:137–146. doi: 10.1111/j.1471-4159.1992.tb08884.x. [DOI] [PubMed] [Google Scholar]
- 47.Tornello S, Orti E, DeNicola AF, Rainbow TC, McEwen BS. Regulation of glucocorticoid receptors in brain by corticosterone treatment of adrenalectomized rats. Neuroendocrinology. 1982;35:411–417. doi: 10.1159/000123429. [DOI] [PubMed] [Google Scholar]
- 48.Trapp T, Rupprecht R, Castern M, Reul JHM, Holsboer F. Heterodimerization between mineralocorticoid and glucocorticoid receptor: A new principle of glucocorticoid action in the CNS. Neuron. 1994;13:1457–1462. doi: 10.1016/0896-6273(94)90431-6. [DOI] [PubMed] [Google Scholar]
- 49.Whitfield HJ, Brady LS, Smith MA, Mamalaki E, Fox RJ, Herkenham M. Optimization of cRNA probe in situ hybridization methodology for localization of glucocorticoid receptor mRNA in rat brain: a detailed protocol. Cell Mol Neurobiol. 1990;10:145–157. doi: 10.1007/BF00733641. [DOI] [PMC free article] [PubMed] [Google Scholar]